Article

Assessment for the Social Sustainability and Equity under the Perspective of Accessibility to Jobs

by
Gabriella Vitorino Guimarães
1,2,
Tálita Floriano Santos
2,3,*,
Vicente Aprigliano Fernandes
4,
Jorge Eliécer Córdoba Maquilón
5 and
Marcelino Aurélio Vieira da Silva
2
1
Department of Production Engineering, Federal Rural University of Amazonia, PA 275, Km 13, Parauapebas 68515-000, Brazil
2
Transportation Engineering Program, Federal University of Rio de Janeiro, Av. Horácio Macedo 2030, Rio de Janeiro 21941-914, Brazil
3
Department of Production Engineering, Federal University of Piauí, Av. Universitária, Teresina 64049-550, Brazil
4
Instituto de Geografia, Pontificia Universidad Católica de Valparaíso, Av. Brasil 2241, Valparaíso 2362807, Chile
5
Department of Civil Engineering, Nacional University of Colombia, Medellin Calle 65 #78-28, Colombia
*
Author to whom correspondence should be addressed.
Sustainability 2020, 12(23), 10132; https://doi.org/10.3390/su122310132
Submission received: 13 October 2020 / Revised: 30 November 2020 / Accepted: 2 December 2020 / Published: 4 December 2020
(This article belongs to the Section Sustainable Transportation)

Abstract

:
Social sustainability is a dimension of the concept of sustainability that has gained importance only in the last few decades and can be identified as the pursuit and measure of social equity. Equity can be analyzed under two approaches: horizontal and vertical. The horizontal approach considers the distribution of benefits equally, while the vertical equity considers these same benefits, but between specific groups, which is an adequate approach when dealing with policy-related topics, such as tariff subsidy. Accessibility is a factor that contributes to urban social sustainability and it may be a representation of physical and/or social barriers in the urban environment. Thus, this paper aims to assess social sustainability under a vertical equity approach, based on accessibility to jobs, for different population groups, comparing public with individual motorized transport. The case study was carried out in Medellín-Colombia, using data from the 2017 Home Destination Survey. It was found that users of individual transport have access to a greater number of jobs than users of public transport. In addition, those with higher income have better accessibility than those with lower income, even though they are not beneficiaries of tariff subsidy policies. Another highlight is that areas closer to the central region are also more accessible. In some specific communes, it would be indicated to seek to improve access through public transport, or the implementation of some public policy at the municipal level that could have an impact on access to opportunities.

1. Introduction

Social sustainability seeks to meet the social goals that can promote sustainable development, which can be challenging in the context of significant poverty and inequality [1,2]. According to Dempsey et al. [1], accessibility is mainly affected by physical factors and it is a contributory factor for urban social sustainability (for example to employment, which is commonly used at city or district scale analysis). For them, in the urban context, social sustainability can be identified as the pursuit of social equity (with emphasis on policy concerns).
The Hierarchical structure of the social sustainability dimension has three aspects, under the transport perspective (importance rating): accessibility, services for community and use of the bus as transport systems. For example, if the people have better accessibility to urban bus transport, the city will improve its social sustainability [3].
Sustainable mobility refers to a combination of active transport modes (walk and cycle) and public transport, which can reduce the necessity to use private transport, challenging the car culture in urban areas. However, the promotion of non-motorized and public transportation is strongly related to the availability of transport infrastructure that could maintain an adequate travel time and level of service (e.g., from home to work) for all social classes [4]. This urban pre-condition could promote social inclusion in the transport system, offering an alternative for everybody, under a spatial justice perspective. Possibly, urban inequality, regarding the spatial distribution of adequate transport infrastructure, can be a determinant for sociospatial distribution, impacting not only the transport mode of choice of high and low-income citizens, but also on the place of residence of them.
Urban planning is becoming a key challenge for ever changing cities, in terms of social, environmental and economic conditions. Sustainable transport is growing in importance, because of the transport paradigm faced by cities of Latin America. This paradigm refers to the relationship between travelled distance and costs, in the context of vulnerable families living in further away, dependent on transport modes with higher costs, while families with better socioeconomic conditions can afford living near to the Central Business District of the city, and benefit from reduced costs of transport.
Therefore, it is important to understand the relationship between modification or implementation of transport projects and socioeconomic conditions. In this direction, there are several studies that evaluated transportation projects in terms of fare policies (including fare subsidies), and operation and infrastructure from the standpoint of social equity of cities [5,6,7,8,9,10]. The planning stage of a public transportation system should consider social vulnerability, including the aspect of equity, to seek to reduce social exclusion [11]. On the other hand, one should also question policies that intend to promote sustainability, identifying whether the actions being taken are causing greater inequality between individuals [12]. Thus, the planning can affect the access of the people to opportunities, for example healthcare, education, employment, economic activity [13].
This is one of the reasons for which promotion of sustainable transportation has been growing in importance for urban planners, in addition to the positive impact that this can bring regarding the overall urban development [14]. Currently, it is commonly seen that the achievement of acceptable levels of sustainable transport is strongly related to a spatial justice in terms of equity of accessibility to important activities and services of the city. Therefore, any public investment that comes to improve urban and transport conditions can be beneficial for cities [15]. For this reason, promoting social equity through transportation policies is, at the same time, important and challenging for urban and transport planners particularly, considering the complex socioeconomic context of developing countries.
Studies have demonstrated that the enactment of public policies to grant fare subsidies to low-income groups improves accessibility to opportunities, and thus enhances social equity [5,9,10,16,17]. These works have focused on the mobility provided by public transportation. However, the increased possession of individual motorized vehicles (cars and motorcycles) brings consequences to cities, especially environmental problems (exhaust emissions), traffic congestion and alarming accident rates [18]. Regarding this issue, in the literature review carried out, it was found that few studies consider the individual motorized transport mode [7,17]. Since the definition of accessibility proposed by Hansen [19] as the “potential of opportunities for interaction”, the concept has been used with adaptation from the original conception to specific situations [10,20,21,22,23,24]. Recent years have brought a growing number of papers analyzing transportation systems and their effects, mainly involving the concept of accessibility related to land use and prices, and the effect of investments in urban transportation on spatial and social inequalities [10,17,22,25,26,27]. However, the analysis of social equity related to fare subsidies has been little explored, especially in Latin America, where public transportation has a very strong social character due to the large social inequality that plagues the region.
“Equity refers to the fairness and justice of the distribution of the impacts (benefits and costs) of an action on two or more units” [28]. Equity can be analyzed through two approaches: horizontal and vertical. The horizontal approach considers the distribution of benefits equally, thus, analyzing how the entire population benefits from public transportation [5,11,29]. However, one problem is that it does not consider the existing social inequalities based on specific conditions people are faced with, thus the vertical equity is an alternative for this aspect [11]. Vertical equity analyzes these same benefits, but between specific groups, considering their specific needs [29]. This can be enlightening because the disadvantage in accessibility may be less acceptable for some individuals, groups of people or regions [11]. In addition to impacts and costs, according to income or social class [30], vertical equity seeks to compensate for social inequalities in general [5,30].
To measure the equity effect of certain transport systems or policies, there are different methodologies. Regarding this matter, the Lorenz Curve and the Gini Index are widely applied [5,6,7,8,17,31]; statistical methods are also used, such as multiple linear regression [17,32,33] and t-test [9,34], and the Theil index [28]. Other authors have determined their own equity index [9,24]. The Gini coefficient allows the identification of inequality [35]. The combination of Lorenz Curve and Gini coefficient is one of the tools for measuring inequity [35,36]. In the Latin American context, where location and income are commonly related, the use of the Gini index is adequate because it allows one to understand the variation of accessibility levels across places in a city, also considering socioeconomic attributes [10].
Recent years have been marked by a growing number of studies in Colombia analyzing transportation systems and their effects, mainly investigating the concept of accessibility, relating it to land use and fares, and the effects of recent investments in urban transport on spatial and social inequalities [17,22,25,26,27,37]. However, these studies have mainly focused on the capital, Bogotá, and the city of Cali. About Medellin, there are, for example, other works [29,30] analyzing the improved access of users of the Metrocable system, but without measuring social equity, and Matsuyuki et al. [38] examined the effect of Metrocable on the socio-economic and spatial scope in a specific community of Medellin.
In this context, the objective of this study is to analyze the social sustainability, considering the accessibility to jobs, and its effect on vertical equity, for workers belonging to two population groups, comparing public transport with individual motorized transport, with an application in Medellin city. The vertical equity in this study is an adequate approach, because the analysis of policy-related issues, such as transport tariff subsidy, involves the understanding of the impact of a policy, by comparing those that are and are not beneficiaries of it. Social sustainability will be represented by the equity index, being determined through the Gini Index and the Lorenz Curve, based on the selected opportunity accessibility indicator, and contemplating the time and cost of travel as restrictions on accessibility (impedance factors). We used the Gini Index and the Lorenz Curve to understand the phenomenon which we are evaluating.
The comparison between modes of transportation has the objective of identifying if equitable access to employment differs from population groups and/or transportation modes. By comparing the modes of transportation, this methodology may contribute with the transport planning of the city, through the identification of locations with deficient access to public transportation services. Another contribution of this paper regards the analysis of the tariff policy or tariff subsidy, because it is directly related to accessibility to opportunities and vertical equity, and their impact on social sustainability.
The case study will be performed in the city of Medellín (Colombia), using data from the 2017 Home Destination Survey, Alcadía Municipal and the National Department of Statistics (DANE). The analyzed context considers a subsidy policy (transportation financial assistance), which is directed to formal workers with a monthly income of up to two minimum salaries. Thus, the population groups were divided into possible beneficiaries and non-beneficiaries of transportation tariff subsidies. Here, the concept of “real” accessibility applied by Bocarejo and Oviedo was adopted [22], in which the data analyzed refers to actual trips (declared research), provided by the Household Origin-Destination Survey. In the case of this study, the emphasis is on work trips.
At the end of the study, this paper seeks to answer three questions: (i) Is there a discrepancy in the level of accessibility to jobs between population groups, and consequently in the equity of the transport system in Medellin?; (ii) Based on the vertical equity approach, is there equity between modes of public and individual motorized transport in terms of time and cost of travel (impedance factors) in Medellin?; and (iii) Does the present transport system of Medellin contribute to the local social sustainability?
The article is organized into six sections besides the introduction. The second section contains a brief literature review, encompassing subsidies issues, equity and accessibility. The third section describes the methodology and how the data is treated. The fourth presents the case study. The fifth presents the analysis and discussion of the results of the case study. The last presents final considerations, limitations and recommendations, based on this study.

2. Literature Review

The vertical equity approach is adequate when analyzing the impact of transportation policies on the accessibility of different income groups [5,7,8,10,17,22,23,32,39,40]. However, Farber et al. [41] emphasized that policies aimed to promote equity have a potential conflict with those seeking to increase the number of discretionary passengers (and reduce pollutant emissions from cars). Examples of the application of horizontal equity include the work of Shirmohammadli et al. [7] that studied the distribution of modes of transportation among 17 traffic zones, and Nahamias-Biran et al. [40], with a study that analyzed the impacts caused by the change in tariffs on different groups of the population. However, one problem is that it does not consider the existing social inequalities, thus the vertical equity is an alternative for this aspect [11].
In the area of transport, when working based on accessibility measures, it is common to evaluate how individuals reach their destinations and opportunities, mainly in a determined time interval and/or travel cost range, with special focus on low-income groups [9,10,32,39,41]. Defining the relevance of transport policies and their impacts on accessibility is an important step towards urban transport research. Arguably, the next step is to identify the distribution of accessibility between different social groups and geographic areas [8].
According to Stanley et al. [42], a brief definition of the concept of accessibility is “the ability to get to activities or opportunities, such as work, education, playing sport, visiting friends, etc.”. Accessibility is a matter normally considered in urban planning and transport policies that can be used as an important criterion to evaluate public transportation systems [37]. In determining the level of accessibility, it is possible to assess horizontal or vertical equity in terms of transport systems, especially in the poorest neighborhoods.
However, the factors of the societal and political logic of movements in the geographical space must be analyzed when studying mobility, in order to avoid the geography of flows being considered in isolation, in addition to considering only real and past displacements [43]. This understanding is fundamental for the “motility” concept proposed by Kaufmann et al. [43], that “can be defined as the capacity of entities (e.g., goods, information or persons) to be mobile in social and geographic space”. Moreover, this concept aims to relate the elements access, competence and appropriation with social, cultural and political processes [43].
One of the ways to improve accessibility is through fare subsidies to use public transport. Providing fare subsidies is a policy used in many cities around the world. One of the arguments for their implementation is the benefit of redistributing income to less favored groups, seeking to achieve balance between the needs for economic and social sustainability [10,44]. The main impact is the reduction regarding the portion of the household’s income spent on transportation. On the other hand, for certain groups of users, subsidies may act as an incentive to use public transport [39,45].
Deebosere and El-Geneidy [9] analyzed the jobs available to low-income people and their accessibility in three Canadian cities, and concluded that the average level of accessibility seemed to be related to the city’s size and the number of jobs, i.e., the larger the city and the greater the number of jobs offered, the higher accessibility would be. Carneiro et al. [46] found that in the city of Rio de Janeiro, Brazil, the administrative regions farther from the downtown area had lower accessibility to jobs, due to the high concentration of jobs in the central region. In Rio de Janeiro, a large portion of the low-income population lives in outlying areas where housing costs are lower.
Santos et al. [28] have incorporated three alternative measures of equity with the intention of maximizing accessibility on the road network (design model): accessibility to low accessibility centers, the dispersion of accessibility values across all centers (Gini coefficient), and the dispersion of accessibility values across all centers and across centers in the same region (Theil index).
Like the Gini coefficient, the Theil index has a range from 0 to 1. The closer the measure is to 0, the more equitable the condition [13,28,47]. Several authors use both equity measures, Gini coefficient and Theil index, to calculate the equity of various systems, such as health [35,48]. The Theil index has been applied to calculate the health workforce distribution [47], taxi services [36], inequality of compulsory education [49], and disabled population [48].
Some authors consider that the Theil index has advantage over the Gini coefficient because it can explore the sub-groups relative to each other, which the Gini does not offer [28,36,48]. The Theil index can be applied to calculate both horizontal and vertical equity [28]. However, both have different purposes, for example, with the Gini coefficient is possible to identify inequality, and the Theil index allows one to identify the determinants of inequality [35].
Lucas et al. [8] used the Lorenz curve and Gini index associated with a cluster index and buffer index, relating them to the population percentage in categories and cumulative accessibility in three Dutch cities. The Gini index indicated lower equality in smaller cities than in larger ones, since in larger cities households were found to have better access to daily services. In a case study of the city of Bogota, Colombia, Guzman and Oviedo [10] used the Lorenz curve, but instead of the Gini index applied the “Palma” ratio, a more recent metric. It allowed differentiating distributions that can be unjust and unequal from others that can be equal but not equitable.

3. Methodology and Data

The proposed methodology is composed of four steps, which are described in the following subsection. It is relevant to highlight that the key elements of this methodology are: accessibility, which is often present in the urban transport literature [10,21,22,39,50,51,52]; and social sustainability, based on the Gini index and Lorenz curve and the works on equity using the Gini index and Lorenz curve [5,6,7,8,17,31].
After collecting and organizing data and defining the groups for analysis, the accessibility indicator is calculated, showing results on the number of jobs accessed between the zones in each period or travel cost. Then, the Lorenz Curve and Gini Index (equity measure) are generated. These steps aim to support the main objective of this study, which is to analyze the social sustainability of the current transport system for the different population groups, and its effect on vertical equity, comparing them by mode of transportation (public and individual-motorized transportation).

3.1. Accessibility Indicator

According to Grengs [23], the focus of studies on travel to work stems largely from peak traffic congestion, a problem the population understands as a major public policy concern. This is important because this type of travel is essential for most people. Many transportation scholars measure accessibility to jobs, considering attractiveness as the total number of jobs in a destination zone [10,46,53,54,55,56,57,58].
The indicator selected for this article is adapted from that employed by [9,39,50], which involves access to work, given by the following equation:
A i =   j = 1 n O j f ( C i j )
f ( C i j ) =   { 1   i f   C i j t   0   i f   C i j >   t
where A i is the accessibility of zone i to all jobs in zone j; O j is the number of jobs in zone j; f ( C i j ) is the weighting function, with C i j being the impedance factor (time or cost to travel from i to j); and t is the travel time or cost, which is a discrete value, determined though the expanded O-D Matrix, where time is expressed in minutes and costs in Colombian currency.
Through the level of accessibility, especially in socially disadvantaged neighborhoods, there is a basis for assessing horizontal or vertical equity resulting from the benefits of transportation [39].

3.2. Equity Measure

Although the Gini index is directed to analyze income distribution, many studies adopted it to analyze the distribution of public transit resources [59]. Moreover, it also can be applied “to any quantity that can be cumulated across a population” [12].
The Lorenz curve is a visual representation of equity, while the Gini index is a simple mathematical metric denoting the degree of inequality [5]. The Gini index [60] for the purposes here can be calculated by the following equation:
G α = 1   k = 1 n ( X k X k 1 ) , ( Y k + Y k 1 )
where X k is the cumulative proportion of the population variable, for k = 0, …, n, with X 0 = 0, X n = 1; and Y k is the cumulative proportion of the public transport service variable, for k = 0, …, n, with Y 0 = 0, Y n = 1. The k refers to the zones (districts) in analysis.
A convex Lorenz curve, meaning a high Gini index, implies an unequal distribution [17]. When there is no difference between the curve and the perfect equity line, the index value is zero, representing perfect equality, while a value of 1 denotes perfect inequality [6]. The Lorenz curve and Gini index are metrics commonly used in articles involving the transportation area [5,6,7,8,17,29].

3.3. Collection and Treatment of the Data

Previously to data processing, impedance factors were determined: “travel cost” and/or “travel time”. Both are often used in studies dealing with accessibility to employment [10,22,46,50]. The choice of which to use should consider the socioeconomic characteristics of the study area, besides the availability of data.
Another relevant factor is the level of aggregation of the study area. Many studies consider a low level of aggregation, such as the “Zonal Urban Planning”-UPZ of Bogotá [10,17,29], census sector [9,39], and census collection district (CCD) [5]. For this study, we have considered a higher level of aggregation due to the availability of data and information extracted from the website of the local government (Alcadía of Medellín and DANE), which are necessary to interpret the results (16 zones). This is similar to that adopted by Shirmohammadli et al. [7] who worked with 17 traffic zones (districts).

3.4. Household Origin-Destination Survey

The Origin-Destination Survey is the main source of information for this type of work. In this study, we used the 2017 survey of the Aburrá Valley Metropolitan Area, which obtained 101,624 responses. Specifically, in the municipality of Medellín, 51,894 responses were obtained. The expanded origin-destination matrix for Medellín in 2017 considered those who declared their income, reaching a total of 961,051 trips, including those originating in the urban zone (16 districts-called “comunas”) and with a destination in the urban or rural zone (16 districts and 5 townships). However, a specific selection was made in order to filter trips for work reasons (only the one-way stretch), since this article works with accessibility to jobs, which resulted in a total of 504,206 daily trips.
Regarding the transport modes separately, for public transport, the entire distance traveled on foot before and/or after the motorized trip was considered, while for individual transport we considered walking up to four blocks beforehand and/or afterward. Then, an expanded matrix for each of the groups analyzed was generated. This decision can be considered as a limitation, because it affects the measurement of the real accessibility level to jobs. Nevertheless, a long walk to access individual motorized transport does not match the travel time that is normally spent in this mode. On the other hand, by considering the entire walk before using public transport, it is possible to point out areas where boarding points are not evenly distributed or where there is a need to implement new ones.
For individual trips, those made on foot or by bicycle were not considered, because the focus was on motorized transport (public and private). Nonetheless, it is known that the third element (cognitive appropriation) of the motility concept, by Flamm and Kaufmann [61], is the most difficult to understand. In general, the choice of transport mode is consequence of a simplified vision of an individual’s world, which is based on the usefulness of the selected mode for one’s activity/routine and/or it can be a matter of ‘principle’.

4. Case Study

4.1. Characterization of the Study Area

Medellín is located in the Aburrá Valley, and is the second-largest city in Colombia, besides being the capital of the department of Antioquia. The reference year for the information and data is 2017, when the most recent Household Origin-Destination Survey was conducted. The city has undergone a broad urban revitalization program carried out by the municipal government in recent decades, making it more just and inclusive, especially regarding access to culture and transport (a cable car system-Metrocable and bus rapid transit (BRT) system-Tranvía) [62].
Demographically, the municipality is divided into 16 districts (comunas) forming the urban zone–Arranjuez, Bellen, Buenos Aires, Castilla, Doce de Octubre, El Poblado, Guayabal, La America, La Candelária, Laureles-Estadio, Manrique, Popular, Robledo, San Javier, Santa Cruz and Villa Hermosa–and five townships (corregimientos) forming the rural zone–Altavista, San Antonio de Prado, San Cristobal, San Sebastian de Pal Prado and Santa Elena–with 249 urban neighborhoods and 20 institutional areas, according to information taken from the website of Alcaldía de Medellín (2019).
The population of Medellín in 2017 was estimated at 2,509,452 inhabitants. A total of 1,100,509 people held jobs in the urban area, divided into formal and informal. In 2015, the unemployment rate was 9.98% and the occupation rate was 56.88%, according to data from Large Integrated Household Survey (GEIH) by National Administrative Department of Statistics (DANE) of Colombia. Table 1 shows the unemployment rate by district. The numbering contained in Table 1 indicates the number of each district, following the local organization.
In 2017, adopting the exchange rate of 20 November 2020 (1 US$ = 3434.73 Colombian Pesos), the minimum monthly wage was US$ 214.53 ($737,717 Colombian pesos), and the monthly transportation support stipend was US$ 24.78 ($83,140 Colombian pesos). The information was determined by the Colombian Government (2016), in Decree 2209 and Decree 2210, respectively. In Medellín, 602,787 residents were registered in 2017 to receive the fare subsidy according to information taken from the website of Alcaldía de Medellín (2019). The city’s Secretariat of Mobility is divided into three sub-secretariats (traffic safety and control; technical; and legal).
Collective public transportation is provided by bus, subway, Tranvía de Ayacucho (LRT), Metroplús (BRT) and Metrocable (cable car). There is also a public bicycle loan service, called EnCicla. The fare integration occurs through use of a debit card called “tarjeta cívica”, but there is no fare unification, because the cost is variable depending on the transport modes used. Fares on conventional buses are paid only in cash, while those integrated with the subway system have electronic ticketing.

4.2. Population Groups

The trips were subdivided into four groups: (1) income group 1 by public transport; (2) income group 1 by individual transport; (3) income group 2 by public transport; and (4) income group 2 by individual transport. The impedance factors were “travel time” and “travel cost”, with verification of the variations between the income groups by transport mode, based on application of a specific accessibility indicator, and then the equity measure, both defined in the methodology.
Therefore, two income groups were analyzed: income group 1–income up to 2 times the minimum monthly wage (up to US$ 429.06); and income group 2–income greater than 2 times the minimum monthly wage (more than US$ 429.06), both broken down into those using public and individual transport. The trips were considered according to the 2017 Household Origin-Destination Survey only for commuting to work of the respondents who declared their monthly income. The monthly income was reported in the questionnaire in intervals with stratification as shown in Table 2. We consider that users belonging to the same income group have the same socioeconomic characteristics.
The reason for dividing the population into these two income groups was because it is the criterion adopted to supply fare subsidies in Colombia. Formal workers in the public and private sectors earning up to twice the minimum monthly wage are entitled to additional remuneration to cover commuting expenses. Therefore, the comparison used here is between workers that are possible beneficiaries (income group 1), because informal jobs were also counted, as were non-beneficiaries of the fare subsidy program (income group 2).

4.3. Accessibility Indicator and Equity Measure

The accessibility indicator and equity metric were applied to the population groups indicated previously. Of the 336 possible relations in the 16 × 21 matrix (16 districts × 16 districts and five townships), there were 272 records, showing that there were no trips between some zone pairs. This behavior influenced the dispersion of trips between zones, as can be noted from applying the indicators of accessibility to opportunities and the equity index. Table 3 shows the percentage of jobs accessed for each trip time established, and the number of existing relations, broken down by group.
There was no accounting of jobs that could be achieved at a specific time or cost where there was no travel record. We made this decision in order to quantify the accessibility, and later vertical equity, of the current situation, according to the responses recorded in the Destination Origin Survey. Thus, transportation planners will be able to determine an order of priority for interventions in the transportation system.
According to El-Geneidy et al. [39], studies that use the measure of accessibility to cumulative opportunities adopt the time limit of 45 or 60 min. However, for this paper a greater variation of time was adopted: 20, 30, 40, 60, and 90 min. The average times were extracted from the expanded matrix of the Destination Origin survey, that is, they were not determined based on the centroid of each zone, but from a declared survey. This indicates that even though there is a strong aggregation in the results, the data considered for the treatment and application of the accessibility indicator were disaggregated. In relation to travel costs by public transportation, we extracted the amounts from the service providers. For each answer, we assigned the cost according to the mode of transportation contained in the answer, and then expanded the matrix. For trips by individual transportation, only the cost of gasoline (1 L for every 10 km traveled) was considered, the distance of which we determined using the Google API tool.
There is greater dispersion of trips of workers belonging to income group 1 (eligible to receive the fare subsidy), showing that jobs for workers of income group 2 are more concentrated in certain districts. For the rural zone, there are 37 types of trips for income group 1 and 13 for income group 2. Workers of income group 2 travel more often via individual transport than public transport, while those in income group 1 more often use public transport. The access to jobs and Gini index were calculated for each of the four groups defined in this case study and are shown in Figure 1 and Figure 2.

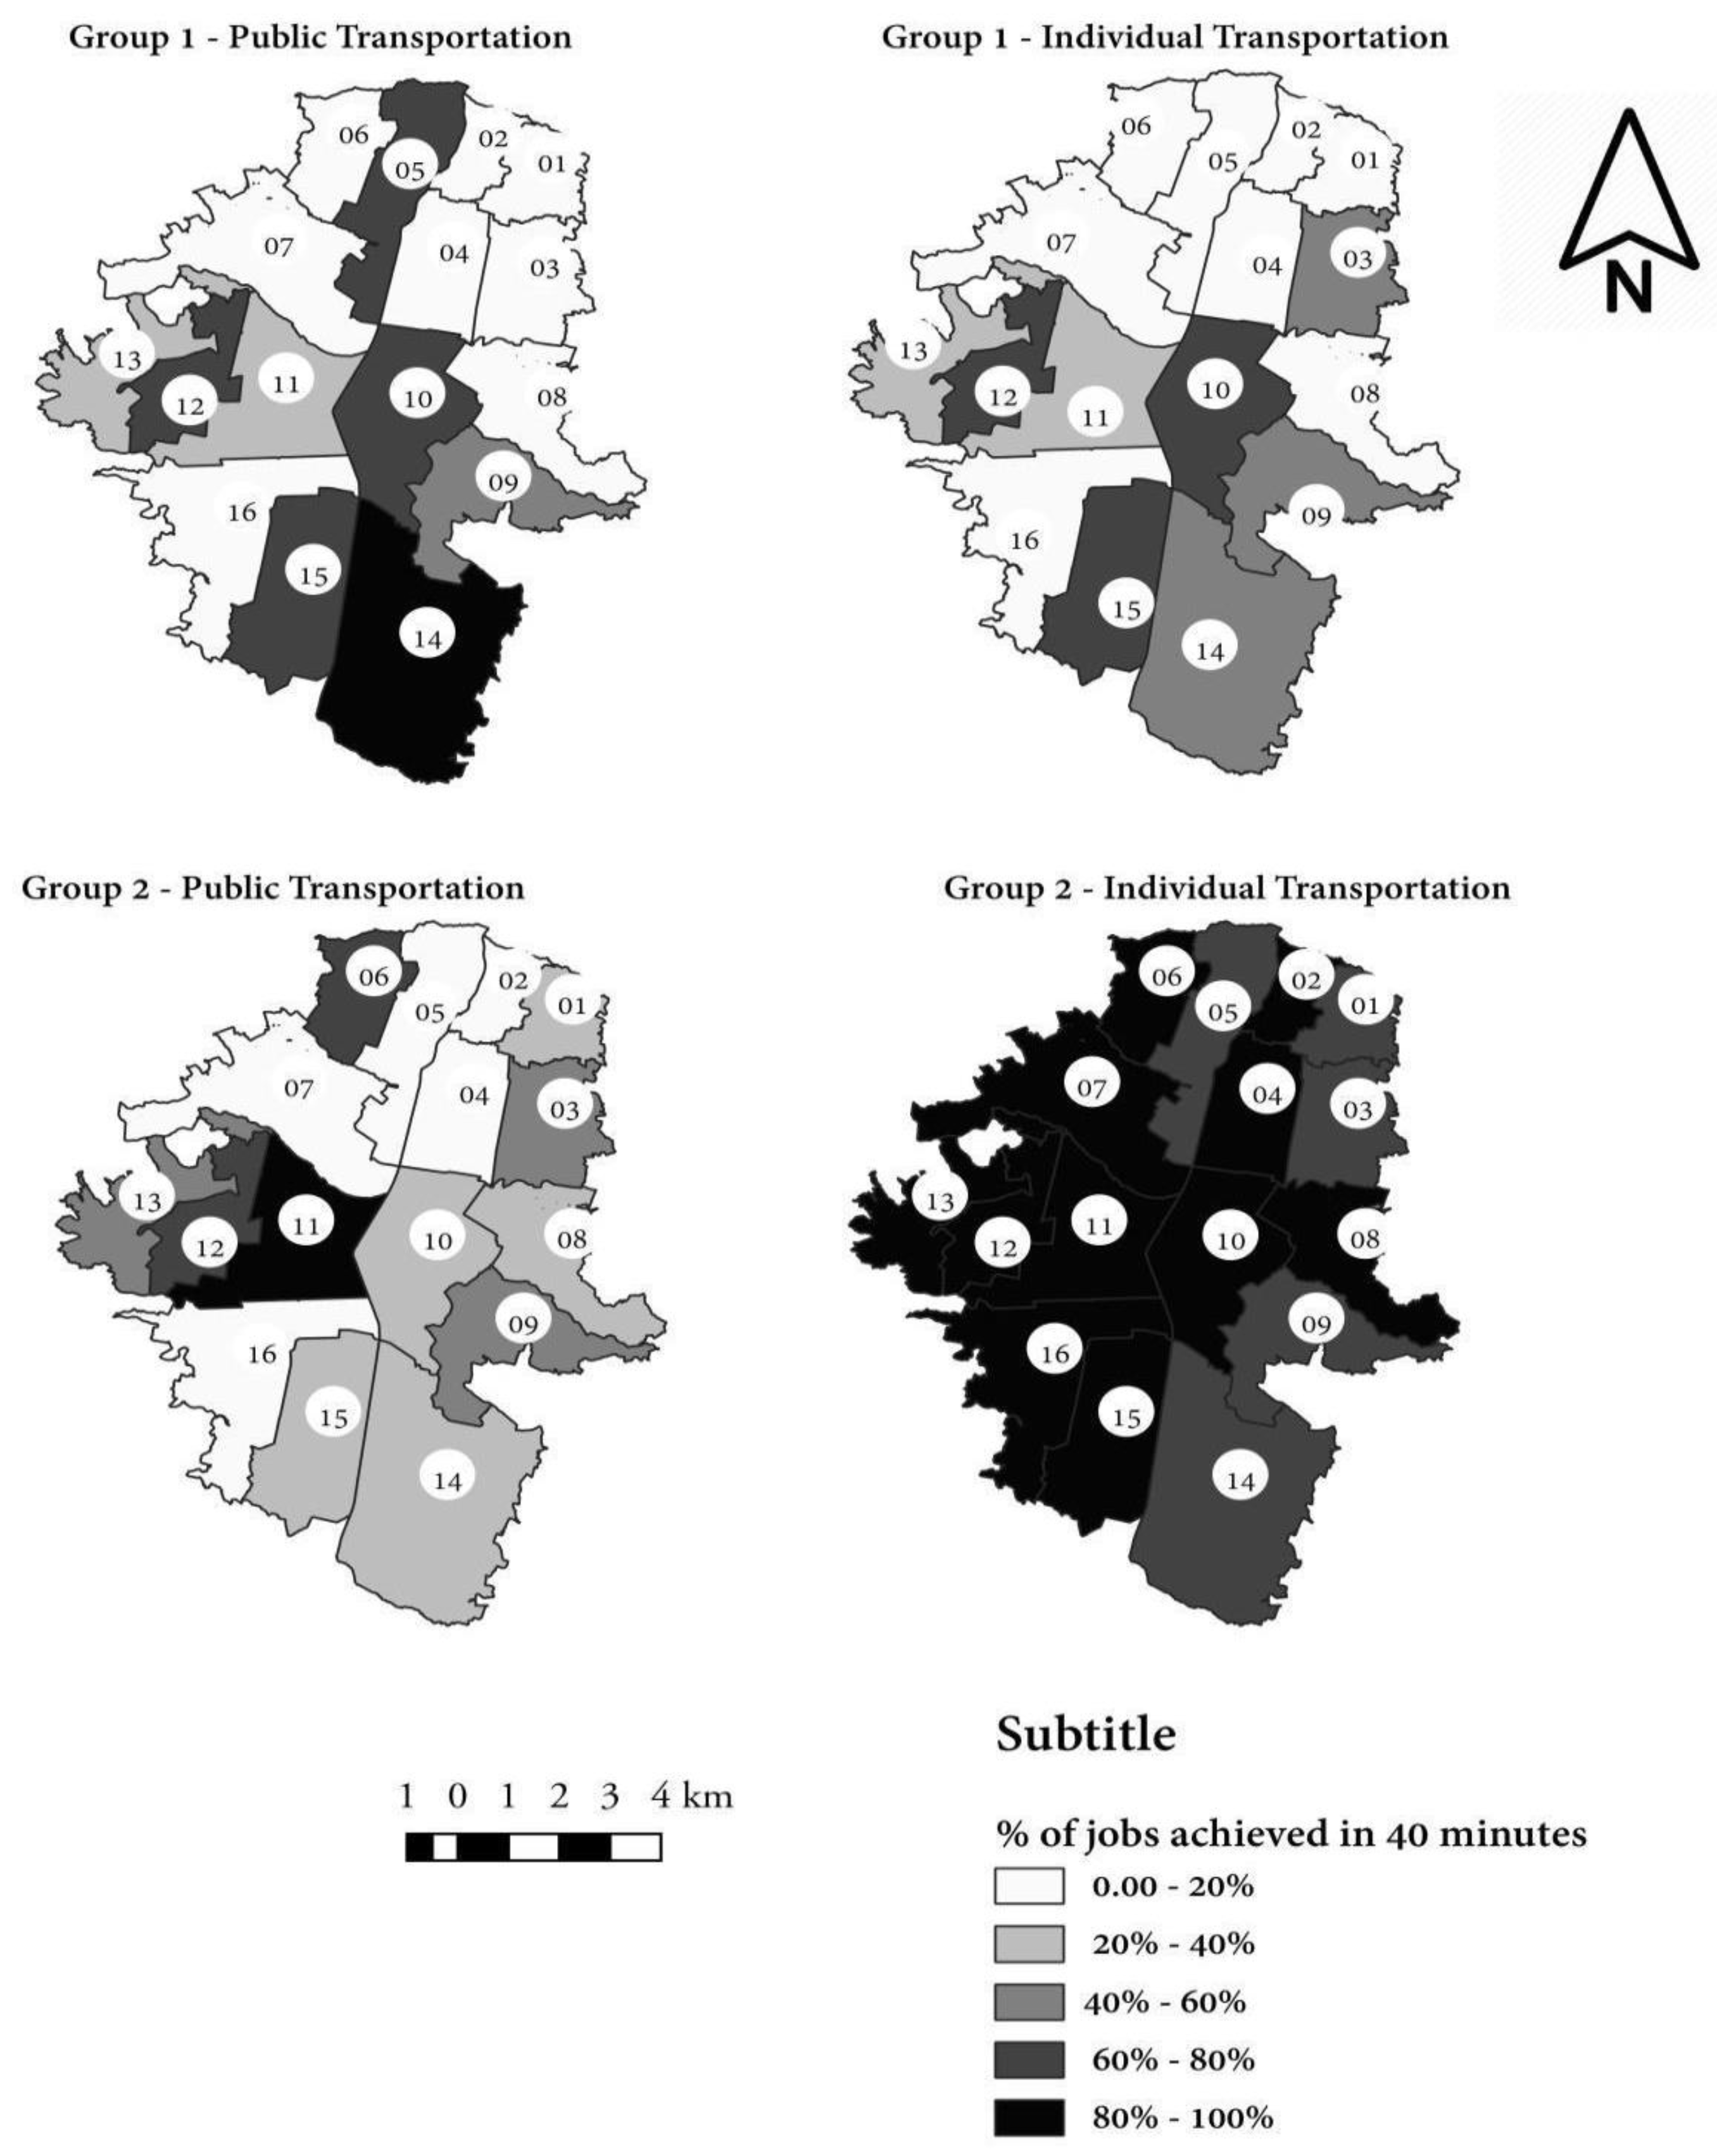
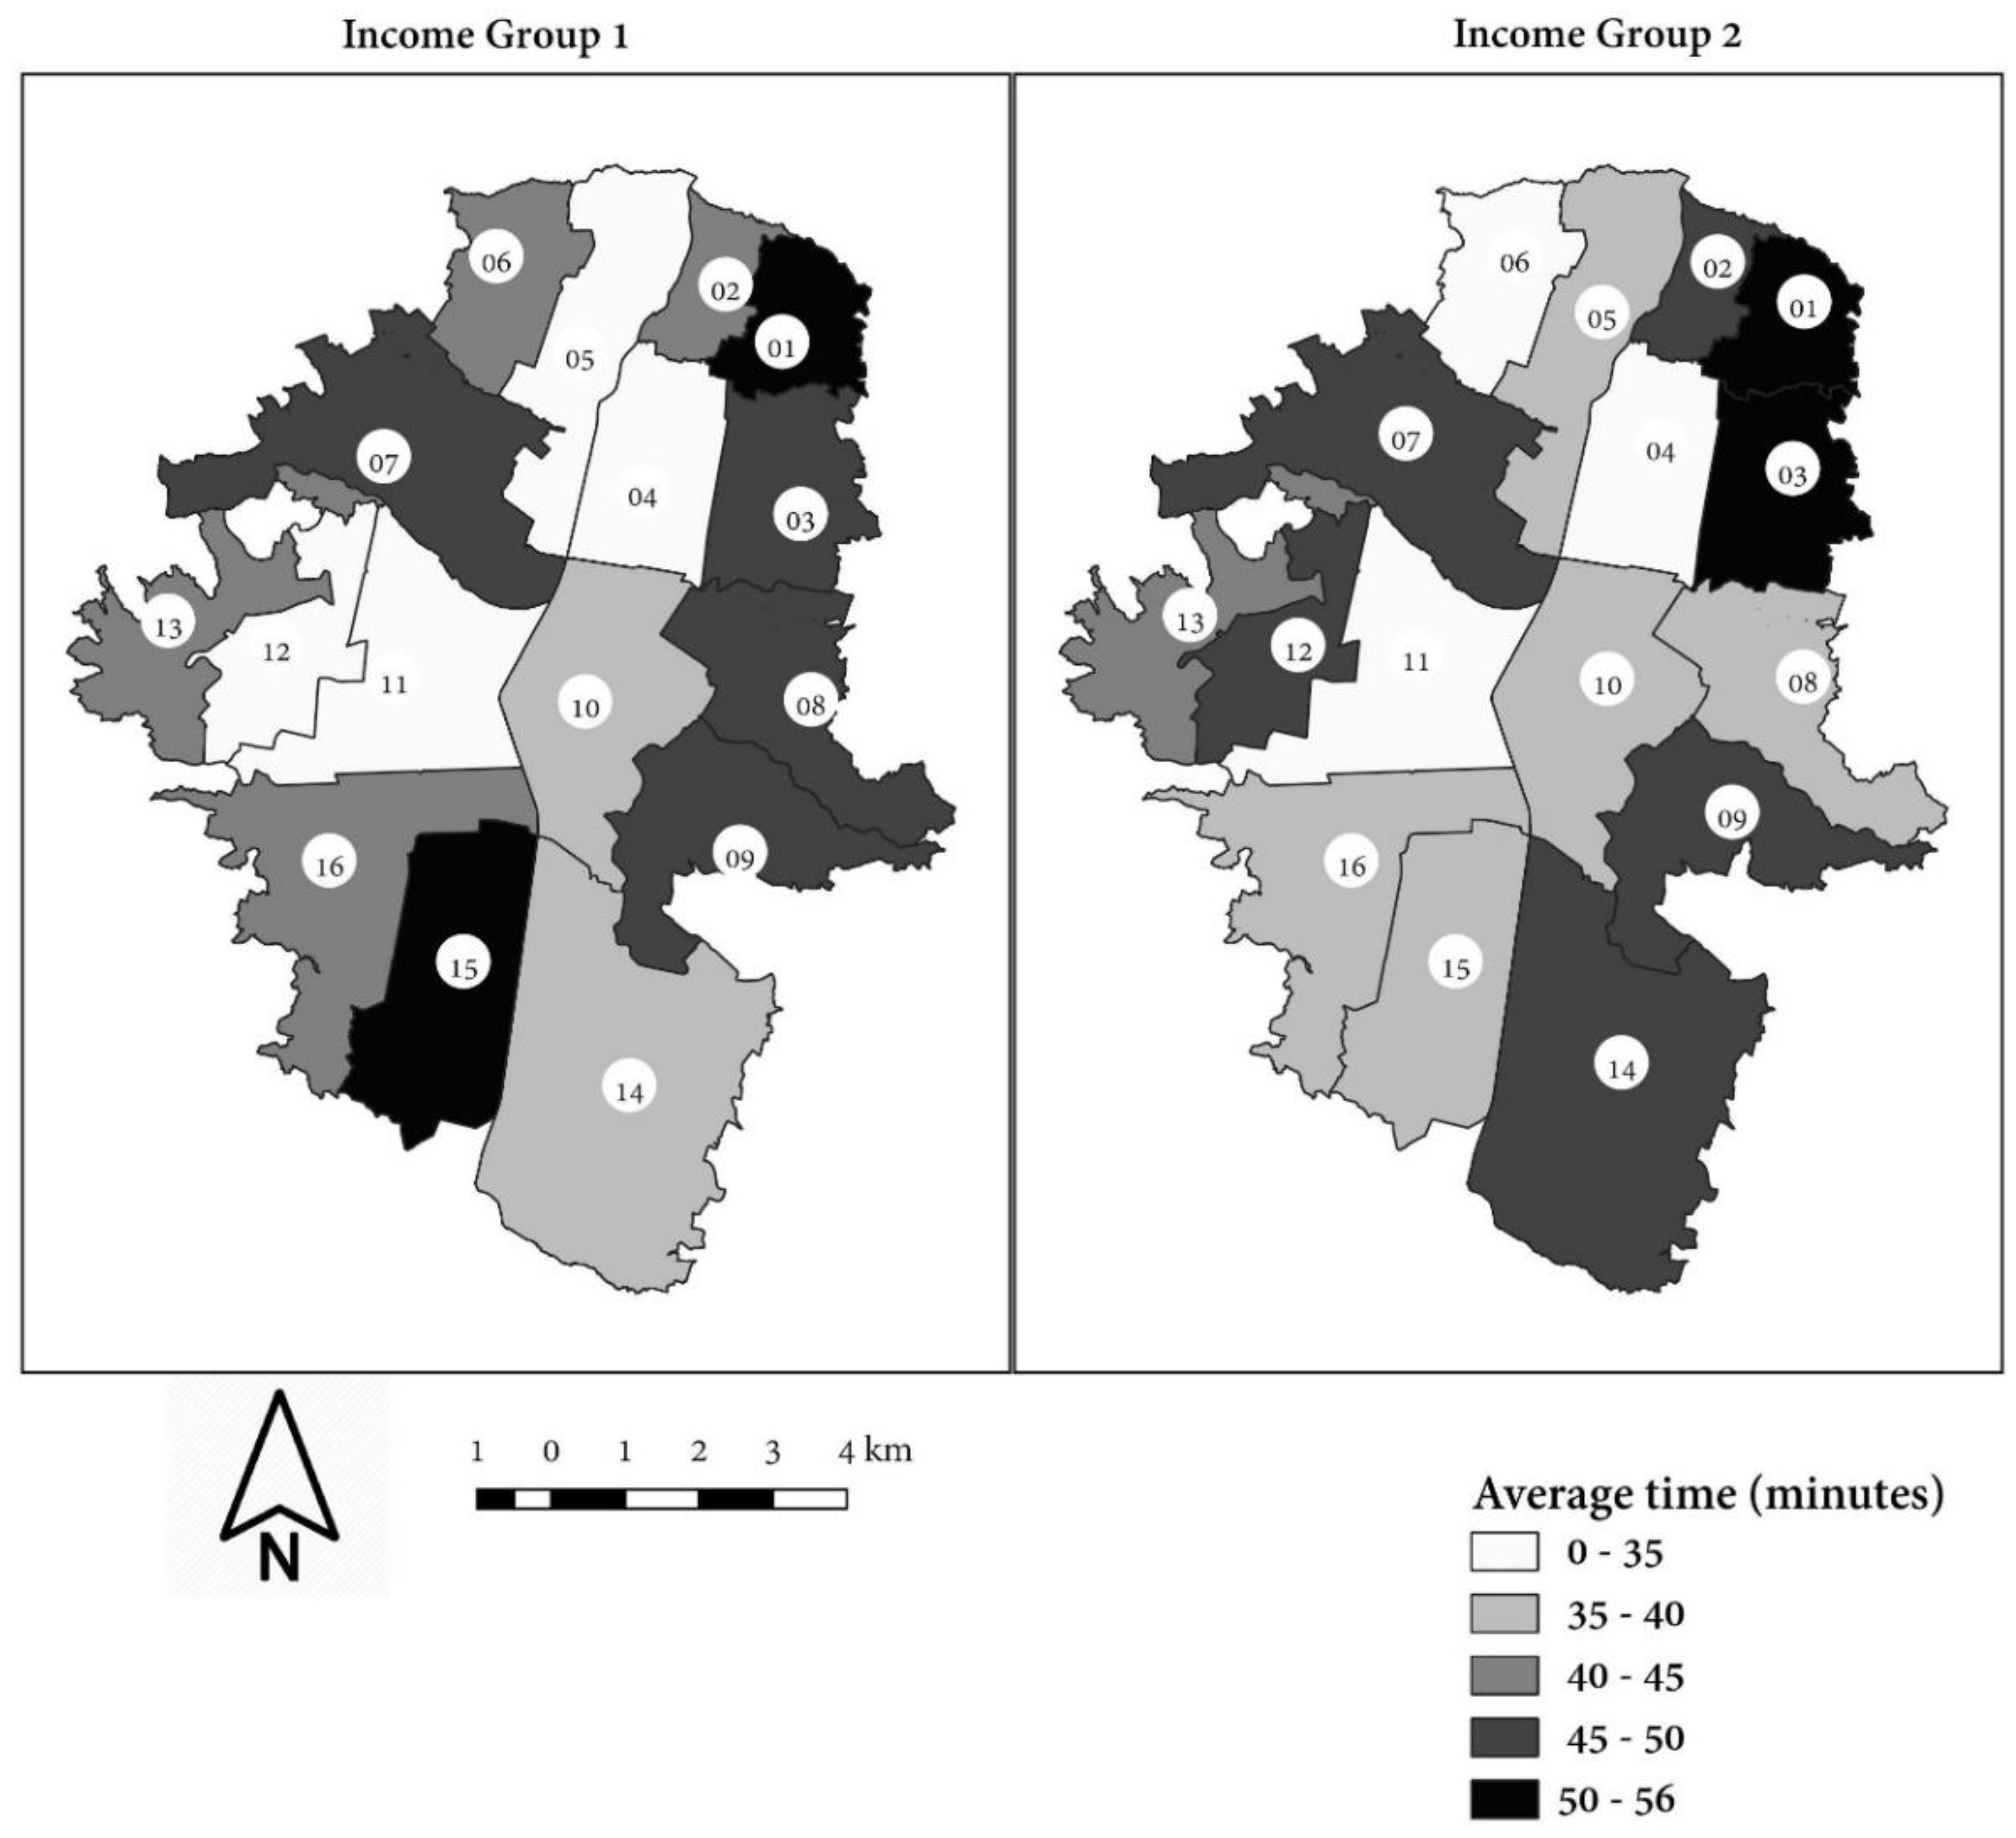
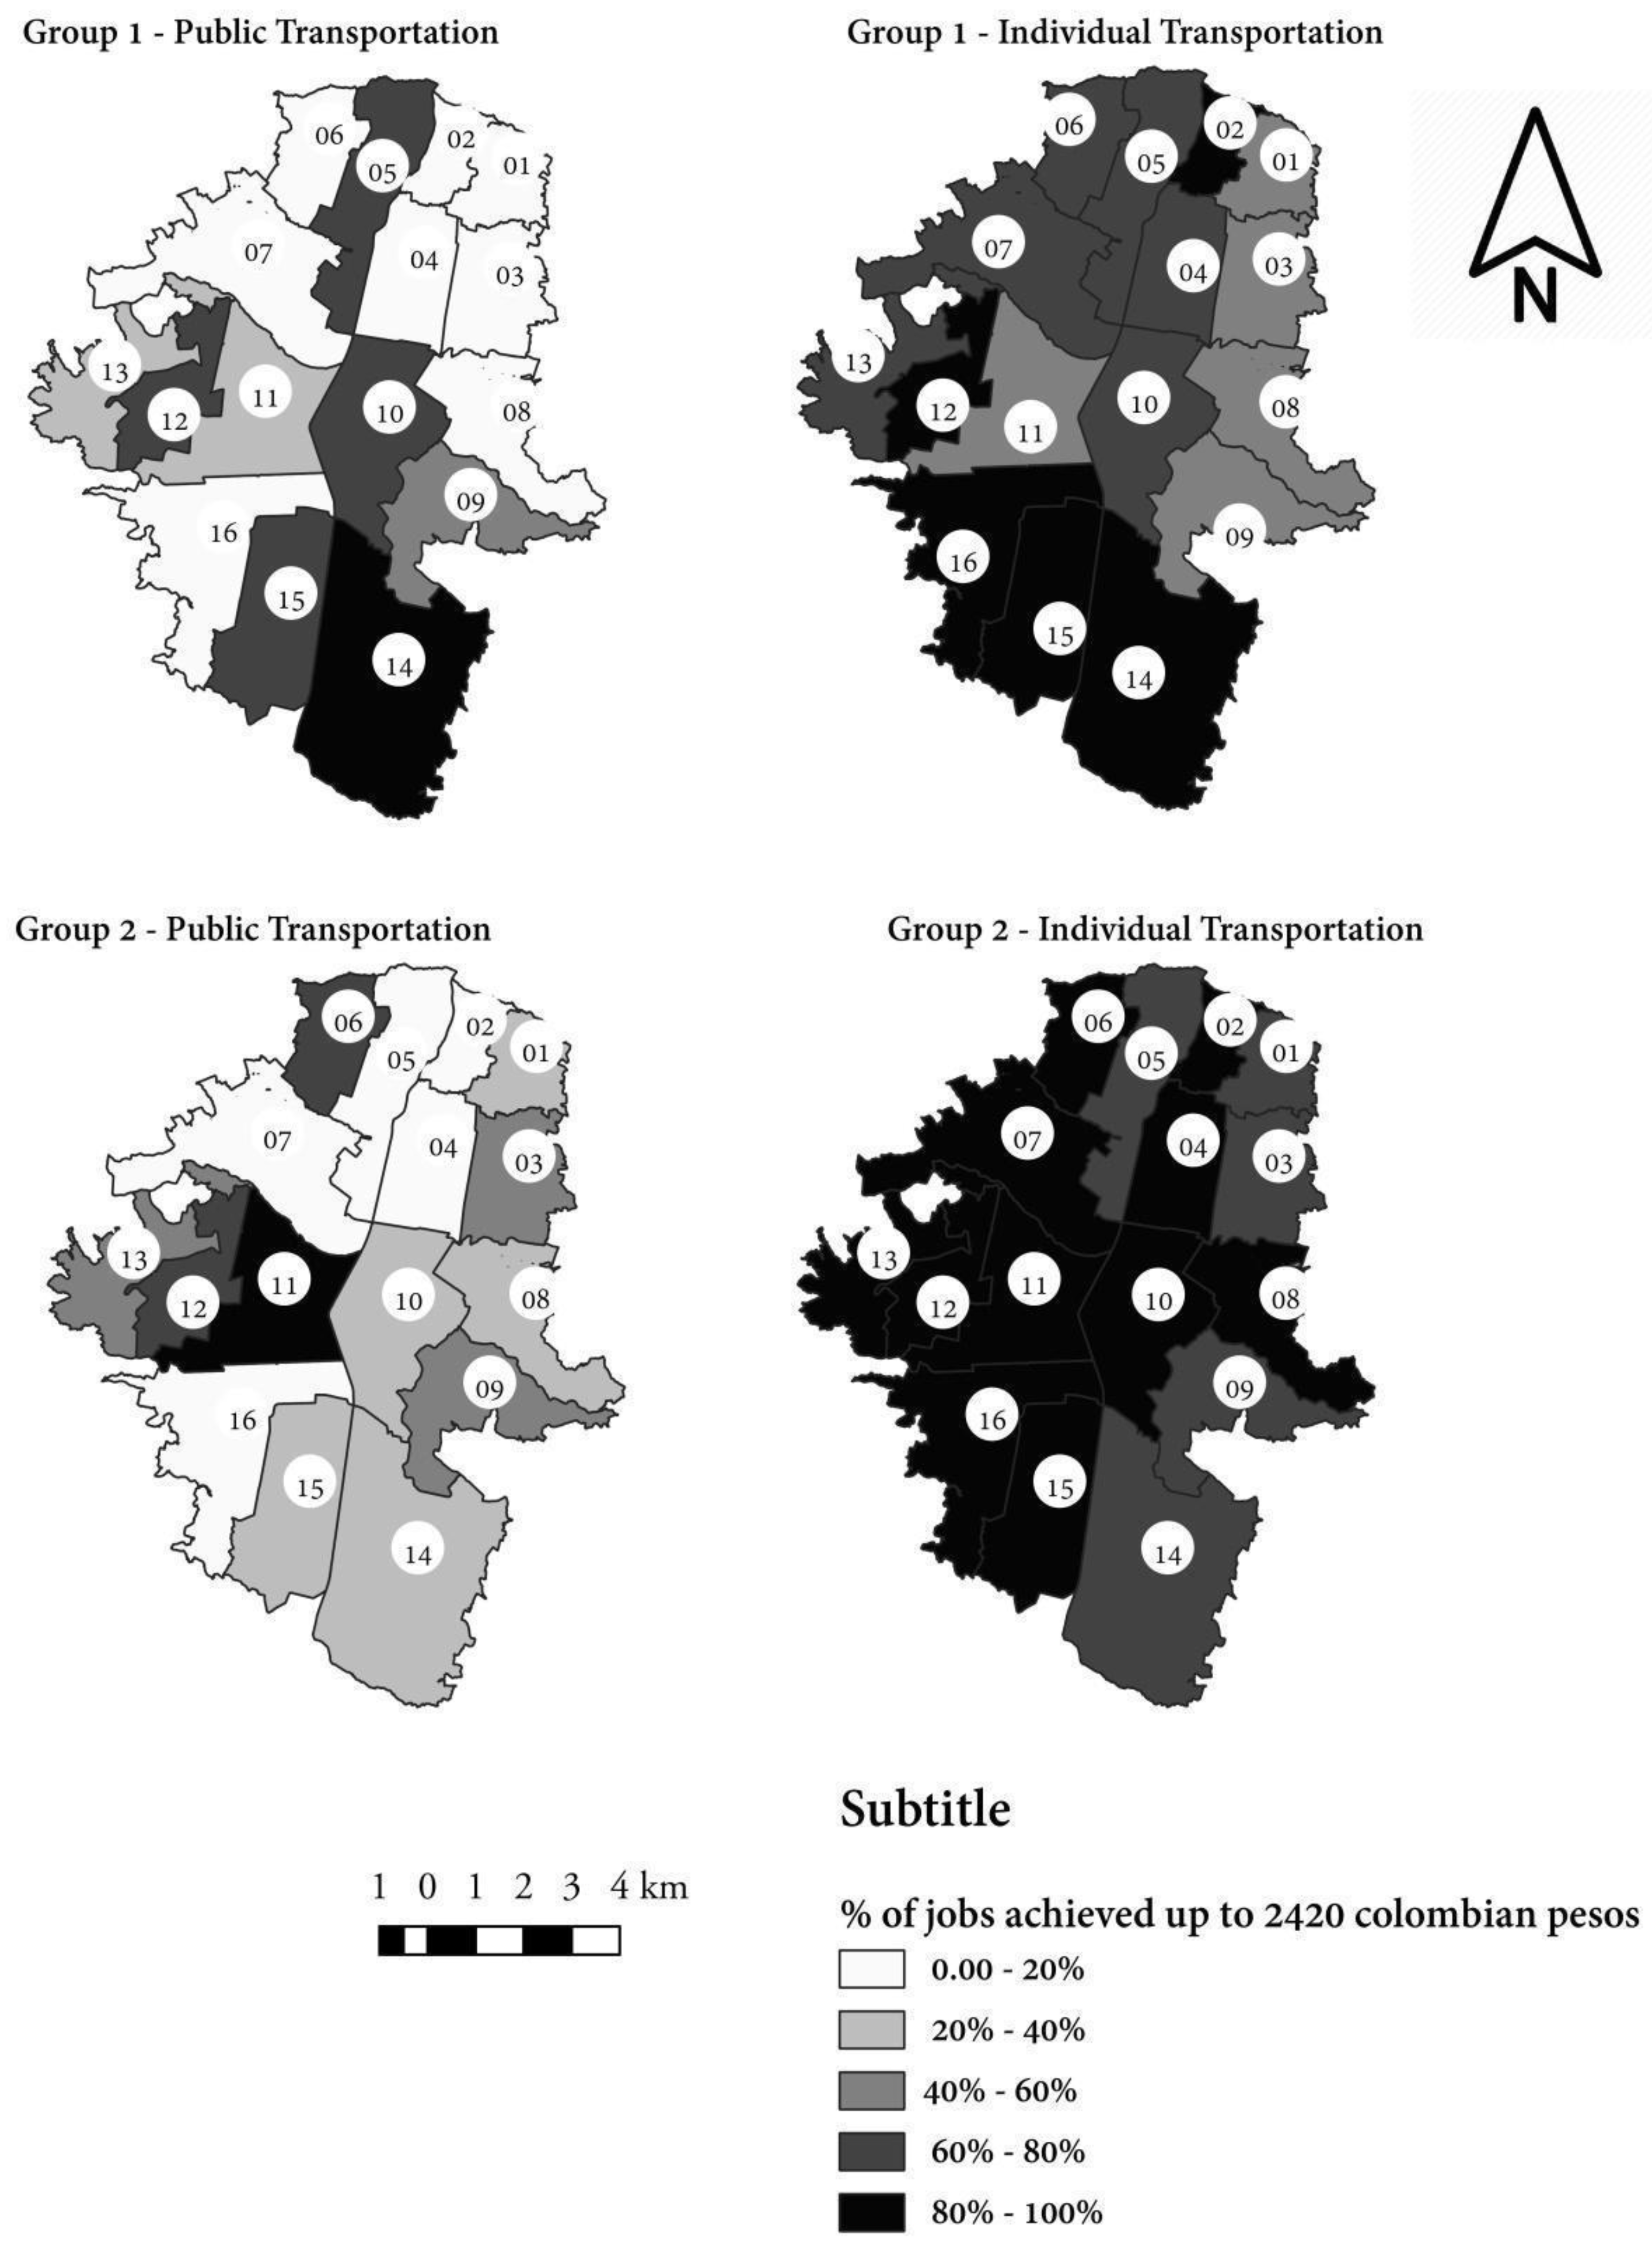
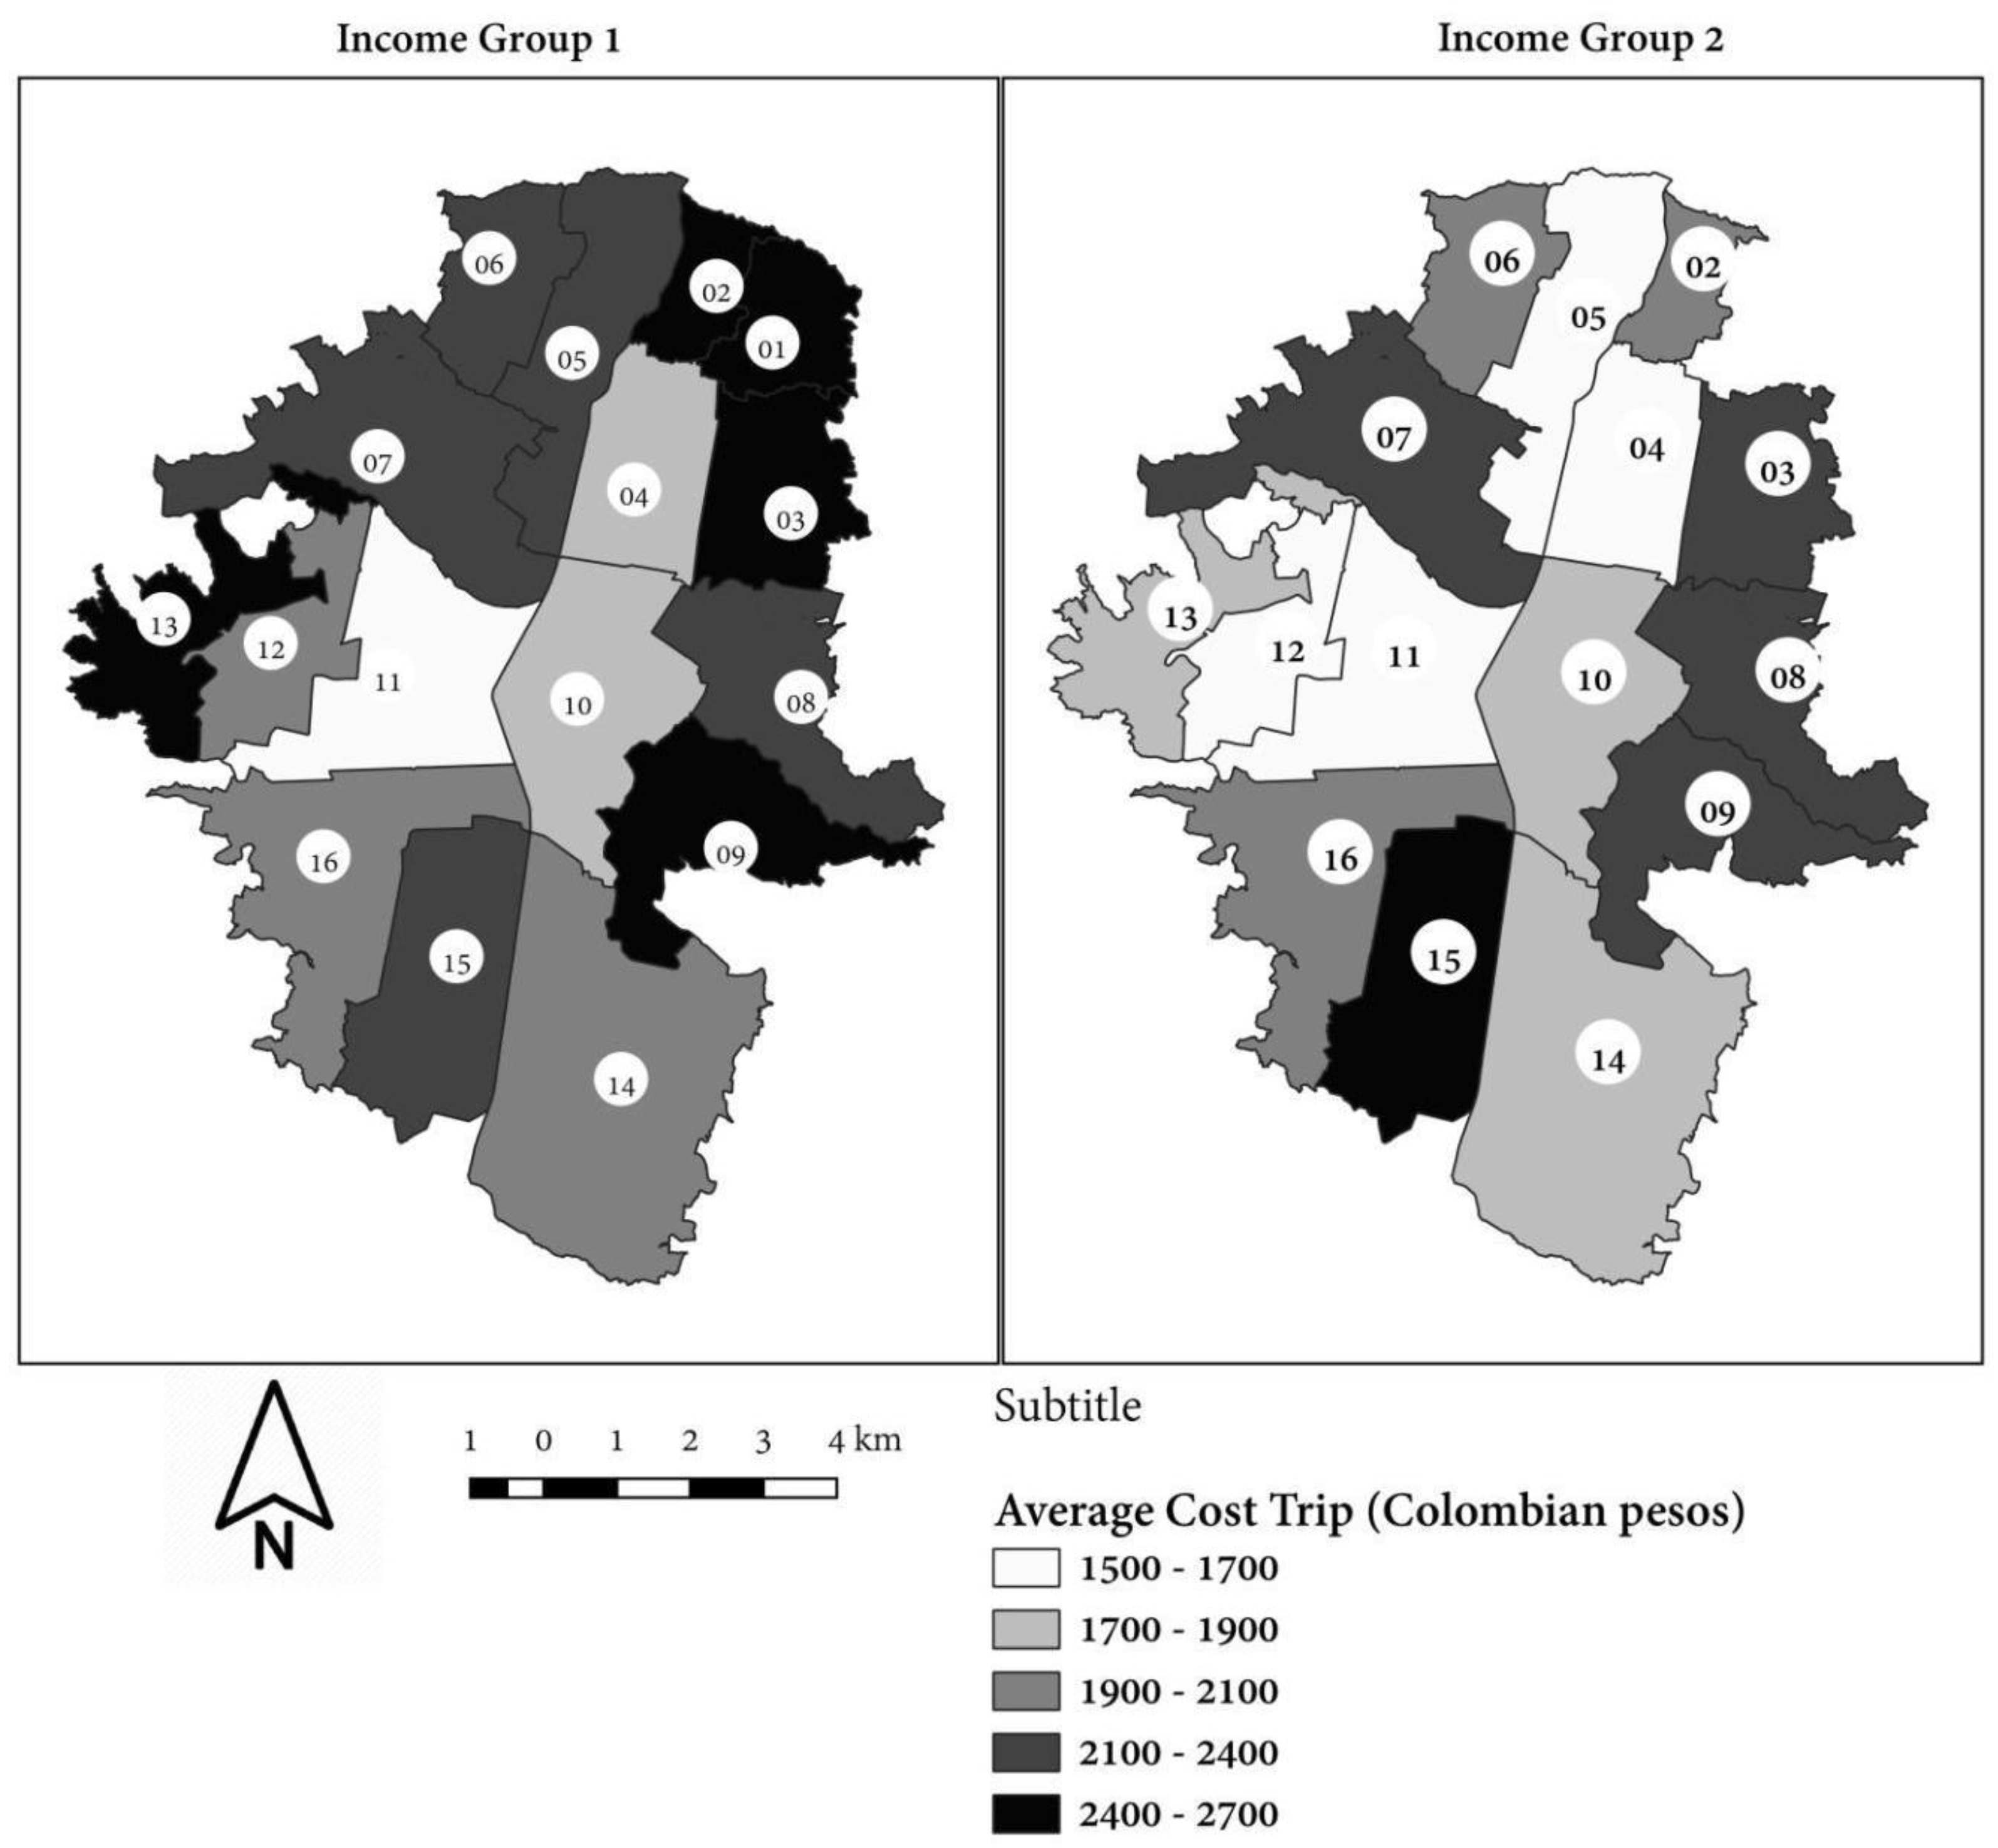
4.4. Income Group 1–Public Transport

With travel times of 20 and 30 min, the percentages of jobs accessed are 4.21% and 7.68%, respectively, and there is significant growth only with the time of 60 min, rising to 81.07%. The average travel time is 53 min. The Gini index value for time of 20 min is near 1 (0.834), which denotes nearly perfect inequality. The value is almost zero for the time of 60 min, in which the majority of individuals manage to reach their workplaces. In relation to the travel cost, starting at 2420 Colombian pesos, more than half of jobs are accessed (70.22%).

4.5. Income Group 1–Individual Transport

There is a difference in access to work between the individuals who use public transport and private transport. In the second case, 22.86% of jobs can be accessed in 20 min. For this group, the Gini index is 0.276 for trips lasting 30 min. The average travel time is 30 min. With the lowest local fare (2000 Colombian pesos), 76.32% of jobs can be accessed.

4.6. Income Group 2–Public Transport

The access to jobs within 40 min is 34.87%, which rises to 83.87% for 60 min, denoting the group with the smallest number of trips. The average travel time is 51 min. The Gini index values for times of 20 and 30 min are 0.769 and 0.612, respectively, and 0.425 for 40 min. Considering travel cost, with a fare of 2000 Colombian pesos, only 20.34% of jobs are accessed, a figure that rises to 76.36% when the fare is 2420 Colombian pesos.

4.7. Income Group 2–Individual Transport

This group can access 18.56% of jobs within 20 min, and 62.12% in 30 min. This is reflected in the difference between the Gini index values, which decline from 0.545 to 0.177. The result indicates that workers with this profile do not commute to jobs very close to their residence, but do travel a reasonable distance, being able to access 87.39% of jobs within 40 min. The average travel time is 33 min. With respect to travel cost, 77.67% of jobs can be reached by paying a fare of 2000 Colombian pesos, a figure close to that of income group 1.
The results are discussed in the next section.

5. Discussion of Results

The results generated by the case study should be analyzed under the aspect of accessibility to employment, varying in relation to each population group (income groups 1 and 2), by mode of transport, in relation to the impedance factors, time and cost of travel and, finally, assessing the social sustainability by the measure of equity (Gini index). In order to define other evaluation criteria, the socioeconomic aspects of the locality and of the collective public transport system must be observed.
These results show the social role performed by transportation in people’s daily lives, in particular of low-income people. The calculation of the real accessibility provides a diagnosis of the trips made daily, quantifying the number of jobs that the residents of different zones can reach [22] in a determined travel time. Besides the values generated, this consideration is supported by the information and data on the characterization of the case study and the responses to the Household Origin-Destination Survey. With this data and information, it is possible to generate the local vertical equity index, which will determine social sustainability.

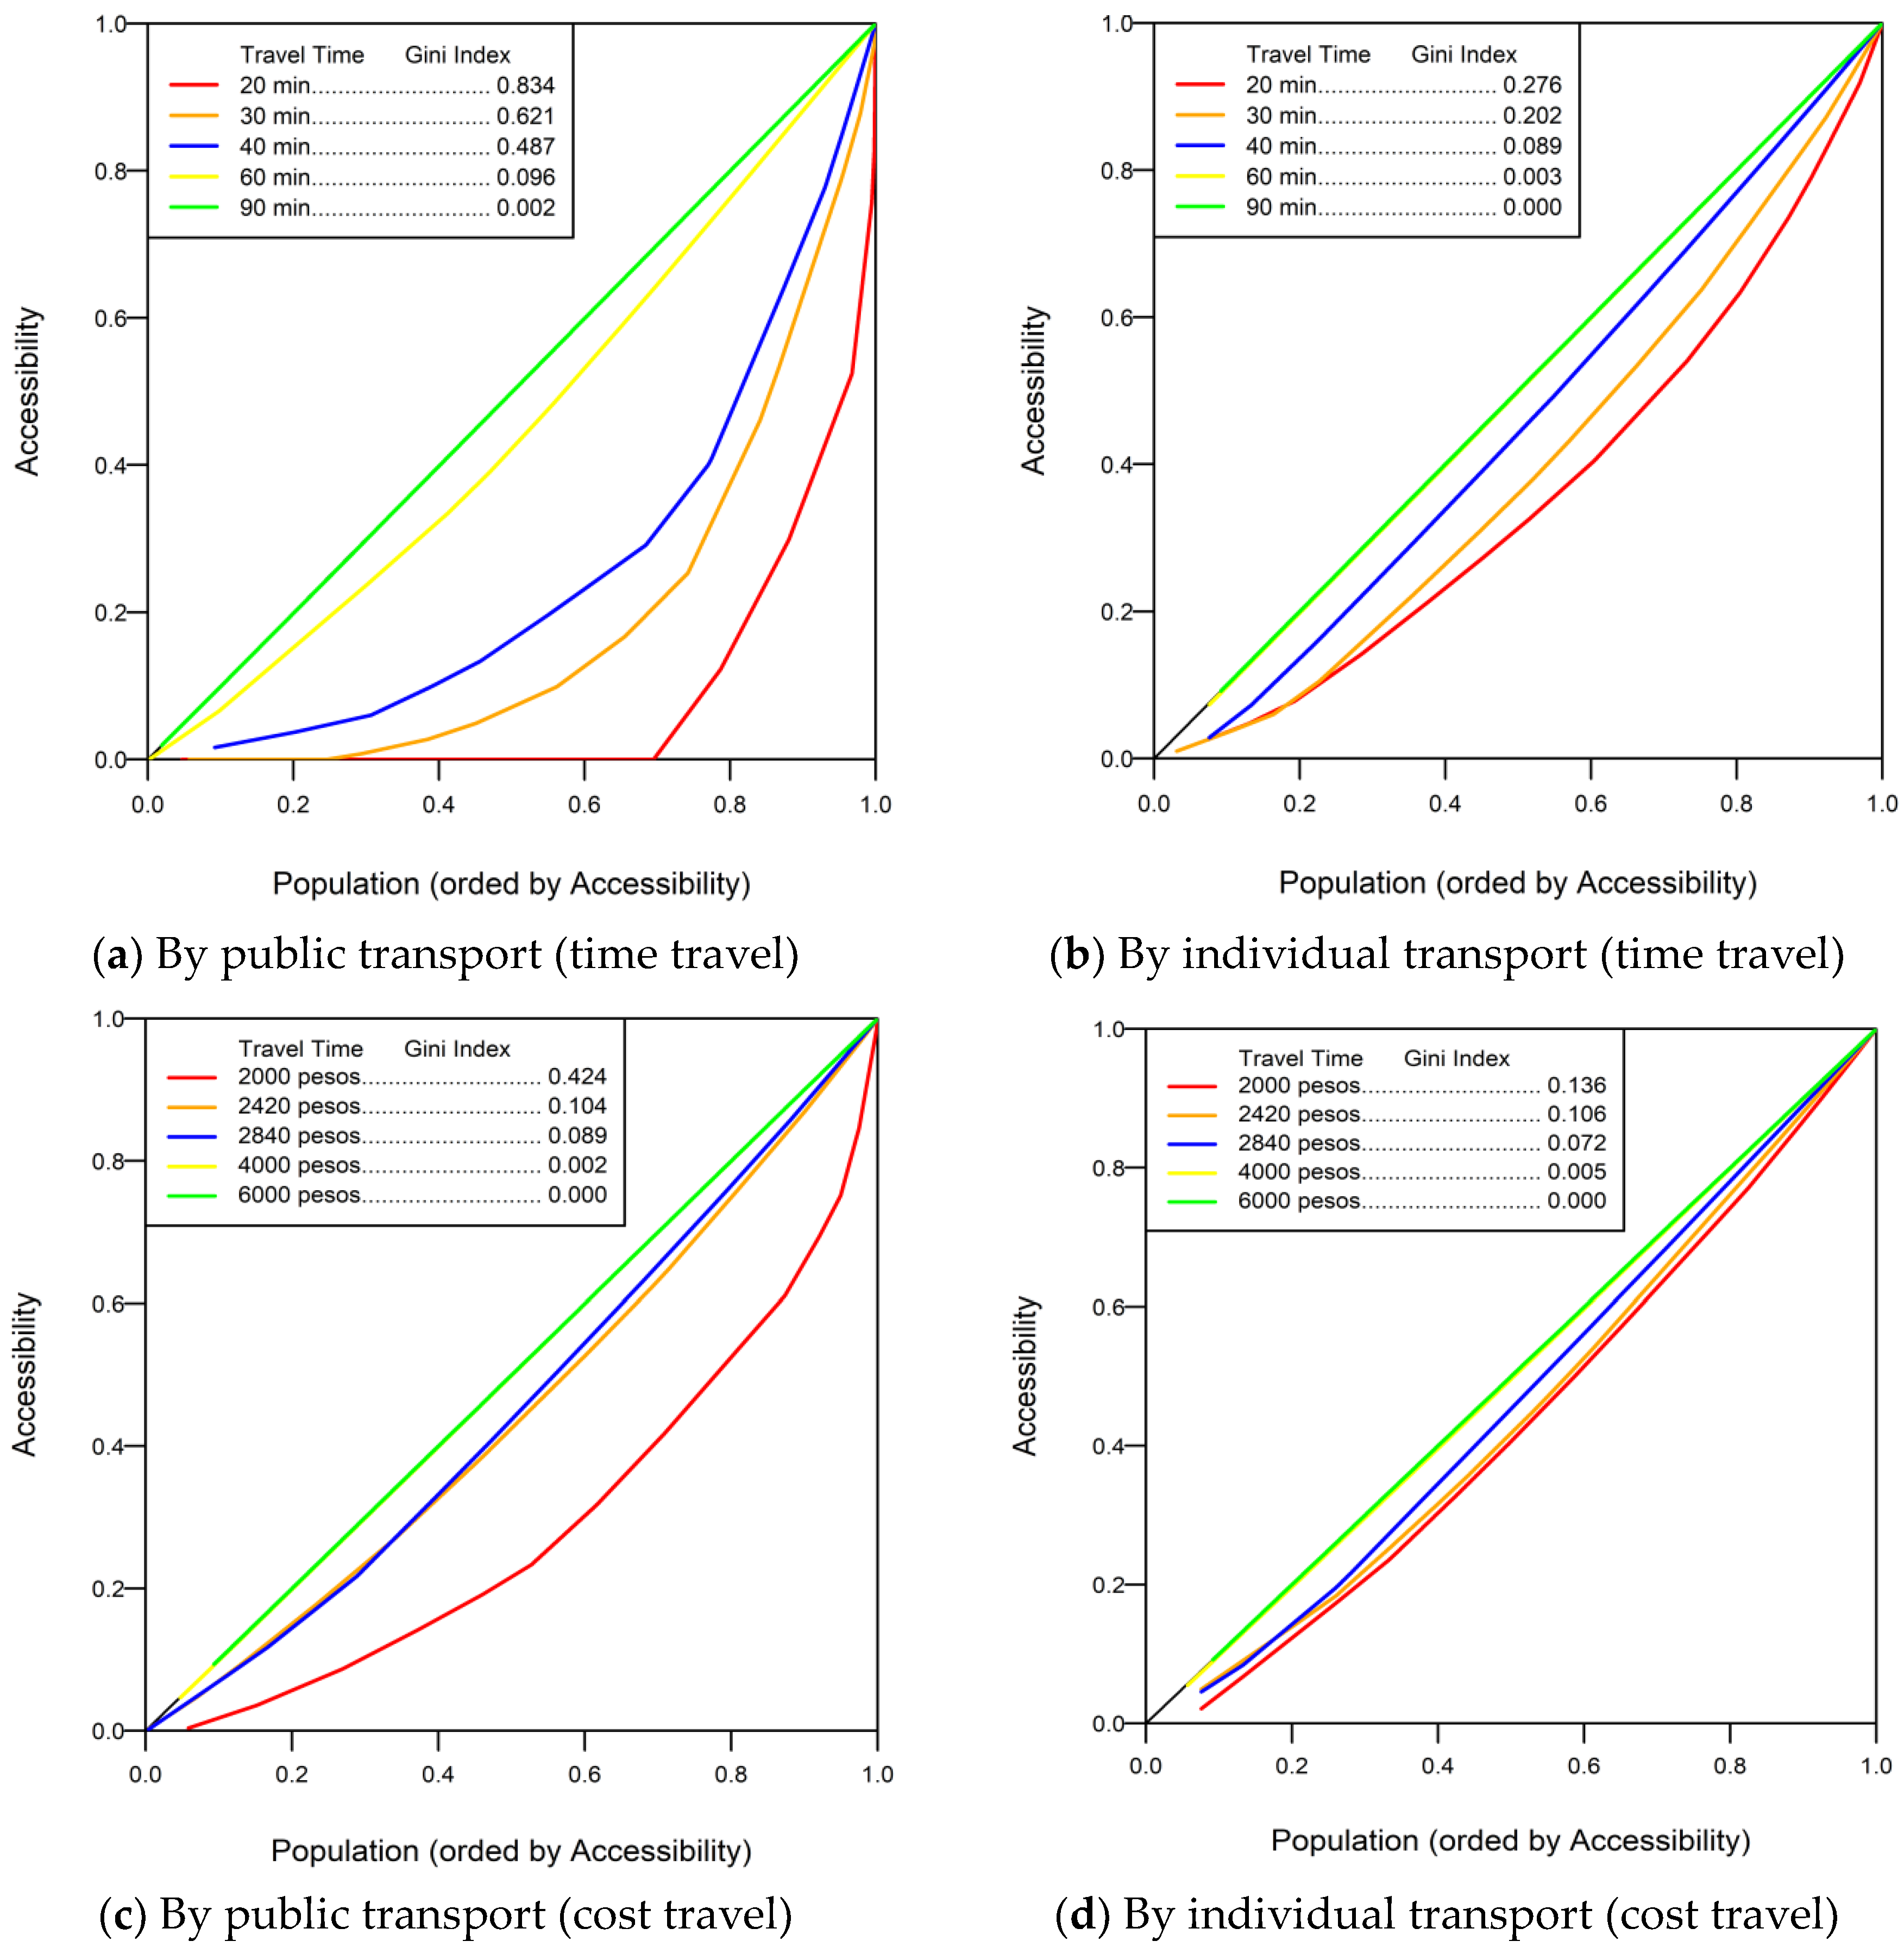
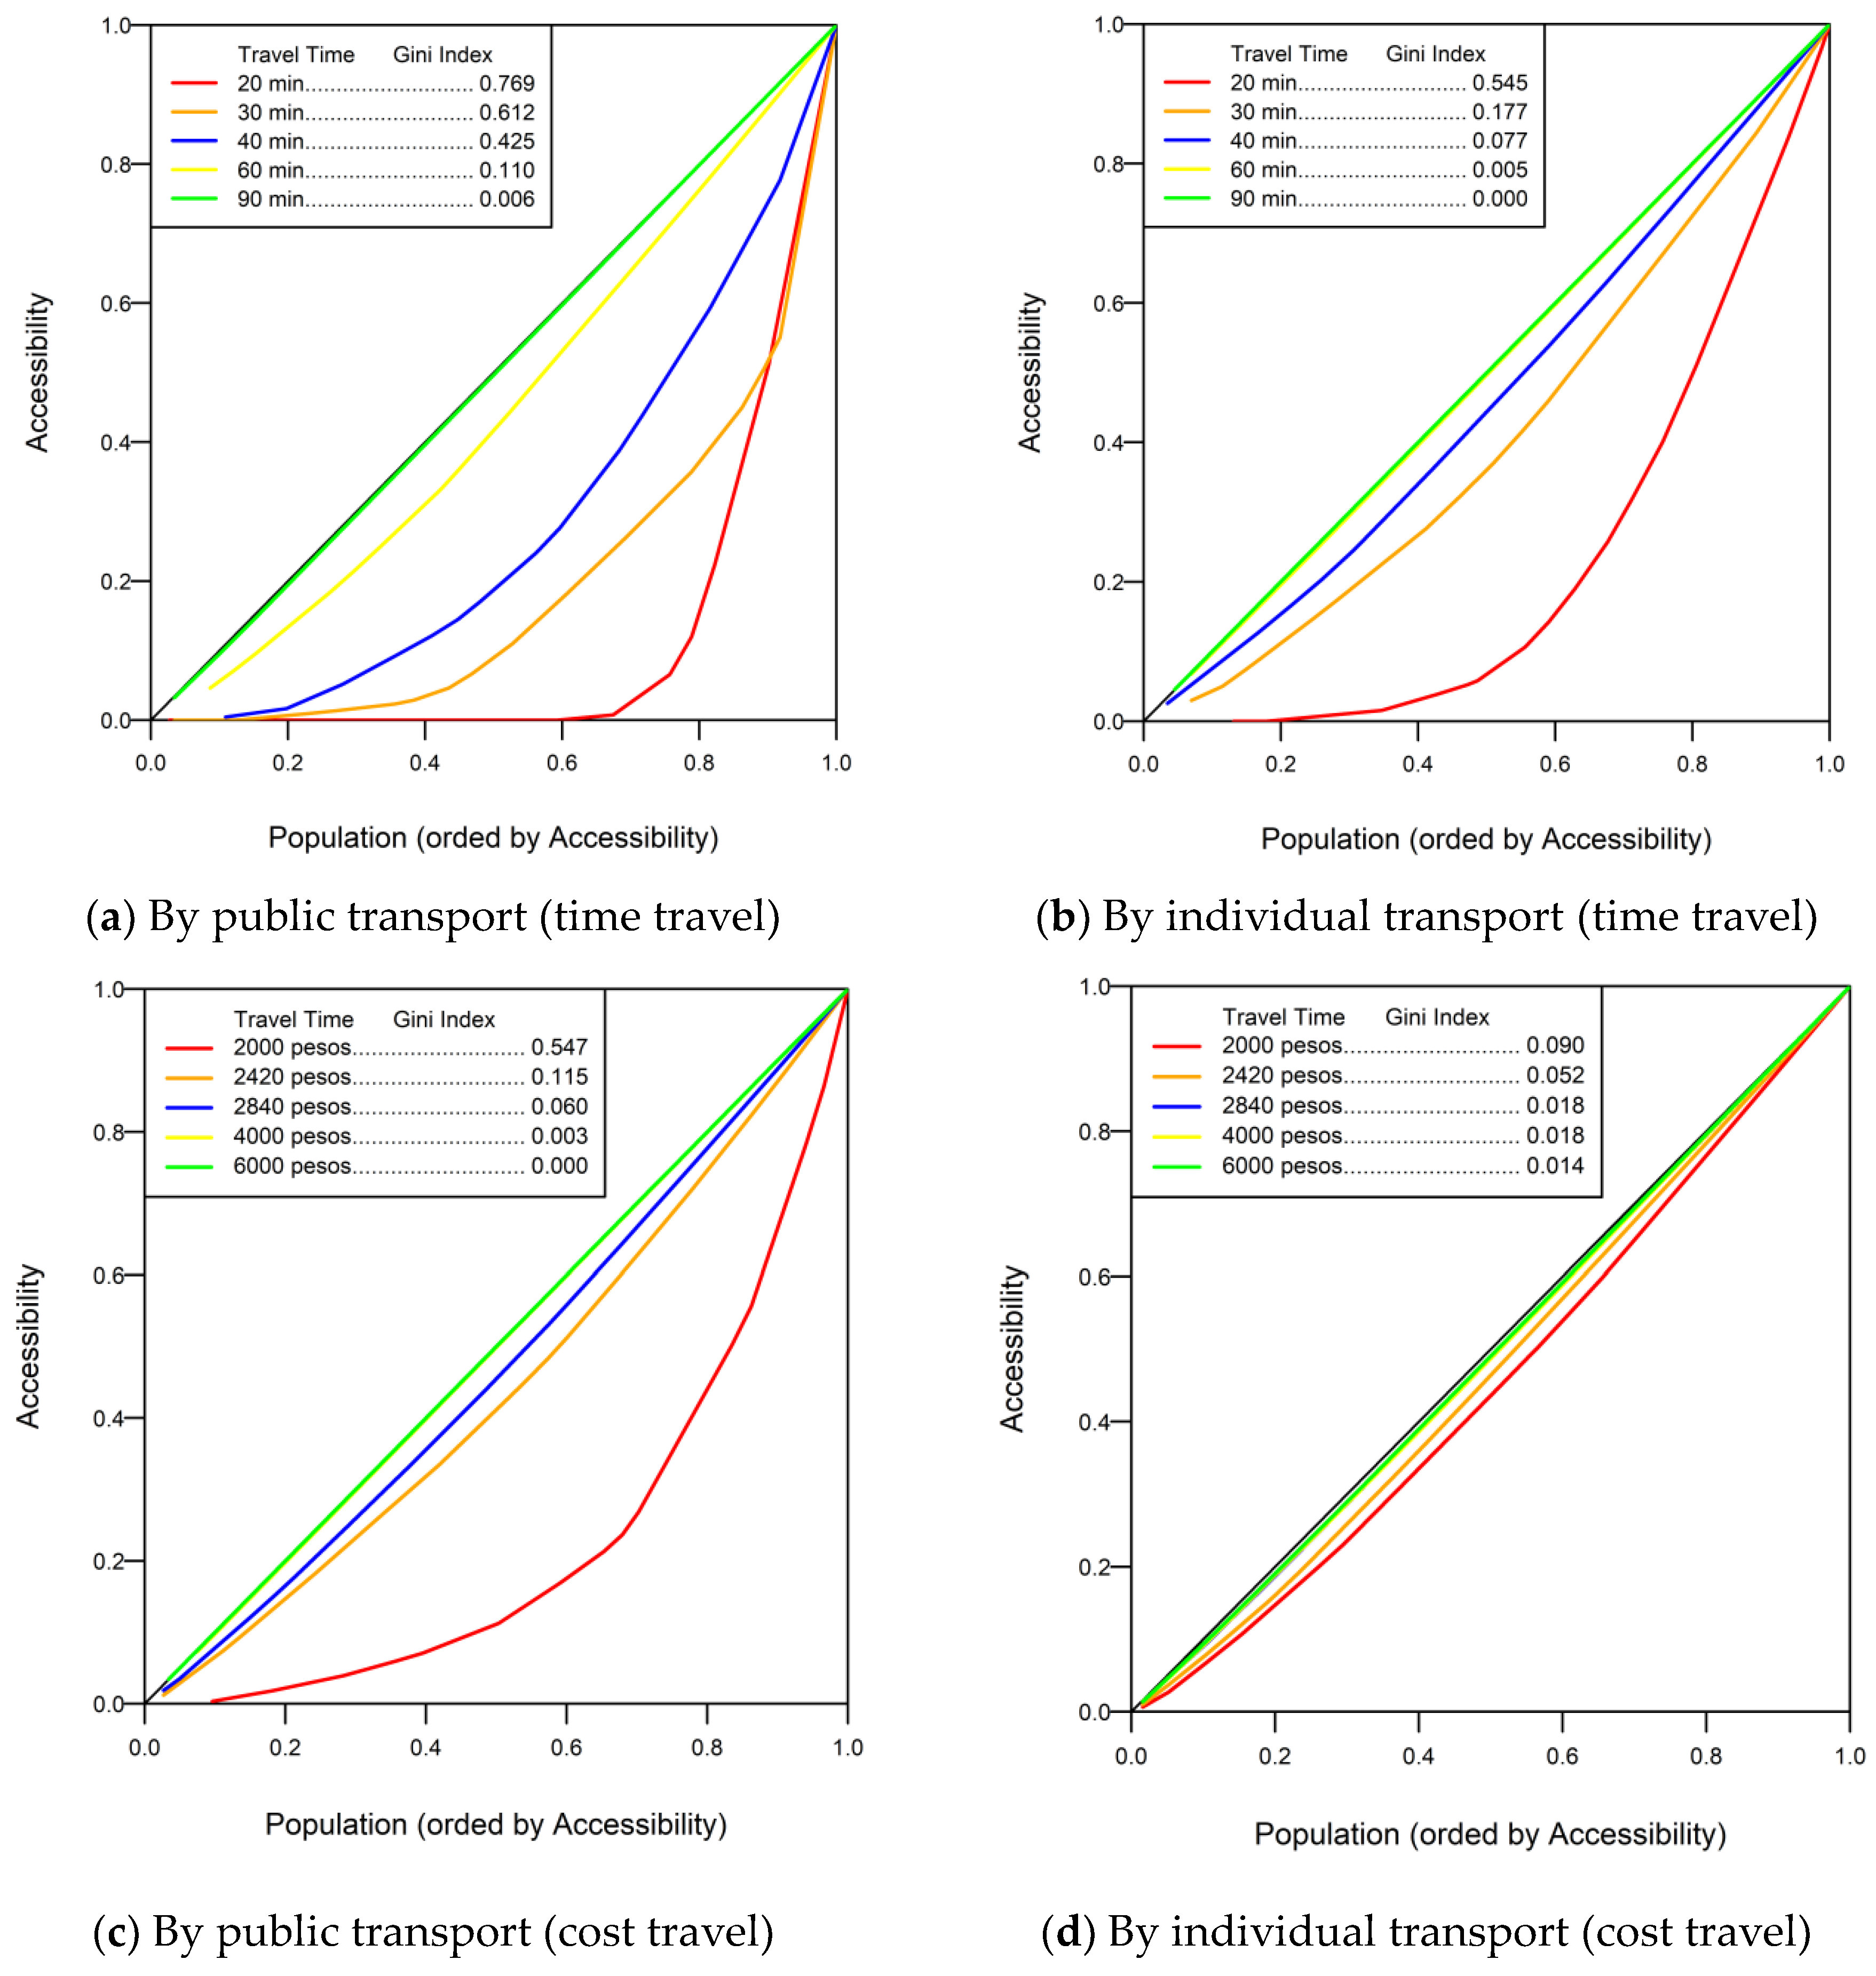
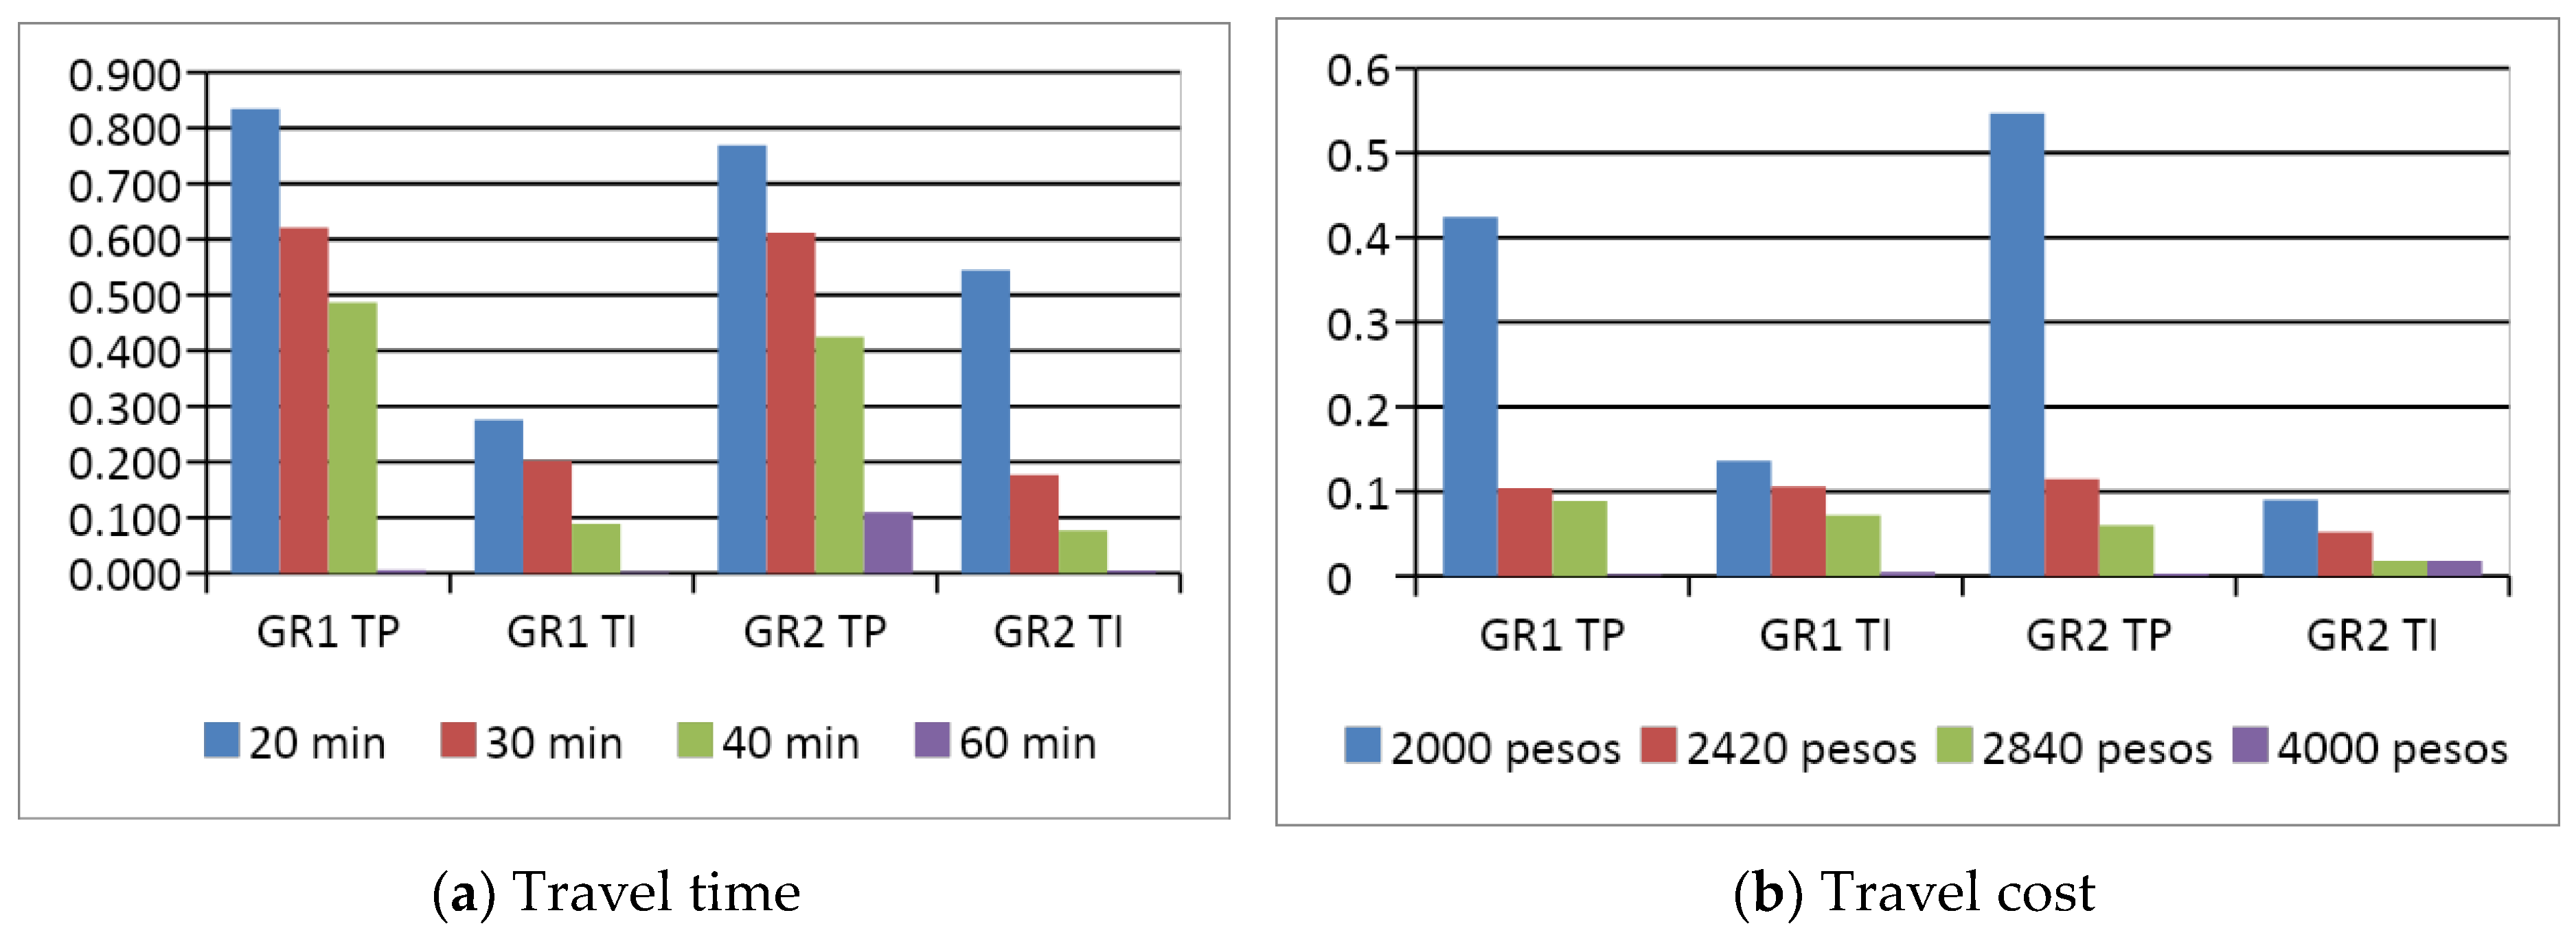
5.1. Time and Cost Travel

It is important to analyze the travel time and cost disaggregated at the district level, to verify which of these impedances can reduce the Gini index, as well as contributing to a desired value. This is necessary to support the process of formulating public policies. Despite the limitations, the use of accessibility metrics enables better understanding of larger spatial areas and favors the discussion among stakeholders [10]. This subtopic starts with the geographic distribution of the travel times for each district, for the income groups 1 and 2, shown in Figure 3, and of the cost of travel, shown in Figure 4. The central business district (CBD) is located in the district of La Candelária (number 10) and the city’s richest area is located in the El Poblado district (number 14). The time of 40 min was adopted to illustrate the accessibility in the maps because it is the value close to the average time of the trips for work reason obtained from the O-D matrix (43 min).
Figure 5 shows the percentage of jobs accessed by the public and individual transport modes for each district. For income group 1 by public transport, only residents in the districts Castilla (5), Guayabal (15), La Candelaria (10), La America (12) and El Poblado (14) can access more than 60% of jobs by public transport. For income group 2 by public transport, workers living in Laureles-Estadio (11) and Doce de Octubre (6) can access more than 60% of jobs in 40 min. Regarding individual transport, people in both groups 1 and 2 can access more than 60% of jobs in 40 min. The same situation can be observed on the Figure 5 that showing the accessibility for travel cost of 2420 Colombian pesos.
Other important information in this analysis is the low number of travel pairs in which workers can reach their workplace in an average displacement time of up to 20 min. If we analyze only jouneys by public transportation, this number is even lower: seven travel pairs for income group 1 and nine travel pairs for income group 2. Considering both public and individual modes of transportation, those travel pairs are shown in Table 4, by population group (income groups 1 and 2). In columns 2 and 4 are the districts in which the average travel within the zone is also up to 20 min. Aranjuez is the district which presents more travel pairs.
Travel time of 60 min and a fare of 2000 Colombian pesos allow access to nearly all jobs in the study area, irrespective of income group and transport mode. In income group 1, this minimum cost is paid by the largest percentage of people. For trips by individual transport, the results are close, but income group 1 has an advantage in the 20-min time frame, and for the case of income group 2, the advantage is shown for times periods of 30 and 40 min. Figure 5 shows that income group 2 is more equitable in relation to travel cost.

5.2. Accessibility to Jobs

Guzman et al. [17] identified uniformity in the distribution of car accessibility for the high-income group. However, half of the zones (that the authors studied) have low levels, while the other half have an above-average level of car accessibility. In their study, accessibility in low-income areas showed a greater imbalance, reflecting on travel time and the location of work and study opportunities. For Farber et al. [41], the user tends to use public transportation when they live closer to their physical facilities and the CBD.
The districts Popular (1), Manrique (3), Robledo (7), Villa Hermosa (8) and San Javier (13) have the highest travel times and the number of jobs in these districts is insufficient to serve the population, requiring large worker contingents to commute. The districts Doce de Octubre (6), Villa Hermosa (8), Buenos Aires (9), La America (12) and Belen (16) depend the most on travel time to be accessed by workers. However, the number of jobs in these districts is not sufficient to meet the needs of the local residents, since they are not the main places of job opportunities in the municipality. In relation to average public transport travel cost, El Poblado (14) has the highest value (2919 Colombian pesos), followed by Buenos Aires (9), Castilla (5) and Villa Hermosa (8). The lowest average travel costs are paid by residents of Guayabal (15), La Candelária (10) and Santa Cruz (2), respectively. Figure 4 shows the accessibility to jobs for public and individual transportation modes, by income group, for travel time, and in Figure 6 for travel cost.
According to Guzman and Oviedo [10], accessibility levels improve through the implementation of a public transportation subsidy scheme in favor of the poor; but it is noteworthy that these benefits are not symmetrical, since a 60% increase in the basic subsidy means an improvement of only 8% in the level of accessibility for the low-income population. These authors worked with the concept of potential accessibility using a model that estimates the accessibility of employment opportunities in zone i to all other zones (n). In this model, general travel cost functions as a continuous measure.
An increase in the prices of public transportation fares in Medellin would reduce access to jobs for people with an average travel cost of 2000 Colombian pesos. This highlights the importance of subsidies and the integration of public transportation to ensure access to education, health, and employment opportunities for low-income communities [37]. Due to the disadvantages of the low-income population in relation to those with greater purchasing power, Guzman et al. [17] claim that one way to alleviate this problem is to offer policies that reduce travel costs, citing two examples: targeted subsidies and redistribution of employment and urban education centers. The authors explain that, because the majority of the population does not live close to opportunities/activities, there is a reflection on travel times, as these people tend to live in urban peripheries or suburban areas.

5.3. Vertical Equity

In our article, the basis of social sustainability is being determined/represented by the equity of the transport system, through the Gini index, as a practical implementation. The basis was accessibility to jobs by public and individual transport. According Pitarch-Garrido [2], equity directly affects people’s welfare, which justifies including this variable into the category of social sustainability, because it affects the quality of life of the local citizens. The balanced development is not possible with poverty, under-development and inequality, in both developed and developing countries [2,63].
However, it is understood that this is one part of social sustainability, as its totality involves many other aspects, such as health, local culture, social capital, healthy food, access to public services, education, employment, etc. [2,63].
In our study, the values identified in the results of the case study from the level of general accessibility and by districts, reflected in the values of the Gini index (or Gini coefficient), as shown in Figure 1 and Figure 2. For both population groups, the Gini index is high for the travel times of 20 and 30 min by public transport, and by individual transport it is high for the travel time of 20 min. Regarding the travel cost, the Gini index presents a median value for public transport, and a low one for individual transport.
Based on the calculation of the access to jobs, the ratio between the Gini index values of the populational groups under the aspect of vertical equity in access to jobs by public and individual transportation in the city of Medellín was computed. These values were computed from the index values shown in Figure 1 and Figure 2, and are reported in Table 5.
Figure 7 contain the graphs of the values of the Gini indices shown in Figure 1 and Figure 2, allowing the visualization of the difference in values by population groups based on income and transport mode, for times of 20, 30, 40 and 60 min and fare costs of 2000, 2420, 2840 and 4000 Colombian pesos.
The graph of Figure 7 also depicts the discrepancy in access to jobs between users of public and individual transportation, even within the same group, through the values of the Gini index. For income group 1, accessibility in 40 min is practically the same for individual transport in 20 min. For income group 2, the time of 60 min by public transport is approximately the same as time of 40 min by individual transport in terms of the percentage of jobs accessed. In relation to travel cost, the access rates between the groups are close, but there is a large difference between users of public transport and individual transport, in which the cost of 2000 Colombian pesos in the first case is the same as that of 2420 Colombian pesos for individual transport, and so on.

6. Final Considerations

Overall, this study aims to assess the social sustainability and equity under the perspective of accessibility to jobs, specifically of Medellín, Colombia. Therefore, the outputs of this research express exclusively the results related to the geographical area and the groups of population considered in the methodology and analysis of this paper. The results of this study suggest the existence of behavioral differences regarding commuting to work between the two population (income) groups analyzed in Medellin city, as well as between the transport modes. Based on the values obtained, it is possible to answer the questions posed in the introduction.
(i)
Is there a discrepancy in the level of accessibility to jobs between population (income) groups, and consequently in the equity of the transport system of Medellin?
The income group 1 presents the greatest dispersion of job opportunities, implying longer travel times. When adopting a travel time of 20 min, the people in this group have access to a small number of opportunities. With 40 min, individuals in income group 2 have a satisfactory job access value (74.76%), versus 55.44% for group 1. Therefore, job accessibility is better for group 2 when considering the impedances time and cost of travel.
Based on this, and from the generated Gini indices, it is possible to identify that, for public transport and travel time impedance factor, income group 2 has a better level of equity; and considering the cost of travel, the values are close, but a little better for income group 1 in public transport. For individual transportation, income group 1 is more equitable for travel time, and income group 2 for travel cost has the lowest Gini index value.
Thus, in case of Medellin, population groups with a higher level of monthly income have better access to jobs, which may be due to the mode of transportation used or the location of the residence. However, this difference is not discrepant when one considers the income factor in an isolated manner, which reflects on the equity of the transportation system.
(ii)
Based on the vertical equity approach, is there equity between the modes of public and individual motorized transport in terms of time and cost of travel (impedance factors) in Medellin?
The results indicate that, in Medellin, inequity regarding job access is more evident when the comparison between transport modes than between income groups. For income group 1, the comparable travel times are 40 and 20 min, respectively; for income group 2, there are approximate values only for the time of 90 min. The same pattern holds for travel costs, at a value of 4000 Colombian pesos. For public transport users, the results of the income group 1 are higher for all of the time rages adopted. In the case of individual transport users, there are better results only for the time range of 20 min and the cost of 2000 colombian pesos, and for the other ranges values are lower, but not further away.
The districts with the longest travel times are not served by the subway system (Popular, Manrique, Doce de Octubre and Belen). For both income groups, and considering the time travel range of 40 min, Robledo, Aranjuez and Belen present large discrepancy in job access between transport modes. These two districts are not served by the subway system, but they do have the Metroplus service (BRT). These results show the importance of prioritizing collective public transport to improve the services, and/or implementing a local fare subsidy policy, as well as studying the land use patterns in the municipality for the subsequent restructuring of its organization.
This case study shows that there is a certain inequality in access to jobs when comparing modes of transportation in Medellin, as the motorized individual has an advantage over travel time. In addition to that, when public transportation is not subsidized the individual outweighs it on the travel cost as well. This difference was more accentuated than when we analyzed only the income group to which the user belongs.
(iii)
Does the present transport system of Medellin contribute to local social sustainability?
For a transportation system to be considered socially sustainable, it must promote equity among population groups and provide good accessibility for workers, as it would reduce social inequality. However, the results show that the transport system in Medellin is still deficient in this aspect, as it needs to reduce inequity in terms of the level of accessibility among users of public transportation and individual motorized transportation.
Regarding the Lorenz curve and the Gini index, they proved to be tools capable of identifying differences in access to employment. Therefore, this work was able to analyze the social sustainability of Medellin, given by its level of vertical equity, from the accessibility to jobs, comparing two population groups (divided by income groups and possible beneficiaries and non-beneficiaries of transport tariff subsidy) and by transport modes.
Finally, even with results focused on the case study, the methodological proposal of this study was also developed to be replicable in other case studies, specifically in developing countries, considering that many cities, in this geographical context, may have similar available data and also a similar approach regarding transport policies, with special attention to tariff subsidy policies, because inequality in urban areas of Latin America, for example, tend to be more evident than in developed countries, and may present similar conditions to this study (in terms of availability of data and transport policy), allowing the replicability of the proposed methodology.

6.1. Implications

The methodology used was able to analyze social sustainability, based on vertical equity and job accessibility, by comparing population groups (by income groups those-eligible and ineligible for fare subsidies-and by transport modes). The sequence of steps allowed careful examination and understanding of information and data obtained in the case study. First was the possible understanding of the characteristics of the area and directions for treatment of the data, followed by the application of the accessibility indicators and equity measure in the scenario studied, and finally uniting these aspects to interpret the results obtained.

6.2. Limitations and Future Work

In this case study we have only considered the trips for commuting to work of the respondents who declared their monthly income, divided by income groups, which allowed the analysis of the mobility conditions of possible beneficiaries and non-beneficiaries of transportation tariff subsidies. The fact that some trips by motorized transport were not considered may imply inaccuracy of the trips’ characteristics, because whether these trips had a greater or lesser cost and/or travel time than the trips analyzed was not verified.
It is also important to mention the exclusion of trips made on foot or by bicycle in this study, due to the focus on motorized transport. In order to consider these trips, it would be interesting to know the reason for choosing the mode of transport, as it could be distinguished whether it was optional (by preference or living near the workplace) or due to affordability conditions. However, this information is not included in the Household Origin-Destination Survey used in this study.
The limitation of this work is related to a possible exaggeration and/or underestimation of the true level of accessibility to jobs in the city, and consequently of the current vertical equity and social sustainability, upwards or downwards. However, it is relevant to highlight that the methodological choices in this study (including sample selection) proved to be adequate to understand whether the current transportation tariff subsidies are covering the sections of the population that should be benefiting from this public policy.
As a suggestion for future studies, there are two proposals: (1) Analyze the effect of the subsidy policy on the beneficiary population in relation to the percentage of income spent with transport, and (2) Identify the need for new policies or the reformulation of the existing ones.

Author Contributions

Conceptualization, G.V.G. and M.A.V.d.S.; methodology, G.V.G., T.F.S. and M.A.V.d.S.; software, G.V.G. and T.F.S.; validation, G.V.G. and M.A.V.d.S.; formal analysis, G.V.G., T.F.S., V.A.F., J.E.C.M. and M.A.V.d.S.; writing—original draft preparation, G.V.G. and T.F.S.; writing—review and editing, G.V.G. and V.A.F.; supervision, V.A.F., J.E.C.M. and M.A.V.d.S. All authors have read and agreed to the published version of the manuscript.

Funding

This study received financial support from Brazil’s Office to Coordinate Improvement of University Personnel (CAPES), finance code 001.

Acknowledgments

We gratefully acknowledge the three anonymous reviewers for their constructive comments, which helped us to improve this paper.

Conflicts of Interest

The authors declare no conflict of interest.

References

  1. Dempsey, N.; Bramley, G.; Power, S.; Brown, C. The social dimension of sustainable development: Defining urban social sustainability. Sustain. Dev. 2011, 19, 289–300. [Google Scholar] [CrossRef]
  2. Pitarch-Garrido, M.D. Social sustainability in metropolitan areas: Accessibility and equity in the case of the metropolitan area of Valencia (Spain). Sustainability 2018, 10, 371. [Google Scholar] [CrossRef] [Green Version]
  3. López, C.; Ruíz-Benítez, R.; Vargas-Machuca, C. On the environmental and social sustainability of technological innovations in Urban bus transport: The EU case. Sustainability 2019, 11, 1413. [Google Scholar] [CrossRef] [Green Version]
  4. Banister, D. The trilogy of distance, speed and time. J. Transp. Geogr. 2011, 19, 950–959. [Google Scholar] [CrossRef]
  5. Delbosc, A.; Currie, G. Using Lorenz curves to assess public transport equity. J. Transp. Geogr. 2011, 19, 1252–1259. [Google Scholar] [CrossRef]
  6. Welch, T.F. Equity in transport: The distribution of transit access and connectivity among affordable housing units. Transp. Policy 2013, 30, 283–293. [Google Scholar] [CrossRef]
  7. Shirmohammadli, A.; Louen, C.; Vallée, D. Exploring mobility equity in a society undergoing changes in travel behavior: A case study of Aachen, Germany. Transp. Policy 2016, 46, 32–39. [Google Scholar] [CrossRef]
  8. Lucas, K.; van Wee, B.; Maat, K. A method to evaluate equitable accessibility: Combining ethical theories and accessibility-based approaches. Transportation 2016, 43, 473–490. [Google Scholar] [CrossRef] [Green Version]
  9. Deboosere, R.; El-Geneidy, A. Evaluating equity and accessibility to jobs by public transport across Canada. J. Transp. Geogr. 2018, 73, 54–63. [Google Scholar] [CrossRef]
  10. Guzman, L.A.; Oviedo, D. Accessibility, affordability and equity: Assessing ‘pro-poor’ public transport subsidies in Bogota. Transp. Policy 2018, 68, 37–51. [Google Scholar] [CrossRef]
  11. Camporeale, R.; Caggiani, L.; Ottomanelli, M. Modeling horizontal and vertical equity in the public transport design problem: A case study. Transp. Res. Part A Policy Pract. 2019, 125, 184–206. [Google Scholar] [CrossRef]
  12. Caggiani, L.; Camporeale, R.; Ottomanelli, M. Planning and Design of Equitable Free-Floating Bike-Sharing Systems Implementing a Road Pricing Strategy. J. Adv. Transp. 2017, 2017, 3182387. [Google Scholar] [CrossRef]
  13. Behbahani, H.; Nazari, S.; Jafari Kang, M.; Litman, T. A conceptual framework to formulate transportation network design problem considering social equity criteria. Transp. Res. Part A Policy Pract. 2019, 125, 171–183. [Google Scholar] [CrossRef]
  14. Hamurcu, M.; Eren, T. Strategic planning based on sustainability for urban transportation: An application to decision-making. Sustainability 2020, 12, 3589. [Google Scholar] [CrossRef]
  15. Gallo, M.; Marinelli, M. Sustainable mobility: A review of possible actions and policies. Sustainability 2020, 12, 7499. [Google Scholar] [CrossRef]
  16. Burguillo, M.; Romero-Jordán, D.; Sanz-Sanz, J.F. The new public transport pricing in Madrid Metropolitan Area: A welfare analysis. Res. Transp. Econ. 2017, 62, 25–36. [Google Scholar] [CrossRef]
  17. Guzman, L.A.; Oviedo, D.; Rivera, C. Assessing equity in transport accessibility to work and study: The Bogotá region. J. Transp. Geogr. 2017, 58, 236–246. [Google Scholar] [CrossRef]
  18. Vasconcellos, E.A. Transport Policy in Brazil: The Construction of Excludente Mobility; Manole: São Paulo, Brazil, 2013. [Google Scholar]
  19. Hansen, W.G. How Accessibility Shapes Land Use. J. Am. Inst. Plann. 1959, 25, 73–76. [Google Scholar] [CrossRef]
  20. Cervero, R. Accessible Cities and Regions: A Framework for Sustainable Transport and Urbanism in the 21st Century; UC Berkeley: Berkeley, MA, USA, 2005. [Google Scholar]
  21. da Silva Lemos, D.S. Análise das Relações Existentes Entre a Acessibilidade e o Desenvolvimento No Município de Petrópolis. Ph.D. Thesis, Federal University of Rio de Janeiro, Rio de Janeiro, Brazil, 2011. [Google Scholar]
  22. Bocarejo, S.; Pablo, J.; Oviedo, H.D.R. Transport accessibility and social inequities: A tool for identification of mobility needs and evaluation of transport investments. J. Transp. Geogr. 2012, 24, 142–154. [Google Scholar] [CrossRef]
  23. Grengs, J. Nonwork Accessibility as a Social Equity Indicator. Int. J. Sustain. Transp. 2015, 9, 1–14. [Google Scholar] [CrossRef]
  24. Niehaus, M.; Galilea, P.; Hurtubia, R. Accessibility and equity: An approach for wider transport project assessment in Chile. Res. Transp. Econ. 2016, 59, 412–422. [Google Scholar] [CrossRef]
  25. Delmelle, E.C.; Casas, I. Evaluating the social equity of bus rapid transit—Based accessibility patterns in a developing country: The case of Cali, Colômbia. Transp. Policy 2012, 20, 36–46. [Google Scholar] [CrossRef]
  26. Hidalgo, D.; King, R. Public transport integration in Bogotá and Cali, Colombia—Facing transition from semi-deregulated services to full regulation citywide. Res. Transp. Econ. 2014, 48, 166–175. [Google Scholar] [CrossRef]
  27. Bocarejo, J.P.; Escobar, D.; Hernandez, D.O.; Galarza, D. Accessibility analysis of the integrated transit system of Bogotá. Int. J. Sustain. Transp. 2016, 10, 308–320. [Google Scholar] [CrossRef]
  28. Santos, B.; Antunes, A.; Miller, E.J. Integrating equity objectives in a road network design model. Transp. Res. Rec. 2008, 2089, 35–42. [Google Scholar] [CrossRef] [Green Version]
  29. Bocarejo, J.P.; Portilla, I.J.; Velásquez, J.M.; Cruz, M.N.; Peña, A.; Oviedo, D.R. An innovative transit system and its impact on low income users: The case of the Metrocable in Medellín. J. Transp. Geogr. 2014, 39, 49–61. [Google Scholar] [CrossRef]
  30. Heinrichs, D.; Bernet, J.S. Public Transport and Accessibility in Informal Settlements: Aerial Cable Cars in Medellín, Colombia. Transp. Res. Procedia 2014, 4, 55–67. [Google Scholar] [CrossRef] [Green Version]
  31. Ricciardi, A.M.; Xia, J.C.; Currie, G. Exploring public transport equity between separate disadvantaged cohorts: A case study in Perth, Australia. J. Transp. Geogr. 2015, 43, 111–122. [Google Scholar] [CrossRef]
  32. Cui, B.; Boisjoly, G.; El-Geneidy, A.; Levinson, D. Accessibility and the journey to work through the lens of equity. J. Transp. Geogr. 2019, 74, 269–277. [Google Scholar] [CrossRef]
  33. Ahern, A.; Vega, A.; Caulfield, B. Deprivation and access to work in Dublin City: The impact of transport disadvantage. Res. Transp. Econ. 2016, 57, 44–52. [Google Scholar] [CrossRef] [Green Version]
  34. Zhou, J.; Zhang, M.; Zhu, P. The equity and spatial implications of transit fare. Transp. Res. Part A Policy Pract. 2019, 121, 309–324. [Google Scholar] [CrossRef]
  35. Rój, J. Inequality in the distribution of healthcare human resources in Poland. Sustainability 2020, 12, 2043. [Google Scholar] [CrossRef] [Green Version]
  36. Su, R.; Fang, Z.; Xu, H.; Huang, L. Uncovering spatial inequality in taxi services in the context of a subsidy war among E-hailing apps. ISPRS Int. J. Geo-Inf. 2018, 7, 230. [Google Scholar] [CrossRef] [Green Version]
  37. Guzman, L.A.; Oviedo, D.; Cardona, R. Accessibility changes: Analysis of the integrated public transport system of Bogotá. Sustainability 2018, 10, 3958. [Google Scholar] [CrossRef] [Green Version]
  38. Matsuyuki, M.; Okami, S.; Nakamura, F.; Sarmiento-Ordosgoitia, I. Impact of aerial cable car in low-income area in Medellín, Colombia. Transp. Res. Procedia 2020, 48, 3264–3282. [Google Scholar] [CrossRef]
  39. El-Geneidy, A.; Levinson, D.; Diab, E.; Boisjoly, G.; Verbich, D.; Loong, C. The cost of equity: Assessing transit accessibility and social disparity using total travel cost. Transp. Res. Part A Policy Pract. 2016, 91, 302–316. [Google Scholar] [CrossRef] [Green Version]
  40. Nahmias-Biran, B.H.; Sharaby, N.; Shiftan, Y. Equity Aspects in Transportation Projects: Case Study of Transit Fare Change in Haifa. Int. J. Sustain. Transp. 2014, 8, 69–83. [Google Scholar] [CrossRef]
  41. Farber, S.; Bartholomew, K.; Li, X.; Páez, A.; Nurul Habib, K.M. Assessing social equity in distance based transit fares using a model of travel behavior. Transp. Res. Part A Policy Pract. 2014, 67, 291–303. [Google Scholar] [CrossRef]
  42. Stanley, J.; Stanley, J.; Balbontin, C.; Hensher, D. Social exclusion: The roles of mobility and bridging social capital in regional Australia. Transp. Res. Part A Policy Pract. 2019, 125, 223–233. [Google Scholar] [CrossRef] [Green Version]
  43. Kaufmann, V.; Bergman, M.M.; Joye, D. Motility: Mobility as capital. Int. J. Urban Reg. Res. 2004, 28, 745–756. [Google Scholar] [CrossRef]
  44. Ubbels, B.; Nijkamp, P. Unconventional funding of urban public transport. Transp. Res. Part D Transp. Environ. 2002, 7, 317–329. [Google Scholar] [CrossRef]
  45. Verbich, D.; El-Geneidy, A. Public transit fare structure and social vulnerability in Montreal, Canada. Transp. Res. Part A Policy Pract. 2017, 96, 43–53. [Google Scholar] [CrossRef]
  46. Carneiro, M.; Toledo, J.; Aurélio, M.; Orrico, R. Espraiamento urbano e exclusão social. Uma análise da acessibilidade dos moradores da cidade do Rio de Janeiro ao mercado de trabalho. Eure 2019, 45, 51–70. [Google Scholar] [CrossRef] [Green Version]
  47. Zhu, B.; Hsieh, C.W.; Zhang, Y. Incorporating spatial statistics into examining equity in health workforce distribution: An empirical analysis in the Chinese context. Int. J. Environ. Res. Public Health 2018, 15, 1309. [Google Scholar] [CrossRef] [Green Version]
  48. Lope, D.J.; Dolgun, A. Measuring the inequality of accessible trams in Melbourne. J. Transp. Geogr. 2020, 83, 102657. [Google Scholar] [CrossRef]
  49. Gao, H.; Chen, Y.; Mei, S.; Huang, S.; Xu, Y. Resilience-Oriented Pre-Hurricane Resource Allocation in Distribution Systems Considering Electric Buses. Proc. IEEE 2017, 105, 1214–1233. [Google Scholar] [CrossRef]
  50. Geurs, K.T.; van Wee, B. Accessibility evaluation of land-use and transport strategies: Review and research directions. J. Transp. Geogr. 2004, 12, 127–140. [Google Scholar] [CrossRef]
  51. Van Wee, B.; Hagoort, M.; Annema, J.A. Accessibility measures with competition. J. Transp. Geogr. 2001, 9, 199–208. [Google Scholar] [CrossRef]
  52. Mello, A.J.R. A Acessibilidade ao Emprego e Sua Relação Com A Mobilidade e o Desenvolvimento Sustentáveis: O Caso da Região Metropolitana do Rio de Janeiro. Ph.D. Thesis, Universidade Federal do Rio de Janeiro, Rio de Janeiro, Brazil, 2015. [Google Scholar]
  53. Foth, N.; Manaugh, K.; El-Geneidy, A.M. Towards equitable transit: Examining transit accessibility and social need in Toronto, Canada, 1996–2006. J. Transp. Geogr. 2013, 29, 1–10. [Google Scholar] [CrossRef]
  54. Legrain, A.; Buliung, R.; El-Geneidy, A.M. Travelling fair: Targeting equitable transit by understanding job location, sectorial concentration, and transit use among low-wage workers. J. Transp. Geogr. 2016, 53, 1–11. [Google Scholar] [CrossRef]
  55. Johnson, D.; Ercolani, M.; Mackie, P. Econometric analysis of the link between public transport accessibility and employment. Transp. Policy 2017, 60, 1–9. [Google Scholar] [CrossRef]
  56. Cho Yam Lau, J. The influence of suburbanization on the access to employment of workers in the new towns: A case study of Tin Shui Wai, Hong Kong. Habitat Int. 2010, 34, 38–45. [Google Scholar] [CrossRef]
  57. Li, S.; Liu, Y. Land use, mobility and accessibility in dualistic urban China: A case study of Guangzhou. CITIES 2017, 71, 59–69. [Google Scholar] [CrossRef]
  58. Boisjoly, G.; Moreno-Monroy, A.I.; El-Geneidy, A. Informality and accessibility to jobs by public transit: Evidence from the São Paulo Metropolitan Region. J. Transp. Geogr. 2017, 64, 89–96. [Google Scholar] [CrossRef]
  59. Cao, X.; Chen, H.; Liang, F.; Wang, W. Measurement and spatial differentiation characteristics of transit equity: A case study of Guangzhou, China. Sustainability 2018, 10, 1069. [Google Scholar] [CrossRef] [Green Version]
  60. Gini, C.W. Variability and Multability, Contribution to the Study of Statistical Distributions and Relations; Studi economico-giuridici della R. Universita de Cagliari: Cagliari, Italy, 1912. [Google Scholar]
  61. Flamm, M.; Kaufmann, V. Operationalising the concept of motility: A qualitative study. Mobilities 2006, 1, 167–189. [Google Scholar] [CrossRef]
  62. Trigueiro, A. City and Solutions: How to Built a Sustainable City; Leya: Rio de Janeiro, Brazil, 2017. [Google Scholar]
  63. Vallance, S.; Perkins, H.C.; Dixon, J.E. What is social sustainability? A clarification of concepts. Geoforum 2011, 42, 342–348. [Google Scholar] [CrossRef]
Figure 1. Gini index for income group 1 in relation to time and cost travel.
Sustainability 12 10132 g001
Figure 2. Gini index for income group 2 in relation to time and cost travel.
Sustainability 12 10132 g002
Figure 3. Accessibility to jobs for an average time of 40 min of travel. Source: Own Elaboration.
Sustainability 12 10132 g003
Figure 4. Accessibility to jobs for public and individual transportation modes, by income group (travel time). Source: Own Elaboration.
Sustainability 12 10132 g004
Figure 5. Accessibility to jobs for an average travel cost of 2420 Colombian pesos. Source: Own Elaboration.
Sustainability 12 10132 g005
Figure 6. Accessibility to jobs for public and individual transport modes, by income group (travel cost). Source: Own Elaboration.
Sustainability 12 10132 g006
Figure 7. Comparison between Gini index values regarding travel time and travel cost. Source: Own Elaboration.
Sustainability 12 10132 g007
Table 1. Unemployed rate, by district, in 2017.
DistrictUnemployment (%)DistrictUnemployment (%)DistrictUnemployment (%)
1Popular14.917Robledo10.7713San Javier9.89
2Santa Cruz11.168Villa Hermosa12.2814El Poblado2.3
3Manrique11.989Buenos Aires11.2015Guayabal7.11
4Aranjuez11.0310La Candelária9.0816Belén7.73
5Castilla8.9011Laureles-Estadio6.08
6Doce de Octubre13.3012La América10.94
Source: Prepared by the authors based on the website of Alcadía of Medellín (2019).
Table 2. Income Stratification of Respondents.
IntervalMultiples of the Minimum Monthly Wage (Approximate)Considered Group
Up to USD 214.53Up to 1Income Group 1
USD 214.61 to USD 436.21Between 1 and 2
USD 436.21 to USD 654.31Between 2 and 3Income Group 2
USD 654.31 to USD 1017.82Between 3 and 5
USD 1017.82 to USD 1454.02Between 5 and 7
USD 1454.02 to USD 2035.64Between 7 and 9
More than USD 2035.64More than 9
Source: Prepared by the authors based on the 2017 Household Origin-Destination Survey.
Table 3. Percentage of jobs accessed for each group, according to travel time and cost.
Group/TimeIncome Group 1-PTIncome Group 1-ITIncome Group 2-PTIncome Group 2-TI
20 min4.21%22.68%2.70%18.56%
U$ 0.58 (2000 Colombian pesos)22.27%76.32%20.34%77.67%
30 min7.68%58.50%14.72%62.12%
U$ 0.70 (2420 Colombian pesos)70.22%85.90%76.36%86.80%
40 min30.44%86.47%34.87%87.39%
U$ 0.83 (2840 Colombian pesos)82.47%92.62%87.51%94.79%
60 min81.07%99.77%83.87%99.54%
U$ 1.16 (4000 Colombian pesos)99.79%99.26%99.64%95.83%
90 min99.78%100%99.23%100%
U$ 1.74 (6000 Colombian pesos)100%100%100%97.04%
Displacements (16 × 21)193185160169
Source: Prepared by the authors.
Table 4. Trips of up 20 min by income group.
Income Group 1Within Zones (Income Group 1)Income Group 2Within Zones (Income Group 2)
Popular (1) × Santa Cruz (2)Popular (1)Aranjuez (4) × Buenos Aires (9)Popular (1)
Santa Cruz (2) × Guayabal (15)Santa Cruz (2)Aranjuez (4) × Popular (1)Santa Cruz (2)
Aranjuez (4) × Manrique (3)Manrique (3)Aranjuez (4) × Santa Cruz (2)Aranjuez (4)
Aranjuez (4) × Santa Cruz (2)Aranjuez (4)Doce de Octubre (6) × Popular (1)Castilla (5)
Aranjuez (4) × San Cristobal (60)Castilla (5)Doce de Octubre (6) × La América (12)Doce de Octubre (6)
Castilla (5) × Popular (1)Doce de Octubre (6)Villa Hermosa (8) × Castilla (5)Buenos Aires (9)
Castilla (5) × Robledo (7)Villa Hermosa (8)Buenos Aires (9) × Manrique (3)Laureles-Estadio (11)
Doce de Octubre (6) × Villa Hermosa (8)Buenos Aires (9)La Candelaria (10) × Villa Hermosa (8)San Javier (13)
Buenos Aires (9) × San Antonio de Prado (80)La Candelária (10)Laureles-Estadio (11) × La América (12)Guayabal (15)
La Candelária (10) × Buenos Aires (9)Laureles-Estadio (11)Laureles-Estadio (11) × Belén (16)
Laureles-Estadio (11) × Robledo (7)San Javier (13)La América (12) × San Javier (13)
Laureles-Estadio (11) × Guayabal (15)El Poblado (14)San Javier (13) × Santa Cruz (2)
La America (12) × San Javier (13)Guayabal (15)San Javier (13) × Robledo (7)
San Javier (13) × San Antonio de Prado (80)Belén (16)Belén (16) × San Javier (13)
Table 5. Ration of Gini index values for accessibility to jobs in relation to travel time and travel cost.
TimeTransport ModeRatio-GR1/GR2Ratio-PT/IT (GR1)Ratio-PT/IT (GR2)Travel CostRatio-GR1/GR2Ratio-PT/IT (GR1)Ratio-PT/IT (GR2)
20 minPublic transport1.083.021.412000 Colombian pesos0.7753.126.08
Individual transport0.511.511
30 minPublic transport1.013.073.462420 Colombian pesos0.9040.982.21
Individual transport1.142.038
40 minPublic transport1.150.555.522840 Colombian pesos1.4831.243.33
Individual transport11.564.0
60 minPublic transport0.052.0022.004000 Colombian pesos0.6670.400.17
Individual transport 0.600.278
Source: Prepared by the authors.
Publisher’s Note: MDPI stays neutral with regard to jurisdictional claims in published maps and institutional affiliations.

