Article

Impacts of Climate and Phenology on the Yields of Early Mature Rice in China

1
College of Water Sciences, Beijing Normal University, Beijing 100875, China
2
Key Laboratory of Land Surface Pattern and Simulation, Institute of Geographic Sciences and Natural Resources Research, Chinese Academy of Sciences, Beijing 100101, China
3
CAS Center for Excellence in Tibetan Plateau Earth Sciences, Chinese Academy of Sciences (CAS), Beijing 100101, China
4
College of Agricultural and Biological Engineering, Heze University, Heze 274015, China
5
School of Environmental Design and Rural Development, University of Guelph, Guelph, ON N1G2W5, Canada
6
Département de Géographie, Université de Montréal, Montréal, QC H2V2B8, Canada
7
Plants and Ecosystems Research Group (PLECO), University of Antwerp, B-2106 Antwerp, Belgium
*
Authors to whom correspondence should be addressed.
Sustainability 2020, 12(23), 10133; https://doi.org/10.3390/su122310133
Submission received: 16 October 2020 / Revised: 28 November 2020 / Accepted: 1 December 2020 / Published: 4 December 2020
(This article belongs to the Special Issue Agricultural Innovation and Sustainable Development)

Abstract

:
Phenological variables are closely correlated with rice (Oryza sativa L.) yields as they play important roles in influencing and controlling the carbon allocations between plant organs, but their impacts on rice yields and their relative importance compared with climatic variables are not yet well investigated. In this study, the impacts and the relative importance of climatic and phenological variables on the yields of early mature rice were assessed using the trial data from 75 agricultural stations across China, spanning from 1981–2010. We found that both daily maximum (Tmax) and daily minimum (Tmin) temperatures during the growing season (from transplanting to maturity) increased significantly, while sunshine duration (SD) and precipitation (Prep) did not change significantly. The average transplanting date was advanced by 3.18 days/decade, and the heading (maturity) dates were delayed by 2.47 (4.55) days/decade, with yields significantly increased by 9.65 g/m3 per decade across all sites. Partial correlation coefficients between most phenological variables and rice yields were negative, whereas most of the climatic variables were positively correlated with rice yields. The average of partial correlation coefficients between transplanting, heading, and maturity dates and rice yields were −0.10, −0.15, and −0.01, respectively, and the average of coefficients between Tmax, Tmin, SD, and Prep and rice yields were 0.08, 0.02, 0.12, and −0.05, respectively. Interestingly enough, phenological variables were the dominating influencing factors on rice yields at 63% of the sites, suggesting that the relative importance of phenology to rice yields may be even higher than that of climate. The climatic variables were closely correlated with rice yields as they are fundamental growth materials for crops, and phenological variables strongly influenced the growth and development of rice. Our results highlight that phenology should be precisely evaluated in crop models to improve the accuracy of simulating their response to climate change. Furthermore, due to limited understanding of phenological processes, manipulative experiments are urgently needed to comprehensively improve our understanding of rice phenology and rice yield response to ongoing climate change.

1. Introduction

The average global temperature has increased by roughly 1 °C since 1950, and such warming and associated climatic changes have been demonstrated to influence agricultural growth, limiting potential production and threatening global food availability and stability [1,2,3,4]. The Intergovernmental Panel on Climate Change (IPCC) has released a special report on the impacts of global warming of 1.5 °C above preindustrial levels between 2030 and 2050 [5,6,7,8,9]. Many studies have shown that a warming climate could reduce agricultural yields by accelerating development and shortening the growth duration of crops [10,11,12,13]. Meanwhile, phenological shifts are also important ecological indicators that influence crop growth and determine agricultural yields [14,15,16]. Phenological variables are very important indicators for rice yields as they occupy fundamental roles in dominating and controlling the carbon allocation between plant organs [17,18,19,20]. However, the impacts of phenological variables on crop yields and their relative importance compared with climatic variables are seldomly evaluated or investigated. Therefore, it is essential to quantitatively study the response of crop phenology, yield, and agricultural productivity to climate change and to quantify the relative importance of phenology and climate on crop yields. Meanwhile, it is of great importance to improve our understanding of how to acknowledge crop development, optimize field management, and take adaptive measures to mitigate the negative effects under an ongoing changing climate.
The impacts of climate change on agricultural production may be more apparent in developing countries because of their greater reliance on agriculture and the lack of advanced management practices [21,22,23]. Guo et al. simulated the yields of rice from 2016 to 2099 in Zhejiang province, China, and the results implied that the rice yields would be inevitably reduced by the warming climate [24]. Xu et al. modeled the spatial and temporal change of rice yields in the Sichuan Basin, China, and the results indicated that adaptive measures should be adopted in the near future to countermeasure the negative impacts of the warming climate [25]. Peng et al. investigated the trends of arable land, consumer demand, and climate change in China during the past decades and found that new technology should be adopted to improve rice production to meet future food demand in the 2030s [26]. Liu et al. found that the change of phenology of spring and winter wheat in China was closely influenced by climate change [27]. As the largest developing economy, China feeds 22% of the world’s population with only 9% of the world’s arable land [28]. A warming climate has been detected here and is expected to continue for decades; thus, investigating and understanding the mechanisms of climate change and phenology on agricultural production in China should be a high priority [29,30,31,32,33].
Studies based on large-scale analyses have tried to investigate the mechanisms of climate change on crop growth and yields using process-based simulation models. However, these models are commonly limited by the uncertainties in predictions of the overall conditions of crop growth, and they cannot incorporate all circumstances, such as pest control and extreme weather [34,35,36,37,38,39,40,41]. In addition, crop models can simulate the impacts of climate change only with defined cultivar characteristics, management practices, soil properties, and initial conditions. Moreover, the crop models can hardly simulate all circumstances under the changing climate, such as changes in sowing dates, crop varieties, and management practices. Crop trial data usually contain crop cultivars, phenology dates, yields, and management practices, as well as weather information [42]. Over the past few decades, statistical approaches, integrated with the long time series of high-quality crop trial data, have been applied to understand the impacts of climate change variability on crop growth and yields [43,44]. The statistical approaches have been quite suitable for investigating how both climate change and phenology have affected crop growth and yield by removing the impact of other influencing variables [45]. Thus, the high-quality data, combined with the statistical approaches, have provided a chance to explore the inner mechanism of impacts of climate and phenology on crops. Tao et al. assessed the impacts of climate change on rice using partial correlation analysis and found that growth duration was prolonged by changing rice cultivars and the rice yields were significantly influenced by climate change [46]. Wang et al. calculated growing degree day (GDD) data and evaluated the impacts of climate change on rice; then, the linear regression method was conducted to explore the constraints factors to rice yields [47]. Pirjo et al. explored the coincidence of changes in yields of rice and variations of climate in Europe using statistical methods, including linear regression analysis and random coefficient regression [48]. Although previous studies have explored the impacts of climate change on rice growth and rice yield using statistical approaches with long-time trial data, their research only focused on the impacts of climate on agricultural production. The influences from phenology were ignored, and, therefore, the results can hardly reveal the real mechanisms of climate change or phenology impacts on agricultural production. In agriculture, phenology represents an important indicator that controls crop growth, which will further impact agricultural production [49,50,51]. However, almost no studies have calculated the relative importance of phenological variables on rice yields rather than that of climatic variables. Therefore, some concerns need to be explored, such as the impacts of phenology on rice yields, and the relative importance of phenological variables (transplanting, heading, and maturity dates) to rice yields compared with climatic variables (temperature, precipitation, sunshine durations). Since the phenology impacts on agricultural production are unknown and the relative importance between phenology and climate is unknown, it is of vital importance to improve the understanding of the potential correlation relationships between phenology and agricultural production.
In this study, long-term trial data, including climate, phenology, and yields of early mature rice spanning the years from 1981 to 2010 from 75 agricultural meteorological stations across China, were adopted for data analysis. The stations are evenly distributed across two major rice cultivation regions in southern China. Climatic data from weather stations included the temperature, sunshine duration, and precipitation. Phenology data contained the transplanting, heading, and maturity dates. The yield of early mature rice was observed and recorded in the format of kg/ha by professional technical workers. We aim here to (1) explore spatial and temporal changes and trends in phenology, climate, and yield of early mature rice over the past three decades; (2) quantify the relative importance of phenological and climatic variables to yields of early mature rice using partial correlation analysis.

2. Materials and Methods

2.1. Rice Trial Data and Climate

The study area included two major early-mature rice production regions in China, of which one is in the middle and lower reaches of the Yangtze River (YZ) and the other is in the Pearl River Delta (PRD). The YZ region contains Anhui, Jiangxi, Zhejiang, Hubei, and Hunan provinces (49 sites), and the PRD region contains the Guangdong and Guangxi provinces (26 sites; Figure 1). These agro-meteorological experimental stations are maintained by professional agricultural technicians following standardized observation criteria and strictly prescribed procedures under the control of the Chinese Meteorological Administration (CMA) [52].
The long trial data of early mature rice contains the information of rice cultivars, transplanting dates, heading dates, maturity dates, yields, and management practices at each site. Therefore, these data provided us with a unique chance to match weather variables with farm-specific planting and harvesting dates and rice growth phases for every year. At the same time, the data were all very valuable for investigating the impacting mechanisms from climate change and phenology on rice yields. The average transplanting and maturity dates of the sites were, respectively, 114 and 175 (day of year, DOY) for early mature rice. The rice was well irrigated and fertilized during the growth periods, with strict pest control. The detailed phenological records of transplanting, heading, and maturity dates in DOY format at 75 sites from 1981 to 2010 were selected as the phenological events to be investigated for determining the relationships between phenology and the yields of early mature rice. The climate data containing daily maximum (Tmax) and daily minimum (Tmin) temperatures, sunshine duration (SD), and precipitation (Prep) of each site during the growing seasons from 1981 to 2010 were obtained from the China Meteorological Data Sharing Service System (http://data.cma.cn/). The climatic data were applied for investigating the impacts of climate on rice yields and its relative importance compared with phenology.

2.2. Data Analysis Method

The agro-meteorological experimental stations with more than five years of records of crop growth and weather parameters were selected for further data analysis. The rice growth period (RGP) was defined as the days between transplanting dates and maturity dates of early mature rice; the average values of the climatic variables (Tmax, Tmin, SD, and Prep) during RGPs of all sites were calculated. Then, the linear regression method (LRM) was applied to investigate the change of climatic variables during RGPs from 1981 to 2010 [53,54,55]. Similarly, to identify the temporal changes in phenology and yields of early mature rice during the past decades, the average dates of the phenological variables (transplanting dates, heading dates, and maturity dates) and yields of all sites were calculated as well. Meanwhile, LRM was also applied to show the temporal changes.
To investigate the correlations between phenological variables and climatic variables during RGPs and annual yields across all sites, the yields and phenological variables were linearly detrended to counter the effects that were due to the differences in rice cultivars and management practices. The climatic variables of Tmax and Tmin were accumulated during RGPs at each site over the study period, and the climatic variables of SD and Prep were averaged. Partial correlation analysis was applied to investigate the relationship between the detrended yields and the three detrended phenological variables (transplanting, heading, and maturity dates) and the four detrended climatic variables (Tmax, Tmin, SD, and Prep) during the period 1981–2010, respectively. The absolute values of coefficients of the partial correlation analysis were calculated, and the coefficients (phenological or climatic variable) with the highest absolute value were confirmed as the main influencing factor for each site. For each site, there was only one dominating influencing factor that was most correlated with rice yields, and the spatial distribution of the main influencing factor for each site was obtained. Then, the relative importance of phenological and climatic variables was calculated using the percentage of the number of total dominating phenological variables (climatic) of all sites.

3. Results

3.1. Change and Trend of Climatic Variables during Rice Growth from 1981–2010

The average values of the climatic variables (Tmax, Tmin, SD, and Prep) at all sites during RGPs from 1981–2010 are shown in Figure 2. The ratios of the equation using LRM were 0.052 and 0.040 for Tmax (p < 0.01) and Tmin (p < 0.01), which meant that the average daily temperatures increased significantly during RGPs over the study period, and the increasing trend of average daily Tmax was a slightly higher than Tmin. The increasing temperature may indicate that a warming climate is occurring in most of the sites in China, which may have influenced the yields of early mature rice. In contrast, decreasing trends in SD and Prep were detected using LRM, but the p-values were not significant.

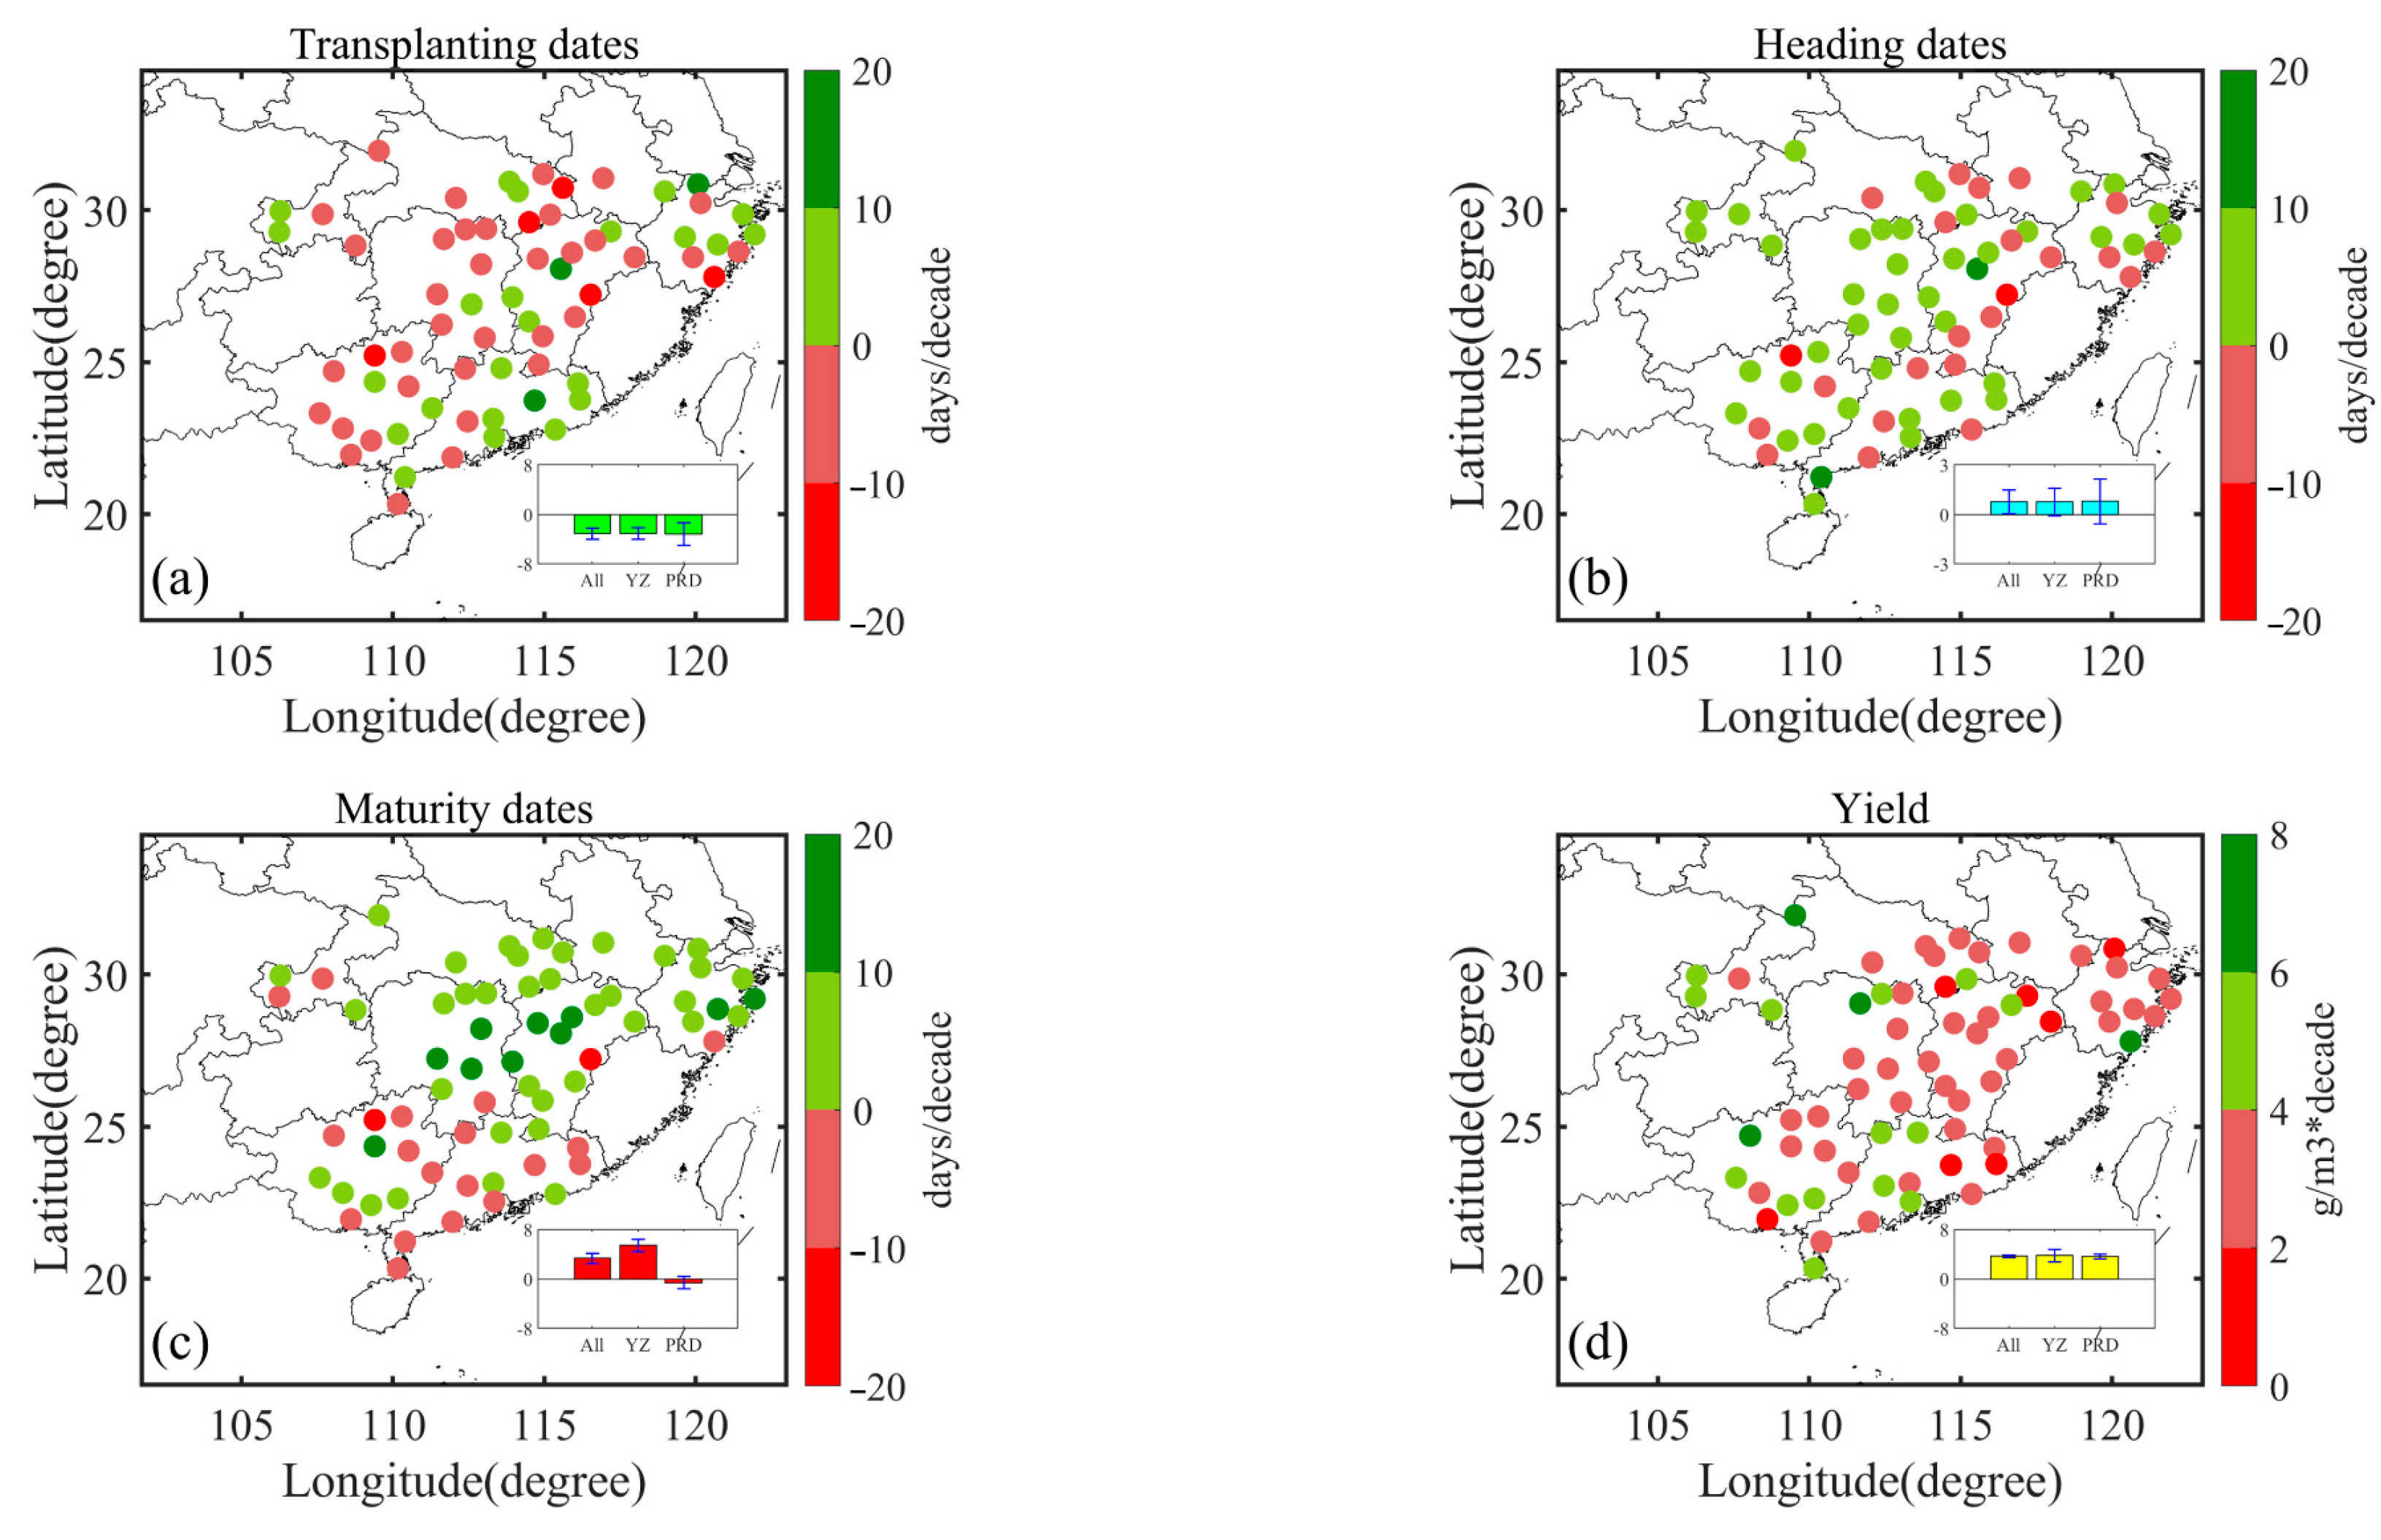
3.2. Averages and Trends of Phenological Variables of Rice

The average dates of the phenological variables (transplanting, heading, and maturity dates) and yields of early mature rice at each site during the study period were obtained (Figure 3). The average transplanting date was 114.94, 110.19, and 123.63 day of year (DOY) for all sites, YZ, and PRD, respectively. Similarly, the average heading date was 175.38, 172.94, and 181.26 DOY for all sites, YZ, and PRD, respectively, with the average maturity date being 197.89, 193.74, and 205.20 DOY, respectively. It can be concluded that the phenological variables of all sites in PRD were commonly later than those in YZ. The average value of yields was 910.59, 806.78, and 580.61 g/m3 for all sites, YZ, and PRD, respectively. The average yield at sites in YZ was generally higher than those in PRD.
Using LRM, the trends of phenological variables and yields of all sites during the study period were calculated (Figure 4). The average trends of transplanting dates for all sites, YZ, and PRD were −3.18, −3.11, and −3.15 days/decade, respectively. The average trend of heading dates for all sites, YZ, and PRD were 0.58, 0.76, and 0.78 days/decade, respectively. The average trend of maturity dates for all sites, YZ, and PRD, were 2.47, 5.39, and −0.63 days/decade, respectively. The average trends of yields for all sites, YZ, and PRD were 4.55, 3.90, and 9.65 g/m3 per/decade, respectively. The spatial results in Figure 4 indicate that transplanting dates at most sites had advanced, while all heading dates and maturity dates were delayed over the study period.

3.3. Partial Correlation Analysis

Since the impacts of three phenological variables (transplanting, heading, and maturity dates) and four climatic variables (Tmax, Tmin, SD, and Prep) were relatively large, these seven variables were selected to confirm the main influencing factors using the method introduced in the Methods section. The detailed results are shown in Figure 5, in which the dominating phenological (climatic) variables are shown in green (red) to show the different main influencing factors, respectively. Since there had been misalignments of the phenological variables, climatic variables, and yields, only 44 sites were chosen for the final results in this analysis. The phenological variables painted with green are the dominating influencing factors compared with climatic variables painted with red, which correlate with the yields of early mature rice. Thus, the phenological variables (transplanting, heading, and maturity dates) played important roles in influencing rice yields at most sites in China during the study period. When undertaking a deeper investigation, sites in PRD were found to be most impacted by phenological variables, while sites in YZ were impacted by both phenological and climatic variables.
The average partial correlation coefficients between phenological variables, climatic variables, and yields were calculated (Figure 6). For all sites, the calculated coefficients of transplanting, heading, and maturity dates were −0.10, −0.15, and −0.01, respectively. The transplanting date had advanced at most sites, and the negative relationship may indicate that the transplanting date would have increased rice production. Meanwhile, the delayed phenological variables of heading and maturity dates and their negative relationships imply that they would have reduced rice production. In contrast, the average coefficients of Tmax, Tmin, SD, and Prep were 0.08, 0.02, 0.12, and −0.05, respectively, which implied that most climatic variables positively influenced rice yields and increased rice production. The average value of the coefficients was different for the two regions, and the phenological variables were all negative for YZ; the heading date was the only factor that was negatively correlated with yields for PRD. Thus, the influencing mechanisms of phenological variables on rice yield appear to be different for YZ and PRD. The influencing mechanisms of climatic variables on rice yield were also different, and the impacts of Tmax, SD, and Prep were all positive to rice yields, while Tmin was in a negative relationship with rice yields. Tmax was in a positive relationship with rice yields, perhaps because Tmax had not reached the highest temperature threshold for rice growth and development. SD and Prep promoted rice production, while Tmin may have reduced the yield of early mature rice by putting stress on sites in YZ. Tmin and SD were both in positive relationships with rice yields in PRD, indicating they had increased rice yields, while the negative Tmax may indicate the yield here was affected by stress from high temperatures and lack of water. In total, the phenological indicators played important roles, which were even greater than those of climatic variables, in affecting rice yields.
To better investigate and confirm the dominating influencing factor on rice yields at each site, the absolute values of the coefficients of all variables were calculated and their relative importance was obtained. In order to better present relative importance, the results were classified into two categories: phenology and climate (Figure 7). The green color represents the phenological variables, while the red color represents the climatic variables. It can be clearly acknowledged that the sum of phenological variables was almost equal to the sum of climatic variables for all sites. However, for the two regions, the situations were significantly related to different influencing mechanisms. Phenological variables were the dominating influencing factors that actually played more important roles than climatic variables in YZ, while climatic variables were the dominating influencing factors that were more important than phenological variables in PRD.

4. Discussion

4.1. Spatial Changes of Phenological Variables and Impacts on Early Mature Rice during 1981–2010

Detailed trial data of early mature rice from the past three decades have been analyzed to investigate the impacts of multiple phenological variables on yields during these past decades under the changing climate. In this study, the rice at all sites were all transplanted after seeding at most sites; thus, the phenological variables have played important roles in affecting rice growth and rice yields. The change of phenological variables at 75 sites were used for the analysis, and it was found that the average transplanting date had advanced by 3.18 days/decade for early mature rice. This finding was consistent with previous studies that had also detected the advance of transplanting dates [49]. However, delayed dates in heading and maturity for early mature rice were also detected in this research; these dates were not consistent with previous studies. The difference may be related to the inconsistent total number of sites and the inconsistent length of study periods. The advancement of transplanting dates may primarily reflect manual intervention, and the delayed heading and maturity dates may be due to the adoption of high-yielding rice varieties of rice cultivars, which rely more on the cumulative effect of growing degree days (GDDs) compared to the previous commonly adopted rice cultivars.
The partial correlation coefficients between phenological variables and rice yields showed that phenological variables had relatively important impacts on the yields of early mature rice. Phenological variables were the dominating influencing factors for the yields of early mature rice in nearly 63% of the sites. The results of this study are in line with previous studies, where the phenological variables are important indicators that control the carbon allocation between plant organs, and the phenological events are different forms that represent vegetative growth and reproductive growth periods [56]. Phenological variables divided the whole growth period of rice into several different stages, and the carbon allocation of total organic matter to organs varied at different phenological durations. The negative impacts of earlier phenological variables on canopy radiation capture, biomass production, and grain yield for early mature rice were found, which were consistent with previous studies [57,58]. We further investigated the impacts of three important phenological events on rice yields and found that the phenological variables were negatively correlated with yields at most sites. The transplanting dates had advanced; in other words, the transplanting dates were earlier than in normal practice. Thus, it was likely that the earlier transplanting dates increased the potential risk of cold damage during rice reproduction stages, and the rice may have suffered from cooler temperatures during the growing periods of early mature rice. This result is consistent with a previous study on northern Japan, where cold stress on rice was found and negative impacts were also detected [59]. The delayed heading and maturity dates meant that these two phenological dates were mostly later than in normal practice. On the one hand, both Tmax and Tmin had increased significantly (p < 0.05), whereas the heading and maturity dates were prolonged rather than advanced. This may be due to an improvement of management practice and a change to new and advanced rice cultivars that have longer development periods [60]. The delayed heading and maturity dates may indicate that the rice may suffer from high-temperature stress during the important growth stages of early mature rice.
Even though partial correlation analysis was applied to exclude the effects of climatic variables when analyzing phenological impacts on rice yields, there were still uncertainties regarding management practice, weather variability, insects, and disease that could modify the trend and correlation analyses. It was quite difficult to isolate the influence of a single factor from the phenological variables that have influenced rice yields. For example, crop yields may have increased because of the increased usage of modern cultivars and technology during the study period. If so, the estimated decreases (increases) in crop productivity may be larger (smaller) than our estimates. Although there were limitations, we found that the phenological variables were all negatively correlated with the rice yields of early mature rice and the phenological variables had significantly affected the growth and yields of early mature rice. Since uncertainties still remain as to the method of statistics, we suggest that control experiments should be conducted to better investigate the causal mechanisms between climate, phenology, and rice yields in future related studies.

4.2. Spatial Changes of Climatic Variables and Impacts on Early Mature Rice during 1981–2010

Tmax and Tmin were significantly increased during the rice growth periods at all sites, and the detected ratio of Tmax was about 1.3 times of the corresponding Tmin during 1981–2010. Our finding was consistent with previous studies, where the increased rate of minimum temperature was found to be less than twice the increased rate of the corresponding maximum temperature during 1981–2000 and general warming trends were found during all growth periods across most sites [61]. Partial correlation analysis using data from all sites showed that both Tmax and Tmin were positively correlated with rice yields for all sites. Figure 1 shows the detailed locations of YZ and PRD, where YZ is in the subtropical region, while PRD is in the tropical region. The meteorological information shown in Figure A1 and Figure A2 implies that there were different basic climatic variables and different trends in those two regions (YZ and PRD) during the study period. The results displayed in Figure 6 showed the Tmax was positively correlated with rice yields in YZ, while it was negatively correlated in PRD. This can be explained by the fact that the most suitable temperature interval for rice growth is from 27 to 32 °C, whereas the average Tmax in YZ was 22.07 °C; thus, Tmax was far from the threshold of maximum temperature for rice growth. Since rice is a thermophilic crop, a suitable temperature in daylight will benefit rice growth and accumulate dry matter [62]. For Tmin, there is evidence that when Tmin of pollen mother cells in the meiosis stage (microspore stage and meiosis fine line stage) is lower than 15–17 °C, it causes the degeneration of spikelets, inducing an increase in false grains and resulting in the delay of heading. The average Tmin of YZ (14.17 °C) was below the minimum threshold of temperature that can maintain the growth of early mature rice. The mechanism of temperature influence on rice yields was totally different in PRD because the basic temperature of PRD was about 5 °C higher than that in YZ; Tmax here was 26.15 °C and probably higher than the threshold of maximum temperature that rice can stand during the whole growth period of one single year. The rice in YZ was mostly influenced by the cold stress of Tmin, while the rice in PRD was mostly influenced by the heat stress of Tmax. This is consistent with a previous study, where the negative impacts on rice yields from cold stress were detected despite the consideration of CO2 fertilization effects [63]. The mechanisms of Tmax and Tmin in influencing rice growth and rice yields are totally different. Further investigations of the effects of temperature (Tmax and Tmin) on the physiological processes governing rice growth and the impact on rice yields should be adopted; further analysis of adaptive measures should also be equally developed.
Similar to temperature, the average and trends of SD and precipitation for YZ and PRD were also different. Sun-loving rice is a C3 plant, and it does not have a critical light length for panicles, which requires higher light conditions than other crops, but its photosynthesis with an increase in illumination is not as obvious as that of C4 corn. The results of this study show that the average SD was 4.52 and 4.48 (hours/day) for YZ and PRD, respectively, and the SDs were in positive relationships with rice yields in both YZ and PRD. Even though the trend of SD of YZ in Figure A1 shows that the length of SD was decreasing, there was no doubt that SD was promoting rice growth and yields of early mature rice. As to the increasing trend of SD in PRD, shown in Figure A2, this means that SD will constantly be conducive to rice development. There is no doubt that the SD was promoting rice growth and rice yields in both YZ and PRD. Paddy rice wis the dominant agricultural crop in most sites, and the average precipitation was 3.93 and 4.62 (mm/day) in YZ and PRD, respectively. Precipitation was positively correlated with rice yields at sites in YZ because the rice here had suffered from water stress for a short period. However, PRD is full of water, and it was not likely that the rice had a lack of water there. More precipitation means less sunshine length at sites in this region. Thus, the impacts of precipitation on rice yields were also different in YZ and PRD. In this study, the climatic variables were each analyzed using partial correlation with yields; the climatic variables were highly intercorrelated with each other. In other words, Tmax and Tmin were correlated, and SD and precipitation were also correlated. We recommend the performance of integrated research instead of the impacts of single factors on rice yields when analyzing agricultural applications.

5. Conclusions

In this study, a significantly increasing trend of temperature was detected at most sites, whereas the not-significant decreasing trends of sunshine and precipitation were detected. Phenological variables, including transplanting, heading, and maturity dates, had significantly influenced the growth and yields of early mature rice in China. The phenological variables were actually controlling the carbon allocation between plant organs, which further influenced rice growth. Since the phenological variables of agriculture are controlled by both the changing climate and the improvement of management practices, the adaptation of better transplanting dates, which are mainly controlled by farmers, should be further explored. Climatic variables are also important as they are fundamental materials for maintaining the growth of rice. Heat stress was detected in PRD and cold stress was detected in YZ. SD increased the yields at most sites, and precipitation was positively correlated with rice yields in YZ but negatively correlated in PRD. The mechanisms were different for YZ and PRD because their basic climatic variables and trends were different. Although there were limitations and uncertainties arising from management practices, rice cultivars, and pests, this study provides empirical evidence that phenological variables (transplanting, heading, and maturity dates) are relatively important compared with climatic variables as they are responsible for carbon allocation. We also propose that more advanced statistical techniques, such as machine learning and deep learning, integrated with mechanism approaches such as crop models and combined with additional techniques such as remote sensing, should be used for the deeper investigation of impacts from both phenological and climatic variables as we are supposed to raise agricultural production by adjusting management practices and rice cultivars under the ongoing warming climate changes in temperature and precipitation.

Author Contributions

Conceptualization, Y.G. and W.W.; methodology, Y.G. and Y.F.; software, Y.G.; validation, Y.G., Y.L., Z.W. and X.G.; formal analysis, Y.G., X.G., Y.Z. and C.R.B.; investigation, Y.G., Z.W., X.G. and Y.Z.; resources, Y.G., W.W. and Y.F.; data curation, Y.G., W.W. and Y.L.; writing—original draft preparation, Y.G.; writing—review and editing, Y.G., W.W. and Y.F.; visualization, Y.G., Z.W., X.G. and Y.Z.; supervision, W.W. and Y.F.; project administration, W.W. and Y.F.; funding acquisition, W.W. and Y.F. All authors have read and agreed to the published version of the manuscript.

Funding

This study was supported by the General Program of the National Nature Science Foundation of China (Grant No. 31770516), the National Key Research and Development Program of China (2017YFA06036001), and the 111 Project (B18006) and Fundamental Research Funds for the Central Universities (2018EYT05).

Acknowledgments

We would like to express our deepest gratitude to Hongyong Sun, who has provided us with valuable assistance in the writing of the original manuscript.

Conflicts of Interest

The authors declare no conflict of interest.

Appendix A

Figure A1. Trends of Tmax, Tmin, SD, and Prep across sites in YZ during the period 1981–2010. Note: (ad) represents Tmax, Tmin, SD, and Prep, respectively.
Sustainability 12 10133 g0a1
Figure A2. Trends of Tmax, Tmin, SD, and Prep across sites in PRD during the period 1981–2010. Note: (ad) represents Tmax, Tmin, SD, and Prep, respectively.
Sustainability 12 10133 g0a2

References

  1. Piao, S.; Ciais, P.; Huang, Y.; Shen, Z.; Peng, S.; Li, J.; Zhou, L.; Liu, H.; Ma, Y.; Ding, Y. The impacts of climate change on water resources and agriculture in China. Nature 2010, 467, 43–51. [Google Scholar] [CrossRef] [PubMed]
  2. Lobell, D.B.; Schlenker, W.; Costa-Roberts, J. Climate trends and global crop production since 1980. Science 2011, 333, 616–620. [Google Scholar] [CrossRef] [PubMed] [Green Version]
  3. Peng, S.; Huang, J.; Sheehy, J.E.; Laza, R.C.; Visperas, R.M.; Zhong, X.; Centeno, G.S.; Khush, G.S.; Cassman, K.G. Rice yields decline with higher night temperature from global warming. Proc. Natl. Acad. Sci. USA 2004, 101, 9971–9975. [Google Scholar] [CrossRef] [PubMed] [Green Version]
  4. Fu, Y.H.; Zhao, H.; Piao, S.; Peaucelle, M.; Peng, S.; Zhou, G.; Ciais, P.; Huang, M.; Menzel, A.; Peñuelas, J. Declining global warming effects on the phenology of spring leaf unfolding. Nature 2015, 526, 104–107. [Google Scholar] [CrossRef] [Green Version]
  5. Hoegh-Guldberg, O.; Jacob, D.; Taylor, M.; Bindi, M.; Brown, S.; Camilloni, I.; Diedhiou, A.; Djalante, R.; Ebi, K.L.; Engelbrecht, F. Impacts of 1.5 °C global warming on natural and human systems. In Global Warming of 1.5 °C: An IPCC Special Report on the Impacts of Global Warming of 1.5 °C Above Pre-Industrial Levels and Related Global Greenhouse Gas Emission Pathways, in the Context of Strengthening the Global Response to the Threat of Climate Change, Sustainable Development, and Efforts to Eradicate Poverty; Intergovernmental Panel on Climate Change: Geneva, Switzerland, 2018. [Google Scholar]
  6. Masson-Delmotte, V. Global Warming of 1.5 °C: An IPCC Special Report on the Impacts of Global Warming of 1.5 C above Pre-Industrial Levels and Related Global Greenhouse Gas Emission Pathways, in the Context of Strengthening the Global Response to the Threat of Climate Change, Sustainable Development, and Efforts to Eradicate Poverty; World Meteorological Organization: Geneva, Switzerland, 2018. [Google Scholar]
  7. You, Q.; Wu, F.; Shen, L.; Pepin, N.; Jiang, Z.; Kang, S. Tibetan Plateau amplification of climate extremes under global warming of 1.5 °C, 2 °C and 3 °C. Glob. Planet. Chang. 2020, 192, 103261. [Google Scholar] [CrossRef]
  8. Shkolnik, I.; Pavlova, T.; Efimov, S.; Zhuravlev, S. Future changes in peak river flows across northern Eurasia as inferred from an ensemble of regional climate projections under the IPCC RCP8. 5 scenario. Clim. Dyn. 2018, 50, 215–230. [Google Scholar] [CrossRef]
  9. Xu, Y.; Ramanathan, V.; Victor, D.G. Global Warming Will Happen Faster Than We Think; Nature Publishing Group: Berlin, Germany, 2018. [Google Scholar]
  10. Zhang, T.; Huang, Y.; Yang, X. Climate warming over the past three decades has shortened rice growth duration in China and cultivar shifts have further accelerated the process for late rice. Glob. Chang. Biol. 2013, 19, 563–570. [Google Scholar] [CrossRef]
  11. Hu, X.; Huang, Y.; Sun, W.; Yu, L. Shifts in cultivar and planting date have regulated rice growth duration under climate warming in China since the early 1980s. Agric. For. Meteorol. 2017, 247, 34–41. [Google Scholar] [CrossRef]
  12. He, L.; Asseng, S.; Zhao, G.; Wu, D.; Yang, X.; Zhuang, W.; Jin, N.; Yu, Q. Impacts of recent climate warming, cultivar changes, and crop management on winter wheat phenology across the Loess Plateau of China. Agric. For. Meteorol. 2015, 200, 135–143. [Google Scholar] [CrossRef]
  13. Ye, T.; Zong, S.; Kleidon, A.; Yuan, W.; Wang, Y.; Shi, P. Impacts of climate warming, cultivar shifts, and phenological dates on rice growth period length in China after correction for seasonal shift effects. Clim. Chang. 2019, 155, 127–143. [Google Scholar] [CrossRef] [Green Version]
  14. ur Rehman, H.; Nawaz, Q.; Basra, S.M.A.; Afzal, I.; Yasmeen, A. Seed priming influence on early crop growth, phenological development and yield performance of linola (Linum usitatissimum L.). J. Integr. Agric. 2014, 13, 990–996. [Google Scholar] [CrossRef] [Green Version]
  15. Xiao, D.; Moiwo, J.P.; Tao, F.; Yang, Y.; Shen, Y.; Xu, Q.; Liu, J.; Zhang, H.; Liu, F. Spatiotemporal variability of winter wheat phenology in response to weather and climate variability in China. Mitig. Adapt. Strateg. Glob. Chang. 2015, 20, 1191–1202. [Google Scholar] [CrossRef]
  16. Sanchez, B.; Rasmussen, A.; Porter, J.R. Temperatures and the growth and development of maize and rice: A review. Glob. Chang. Biol. 2014, 20, 408–417. [Google Scholar] [CrossRef] [PubMed]
  17. Sacks, W.J.; Kucharik, C.J. Crop management and phenology trends in the US Corn Belt: Impacts on yields, evapotranspiration and energy balance. Agric. For. Meteorol. 2011, 151, 882–894. [Google Scholar] [CrossRef]
  18. Brüggemann, N.; Gessler, A.; Kayler, Z.E.; Keel, S.; Badeck, F.W.; Barthel, M.; Boeckx, P.; Buchmann, N.; Brugnoli, E.; Esperschütz, J. Carbon allocation and carbon isotope fluxes in the plant-soil-atmosphere continuum: A review. Biogeosci. Discuss. 2011, 8, 3619–3695. [Google Scholar] [CrossRef] [Green Version]
  19. Litton, C.M.; Raich, J.W.; Ryan, M.G. Carbon allocation in forest ecosystems. Glob. Chang. Biol. 2007, 13, 2089–2109. [Google Scholar] [CrossRef] [Green Version]
  20. Guo, Y.; Fu, Y.; Hao, F.; Zhang, X.; Wu, W.; Jin, X.; Robin Bryant, C.; Senthilnath, J. Integrated phenology and climate in rice yields prediction using machine learning methods. Ecol. Indic. 2021, 120, 106935. [Google Scholar] [CrossRef]
  21. Mirza, M.M.Q. Climate change and extreme weather events: Can developing countries adapt? Clim. Policy 2003, 3, 233–248. [Google Scholar] [CrossRef]
  22. Mertz, O.; Halsnæs, K.; Olesen, J.E.; Rasmussen, K. Adaptation to climate change in developing countries. Environ. Manag. 2009, 43, 743–752. [Google Scholar] [CrossRef] [Green Version]
  23. Müller, C.; Cramer, W.; Hare, W.L.; Lotze-Campen, H. Climate change risks for African agriculture. Proc. Natl. Acad. Sci. USA 2011, 108, 4313–4315. [Google Scholar] [CrossRef] [Green Version]
  24. Guo, Y.; Wu, W.; Du, M.; Bryant, C.R.; Li, Y.; Wang, Y.; Huang, H. Assessing potential climate change impacts and adaptive measures on rice yields: The case of zhejiang province in China. Sustainability 2019, 11, 2372. [Google Scholar] [CrossRef] [Green Version]
  25. Xu, C.-C.; Wu, W.-X.; Ge, Q.-S.; Zhou, Y.; Lin, Y.-M.; Li, Y.-M. Simulating climate change impacts and potential adaptations on rice yields in the Sichuan Basin, China. Mitig. Adapt. Strateg. Glob. Chang. 2017, 22, 565–594. [Google Scholar] [CrossRef]
  26. Peng, S.; Tang, Q.; Zou, Y. Current status and challenges of rice production in China. Plant Prod. Sci. 2009, 12, 3–8. [Google Scholar] [CrossRef] [Green Version]
  27. Liu, Y.; Chen, Q.; Ge, Q.; Dai, J.; Qin, Y.; Dai, L.; Zou, X.; Chen, J. Modelling the impacts of climate change and crop management on phenological trends of spring and winter wheat in China. Agric. For. Meteorol. 2018, 248, 518–526. [Google Scholar] [CrossRef]
  28. Li, G.; Zhao, Y.; Cui, S. Effects of urbanization on arable land requirements in China, based on food consumption patterns. Food Secur. 2013, 5, 439–449. [Google Scholar] [CrossRef]
  29. Li, Q.; Dong, W.; Li, W.; Gao, X.; Jones, P.; Kennedy, J.; Parker, D. Assessment of the uncertainties in temperature change in China during the last century. Chin. Sci. Bull. 2010, 55, 1974–1982. [Google Scholar] [CrossRef]
  30. Peaucelle, M.; Janssens, I.A.; Stocker, B.D.; Ferrando, A.D.; Fu, Y.H.; Molowny-Horas, R.; Ciais, P.; Peñuelas, J. Spatial variance of spring phenology in temperate deciduous forests is constrained by background climatic conditions. Nat. Commun. 2019, 10, 1–10. [Google Scholar] [CrossRef] [Green Version]
  31. Liu, Q.; Fu, Y.H.; Zhu, Z.; Liu, Y.; Liu, Z.; Huang, M.; Janssens, I.A.; Piao, S. Delayed autumn phenology in the Northern Hemisphere is related to change in both climate and spring phenology. Glob. Chang. Biol. 2016, 22, 3702–3711. [Google Scholar] [CrossRef]
  32. Bi, L.; Zhang, B.; Liu, G.; Li, Z.; Liu, Y.; Ye, C.; Yu, X.; Lai, T.; Zhang, J.; Yin, J.; et al. Long-term effects of organic amendments on the rice yields for double rice cropping systems in subtropical China. Agric. Ecosyst. Environ. 2009, 129, 534–541. [Google Scholar] [CrossRef]
  33. Liu, L.; Wang, E.; Zhu, Y.; Tang, L.; Cao, W. Effects of warming and autonomous breeding on the phenological development and grain yield of double-rice systems in China. Agric. Ecosyst. Environ. 2013, 165, 28–38. [Google Scholar] [CrossRef]
  34. Zhang, S.; Tao, F. Modeling the response of rice phenology to climate change and variability in different climatic zones: Comparisons of five models. Eur. J. Agron. 2013, 45, 165–176. [Google Scholar] [CrossRef]
  35. Xu, C.; Wu, W.; Ge, Q. Impact assessment of climate change on rice yields using the ORYZA model in the Sichuan Basin, China. Int. J. Climatol. 2018, 38, 2922–2939. [Google Scholar] [CrossRef]
  36. Zhao, J.; Yang, X. Distribution of high-yield and high-yield-stability zones for maize yield potential in the main growing regions in China. Agric. For. Meteorol. 2018, 248, 511–517. [Google Scholar] [CrossRef]
  37. Li, T.; Hasegawa, T.; Yin, X.; Zhu, Y.; Boote, K.; Adam, M.; Bregaglio, S.; Buis, S.; Confalonieri, R.; Fumoto, T.; et al. Uncertainties in predicting rice yield by current crop models under a wide range of climatic conditions. Glob. Chang. Biol. 2015, 21, 1328–1341. [Google Scholar] [CrossRef] [PubMed]
  38. Yuan, S.; Peng, S.; Li, T. Evaluation and application of the ORYZA rice model under different crop managements with high-yielding rice cultivars in central China. Field Crop. Res. 2017, 212, 115–125. [Google Scholar] [CrossRef]
  39. Zhang, T.; Yang, X.; Wang, H.; Li, Y.; Ye, Q. Climatic and technological ceilings for Chinese rice stagnation based on yield gaps and yield trend pattern analysis. Glob. Chang. Biol. 2014, 20, 1289–1298. [Google Scholar] [CrossRef] [PubMed]
  40. Chun, J.A.; Li, S.; Wang, Q.; Lee, W.-S.; Lee, E.-J.; Horstmann, N.; Park, H.; Veasna, T.; Vanndy, L.; Pros, K.; et al. Assessing rice productivity and adaptation strategies for Southeast Asia under climate change through multi-scale crop modeling. Agric. Syst. 2016, 143, 14–21. [Google Scholar] [CrossRef]
  41. Gaydon, D.S.; Probert, M.E.; Buresh, R.J.; Meinke, H.; Suriadi, A.; Dobermann, A.; Bouman, B.; Timsina, J. Rice in cropping systems—Modelling transitions between flooded and non-flooded soil environments. Eur. J. Agron. 2012, 39, 9–24. [Google Scholar] [CrossRef]
  42. Zhang, S.; Tao, F.; Zhang, Z. Changes in extreme temperatures and their impacts on rice yields in southern China from 1981 to 2009. Field Crop. Res. 2016, 189, 43–50. [Google Scholar] [CrossRef] [Green Version]
  43. Lobell, D.B.; Burke, M.B. On the use of statistical models to predict crop yield responses to climate change. Agric. For. Meteorol. 2010, 150, 1443–1452. [Google Scholar] [CrossRef]
  44. Zhang, T.; Zhu, J.; Yang, X.; Zhang, X. Correlation changes between rice yields in North and Northwest China and ENSO from 1960 to 2004. Agric. For. Meteorol. 2008, 148, 1021–1033. [Google Scholar] [CrossRef]
  45. Schlenker, W.; Roberts, M.J. Nonlinear temperature effects indicate severe damages to US crop yields under climate change. Proc. Natl. Acad. Sci. USA 2009, 106, 15594–15598. [Google Scholar] [CrossRef] [PubMed] [Green Version]
  46. Tao, F.; Zhang, Z.; Shi, W.; Liu, Y.; Xiao, D.; Zhang, S.; Zhu, Z.; Wang, M.; Liu, F. Single rice growth period was prolonged by cultivars shifts, but yield was damaged by climate change during 1981–2009 in China, and late rice was just opposite. Glob. Chang. Biol. 2013, 19, 3200–3209. [Google Scholar] [CrossRef] [PubMed]
  47. Wang, X.; Li, T.; Yang, X.; Zhang, T.; Liu, Z.; Guo, E.; Liu, Z.; Qu, H.; Chen, X.; Wang, L.; et al. Rice yield potential, gaps and constraints during the past three decades in a climate-changing Northeast China. Agric. For. Meteorol. 2018, 259, 173–183. [Google Scholar] [CrossRef]
  48. Peltonen-Sainio, P.; Jauhiainen, L.; Trnka, M.; Olesen, J.E.; Calanca, P.; Eckersten, H.; Eitzinger, J.; Gobin, A.; Kersebaum, K.C.; Kozyra, J. Coincidence of variation in yield and climate in Europe. Agric. Ecosyst. Environ. 2010, 139, 483–489. [Google Scholar] [CrossRef]
  49. Zhao, H.; Fu, Y.H.; Wang, X.; Zhao, C.; Zeng, Z.; Piao, S. Timing of rice maturity in China is affected more by transplanting date than by climate change. Agric. For. Meteorol. 2016, 216, 215–220. [Google Scholar] [CrossRef]
  50. Chmielewski, F.-M. Phenology in agriculture and horticulture. In Phenology: An Integrative Environmental Science; Springer: Berlin, Germany, 2013; pp. 539–561. [Google Scholar]
  51. Sadras, V.O.; Monzon, J.P. Modelled wheat phenology captures rising temperature trends: Shortened time to flowering and maturity in Australia and Argentina. Field Crop. Res. 2006, 99, 136–146. [Google Scholar] [CrossRef]
  52. Ying, M.; Zhang, W.; Yu, H.; Lu, X.; Feng, J.; Fan, Y.; Zhu, Y.; Chen, D. An Overview of the China Meteorological Administration Tropical Cyclone Database. J. Atmos. Ocean. Technol. 2014, 31, 287–301. [Google Scholar] [CrossRef] [Green Version]
  53. Kumaresan, M.; Riyazuddin, P. Factor analysis and linear regression model (LRM) of metal speciation and physico-chemical characters of groundwater samples. Environ. Monit. Assess. 2008, 138, 65–79. [Google Scholar] [CrossRef]
  54. Kumar, P.S.; Delson, P.D.; Vernon, J.; James, E. A linear regression model (LRM) for groundwater chemistry in and around the Vaniyambadi industrial area, Tamil Nadu, India. Chin. J. Geochem. 2013, 32, 19–26. [Google Scholar] [CrossRef]
  55. Mukherjee, A.; Ramachandran, P. Prediction of GWL with the help of GRACE TWS for unevenly spaced time series data in India: Analysis of comparative performances of SVR, ANN and LRM. J. Hydrol. 2018, 558, 647–658. [Google Scholar] [CrossRef]
  56. Huang, G.; Li, C.H.; Li, Y. Phenological responses to nitrogen and water addition are linked to plant growth patterns in a desert herbaceous community. Ecol. Evol. 2018, 8, 5139–5152. [Google Scholar] [CrossRef] [PubMed] [Green Version]
  57. Farrell, T.; Fukai, S.; Williams, R. Minimising cold damage during reproductive development among temperate rice genotypes. I. Avoiding low temperature with the use of appropriate sowing time and photoperiod-sensitive varieties. Aust. J. Agric. Res. 2006, 57, 75–88. [Google Scholar] [CrossRef]
  58. Tao, F.; Yokozawa, M.; Xu, Y.; Hayashi, Y.; Zhang, Z. Climate changes and trends in phenology and yields of field crops in China, 1981–2000. Agric. For. Meteorol. 2006, 138, 82–92. [Google Scholar] [CrossRef]
  59. Shimono, H. Earlier rice phenology as a result of climate change can increase the risk of cold damage during reproductive growth in northern Japan. Agric. Ecosyst. Environ. 2011, 144, 201–207. [Google Scholar] [CrossRef]
  60. Jiang, Y.; van Groenigen, K.J.; Huang, S.; Hungate, B.A.; van Kessel, C.; Hu, S.; Zhang, J.; Wu, L.; Yan, X.; Wang, L. Higher yields and lower methane emissions with new rice cultivars. Glob. Chang. Biol. 2017, 23, 4728–4738. [Google Scholar] [CrossRef] [PubMed]
  61. Li, X.; Jiang, L.; Meng, F.; Wang, S.; Niu, H.; Iler, A.M.; Duan, J.; Zhang, Z.; Luo, C.; Cui, S. Responses of sequential and hierarchical phenological events to warming and cooling in alpine meadows. Nat. Commun. 2016, 7, 1–8. [Google Scholar] [CrossRef] [PubMed] [Green Version]
  62. Krishnan, P.; Swain, D.K.; Chandra Bhaskar, B.; Nayak, S.K.; Dash, R.N. Impact of elevated CO2 and temperature on rice yield and methods of adaptation as evaluated by crop simulation studies. Agric. Ecosyst. Environ. 2007, 122, 233–242. [Google Scholar] [CrossRef]
  63. Shimono, H.; Okada, M.; Yamakawa, Y.; Nakamura, H.; Kobayashi, K.; Hasegawa, T. Rice yield enhancement by elevated CO2 is reduced in cool weather. Glob. Chang. Biol. 2007, 14, 276–284. [Google Scholar] [CrossRef]
Figure 1. Spatial distributions of agro-meteorological experimental stations across China. Note: The blue dots refer to agro-meteorological experimental stations; the thick lines represent the boundary of the nation and the thin lines represent the boundaries of the provinces; the shaded areas indicate the proportion of rice cultivation.
Sustainability 12 10133 g001
Figure 2. Trends of daily maximum temperature (Tmax), daily minimum temperature (Tmin), sunshine duration (SD), and precipitation (Prep) across all sites during the study period 1981–2010. Note: (ad) represents Tmax, Tmin, SD, and Prep, respectively.
Sustainability 12 10133 g002
Figure 3. Average transplanting dates, heading dates, maturity dates, and yields across all sites during 1981–2010. Note: (a) represents the transplanting dates, (b) represents the heading dates, (c) represents the maturity dates, and (d) represents the rice yield.
Sustainability 12 10133 g003
Figure 4. Spatial trends of transplanting dates, heading dates, maturity dates, and yields across sites during the period 1981–2010. Note: (a) represents the transplanting dates, (b) represents the heading dates, (c) represents the maturity dates, and (d) represents the rice yield respectively.
Sustainability 12 10133 g004
Figure 5. Spatial distribution of partial correlation coefficients between phenological and climatic variables and rice yields.
Sustainability 12 10133 g005
Figure 6. Average partial correlation coefficients between phenological and climatic variables and rice yields across all sites, Yangtze River (YZ), and Pearl River Delta (PRD), respectively.
Sustainability 12 10133 g006
Figure 7. Relative importance of phenological variables and climatic variables on the yields of early mature rice.
Sustainability 12 10133 g007
Publisher’s Note: MDPI stays neutral with regard to jurisdictional claims in published maps and institutional affiliations.

