Abstract
As highlighted by the 2030 Agenda, access to food is a crucially important aspect of sustainable development. In this context, the association between WaSH services and access to food still needs to be clearly understood. This study investigates the direct and indirect impact of the WaSH environment of households on access to food, and the role of mediation variables and insecurity due to war and conflicts in South Sudan. We considered a statistically representative sample of 1382 households and used two structural equation models based on primary data. A basic model estimates association between household WaSH environment and food security directly and indirectly through the household livelihood-based coping capacity and poverty perception. Its extended version includes the indirect effect of insecurity due to war and conflicts. Results are theoretically coherent and demonstrate the relevance of the household WaSH environment for food security. The indirect effect of the absence of insecurity due to conflicts and war on food security adds to the basic model a statistically significant total indirect effect. From a policy perspective, the study suggests reinforcement of the capacity of the public sector for delivering WaSH services and the need for multi-sectoral solutions linking humanitarian, development, and peace approaches.
1. Introduction
In 2010, through the Resolution 64/292, the UN General Assembly explicitly recognized as a human right the access to safe and clean drinking water and sanitation and called upon States and International Organisations to make appropriate efforts to help developing countries to provide universal access to these services [1]. Agenda 2030 embedded this recommendation in the Sustainable Development Goals (SDGs) with goals 3 and 6 dedicated to water, sanitation and hygiene [2].
In 2012, as part of this process promoted by the international community, the UN Committee on World Food Security [3] introduced the concept of food and nutrition security, recognizing that this challenge cannot be achieved without an environment of adequate sanitation and health services in the world’s poorest communities. Today, Water, Sanitation and Hygiene (WaSH) programmes are broadly adopted responses in the area of nutrition security and include interventions aimed at promoting the safe disposal of faeces, handwashing with soap, drinking water supply, drinking water treatment and safe storage, and food hygiene [4]. The literature refers to these interventions as “nutrition-sensitive” because they address the underlying determinants of the nutritional status [5].
Much of the evidence on the link between WaSH services and nutrition adopts a health perspective and devotes special attention to its effects on a broad set of health outcomes, especially related to children [6,7,8,9,10]. According to the World Health Organisation [11], approximately half of the malnutrition cases are associated with worm infections or recurring diarrhea resulting from unsafe water, insufficient sanitation and inadequate hygiene. Recent studies have demonstrated that the improvement of these conditions has an impact on stunting reduction [12].
However, the provision of WaSH services also affects all the pillars of food security, especially access to food, which is an important aspect of this multi-dimensional concept and a precondition for achieving an adequate nutritional level [13,14]. Access to food is a crucially important aspect of sustainable development and an under-recognized social pillar of health. The empirical literature on household access to food is based on cross-sectional studies and rarely on longitudinal analysis. In this sense, it scarcely includes one or very few proxy measures of the state of the household WaSH environment [15,16,17] among the explanatory variables. Therefore, the association between WaSH services and access to food still needs to be clearly understood. This information is especially relevant for policymakers, planners, and governmental and non-governmental organisations to design food and nutrition security interventions for health promotion and to measure the causes of food and nutrition insecurity.
Our study covers this gap by adopting an economic approach and analysing the impact of the household WaSH environment on household access to food in South Sudan. We used a Structural Equation Model approach and primary data collected in four counties of Western Bahr-el-Ghazal State from 6 May to 6 June 2019, for a statistically representative sample of 1382 households. We estimated two models. A basic model tested the association between household WaSH environment and food security directly and indirectly through the household livelihood-based coping capacity and poverty perception. Afterwards, we extended this model to include the indirect effect of insecurity stemming from war and conflicts.
The focus on the Sub-Saharan African countries is crucial due to the critical situation of the continent. In Sub-Saharan Africa, inequalities in access to WaSH services continues to be an urgent matter. The region shows the most precarious situation if compared with the other SDGs regions. According to UNICEF and WHO [18], in Sub-Saharan Africa, 39% of the population does not have access to drinking water supply, 69% lack access to safely managed sanitation services and 75% have no basic handwashing facilities with soap and water at home. Moreover, Africa is moving away from the achievement of SDG 2 on eliminating hunger, as the food security conditions continue to deteriorate [19].
This situation is even more severe in countries in protracted crisis such as South Sudan. The country is in a complex situation of long-term emergency and a constant state of food security and nutrition crisis. Moreover, the low rates of access to WaSH services have increased the health risks for the population, exacerbating the severe situation of food insecurity and malnutrition.
Our study focuses on the four counties of the Western Bahr-el-Ghazal State in north-western South Sudan: the urban county of Wau and the rural remote counties of Baggari, Bazia, and Bisselia. From late June 2016 to January 2019, the conflict situation was particularly severe in this area leading to the continuous destruction and looting of properties, schools and health facilities. The highest levels of insecurity affected the rural remote counties, especially the Baggari county, and humanitarian assistance had limited access during this period. Therefore, the food security situation was precarious. The most severe conditions were found in Baggari, Bazia, and Bisselia, where more than one-third of the households are severely food insecure. According to our data, the basic water supply coverage in the study area is still very low and the majority of the households need from one hour to less than half a day to collect the water. In Baggari, Bazia, and Bisselia, more than 70% of households have no latrine and, as a result, more than 80% of households in these counties defecate in the bush. The use of soap is very limited, and almost half of the households are not using mosquito nets while sleeping. Almost the totality of the households has at least one sick member due to the poor conditions of WaSH.
Now, in our study area, a lot has changed in terms of security and freedom of movement and there is the need to identify key points that can help food security and public health programming in this region. In this sense, WaSH programmes are broadly adopted humanitarian responses in this area. They include interventions aimed at improving the drinking water coverage and safe storage, as well as safe faeces disposal, handwashing with soap, and sleeping under a mosquito net to reduce sickness among children and adults. However, nothing or very little is known about how these interventions are affecting food security, especially due to the lack of updated information resulting from the abovementioned limited physical access to the investigated area. We overcame this issue using primary data for a statistically representative sample of 1382 households that we collected during May–June 2019 within a project aimed at evaluating household food security and livelihood systems in Western Bahr-el-Ghazal in South Sudan.
Our empirical analysis uses a Structural Equation Model (SEM) approach. It allowed us to address some limitations presented by the canonical analysis based on or derived from simple or multiple regression analysis methods. To the best of our knowledge, this is the first study to apply this approach to detect the relationship between WaSH services and food insecurity.
We used a set of latent variables to better capture the nature of the phenomena investigated and to address the problem of multicollinearity among variables, coherently to our research construct. In this respect, a SEM approach is more efficient to deal with measurement errors in both endogenous and exogenous variables and, therefore, is more appropriate for the investigation of multidimensional phenomena [20,21]. Moreover, we investigated the indirect link between household WaSH services and food insecurity status mediated by the household vulnerability in terms of capacity to respond when facing hardships and by household poverty level. Traditional regression equations cannot detect this aspect because of their additive nature. A further step in our analysis consisted of incorporating the indirect effect of the shock exerted by insecurity, resulting from conflicts or war on household food security through the state of their WaSH environment and coping capacity. This information is of specific importance for practitioners that are increasingly concerned with understanding the impact of delivering services in fragile and conflict-affected States. However, in these situations, the recent literature mainly focuses on the understanding of the links between service delivery of WaSH services and the wider processes of state building and peace-building [22]. Very little is known through a rigorous approach to the impact of conflicts and war on the provision of WaSH services and subsequently on food security.
2. Materials and Methods
2.1. Research Framework and Model Structure
We consulted the empirical literature on the determinants of food security to isolate and identify the most influential constructs linking the state of household WaSH and food insecurity, this latter concept measured by access to food. We also used the theoretical frameworks adopted to recognize the factors affecting food and nutrition security and to visualize their cause-and-effect relationships [4,23,24,25]. Figure 1 shows our research framework.
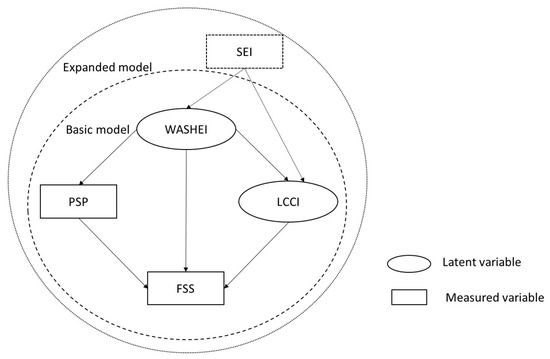
Figure 1.
Research framework. FSS, household food security status; LCCI, household livelihood-based coping capacity index; PSP, household poverty state perception; SEI, secure environment index; WASHEI, household WaSH environment index.
In the basic part of our research structure, a household WaSH Environment Index (WASHEI) has a direct effect on the household Food Security Status (FSS) and an impact mediated by a household Livelihood-based Coping Capacity Index (LCCI) and Poverty State Perception (PSP). The literature suggests a positive association between the deterioration of WaSH conditions or reduction in the provision of these services and household livelihood coping capacity through the safe-sanitation cycle and its impact on livelihoods [25,26]. A deterioration in WaSH conditions affects health and physical fitness for work, and thus reduces economic productivity, compromising the livelihood system that embeds the household coping strategies. The abovementioned safe-sanitation cycle and its impact on livelihoods also justify the choice of our last mediator variable, the PSP. Inadequate access to drinkable water, adequate sanitation, and health services and medicines reinforce the cycles of gender inequality and poverty, reducing household resources and opportunities to access and pay for nutritious food. Expenditure on water and sanitation is an important share of the poorest households’ budget that too often competes with the food spending [13]. The time spent by women in collecting water or caring family members made sick by a poor household WaSH environment limits their participation to income-generating activities, compromising the household access to adequate quantity and quality of food items [14]. This implication is even more severe if we consider that women’s income is more strongly associated with improvements in children’s health and nutrition status than revenues earned by men. Moreover, poor WaSH adversely affects the quality of available labor for the household to employ for productive activities and reduces productivity, compromising the income-generating activities and food production for self-consumption.
A Secure Environment Indicator (SEI) related to the absence of an impact of insecurity due to war or conflicts on household food security expands our basic research framework. As highlighted by the literature, peaceful, stable states and societies facilitate WaSH services [22]. For this reason, we measured the indirect effect of SEI on household food security through WASHEI. Moreover, the violence of war and conflicts are strongly directed at civilians and to the destruction of their livelihoods systems [27,28,29]. Therefore, we extended the indirect effect of SEI on food security through the path passing through the household livelihood-based coping capacity [30,31].
We have not included the effect of SEI on PSP because we constructed this variable by referring to a question of our survey asking the respondents if insecurity due to war and conflicts was the most important factor negatively influencing food security. Moreover, the same question focused on poverty revealed discrepancies in the underlined critical factors.
We estimated two SEMs: one for the core part of our framework and the other for its extended version. In our framework, WASHEI and LCCI are latent variables while the other elements are observed variables. Therefore, each of our models consists of two parts: a structural model and a latent variable model. The latter generates the reflective latent variables that we employed in the structural model, i.e., a regression-like relationship among the endogenous and exogenous variables.
2.2. Dataset
We based our study on primary data we collected in the four counties of Wau, Baggari, Bazia, and Bisselia located in the Western Bahr-el-Ghazal State of South Sudan from 6 May to 6 June 2019, covering the period of the rainy season and at the beginning of the lean period when households strongly depend on food aid and the market for food purchases. We followed the procedure suggested by Cochran [32] to implement our data collection.
We designed the questionnaire by referring to the food security theoretical framework by Sassi [4] to collect only essential information and avoiding an overlong questionnaire and its consequent effects on the quality of the answers. We validated the questionnaire using stakeholders from the local institutions and international organisations operating in South Sudan.
We were first to develop an extensive data collection on household food security and livelihood after the conflict period in the investigated rural areas. As no population census was available for Baggari, Bazia, and Bisselia, we met the chiefs and paramount chiefs of the different communities to know the number of people living in that specific study area. We also collected information on the average size of a typical household. Cross-referencing these two elements, we estimated the total number of resident households. We used the same procedure for Wau, but, in this case, we referred to the available population census and studies on household size.
We calculated our sample size to be statistically representative at the county level using the Cochran [32] formula with further correction for the statistical representation of the finite population at the county level. We adopted a critical value of the desired confidence level of 1.96, which corresponds to the confidence level of 95%, and we fixed the desired margin of error at 4%.
We interviewed 1381 households in total, distributed by county as follows: 50% in Wau, 21% in Bisselia, 16% in Bazia, and 13% in Baggari. The respondents in our sample were 48% males and 52% females. A team of 30 local enumerators submitted the questionnaire. We selected them based on the different ethnic groups of the communities of our respondents and trained them on how to submit the questionnaire through theoretical and practical sections.
2.3. Variables Construction
2.3.1. Latent Variables
In our SEM, we used two latent variables, WASHEI and LCCI. We measured the household WASHEI indirectly, employing the answer to the yes-no questions concerning the access to the most important services of water, sanitation, and hygiene in the context of the investigated area during the 30 days before the survey. We denoted with 1 the access to the above items, and 0 the lack of access. We selected the possible indicators by referring to the targets of Agenda 2030 and more precisely to SDGs 3 and 6, which express commitment to universal, sustainable, and equitable access to safe drinking water, sanitation, and hygiene by 2030.
For the theoretical construct of LCCI, we used the answers to the standard fourteen questions adopted to detect the livelihood-based copy strategies by the WFP-VAM [33]. For our analysis, we considered the frequency of the adopted strategy during the 30 days before the survey.
To identify the underlying structure of these variables, we detected their descriptive statistics and identified small groups of correlated variables assumed to measure the same construct. We examined the correlation matrix to verify if the relationship between variables satisfied the assumptions essential to conduct a confirmatory factor analysis. We avoided the problems of low correlations and multicollinearity fixing the lowest tolerance value at 0.20 and the highest at 0.90. We performed a polychoric correlation for the variables representing WASHEI because it consists of binary indicators (yes/no answers) and the Pearson’s correlations for LCSI due to the availability of continuous indicators.
We selected the indicators representative of the underlying structure of WASHEI based on its three components, i.e., water, sanitation, and hygiene. More precisely, we referred to the disposal of children’s faeces in the latrine (felat) and the access to family shared or communal latrine (alatrine) as representative of sanitation; the access to a house built in brick or concrete (bumat) and to soap availability in the house (soap) as the description for hygiene; and the access to water within 30 min or less (accwt) as the water component of WaSH. We denoted with 1 the access to the abovementioned items, and 0 otherwise.
Concerning LCCI, we selected the number of times the household—in the 30 days before the survey—sold household assets (tsolass), borrowed money, or purchased food on credit (tbor) and sold productive assets (tsopas) due to lack of money or food. The first two indicators represent stress strategies while the latter a crisis strategy.
Afterwards, we performed a factor loading analysis to verify the validity of the latent variables. Figure 2 and Figure 3 present the estimated standardized factor loadings of a solution where the latent variables and the indicators are standardized, and their level of statistical significance.
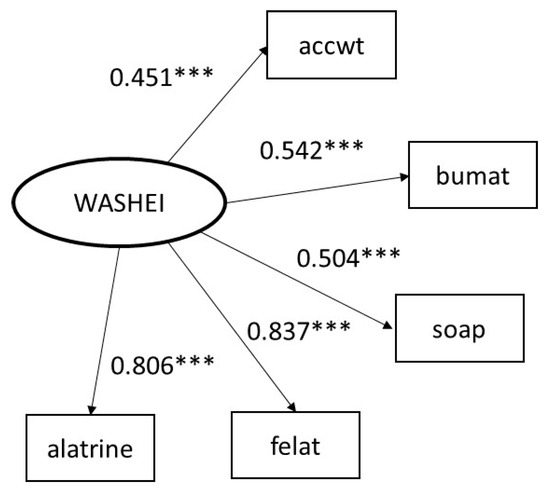
Figure 2.
Measurement model for WASHEI. WASHEI, household WaSH environment index; felat, disposal of children faeces in the latrine; alatrine, access to family shared or communal latrine; bumat, access to a house built in brick or concrete; (soap) soap availability within the house; accwt, access to water within 30 min or less. *** p-value < 0.01.
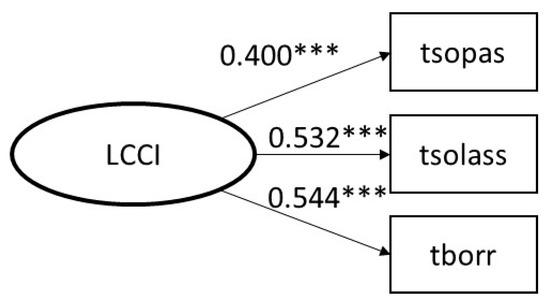
Figure 3.
Measurement model for LCCI. LCCI, household livelihood-based coping capacity index; tbor, number of times household borrowed money or purchased food on credit; tsolass, number of the times household assets were sold; tsopas, number of time household sold productive assets. *** p-value < 0.01.
The standardized factor loading of our indicators was equal to or more than 0.4 (the required minimum to evaluate the relevance of the link between an item and the related factor) and strongly statistically significant. Therefore, we considered our items to have an appropriate quality for our analysis. The estimates contained no impurities, such as inadmissible and offending estimates, or very high or low standard error. Moreover, the overall goodness-of-fit indices of absolute, parsimonious, and incremental fit confirmed the overall goodness-of-fit of our models (Table 1).

Table 1.
Degrees of freedom and overall goodness-of-fit indices of the confirmatory factor analysis.
The decision to standardize the latent and observed variables in the solutions of the models allowed us to overcome the problem of only three indicators explaining LCCI. The model is saturated with 0 degrees of freedom.
The above results suggest that WASEI and LCCI strongly influence the items representative of household sanitation, and those describing stress strategies, respectively.
2.3.2. Observed Variables
We computed our endogenous variable (FSS) as proxied by the household food expenditure share per adult equivalent. As underlined by the literature, the relative importance of expenditure on food tends to be greater among poor households [34]. The items they purchase are mainly primary need goods. On the contrary, evidence suggests that the share of food expenditure tends to be lower for wealthier households because they normally spend an increasing amount of their income on non-food items.
In the computation of the household food expenditure, we included the food purchased, own produced, and given as food aid or gift. We quantified these components using the price paid for the specific food item by a specific household or on average by the households in the county of residence when the former price was not available. We expressed our endogenous variable in the adult equivalent scale to control for the household size. To this purpose, we adopted the OECD-modified scale proposed by Hagenaars et al. [35], and we assigned a value of 1 to the household head, 0.5 to each additional adult member, and 0.3 to each child.
For a better interpretation of results, it is important to note that, on average, own production and food aid or gifts represent the largest share of total household expenditure on food per adult equivalent, 47% and 40%, respectively.
Based on the computed share of food expenditure on total spending per adult equivalent, we classified the households in our sample into the four categories of food security status suggested by Smith and Subandoro [36] and WFP [37] to characterize our endogenous variable. We associated: severe food insecurity to a share of food spending over 75% of total expenditures on food (categorized as 4); moderate food insecurity to a share of food spending of 65–75% (categorized as 3); marginal food security to a food spending of 50–65% (categorized as 2); and food security to a food spending of less than 50% (categorized as 1). Only 37% of the households in our sample were food secure and 44% were severely food insecure.
The household perception of the poverty state (PSP) is an ordered categorical variable that we constructed by referring to the declared perception of poverty expressed by the respondents selecting among a list of seven categories about the month before the interview. The seven possible categories were very poor (categorized as 1), poor (categorized as 2), lower-middle-income level (categorized as 3), middle-income level (categorized as 4), higher-middle-income level (categorized as 5), rich (categorized as 6), and very rich (categorized as 7). The majority of the households in our sample (80%) declared to be poor or very poor.
The expanded SEM includes SEI, which we set equal to 0 if the respondent declared insecurity due to war and conflicts as most important food insecurity problem in the 30 days before the questionnaire submission (reported by 38% of the households in our sample) and 1 in the absence of this response (declared by the remaining 62%).
3. Results
Table 2 shows the identification and overall goodness-of-fit indices of our basic and extended SEM. Both models are over-identified as indicated by their degrees of freedom. Therefore, there is enough non-redundant information in the data to be able to estimate the required parameters uniquely.
Table 2.
Identification and overall goodness-of-fit indices.
The overall goodness-of-fit indices suggest accepting the models applied to the data. We used the robust Standardized Root Mean Square Residual (SRMR) as an absolute fit index to verify how far our model is from the perfect fit. The basic and extended models fit the data well because the value of SRMR is less than the recommended cut-off value of 0.08. The robust Root Mean Square Error of Approximation (RMSEA) indicates that our models are also parsimonious. They fit the data in a very good way as the respective value of the index is well below the cut-off point of 0.05. Finally, also the incremental fit indices confirm a very good fitting of our models. Both the robust Comparative Fit Index (CFI) and the robust Tucker–Lewis Index (TLI) are above the cut-off criteria of 0.95.
We have not reported the P-value of the chi-square. For both our models, it indicated that the harmony between the models and the data was not perfect. However, this test is sensitive to large sample sizes [38]. Therefore, we relied on the other fit indices such as RMSEA, CFI, and TLI, to test our models.
Figure 4 and Figure 5 show the estimated parameters and their fit indices. We present the standardized effect, in a solution with the standardized latent and observed variables, as we are interested in the comparison of the relative magnitude of change associated with different paths in the same model.
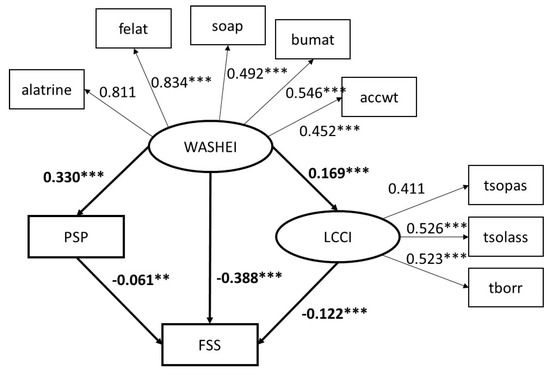
Figure 4.
Basic SEM estimates. FSS, household food security status; LCCI, household livelihood-based coping capacity index; PSP, household poverty state perception; WASHEI, household WaSH environment index; felat, disposal of children faeces in the latrine; alatrine, access to family shared or communal latrine; bumat, access to a house built in brick or concrete; (soap) soap availability within the house; accwt, access to water within 30 min or less; tbor, number of times household borrowed money or purchased food on credit; tsolass, number of the times household assets were sold; tsopas, number of time household sold productive assets. *** p-value < 0.01; ** p-value < 0.05.
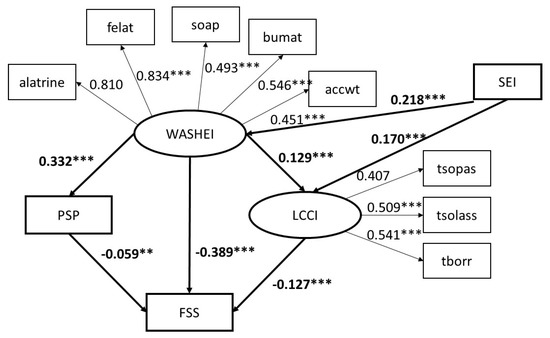
Figure 5.
Extended SEM estimates. FSS, household food security status; LCCI, household livelihood-based coping capacity index; PSP, household poverty state perception; SEI, secure environment index; WASHEI, household WaSH environment index; felat, disposal of children faeces in the latrine; alatrine, access to family shared or communal latrine; bumat, access to a house built in brick or concrete; (soap) soap availability within the house; accwt, access to water within 30 min or less; tbor, number of times household borrowed money or purchased food on credit; tsolass, number of the times household assets were sold; tsopas, number of time household sold productive assets. *** p-value < 0.01; ** p-value < 0.05.
The local fit indices confirm that the solution of both our models does not contain inadmissible values from a statistical standpoint. All estimates are below 1 and different from zero at a threshold of statistical significance of 0.05 and for the majority of them of 0.01. The sign of the value of the estimated parameters is coherent with the theoretical considerations.
Focusing on the structural part of our basic model, we can note that WASHEI has a direct negative association with FSS. If WASHEI were increased by one standard deviation, while holding constant PSP and LCCI, FSS would reduce by 0.388 standard deviations. The better the household WaSH environment, the better is the household access to food.
Holding constant WASHEI, PSP, and LCCI are also negatively associated with FSS. However, the magnitude of these standardized coefficients is lower than that of WASHEI (−0.061 and −0.122 vs. 0.388 standard deviations, respectively).
Our model also confirms LCCI and PPS as variables that cause mediation in the dependent and independent variables. WASHEI positively affects PSP and LCCI, indicating that an improvement of the household WASH environment is associated, on the one side, with a lower level of perceived poverty, and, on the other side, with a greater capacity to cope with shocks. FSS also improves through these paths. Table 3 presents the computation of total influence of WASHEI on FSS that is −0.441 standard deviation and confirm the relatively higher magnitude of the change associated to the direct path in comparison to the indirect paths in terms of standardized units.
Table 3.
Direct, indirect, and total effect of WASHEI on FSS—Basic model.
Extending the model to include the indirect effect of SEI on FSS, we noted that this effect is statistically significant through all the investigated paths (Figure 2). However, the path with WASHEI as a mediator variable has a relatively greater magnitude (Table 4). The total indirect effect is −0.154 standard deviation indicating a further improvement in the household food security status associated with a situation of security.
Table 4.
Indirect effect added by SEI to the basic model.
4. Discussion
This study contributes to the global debate on food security including production, consumption, poverty, inequalities, healthcare, and conflicts focusing on the latter [39,40,41,42]. It provides a model for measuring the impact of household WaSH environment on food security keeping into consideration the mediation variables suggested by the literature. For this reason, we adopted an SEM approach, which provided the validity of our research framework.
Our results demonstrate the relevance of the WASHEI for food security, measured in terms of access to food, both directly and indirectly through the household coping capacity and state of poverty perceived. An inadequate and unsafe WaSH environment at the household level aggravates the problem of food insecurity. Therefore, our estimates add clear evidence on the association between WaSH and the household food security outcomes to the safe-sanitation cycle and the limited literature on WaSH and nutrition in the investigated area. Besides, our paper implements the debate on WASH-nutrition demonstrating that one of the preconditions of adequate household nutrition, i.e., stable access to food, is also associated with the household WaSH environment.
This evidence has relevant policy implications. Despite the existence of the Water, Sanitation and Hygiene Sector Strategic Framework of 2011 in South Sudan, the capacity of the public sector to provide these services is still extremely weak in the country with consequent extremely poor WaSH indicators [39]. In light of our evidence, the reinforcement of this capacity in both urban and rural areas in the state of western Bahr-el-Ghazal is of paramount importance for increasing the positive impact of WaSH services on food security. A serious complication of this process is the challenging access to the locations of our study area, especially the most vulnerable communities due to conflicts and consequent insecurity and lack of road. This situation reduces the transport capacity of both material and staff necessary to establish appropriate or at least basic water and sanitation infrastructure [43,44].
Our paper also highlights that the only part of the total effect of WASHEI on food security is direct, as we discovered a partial mediation in the investigated process. The presence of mediator variables is in line with the multi-sectoral feature of the concept of food insecurity, a characteristic that requires addressing this issue with multi-sectoral solutions. In this respect, our paper suggests the need to link WaSH interventions for humanitarian purposes to development and peacebuilding actions. Our analysis highlighted poverty and livelihood-based coping capacity as mediator variables and security as a variable with a significant indirect effect on improving food security. The impact of these variables can be reinforced with their synergic development. The 2030 Agenda for Sustainable Development also supports this joint multi-sector action, collaboration, and engagement [45]. Accordingly, our paper suggests that the maximization of the positive effect of WaSH services on food security outcomes can be supported, reinforcing the link between the interventions aimed at achieving Goal 1 (on ending poverty), Goal 2 (on ending hunger), Goal 3 (on good health and well-being), Goal 6 (on clean water and sanitation), and Goal 16 (on peace, justice, and strong institutions).
Moreover, increasing complementarity between humanitarian and development approaches to WaSH is of paramount importance to improve the impact, coherence, and efficiency of the action on food security. In South Sudan, and especially in the investigated area, the supply and delivery of WaSH and other basic services have been a focus of both humanitarian and development efforts. However, programming, the modality for service delivery and geographic areas of intervention have generated two separate humanitarian and development boxes due to several reasons including those ideological and practical [46]. Consequently, these interventions might not fully express their potential impact. However, without food aid, the share of food insecure households increases dramatically. This aspect highlights the deep fragility of the household food security in the study area, which is even more severe because the diet is far from being nutritious for the majority of our interviewed households, and makes the humanitarian interventions very important for achieving food security.
Furthermore, independently of the level of food security, nearly the totality of the households in our study area are extremely vulnerable to future shocks affecting food insecurity. This situation is evident from the value assumed by the household livelihood-based coping capacity index that can be interpreted as an index of vulnerability to food insecurity. According to our evidence, 26% of the households in our sample adopt emergency strategies, 33% crisis strategies, and 21% stress strategies. As the livelihood systems embed coping strategies, our results support the recognition within the humanitarian sector of the need to incorporate them into the standard humanitarian response in integration with the WaSH interventions [47].
The lack of panel data and information for other areas in South Sudan and other countries did not allow us to validate our findings. This limitation suggests the need for a future effort in data collection to reach more solid conclusions regarding the role of WaSH in food security in conflict-prone areas.
Funding
This study was funded by the Italian Agency of Development Cooperation, project “Food Security Support and Healthy Nutrition Promotion in Western Bahr el Ghazal” SASN—AID 011423.
Acknowledgments
We thank Gopal Trital (University of Pavia) for the constructive methodological suggestions and the Italian NGO VIDES for the logistic support in South Sudan and comments to the study.
Conflicts of Interest
The author declares no conflict of interest. The funders had no role in the design of the study; in the collection, analyses, or interpretation of data; in the writing of the manuscript, or in the decision to publish the results.
References
- UN. Resolution Adopted by the General Assembly on 28 July 2010. A/RES/64/292. 2010. Available online: https://documents-dds-ny.un.org/doc/UNDOC/GEN/N09/479/35/PDF/N0947935.pdf?OpenElement (accessed on 12 August 2020).
- UN. Transforming Our World: The 2030 Agenda for Sustainable Development; UN: New York, NY, USA, 2015. [Google Scholar]
- UN. Committee on World Food Security. Coming to Terms with Terminology. Food Security Nutrition Security Food Security and Nutrition Food and Nutrition Security. In Proceedings of the Thirty-ninth Session, Rome, Italy, 15–20 October 2012; Available online: http://www.fao.org/3/MD776E/MD776E.pdf (accessed on 12 August 2020).
- Sassi, M. Understanding Food Insecurity. Key Features, Indicators, and Response Design; Springer International Publishing AG: Cham, Switzerland, 2018. [Google Scholar]
- Dodos, J. WASH’ Nutrition. A Practical Guidebook on Increasing Nutritional Impact through Integration of Wash and Nutrition Programmes; Action Contre la Faim: Paris, France, 2017. [Google Scholar]
- Motarjemi, Y. Research priorities on safety of complementary foods. Pediatrics 2000, 106, 1304. [Google Scholar] [PubMed]
- Guerrant, R.L.; Ori, R.B.; Moore, S.R.; Oriá, M.O.B.; Lima, A.A.M. Malnutrition as an enteric infectious disease with long-term effects on child development. Nutr. Rev. 2008, 66, 487–505. [Google Scholar] [CrossRef] [PubMed]
- Humphrey, J.H. Child under-nutrition, tropical enteropathy, toilets, and handwashing. Lancet 2009, 374, 1032–1035. [Google Scholar] [CrossRef]
- Mackinnon, E.; Ayah, R.; Taylor, R.; Owor, M.; Ssempebwa, J.; Olago, L.D.; Kubalako, R.; Dia, A.T.; Gaye, C.; Campos, L.C.; et al. 21st century research in urban WASH and health in sub-Saharan Africa: Methods and outcomes in transition. Int. J. Environ. Health Res. 2019, 29, 457–478. [Google Scholar] [CrossRef] [PubMed]
- Momberg, D.J.; Ngandu, B.C.; Voth-Gaeddert, L.E.; Cardoso Ribeiro, K.; May, J.; Norris, S.A.; Said-Mohamed, R. Water, sanitation and hygiene (WASH) in sub-Saharan Africa and associations with undernutrition, and governance in children under five years of age: A systematic review. J. Dev. Orig. Health Dis. 2020, 1–28. [Google Scholar] [CrossRef] [PubMed]
- WHO. Preventing Diarrhoea through Better Water, Sanitation and Hygiene: Exposures and Impacts in Low- and Middle-Income Countries; WHO: Geneva, Switzerland, 2014. [Google Scholar]
- Dangour, A.D.; Watson, L.; Cumming, O.; Boisson, S.; Che, Y.; Velleman, Y.; Cavill, S.; Allen, E.; Uauy, R. Interventions to improve water quality and supply, sanitation and hygiene practices, and their effects on the nutritional status of children. Cochrane Database Syst. Rev. 2013, CD009382. [Google Scholar] [CrossRef] [PubMed]
- Cairncross, S.; Kinnear, J. Elasticity of demand for water in Khartoum, Sudan. Soc. Sci. Med. 1992, 34, 183–189. [Google Scholar] [CrossRef]
- Wash Advocates. Global Food Security: The Critical Role of Water, Sanitation, and Hygiene (WASH); Wash Advocates: Washington, DC, USA, 2013. [Google Scholar]
- Sassi, M. Economic and Health Determinants of Child Nutritional Status in the Malawian District of Salima. Eur. J. Dev. Res. 2014, 26, 761–782. [Google Scholar] [CrossRef]
- Sassi, M. Seasonality and Trends in Child Malnutrition: Time-Series Analysis of Health Clinic Data from the Dowa District of Malawi. J. Dev. Stud. 2015, 51, 1667–1682. [Google Scholar] [CrossRef]
- Sassi, M. Seasonality and Nutrition-Sensitive Agriculture in Kenya: Evidence from Mixed-Methods Research in Rural Lake Naivasha Basin. Sustainability 2019, 11, 6223. [Google Scholar] [CrossRef]
- UNICEF; WHO. Progress on Household Drinking Water, Sanitation and Hygiene 2000–2017: A Special Focus on Inequalities; UNICEF: New York, NY, USA; WHO: New York, NY, USA, 2019. [Google Scholar]
- FAO; ECA; AUC. Africa Regional Overview of Food Security and Nutrition 2019, Accra. 2020. Available online: https://doi.org/10.4060/CA7343EN (accessed on 12 August 2020).
- Krishnakumar, J.; Ballon, P. Estimating basic capabilities: A structural equation model applied to Bolivia. World Dev. 2008, 36, 992–1010. [Google Scholar] [CrossRef]
- Krishnakumar, J.; Nagar, A. On exact statistical properties of multidimensional indices based on principal components, factor analysis, MIMIC and structural equation models. Soc. Indic. Res. 2008, 87, 481–496. [Google Scholar] [CrossRef]
- Wild, L.; Mason, N. Examining the Role of WASH Services within Peace-and State-Building Process. Findings from Tearfund Programmes in the Democratic Republic of Congo and the Republic of South Sudan; Overseas Development Institute: London, UK, 2012. [Google Scholar]
- WFP. Comprehensive Food Security & Vulnerability Analysis Guidelines; WFP: Rome, Italy, 2009. [Google Scholar]
- UNICEF. Improving Child Nutrition: The Achievable Imperative for Global Progress; UNICEF: New York, NY, USA, 2013. [Google Scholar]
- World Vision Lebanon. Assessment of Reduction of Water Provision in Informal Tented Settlements and Its Association with the Livelihood Status of Syrian Refugees in the Bekaa Valley. September 2018; World Vision Lebanon: Beit Meri, Lebanon, 2018. [Google Scholar]
- Borba, M.L.; Smet, J.; Sijbesma, C. Enhancing Livelihoods through Sanitation; IRC International Water and Sanitation Centre: The Hague, The Netherlands, 2007. [Google Scholar]
- DFID. Guidance Sheet 2.6; DFID: London, UK, 1999.
- Collinson, S. Power, Livelihoods and Conflict: Case Studies in Political Economy Analysis for Humanitarian Action; Humanitarian Policy Group (HPG) Report 13; Overseas Development Institute: London, UK, 2003. [Google Scholar]
- Brück, T.; Schindler, K. The Impact of Violent Conflicts on Households: What Do We Know and What Should We Know about War Widows? Oxf. Dev. Stud. 2009, 37, 289–309. [Google Scholar] [CrossRef]
- Corbett, J. Famine and household coping strategies. World Dev. 1988, 16, 1099–1112. [Google Scholar] [CrossRef]
- Blaikie, P.M.; Cannon, T.; Davis, I.; Wisner, B. At Risk: Natural Hazards, People’s Vulnerability and Disasters; Routledge: London, UK; New York, NY, USA, 1994. [Google Scholar]
- Cochran, W.G. Sampling Techniques, 3rd ed.; Wiley: New York, NY, USA, 1997. [Google Scholar]
- WFP-VAM. Consolidated Approach to Reporting Indicators of Food Security (CARI), Technical Guidance Note; WFP: Rome, Italy, 2015. [Google Scholar]
- Moltedo, A.; Troubat, N.; Lokshin, M.; Sajaia, Z. Analyzing Food Security Using Household Survey Data; World Bank: Washington, DC, USA, 2014. [Google Scholar]
- Hagenaars, A.; de Vos, K.; Zaidi, M.A. Poverty Statistics in the Late 1980s: Research Based on Micro-Data; Office for Official Publications of the European Communities: Luxembourg, 1994. [Google Scholar]
- Smith, L.C.; Subandoro, A. Measuring Food Security Using Household Expenditure Surveys; Food Security in Practice Technical Guide Series; IFPRI: Washington, DC, USA, 2007. [Google Scholar]
- Wiesmann, D.; Bassett, L.; Benson, T.; Hoddinott, J. Validation of the World Food Programme’s Food Consumption Score and Alternative Indicators of Household Food Security; IFPRI Discussion Paper 00870; The International Food Policy Research Institute: Washington, DC, USA, 2009. [Google Scholar]
- Gana, K.; Broc, G. Structural Equation Modeling with Lavaan; ISTE Ltd.: London, UK, 2019. [Google Scholar]
- WASH Cluster South Sudan. Strategic Operating Framework 2018. 2018. Available online: https://www.humanitarianresponse.info/en/operations/south-sudan/document/wash-cluster-south-sudan-strategic-operating-framework-2018-draft (accessed on 12 August 2020).
- Foullieux, E.; Bricas, N.; Alpha, A. ‘Feeding 9 billion people’: Global food security debates and the productionist trap. J. Eur. Public Policy 2017, 20, 1658–1677. [Google Scholar] [CrossRef]
- Fusco, G.; Coluccia, B.; De Leo, F. Effect of trade openness on food security in the EU: A dynamic panel analysis. Int. J. Environ. Res. 2020, 17, 4311. [Google Scholar] [CrossRef] [PubMed]
- Prosekov, A.Y.; Ivanova, S.A. Food security: The challenge of the present. Geoforum 2018, 91, 73–77. [Google Scholar] [CrossRef]
- Ranganathan, R.; Briceño-Garmendia, C.M. South Sudan’s Infrastructure: A Continental Perspective, Africa Infrastructure Country Diagnostic Country Report; World Bank: Washington, DC, USA, 2011. [Google Scholar]
- African Development Bank. South Sudan: An Infrastructure Action Plan—A Program for Sustained Strong Economic Growth; African Development Bank (AfDB) Group: Tunis, Tunisia, 2013. [Google Scholar]
- WHO; UNICEF; USAID. Improving Nutrition Outcomes with Better Water, Sanitation and Hygiene; WHO: Geneva, Switzerland, 2015.
- Mosello, B.; Mason, N.; Aludra, R. Improving WASH Service Delivery in Protracted Crises. The Case of South Sudan; ODI Report; ODI: London, UK, 2016. [Google Scholar]
- Lautze, S.; Raven-Roberts, A. Violence and complex humanitarian emergencies: Implications for livelihoods models. Disasters 2006, 30, 383–401. [Google Scholar] [CrossRef] [PubMed]


Publisher’s Note: MDPI stays neutral with regard to jurisdictional claims in published maps and institutional affiliations. |
© 2020 by the author. Licensee MDPI, Basel, Switzerland. This article is an open access article distributed under the terms and conditions of the Creative Commons Attribution (CC BY) license (http://creativecommons.org/licenses/by/4.0/).