Building Orientation in Green Facade Performance and Its Positive Effects on Urban Landscape Case Study: An Urban Block in Barcelona

 ,
,  , and
, and 
Abstract
1. Introduction
2. Methodology
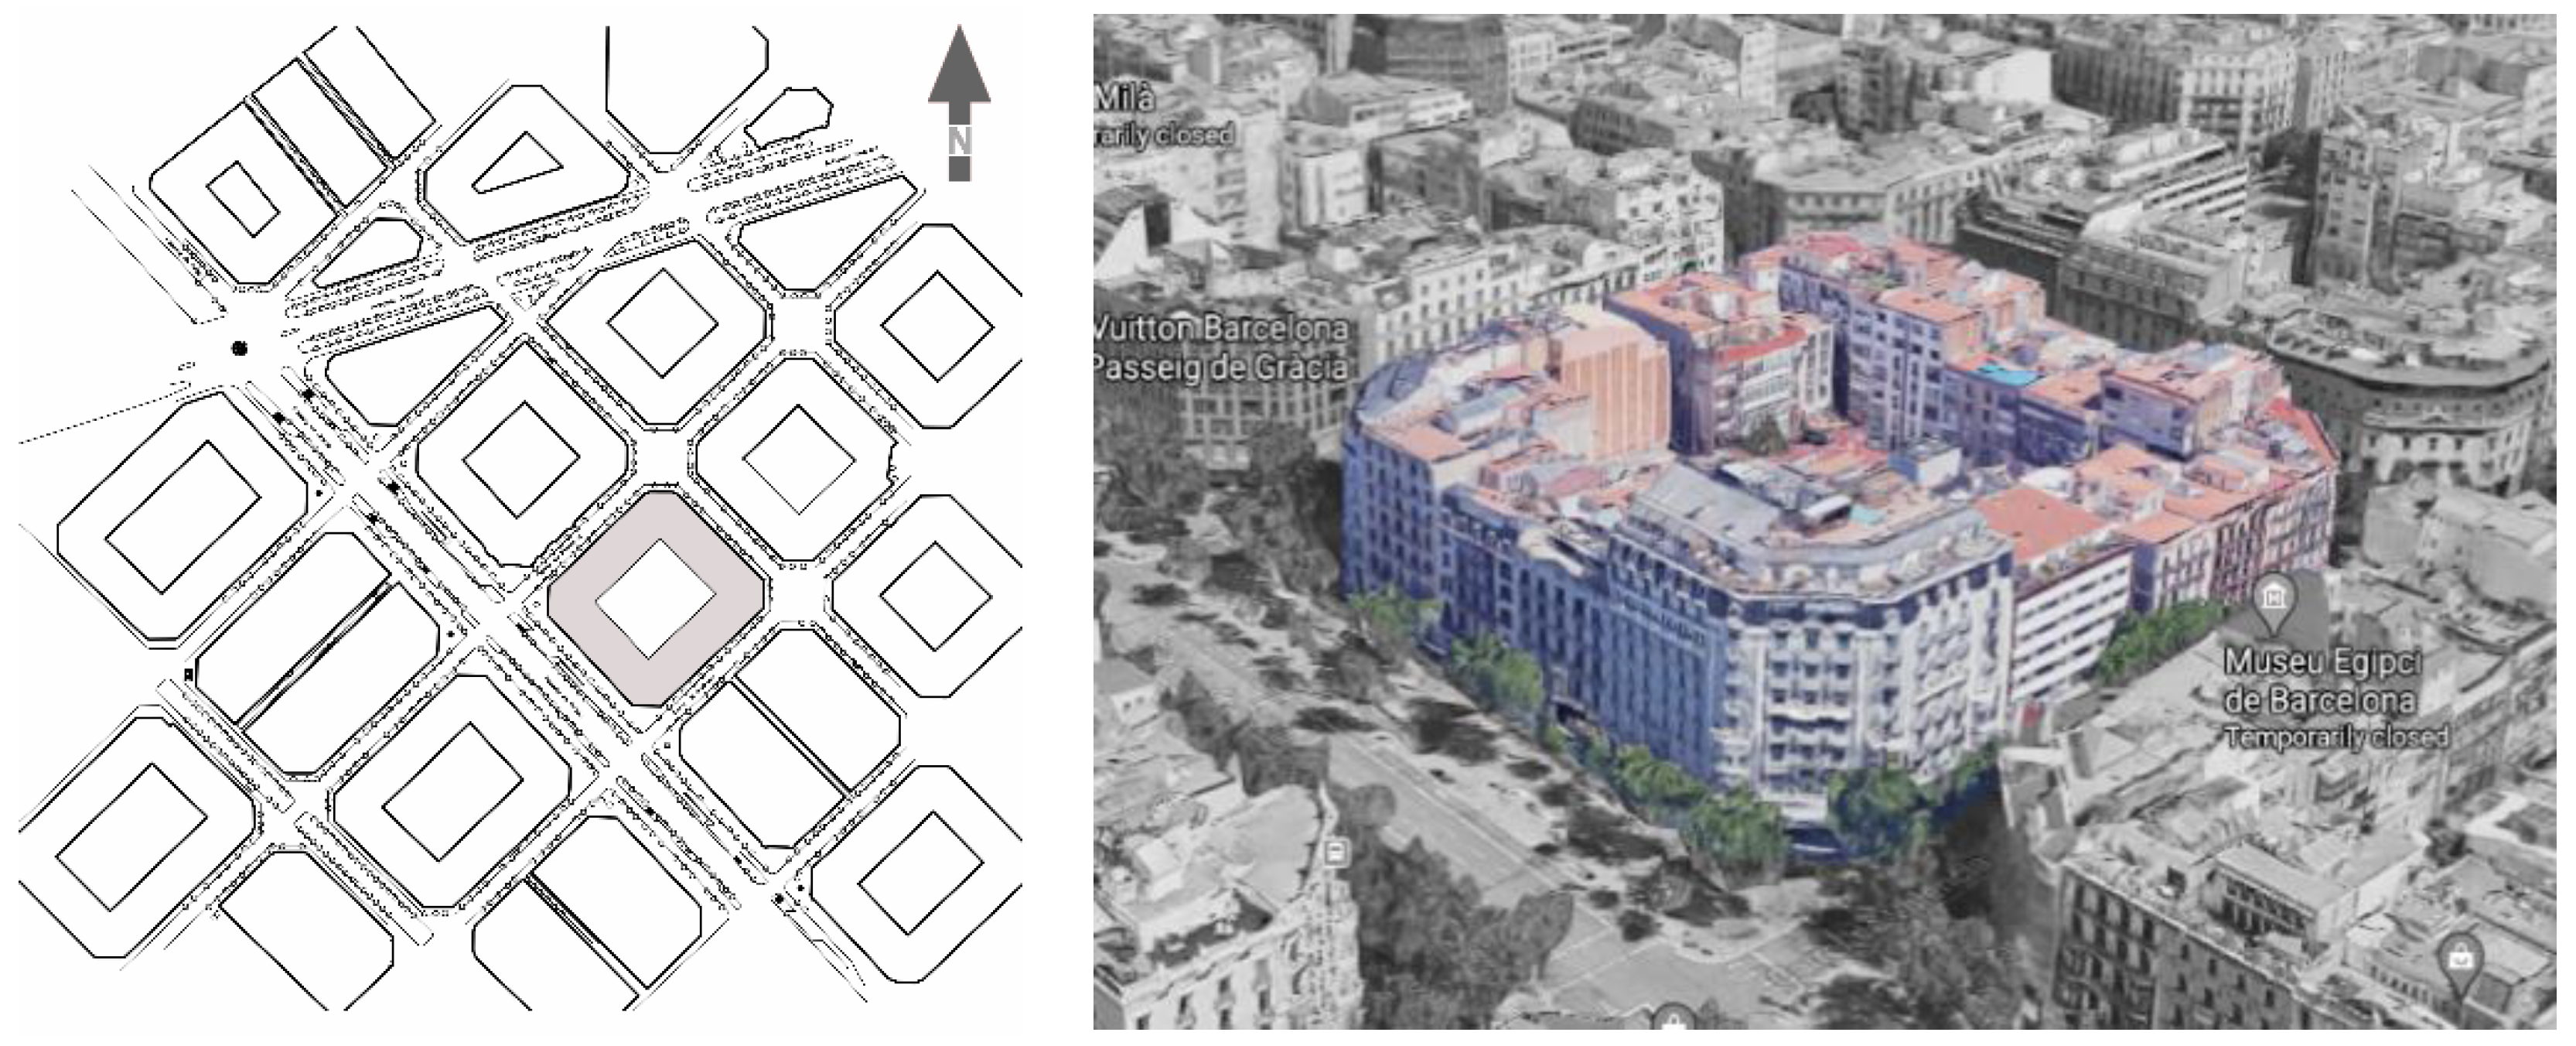
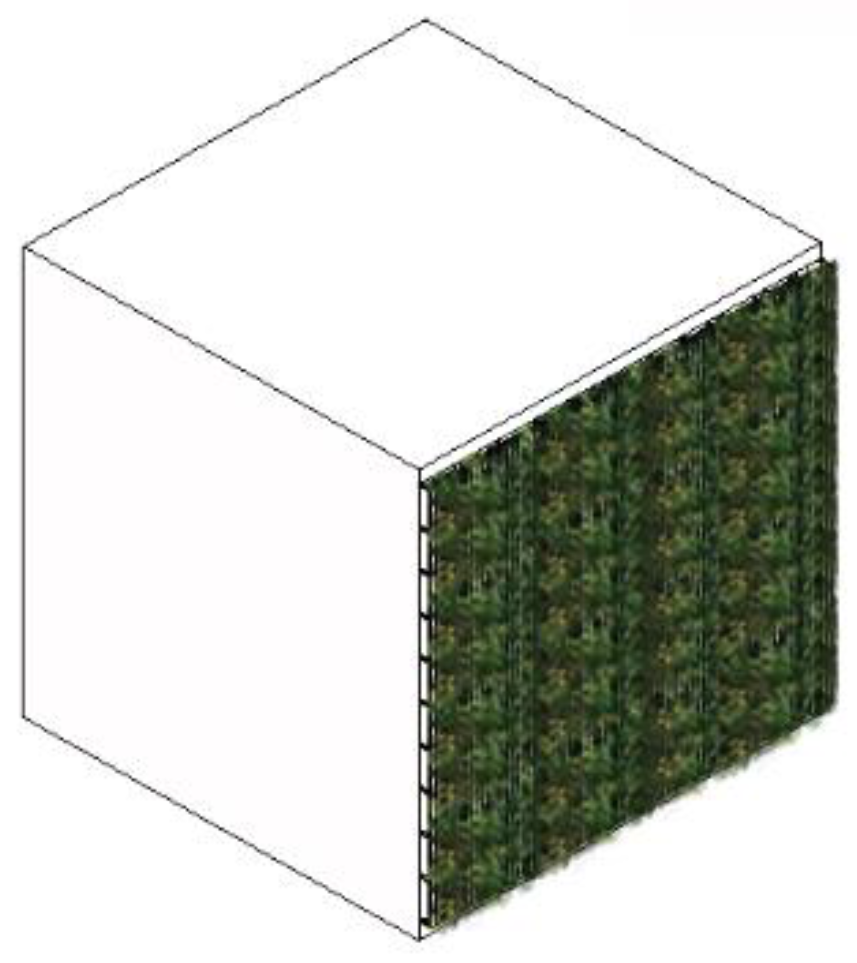
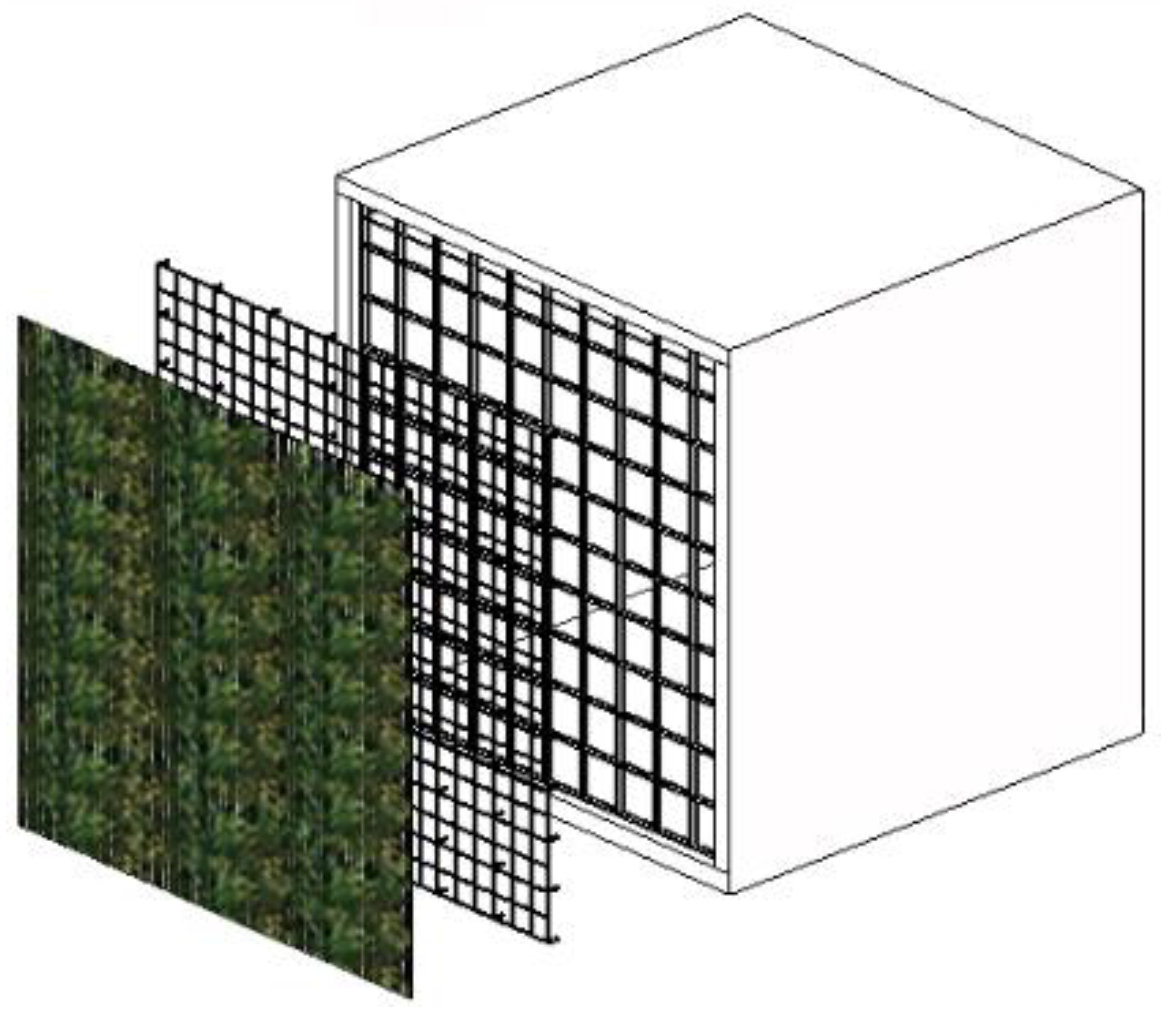
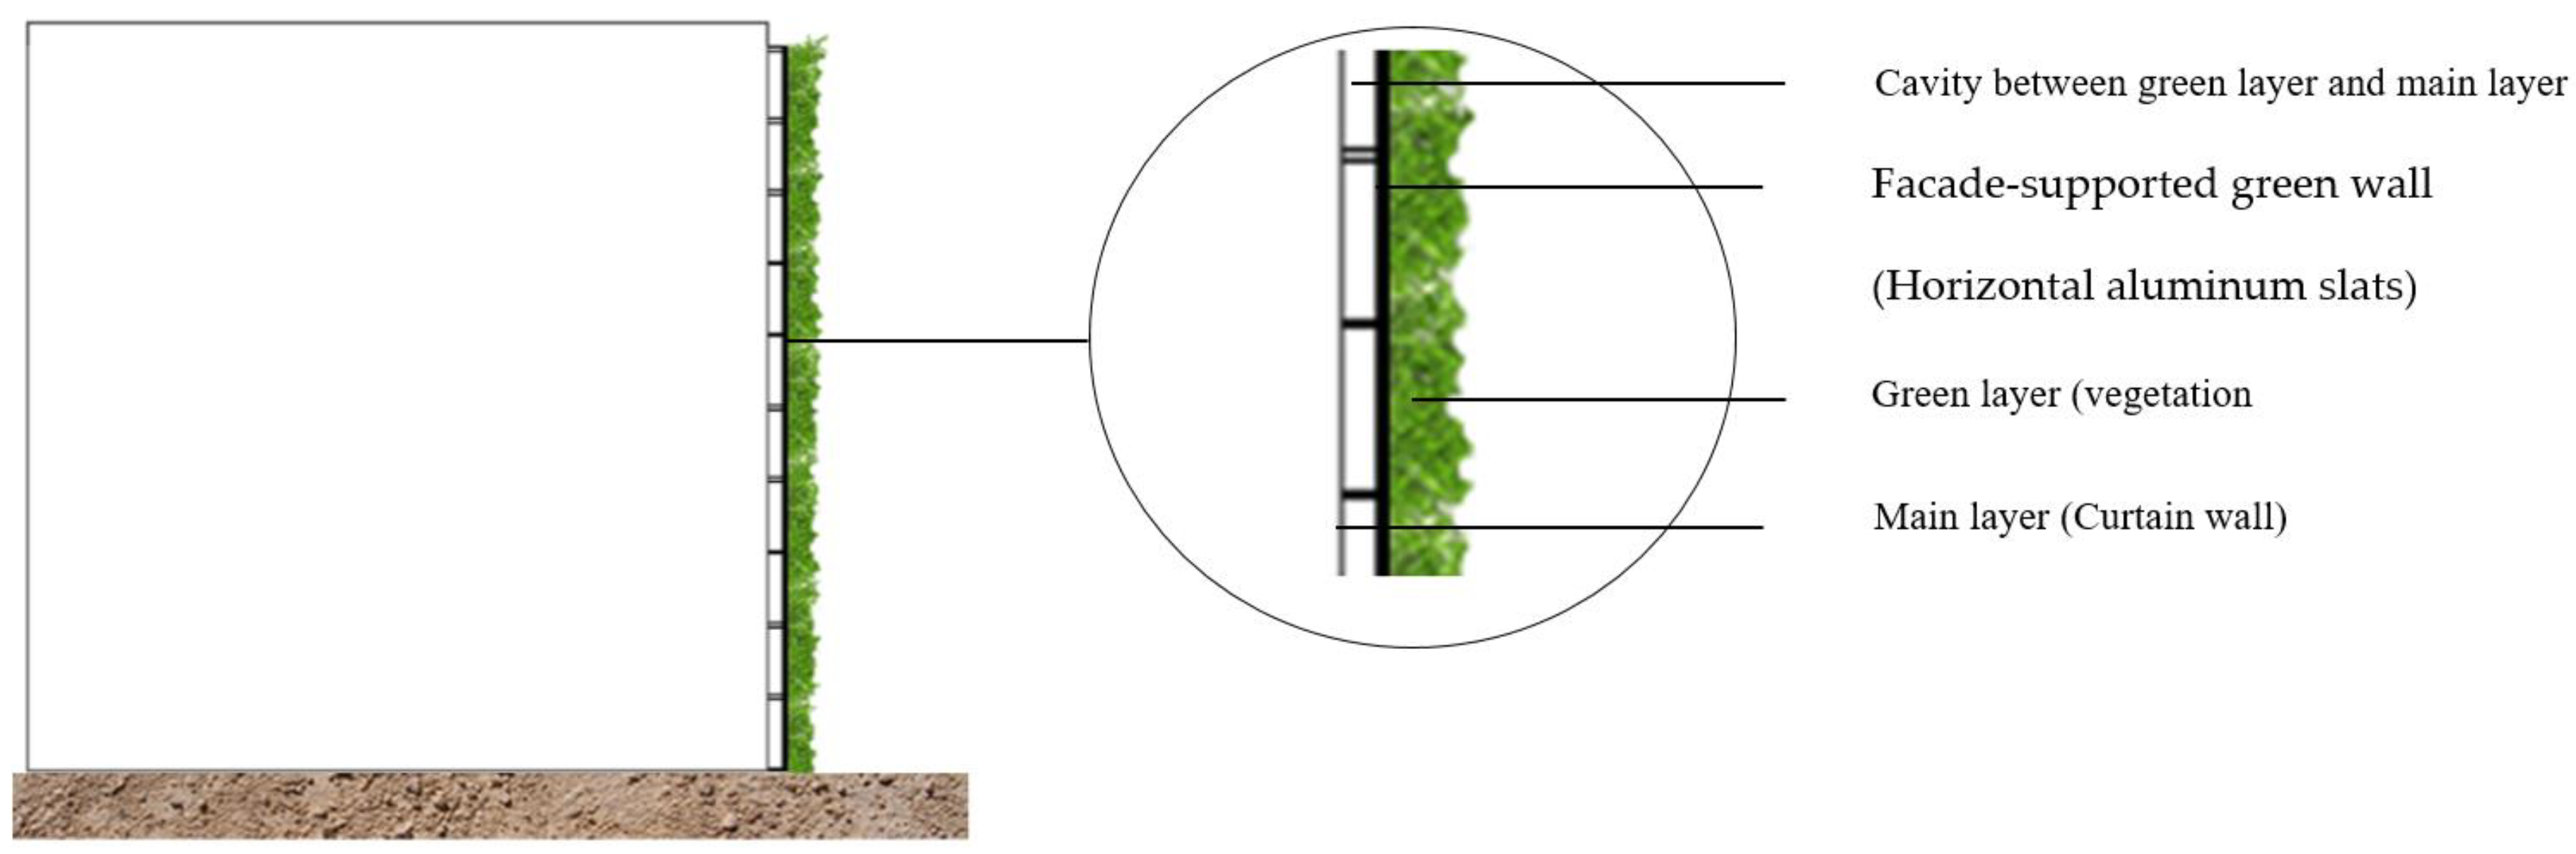
Case Study and Scenario Descriptions
3. Results
3.1. Analysis of the Energy Consumed with Different Cavity Depth Sizes in the Green Layer in Facade
3.2. Analysis of the Energy Consumed in Different Orientations
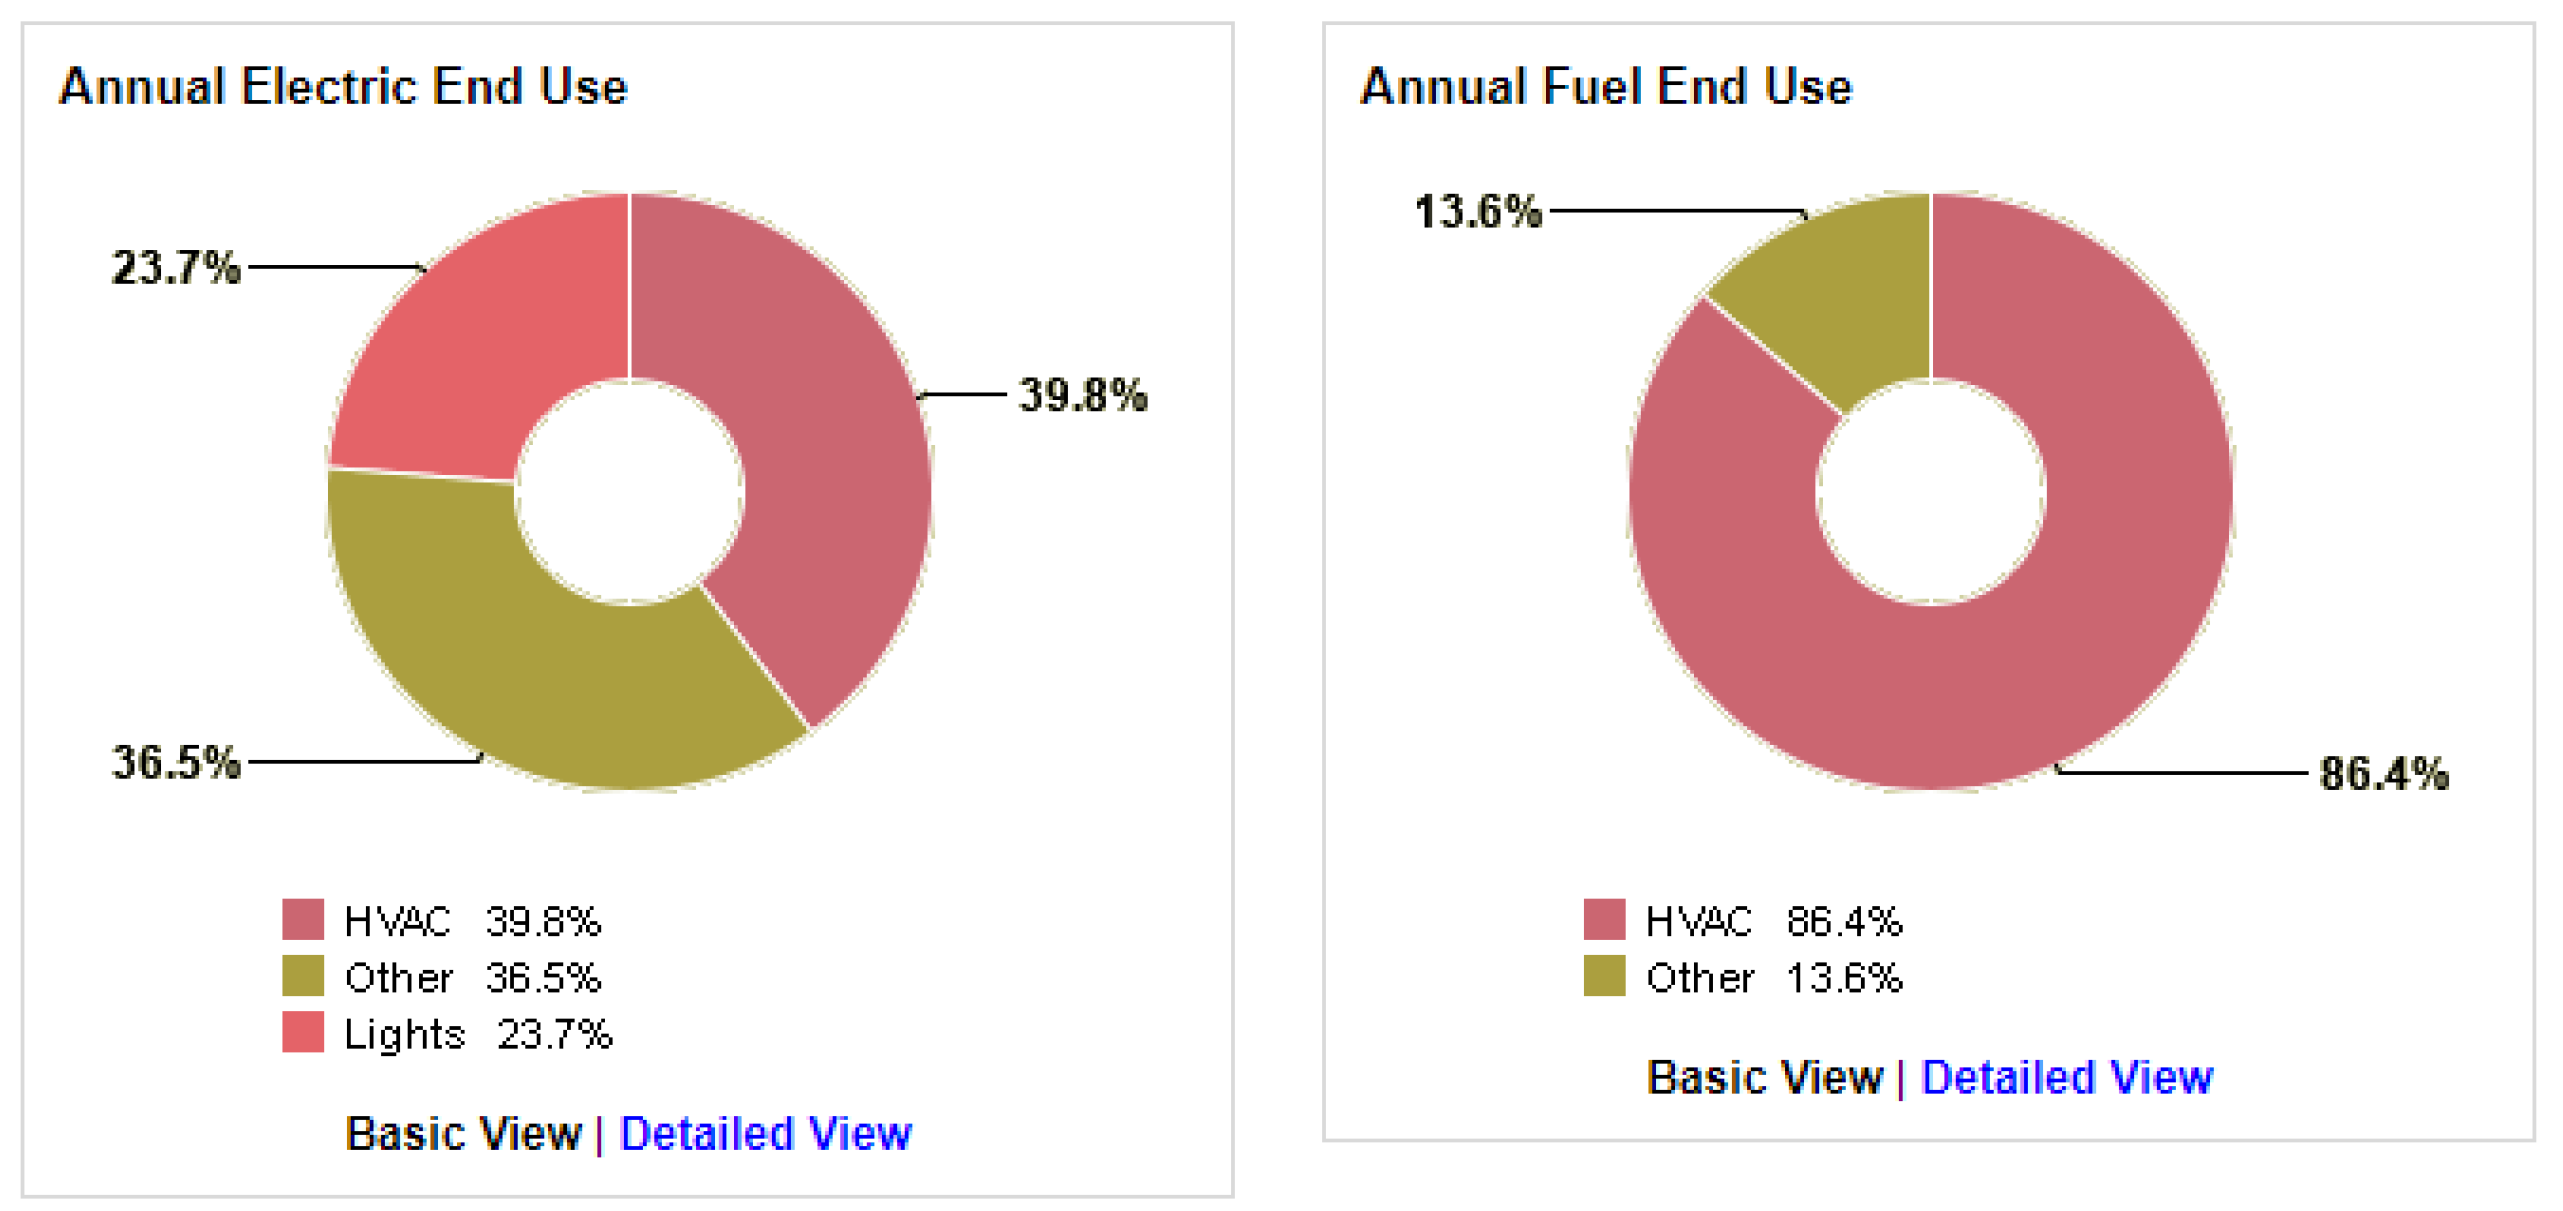
Test 1: South Orientation
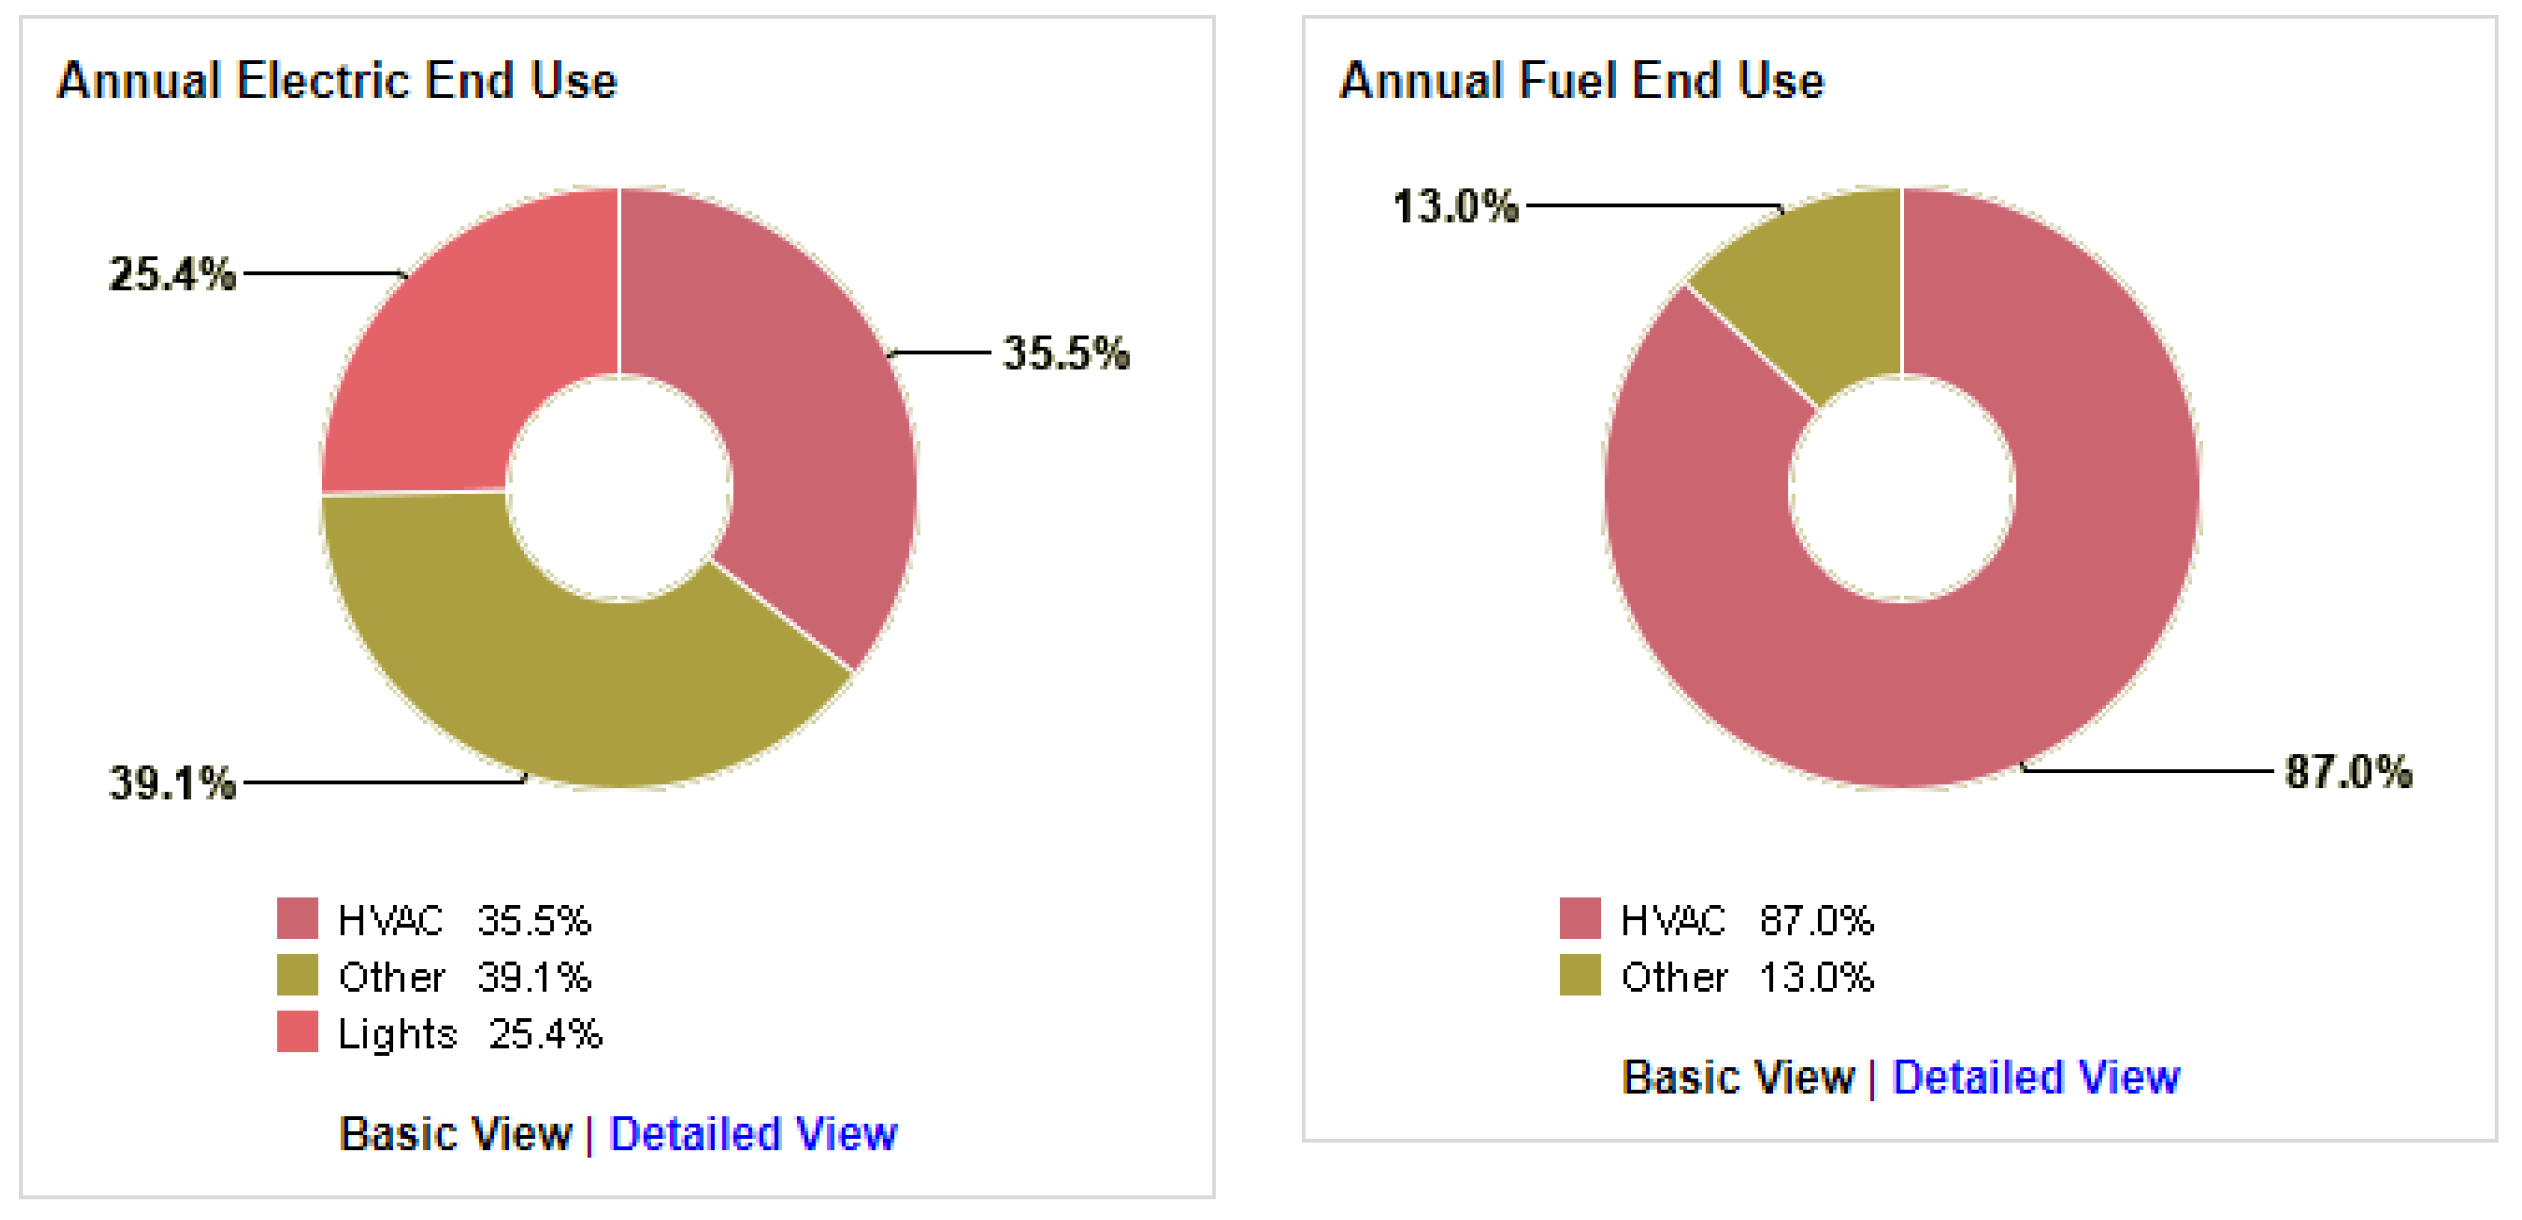
Test 2: Southeast Orientation
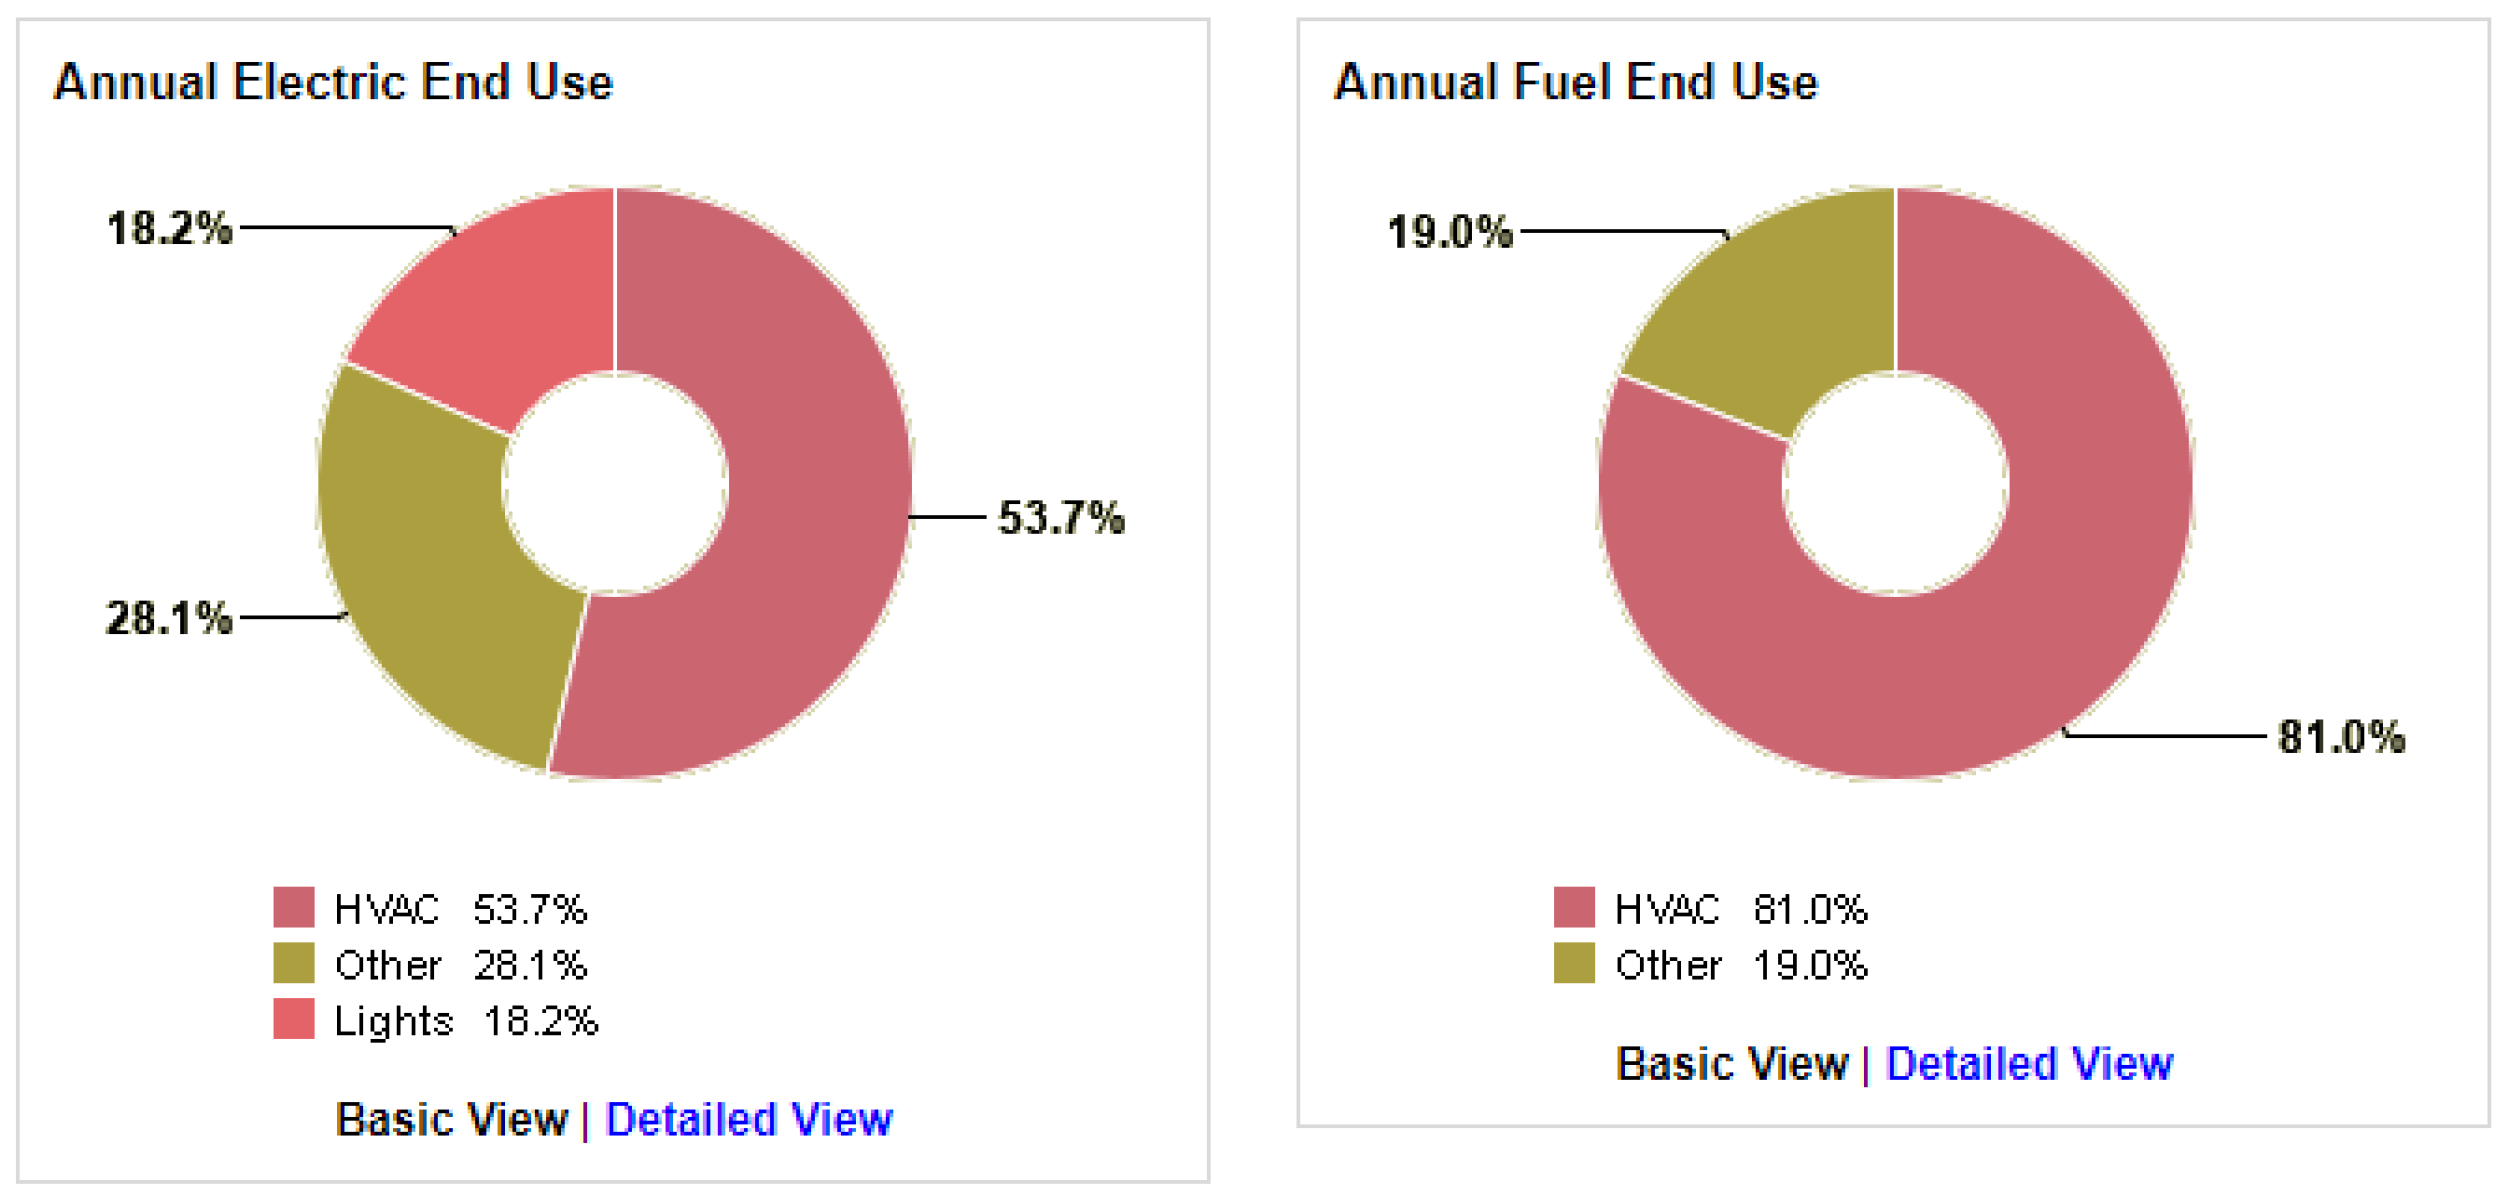
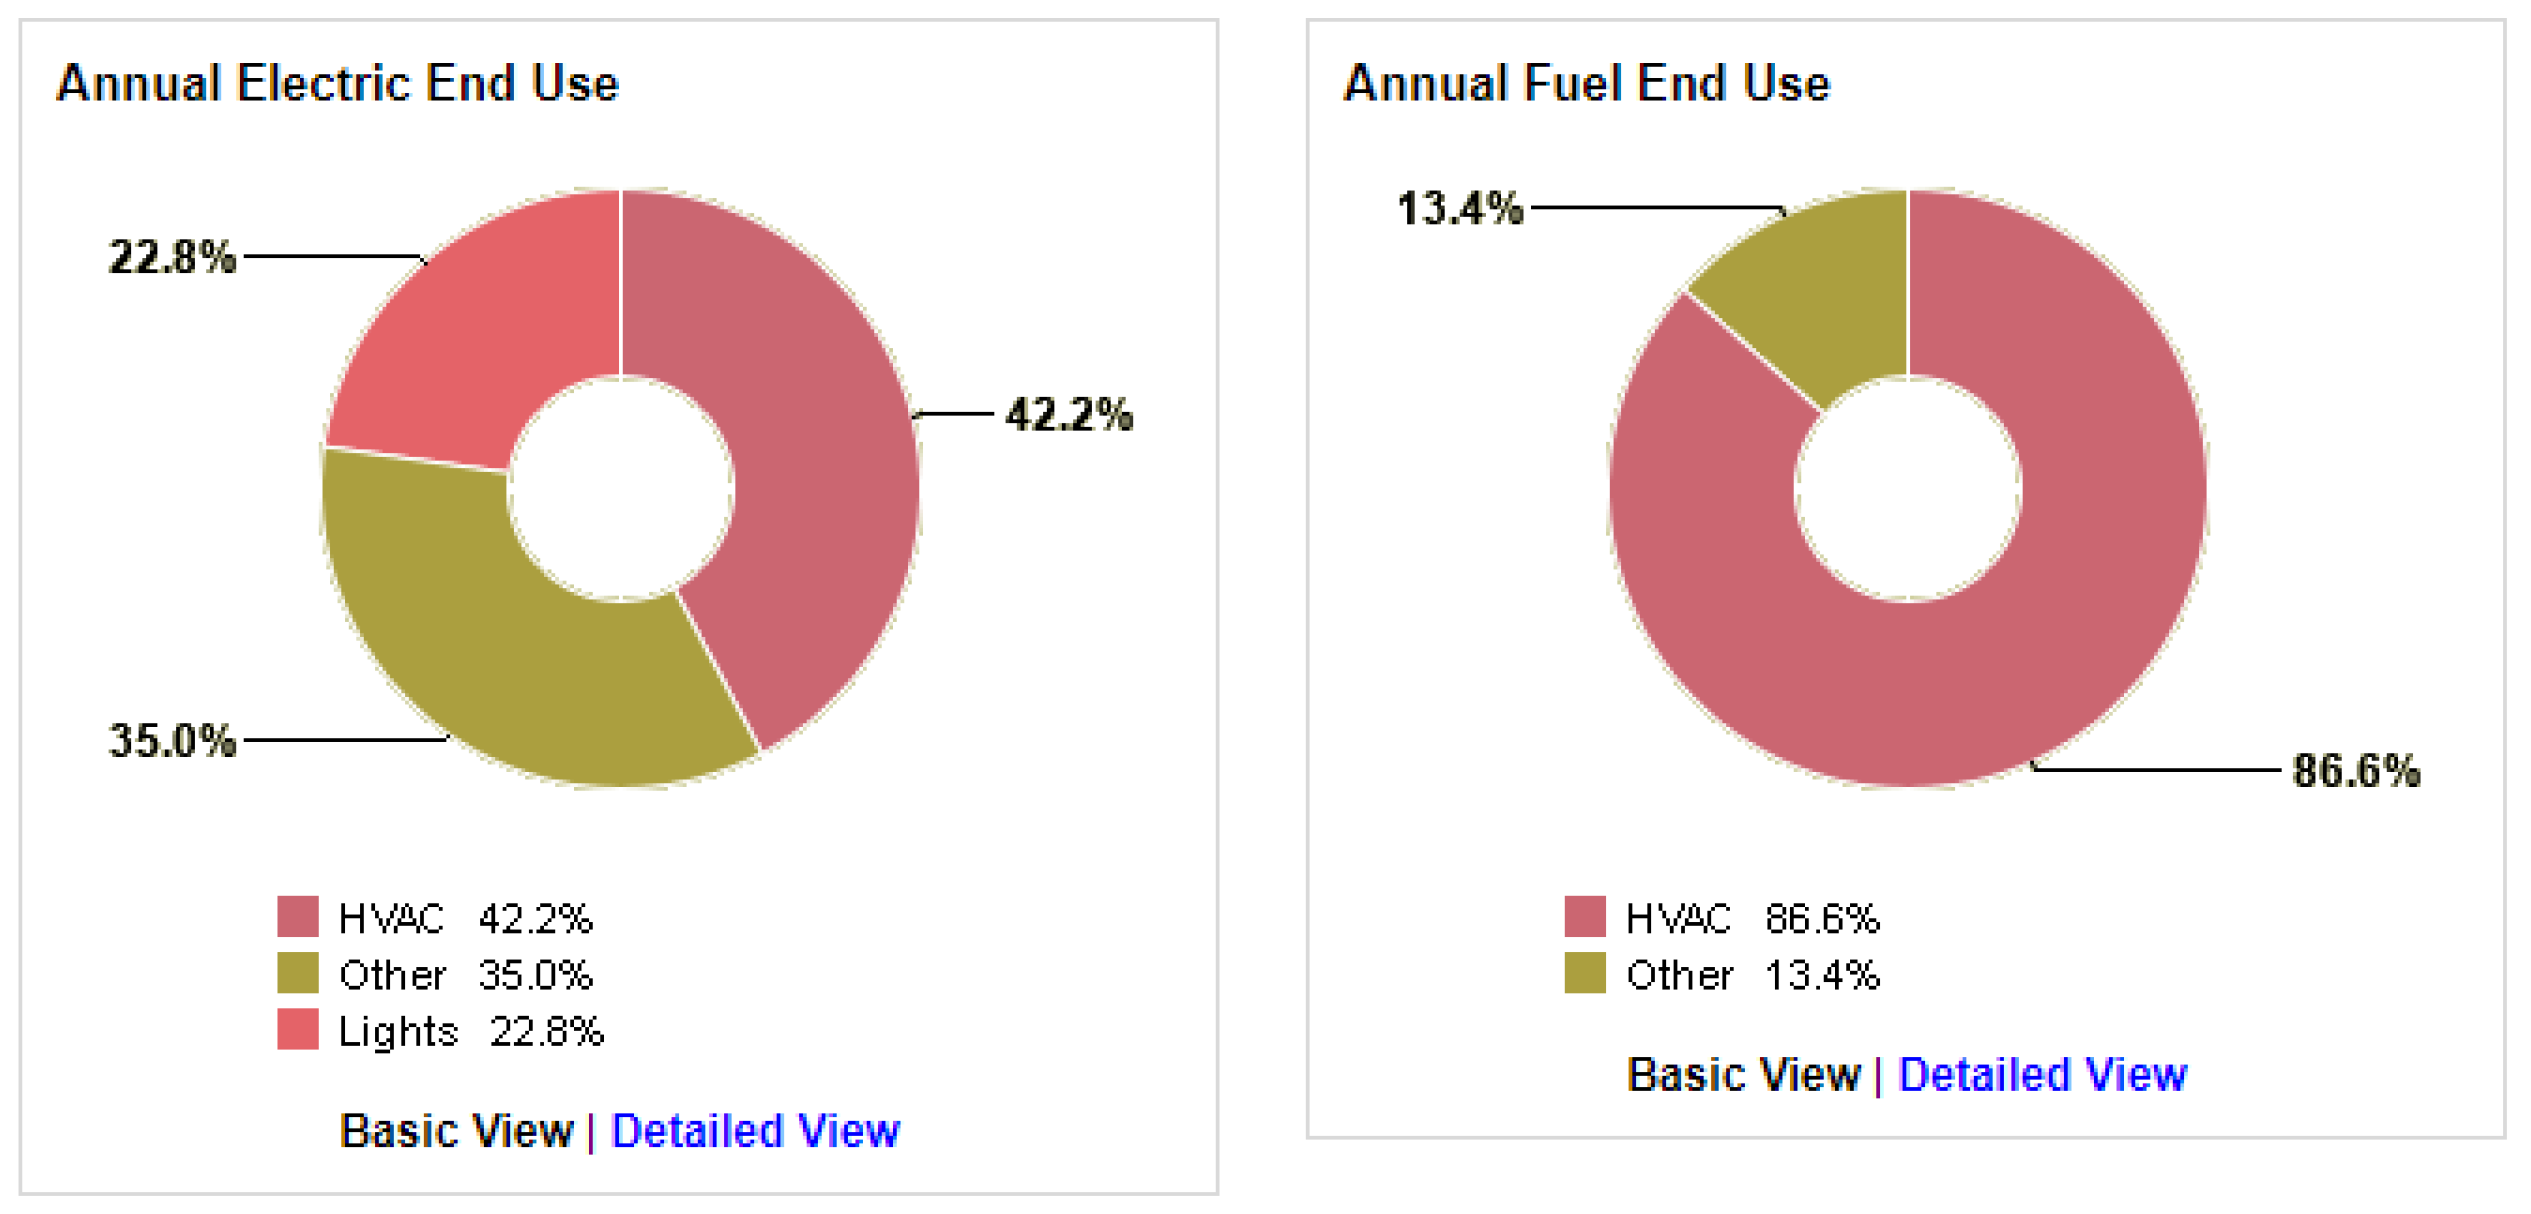
Test 3: Southwest Orientation
Test 4: East Orientation
Test 5: North Orientation
Test 6: Northeast Orientation
Test 7: Northwest Orientation
Test 8: West Orientation
4. Conclusions
Author Contributions
Funding
Conflicts of Interest
References
- Krstić-Furundžić, A.; Vujosevic, M.; Petrovski, A. Energy and environmental performance of the office building facade scenarios. Energy 2019, 183, 437–447. [Google Scholar] [CrossRef]
- Pérez, G.; Coma, J.; Sol, S.; Cabeza, L.F. Green facade for energy savings in buildings: The influence of leaf area index and facade orientation on the shadow effect. Appl. Energy 2017, 187, 424–437. [Google Scholar] [CrossRef]
- Perini, K.; Rosasco, P. Cost-benefit analysis for green façades and living wall systems. Build. Environ. 2013, 70, 110–121. [Google Scholar] [CrossRef]
- Pérez, G.; Rincón, L.; Vila, A.; González, J.M.; Cabeza, L.F. Green vertical systems for buildings as passive systems for energy savings. Appl. Energy 2011, 88, 4854–4859. [Google Scholar] [CrossRef]
- Hunter, A.M.; Williams, N.S.; Rayner, J.P.; Aye, L.; Hes, D.; Livesley, S.J. Quantifying the thermal performance of green façades: A critical review. Ecol. Eng. 2014, 63, 102–113. [Google Scholar] [CrossRef]
- Kahn, H.C. Philosophy Before Socrates. Anc. Philos. 1997, 17. [Google Scholar] [CrossRef]
- Wong, I.; Baldwin, A.N. Investigating the potential of applying vertical green walls to high-rise residential buildings for energy-saving in sub-tropical region. Build. Environ. 2016, 97, 34–39. [Google Scholar] [CrossRef]
- Perez, G.; Rincon, L.; Vila, A.J.; Gonzalez, J.; Cabeza, L.F. Behaviour of green facades in Mediterranean Continental climate. Energy Convers. Manag. 2011, 52, 1861–1867. [Google Scholar] [CrossRef]
- Othman, A.R.; Sahidin, N. Vertical Greening Façade as Passive Approach in Sustainable Design. Proc. Soc. Behav. Sci. 2016, 222, 845–854. [Google Scholar] [CrossRef]
- Akbari, H.; Bretz, S.; Kurn, D.M.; Hanford, J. Peak power and cooling energy savings of high-albedo roofs. Energy Build. 1997, 25, 117–126. [Google Scholar] [CrossRef]
- Rosenfeld, A.H.; Akbari, H.; Bretz, S.; Fishman, B.L.; Kurn, D.M.; Sailor, D.; Taha, H. Mitigation of Urban Heat Islands: Materials, Utility Program, Updates. Energy Build. 1993, 22, 255–265. [Google Scholar] [CrossRef]
- Rosenfeld, A.H.; Akbari, H.; Romm, J.J.; Pomerantz, M. Cool communities: Strategies for heat island mitigation and smog reduction. Energy Build. 1998, 28, 51–62. [Google Scholar] [CrossRef]
- De la Flor, F.S.; Domínguez, S.A. Modelling microclimate in urban environments and assessing its influence on the performance of surrounding buildings. Energy Build. 2004, 36, 403–413. [Google Scholar] [CrossRef]
- Hassid, S.; Santamouris, M.; Papanikolaou, N.; Linardi, A.; Klitsikas, N.; Georgakis, C.; Assimakopoulos, D. Effect of the Athens heat island on air conditioning load. Energy Build. 2000, 32, 131–141. [Google Scholar] [CrossRef]
- Salvati, A.; Roura, H.C.; Cecere, C. Assessing the urban heat island and its energy impact on residential buildings in Mediterranean climate: Barcelona case study. Energy Build. 2017, 146, 38–54. [Google Scholar] [CrossRef]
- Sun, Y.; Augenbroe, G. Urban heat island effect on energy application studies of office buildings. Energy Build. 2014, 77, 171–179. [Google Scholar] [CrossRef]
- Invidiata, A.; Ghisi, E. Impact of climate change on heating and cooling energy demand in houses in Brazil. Energy Build. 2016, 130, 20–32. [Google Scholar] [CrossRef]
- Crawl, D.B. Estimating the impacts of climate change and urbanization on building performance. J. Build. Perform. Simul. 2008, 1, 91–115. [Google Scholar] [CrossRef]
- Omer, A.M. Energy, environment and sustainable development. Renew. Sustain. Energy Rev. 2008, 12, 2265–2300. [Google Scholar] [CrossRef]
- Omer, A.M. Renewable building energy systems and passive human comfort solutions. Renew. Sustain. Energy Rev. 2008, 12, 1562–1587. [Google Scholar] [CrossRef]
- Feng, Y. Thermal design standards for energy efficiency of residential buildings in hot summer/cold winter zones. Energy Build. 2004, 36, 1309–1312. [Google Scholar] [CrossRef]
- Ekici, B.B.; Aksoy, U.T. Prediction of building energy needs in early stage of design by using ANFIS. Expert Syst. Appl. 2011, 38, 5352–5358. [Google Scholar] [CrossRef]
- Pacheco, R.; Ordóñez, J.; Martínez, G. Energy efficient design of building: A. review. Renew. Sustain. Energy Rev. 2012, 16, 3559–3573. [Google Scholar] [CrossRef]
- Norton, B.A.; Coutts, A.M.; Livesley, S.J.; Harris, R.J.; Hunter, A.M.; Williams, N.S.G. Planning for cooler cities: A framework to prioritise green infrastructure to mitigate high temperatures in urban landscapes. Landsc. Urban. Plan. 2015, 134, 127–138. [Google Scholar] [CrossRef]
- Elsadek, M.; Liu, B.; Lian, Z. Green façades: Their contribution to stress recovery and well-being in high-density cities. Urban. For. Urban. Green. 2019, 46, 126446. [Google Scholar] [CrossRef]
- Aljundi, K.; Pinto, A.; Rodrigues, F. Energy Analysis Using Cooperation Between Bim Tools (Revit and Green Building Studio) and Energy Plus. In Proceedings of the 1º Congresso Português de Building Information Modelling, Guimaraes, Portugal, 24–25 November 2016; pp. 309–319. [Google Scholar]
- Luziani, S.; Paramita, B. Autodesk Green Building Studio an Energy Simulation Analysis in the Design Process. KnE Soc. Sci. 2019, 735–749. [Google Scholar] [CrossRef]
- Neuman, M. Centenary paper: Ildefons Cerdà and the future of spatial planning: The network urbanism of a city planning pioneer. Town Plan. Rev. 2011, 82, 117–144. [Google Scholar] [CrossRef]
- Bustami, R.A.; Belusko, M.; Ward, J.; Beecham, S. Vertical greenery systems: A systematic review of research trends. Build. Environ. 2018, 146, 226–237. [Google Scholar] [CrossRef]
- Manso, M.; Castro-Gomes, J. Green wall systems: A review of their characteristics. Renew. Sustain. Energy Rev. 2015, 41, 863–871. [Google Scholar] [CrossRef]
- Ashmawy, R.E.; Azmy, N.Y. Buildings Orientation and its Impact on the Energy Consumption. Acad. Res. Community Publ. 2018, 2, 35. [Google Scholar] [CrossRef]


| Physical–Environmental Parameters | Design Parameters |
|---|---|
| Daily outside temperature (°C) Solar radiation (W/m2) Wind direction and speed (m/s) | Shape factor Transparent surface Orientation Thermal–physical properties of building materials Distance between buildings |
| Test | Facade Type | Cavity | Building Orientation | Facade Structure | |
|---|---|---|---|---|---|
| Single Layer | Second Layer | ||||
| 1 | Single-skin facade | - | 0 | Southeast | Curtain wall (main facade) |
| 2 | - | Green-skin facade | 10 cm | Southeast | Facade-supported green wall (horizontal aluminum slats) |
| 3 | - | Green-skin facade | 20 cm | Southeast | Facade-supported green wall (horizontal aluminum slats) |
| 4 | - | Green-skin facade | 30 cm | Southeast | Facade-supported green wall (horizontal aluminum slats) |
| 5 | - | Green-skin facade | 40 cm | Southeast | Facade-supported green wall (horizontal aluminum slats) |
| 6 | - | Green-skin facade | 50 cm | Southeast | Facade-supported green wall (horizontal aluminum slats) |
| Name | Floor Area (m2) | Energy Use Intensity (MJ/m2/year) | Electric Cost (/kWh) | Fuel Cost (/MJ) | Total Annual Cost | Total Annual Energy | ||||
|---|---|---|---|---|---|---|---|---|---|---|
| Electric | Fuel | Energy | Electric (kWh) | Fuel (MJ) | Carbon Emissions (Mg) | |||||
| Green Skin 50 cm Cavity | 91 | 1063.4 | €0.13 | €0.01 | €1675 | €568 | €2243 | 13,397 | 48,897 | -- |
| Green Skin 40 cm Cavity | 91 | 1063.6 | €0.13 | €0.01 | €1644 | €579 | €2223 | 13,150 | 49,811 | -- |
| Green Skin 30 cm Cavity | 91 | 1064.7 | €0.13 | €0.01 | €1668 | €572 | €2240 | 13,342 | 49,216 | -- |
| Green Skin 20 cm Cavity | 91 | 1045.6 | €0.13 | €0.01 | €1613 | €570 | €2183 | 12,901 | 49,063 | -- |
| Green Skin 10 cm Cavity | 91 | 1053.1 | €0.13 | €0.01 | €1602 | €582 | €2184 | 12,817 | 50,045 | -- |
| Single Skin | 91 | 1081.3 | €0.13 | €0.01 | €2247 | €396 | €2643 | 17,974 | 34,062 | -- |
| Building Orientation | Monthly Data | |
|---|---|---|
| Total Energy (Single-Skin Facade) | Total Energy (Green-Skin Facade) | |
Test 1: South |  |  |
Test 2: Southeast |  |  |
Test 3: Southwest |  |  |
Test 4: East |  |  |
Test 5: North |  |  |
Test 6: Northeast |  |  |
Test 7: Northwest |  |  |
Test 8: West |  |  |
 Area Lights Area Lights  Misc Equip Misc Equip  Space Cooling Space Cooling  Vent Fans Vent Fans  Pumps Aux Pumps Aux  Space Heat Space Heat  Hot Water Hot Water | ||
| Energy Consumption at Eight Orientations | ||||||||||
|---|---|---|---|---|---|---|---|---|---|---|
| South | Southeast | Southwest | East | North | Northeast | Northwest | West | |||
| Total Annual Energy Cost (€) | Single Facade | €2600 | €2633 | €2863 | €2641 | €2242 | €2403 | €2711 | €2888 | |
| Green Facade | €2273 | €2183 | €2351 | €2214 | €2232 | €2239 | €2282 | €2352 | ||
| Total Annual Energy | Electric (KWh) | Single Facade | 18,177 | 17,918 | 20,045 | 16,914 | 12,820 | 14,346 | 17,023 | 19,393 |
| Green Facade | 13,782 | 12,880 | 14,364 | 12,692 | 12,441 | 12,766 | 13,111 | 13,891 | ||
| Fuel (MJ) | Single Facade | 28,209 | 33,832 | 30,734 | 45,314 | 12,820 | 52,445 | 50,137 | 39,883 | |
| Green Facade | 47,365 | 49,287 | 47,824 | 53,952 | 58,220 | 55,378 | 55,335 | 52,965 | ||
| Energy Use Intensity (MJ/m2/year) | Single Facade | 1025.3 | 1076.6 | 1126.5 | 1162.7 | 1107.7 | 1139.6 | 1219.8 | 1201.0 | |
| Green Facade | 1061.7 | 1047.3 | 1089.7 | 1090.9 | 1127.8 | 1109.4 | 1122.6 | 1127.4 | ||
| Annual Electric End-Use | Annual Fuel End-Use | ||||||
|---|---|---|---|---|---|---|---|
| HVAC | Lights | Other | HVAC | Other | |||
| 1 | South | Single Skin | 54.3% | 18.0% | 27.7% | 77.2% | 22.8% |
| Green Skin | 39.8% | 23.7% | 36.5% | 86.4% | 13.6% | ||
| 2 | Southeast | Single Skin | 53.7% | 18.2% | 28.1% | 81.0% | 19.0% |
| Green Skin | 35.5% | 25.4% | 39.1% | 87.0% | 13.0% | ||
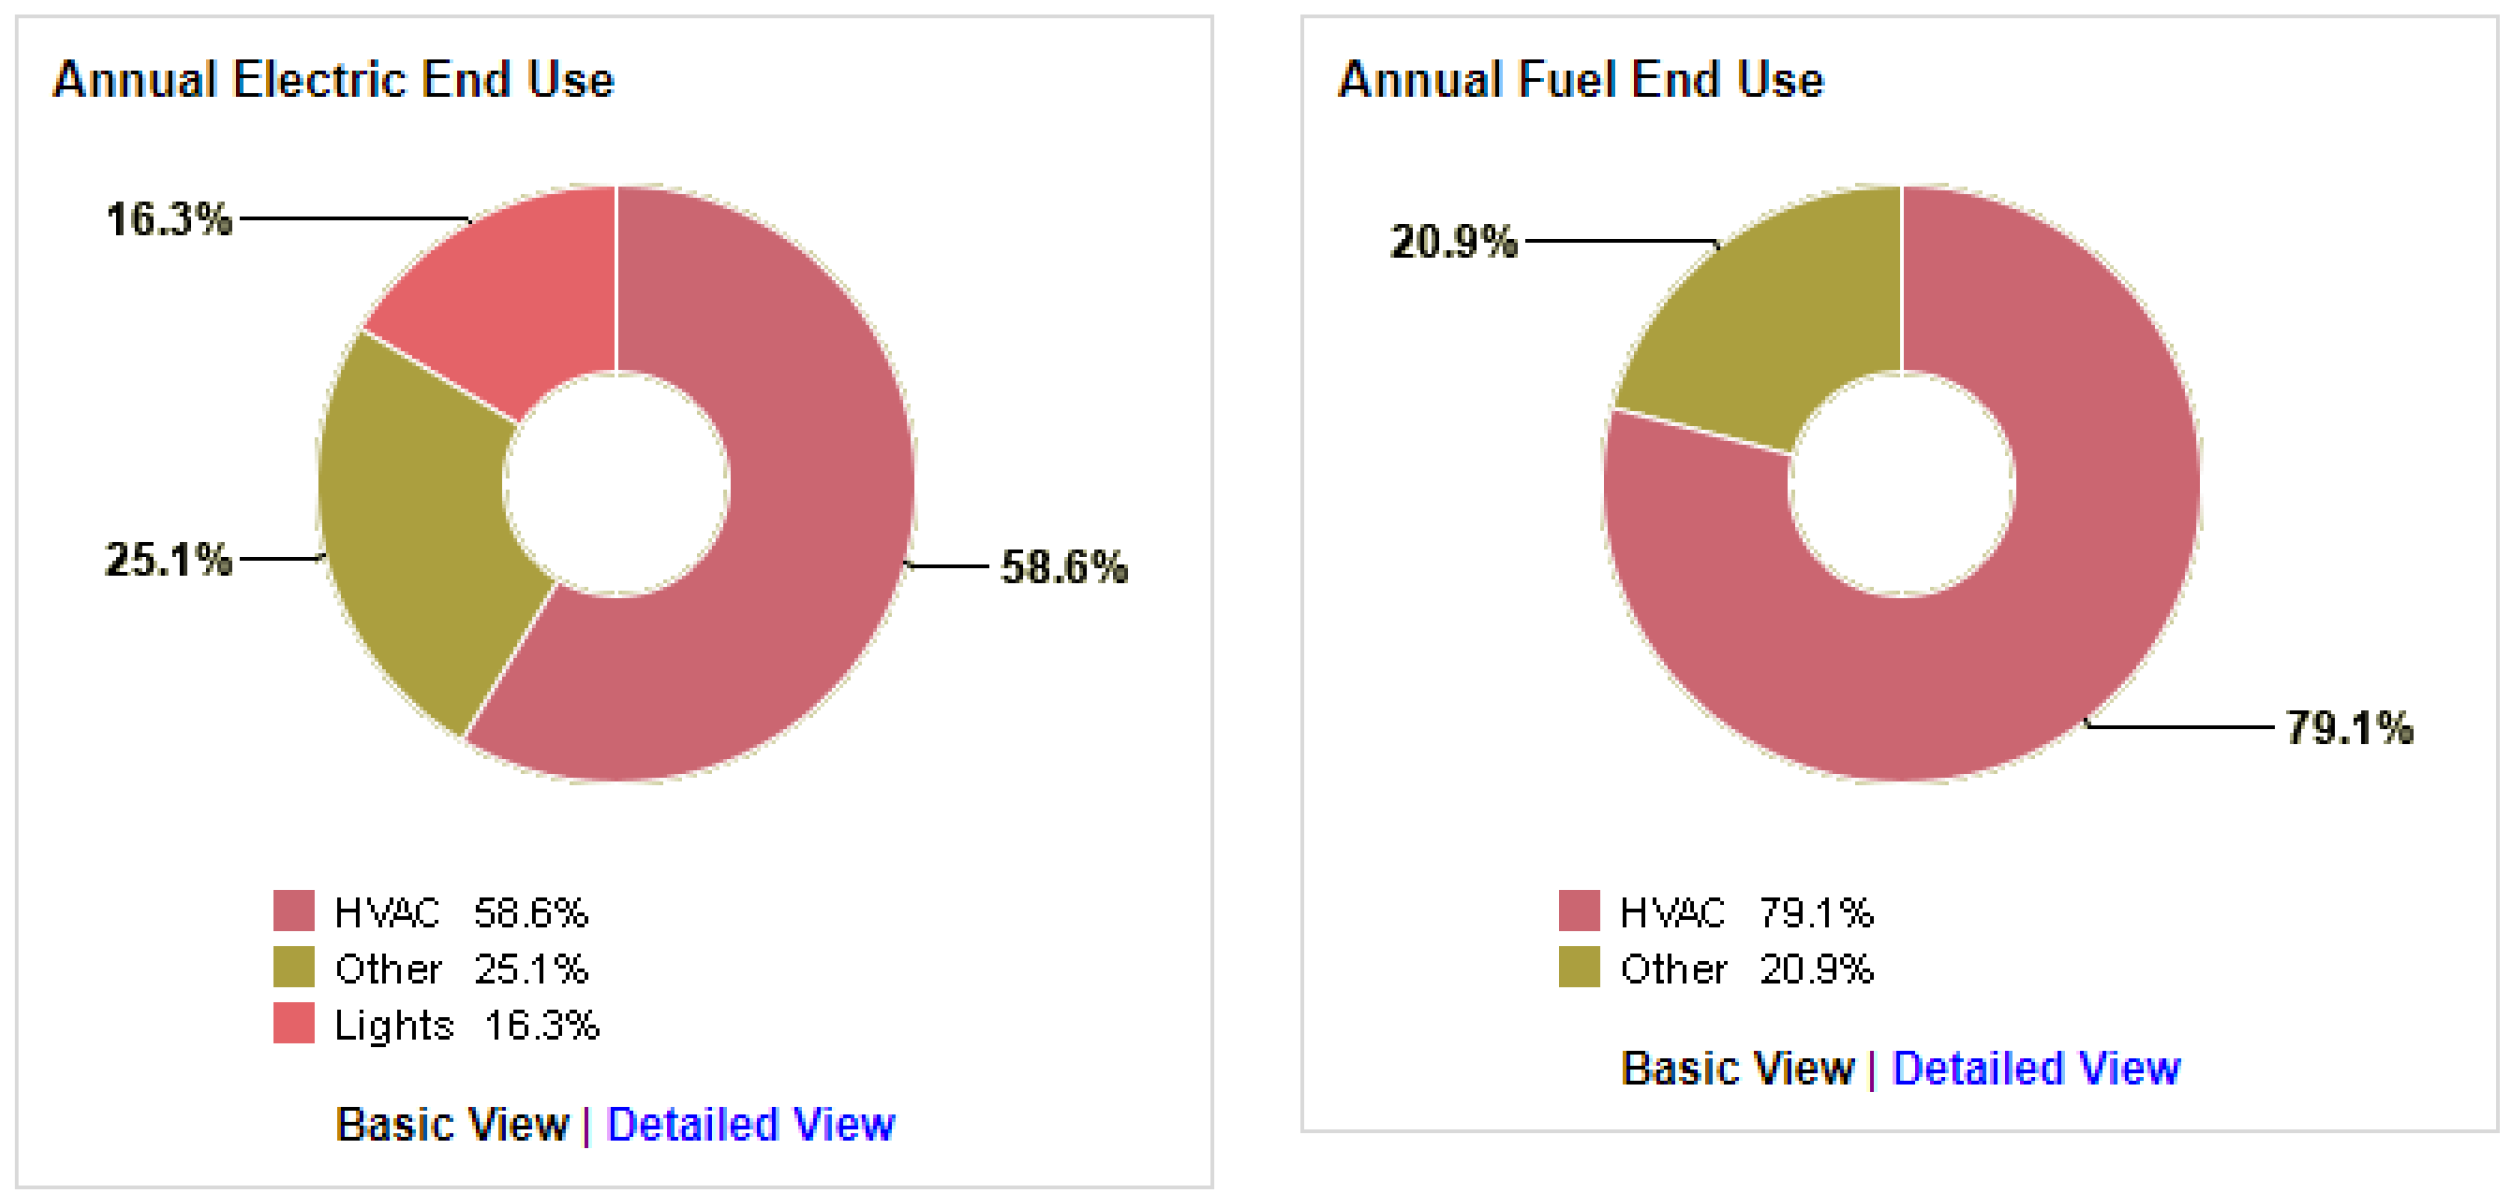
| 3 | Southwest | Single Skin | 58.6% | 16.3% | 25.1% | 79.1% | 20.9% |
| Green Skin | 42.2% | 22.8% | 35.0% | 86.6% | 13.4% | ||
| 4 | East | Single Skin | 50.9% | 19.3% | 29.8% | 85.8% | 14.2% |
| Green Skin | 34.6% | 25.7% | 39.7% | 88.1% | 11.9% | ||
| 5 | North | Single Skin | 35.2% | 25.5% | 39.3% | 88.3% | 11.7% |
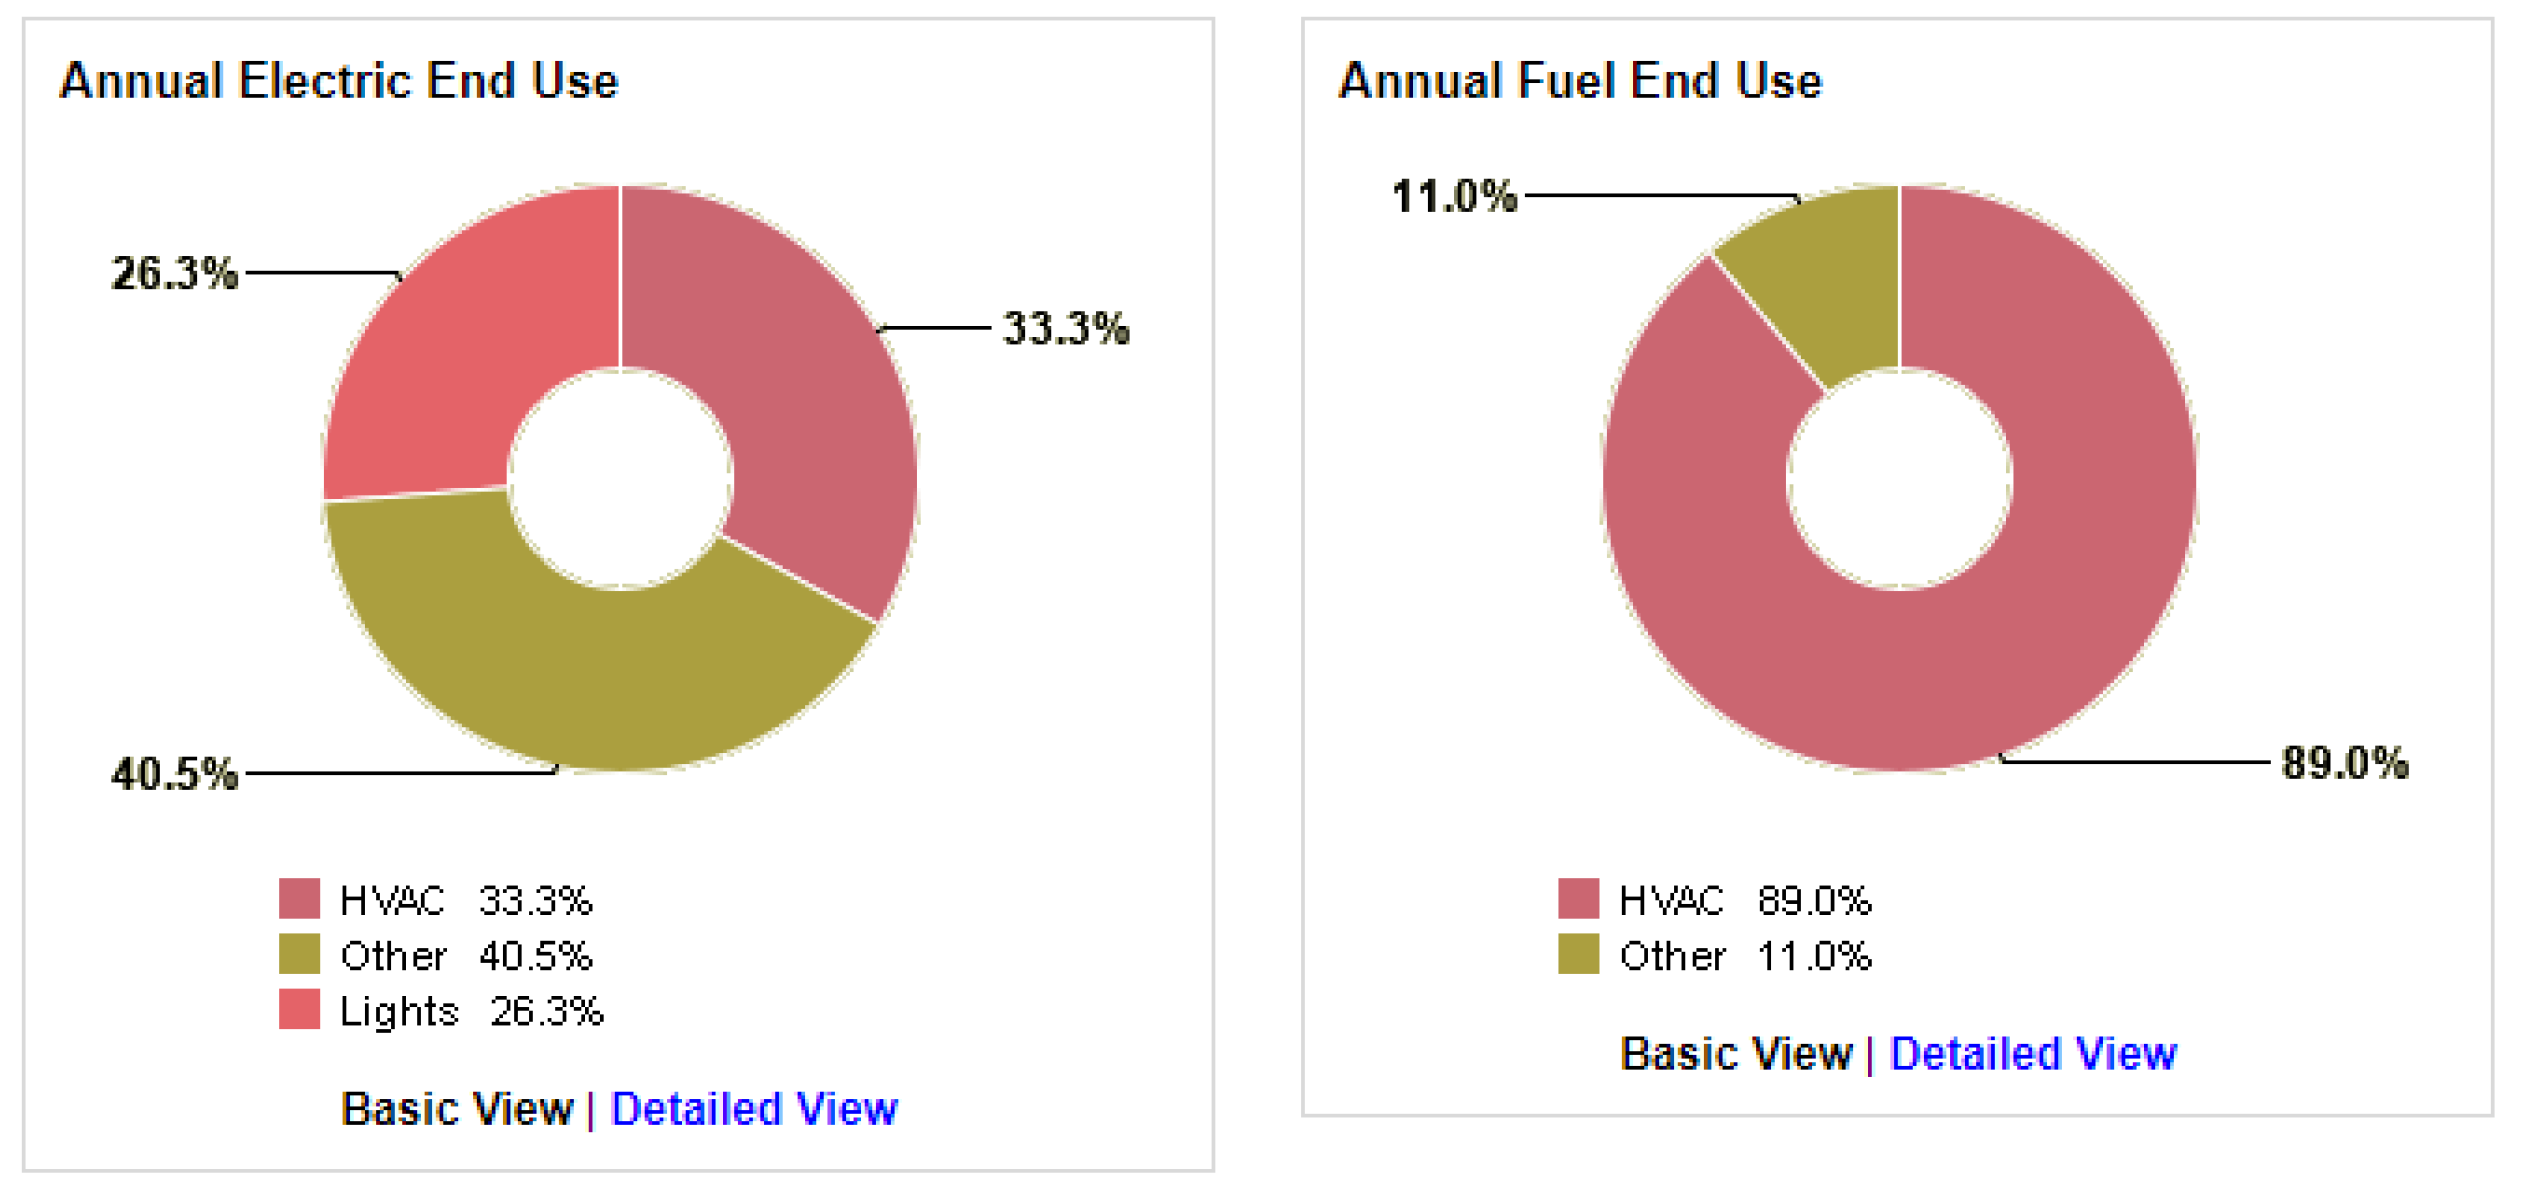
| Green Skin | 33.3% | 26.3% | 40.5% | 89.0% | 11.0% | ||
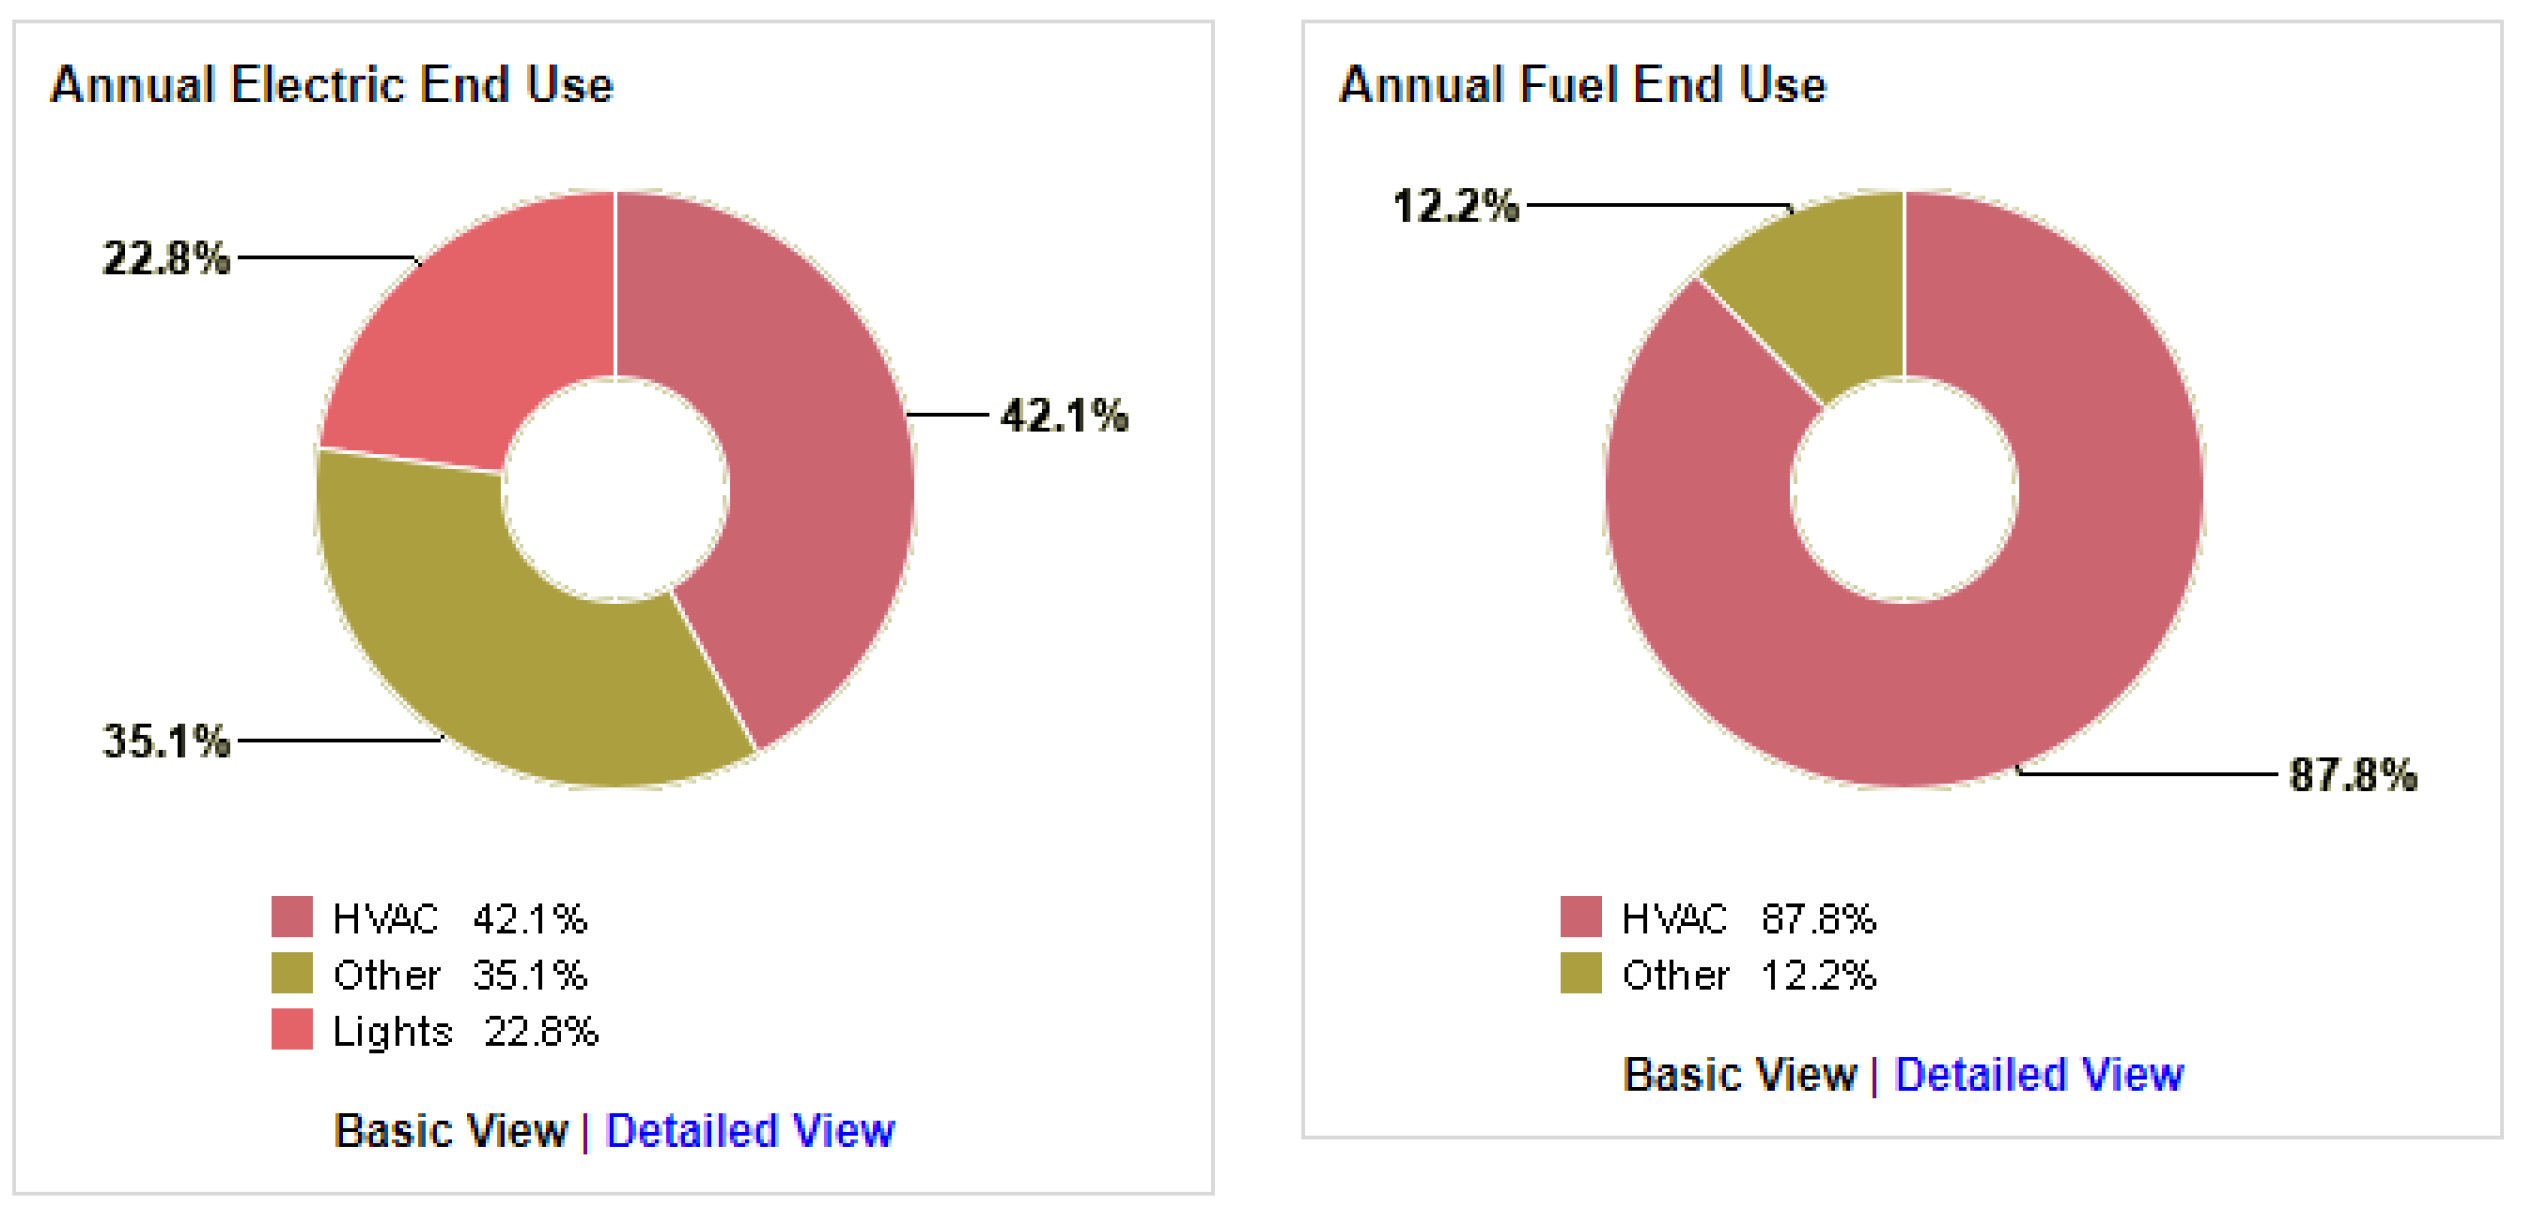
| 6 | Northeast | Single Skin | 42.1% | 22.8% | 35.1% | 87.8% | 12.2% |
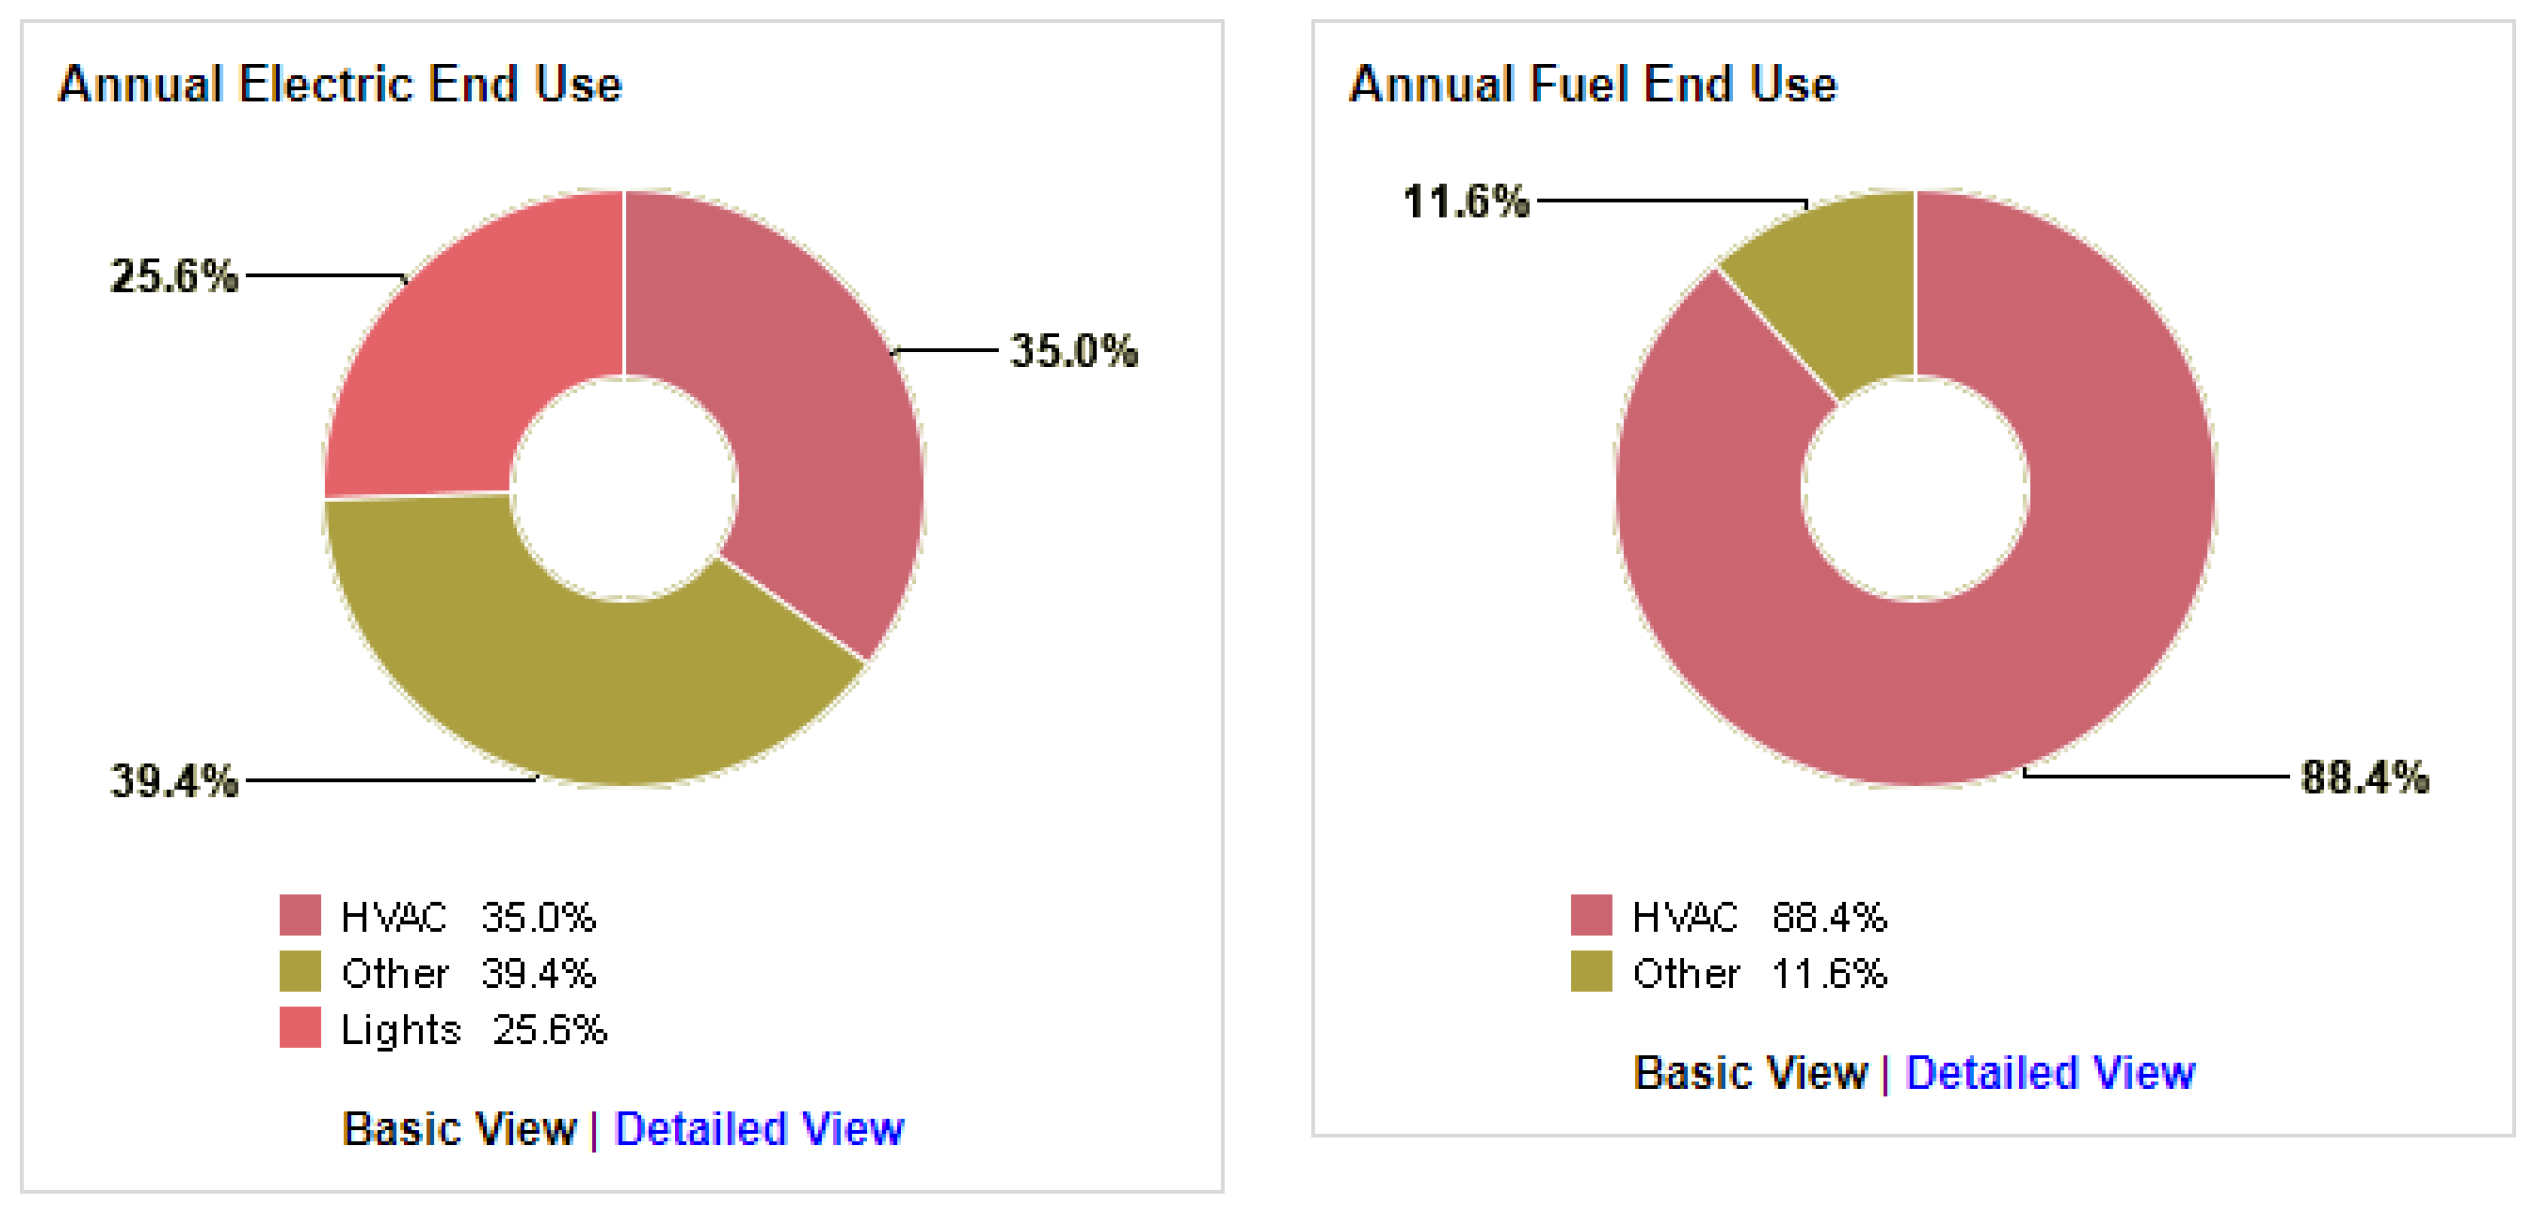
| Green Skin | 35.0% | 25.6% | 39.4% | 88.4% | 11.6% | ||
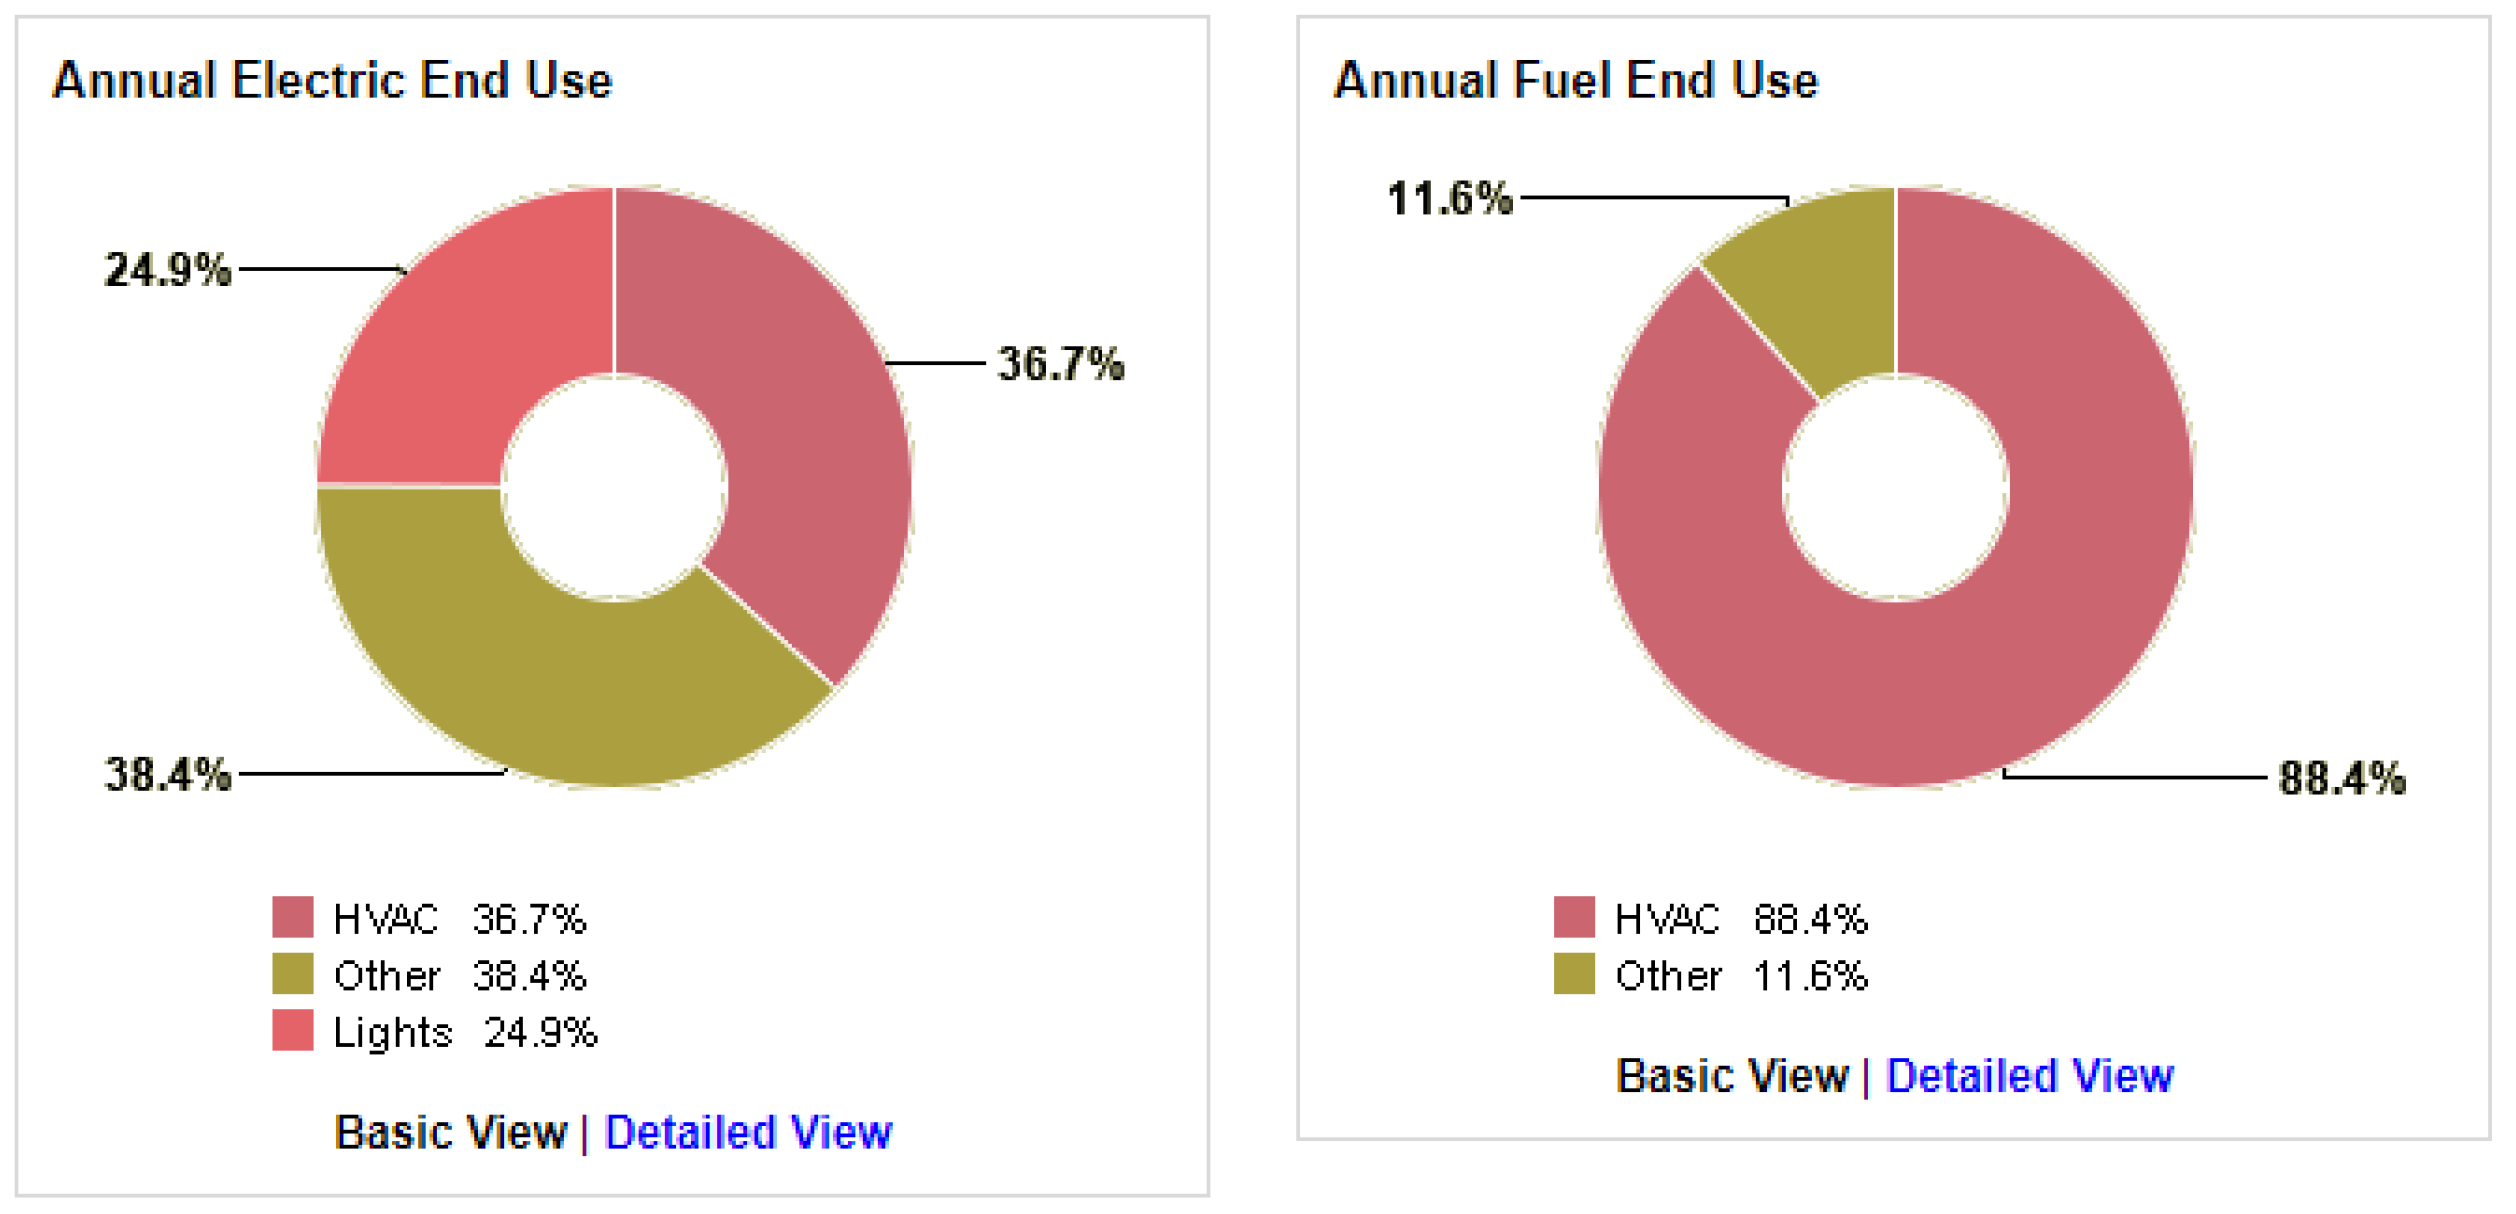
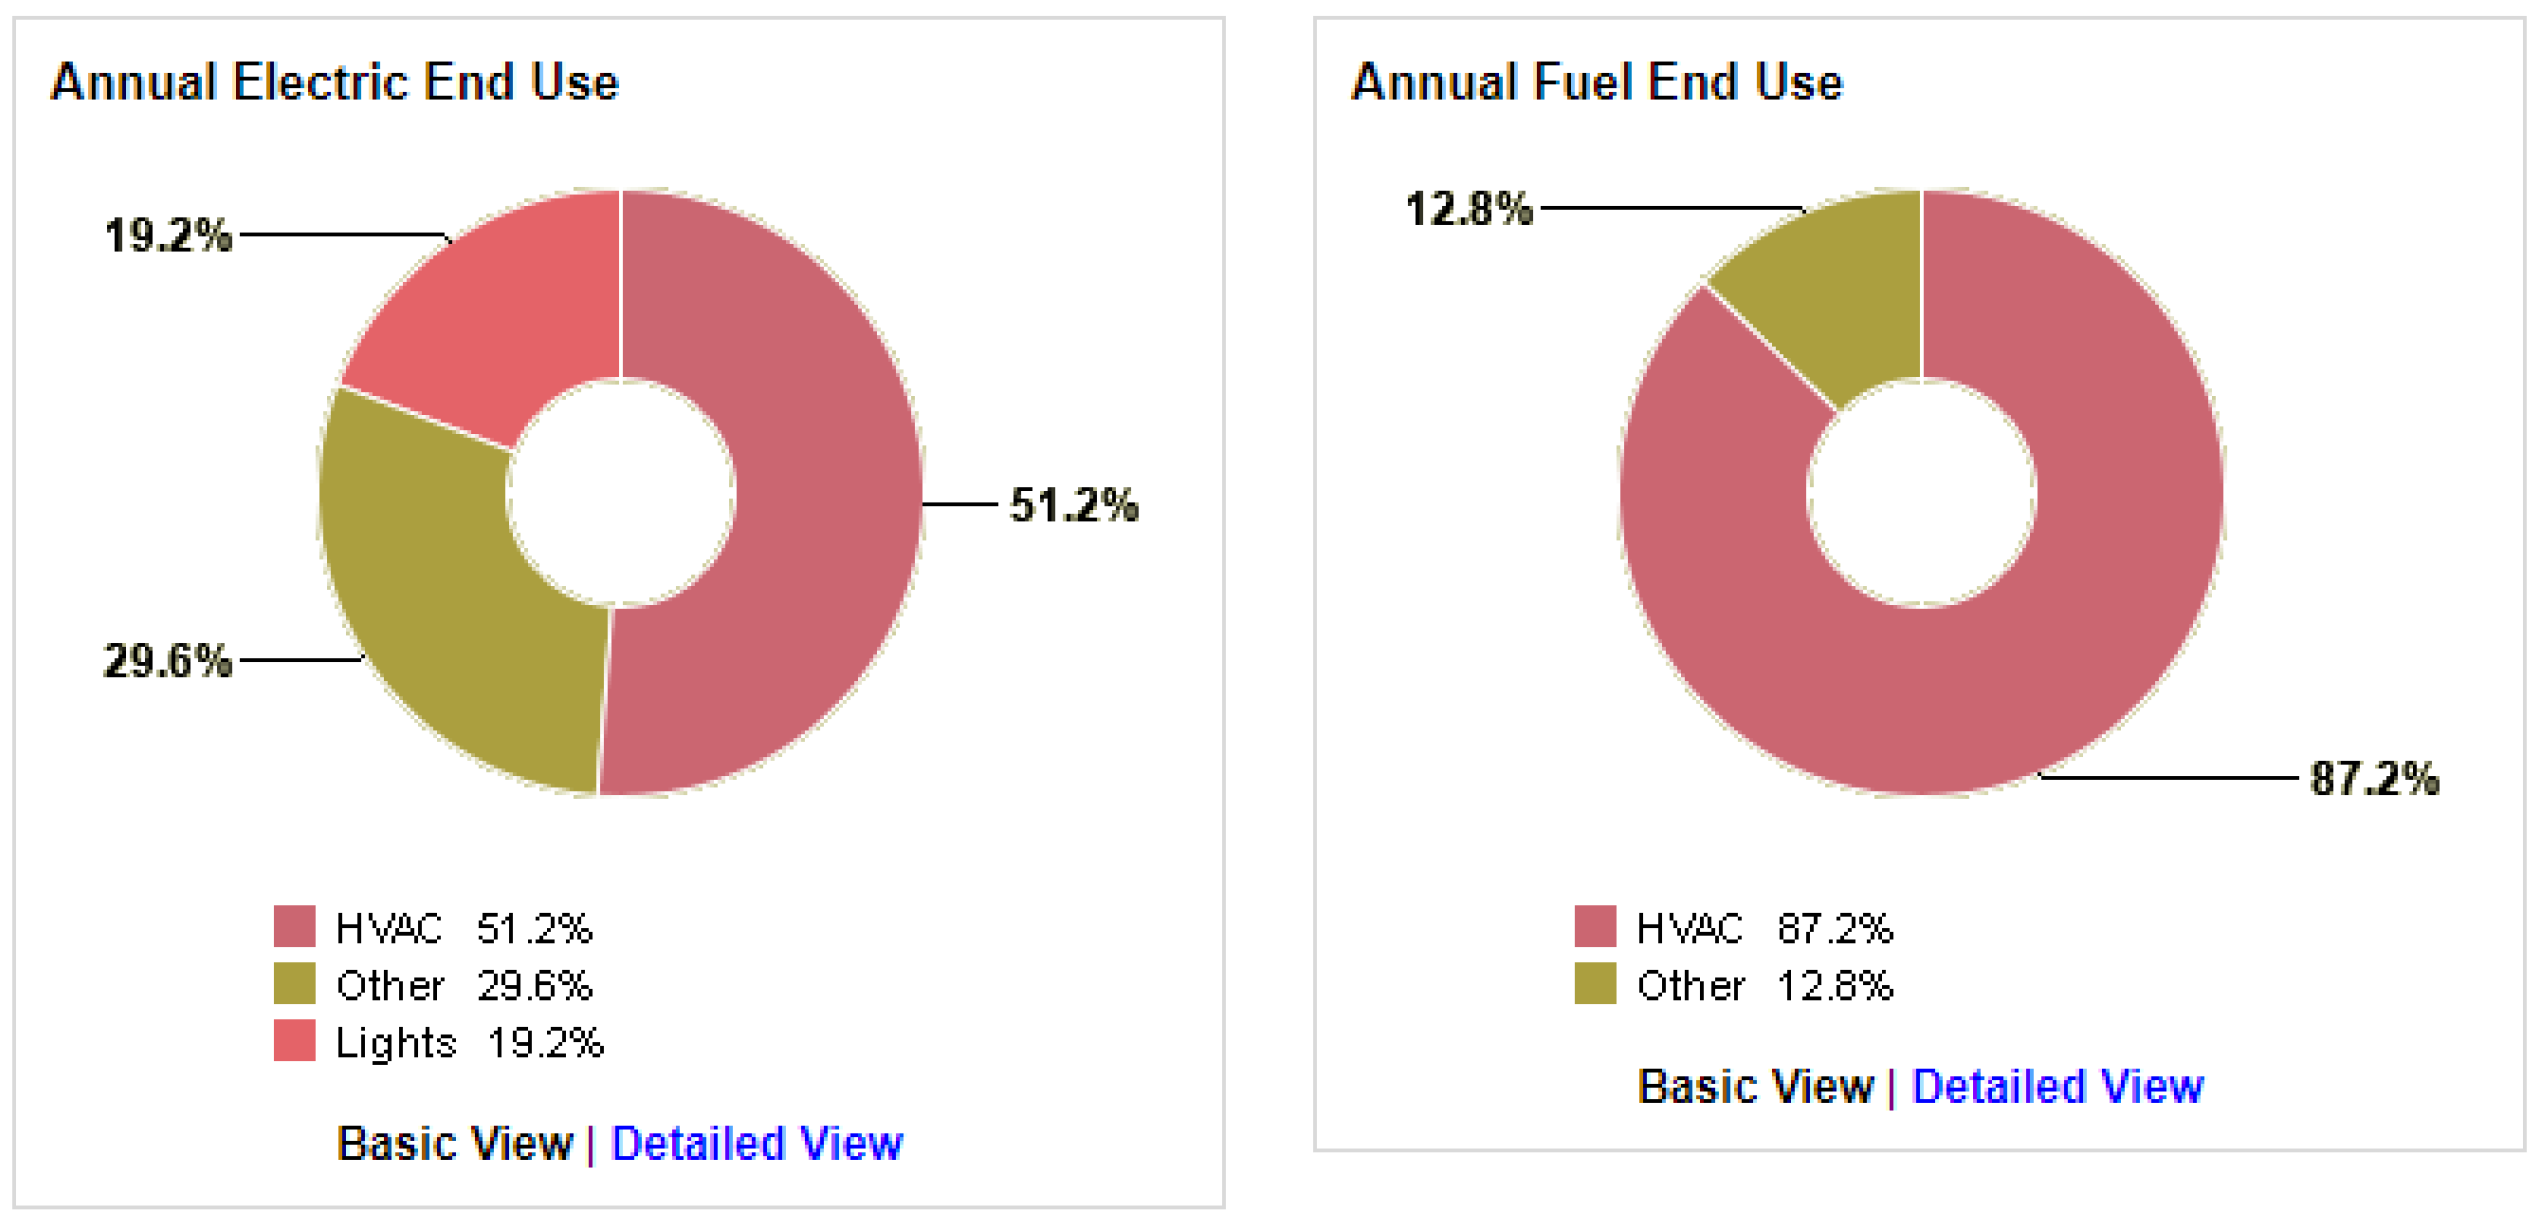
| 7 | Northwest | Single Skin | 51.2% | 19.2% | 29.6% | 87.2% | 12.8% |
| Green Skin | 36.7% | 24.9% | 38.4% | 88.4% | 11.6% | ||
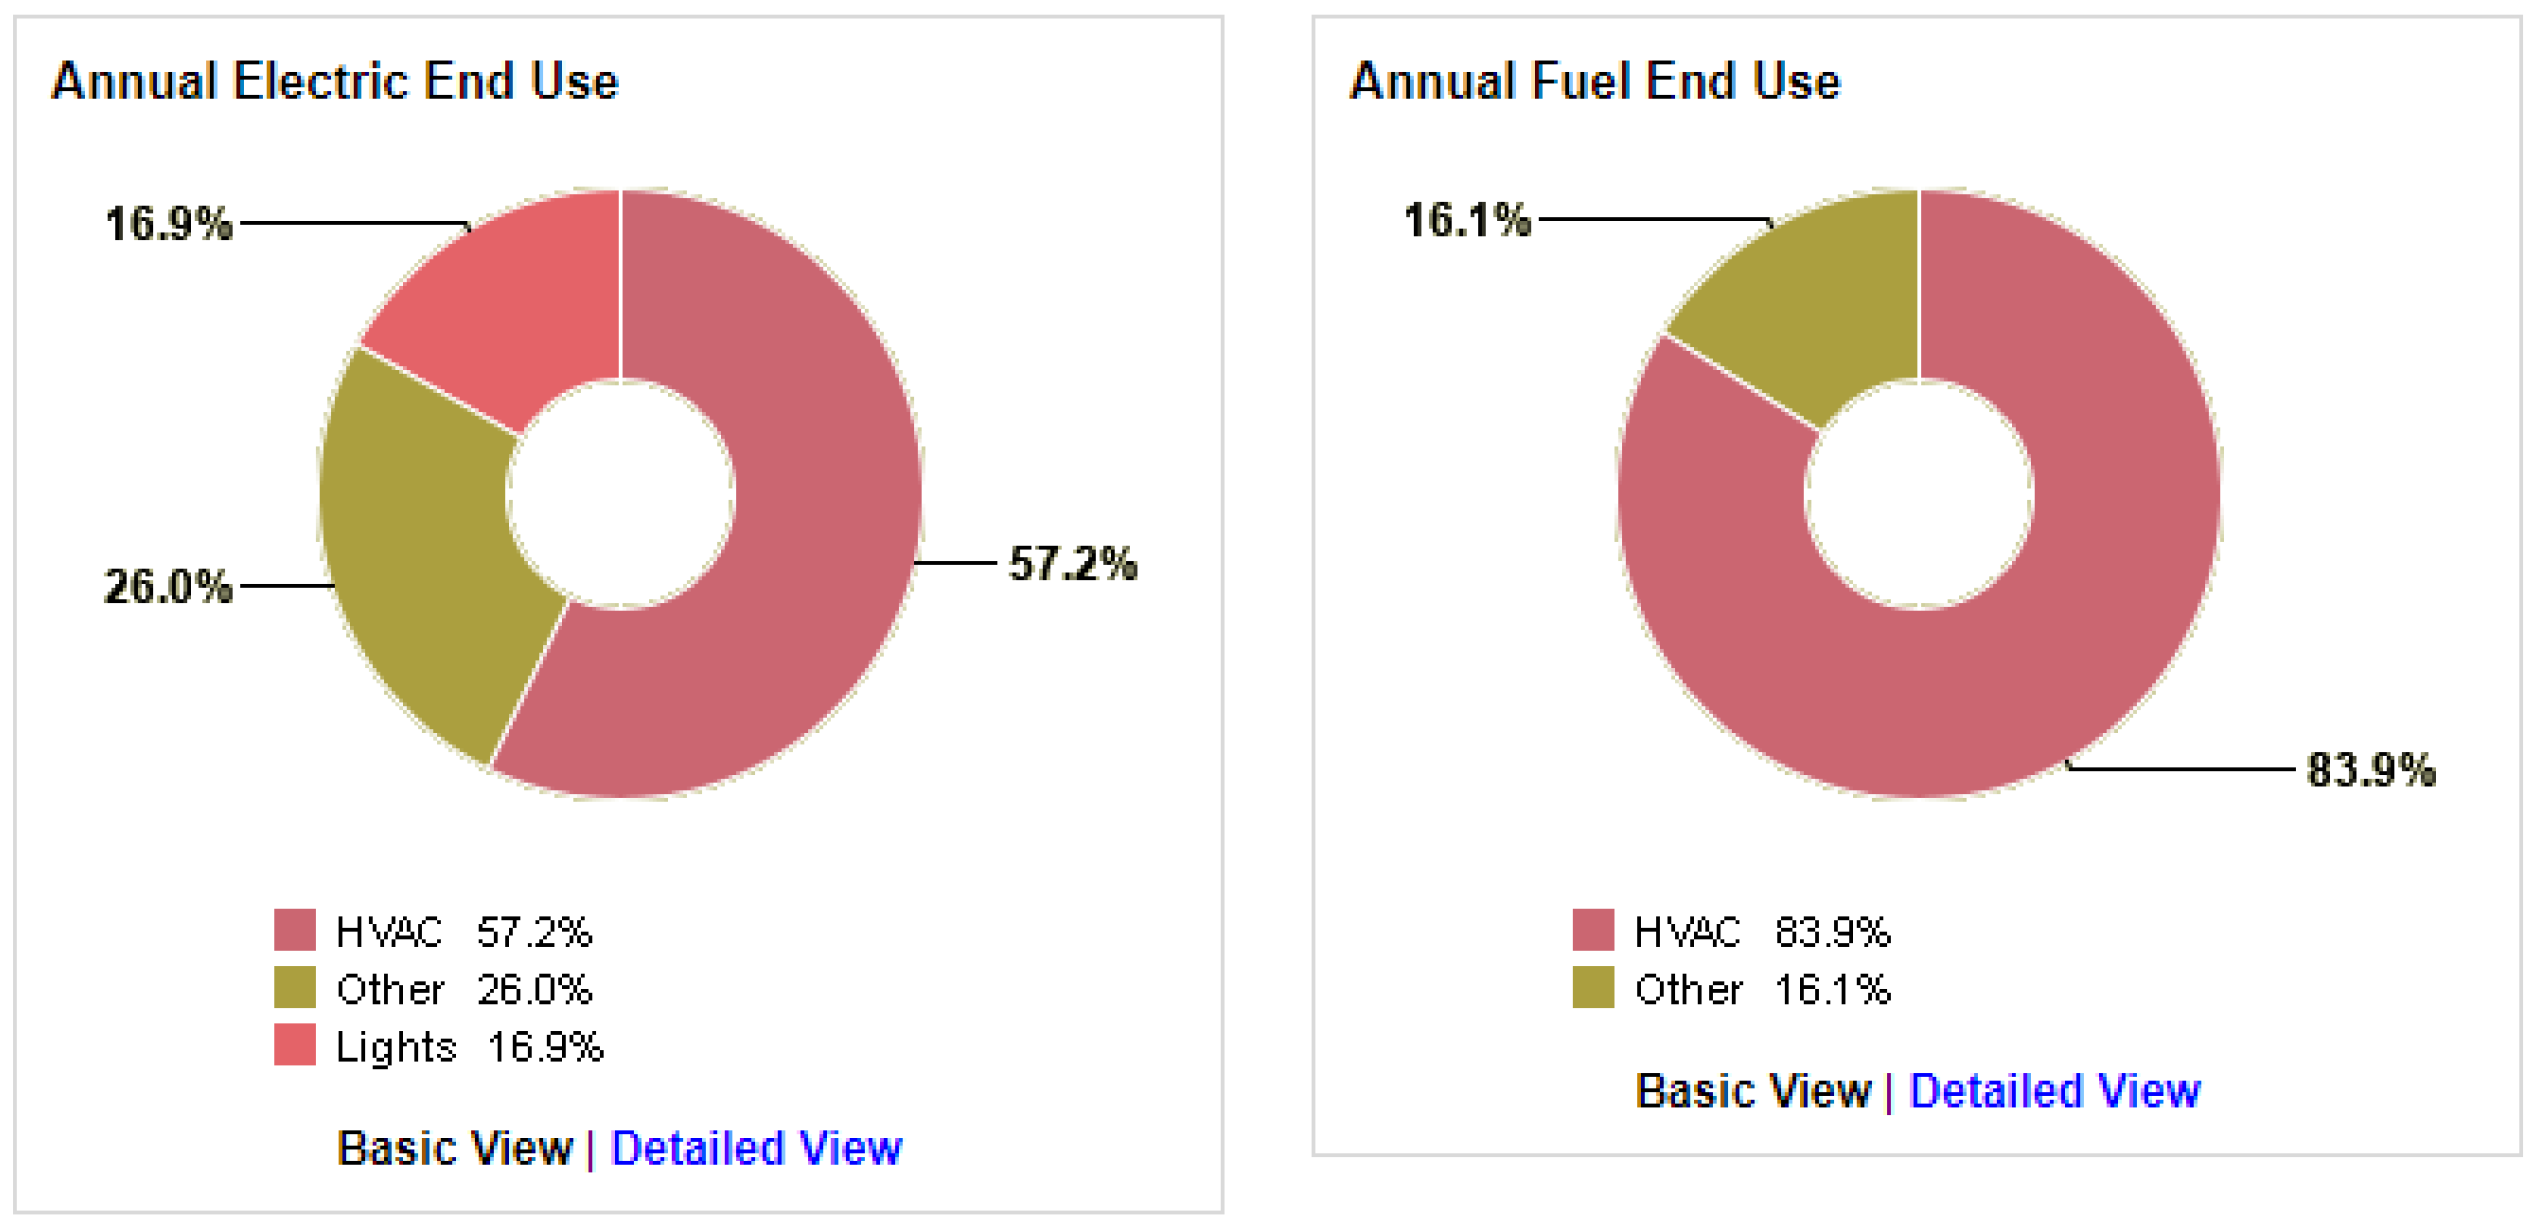
| 8 | West | Single Skin | 57.2% | 16.9% | 26.0% | 83.9% | 16.1% |
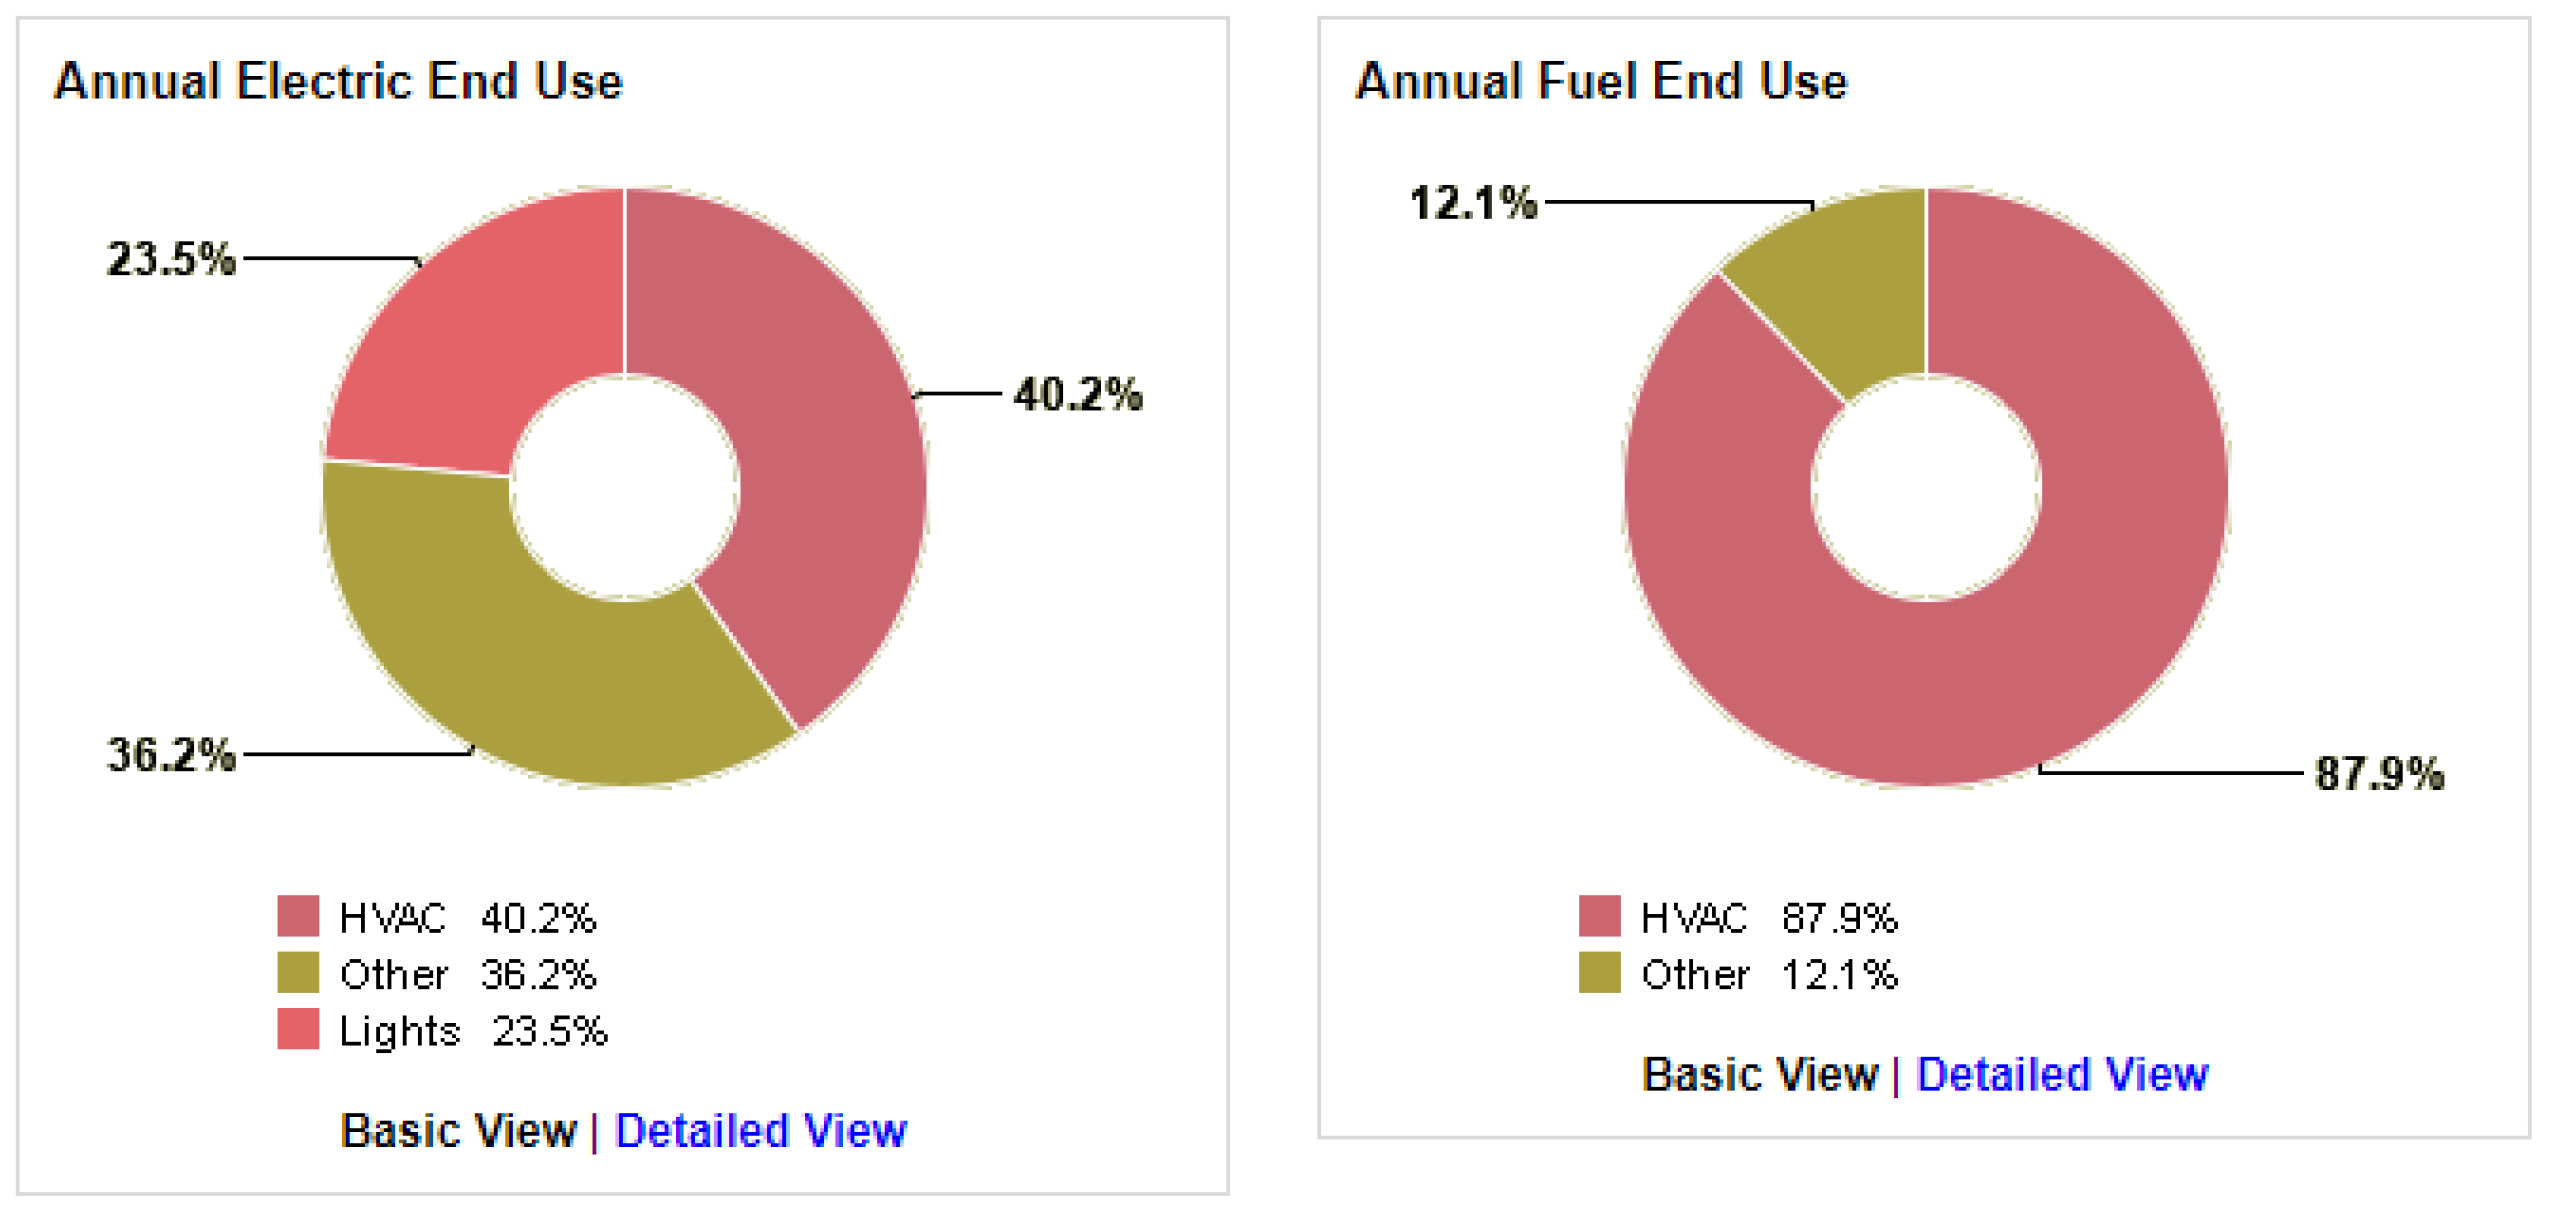
| Green Skin | 40.2% | 23.5% | 36.2% | 87.9% | 12.1% | ||
Publisher’s Note: MDPI stays neutral with regard to jurisdictional claims in published maps and institutional affiliations. |
© 2020 by the authors. Licensee MDPI, Basel, Switzerland. This article is an open access article distributed under the terms and conditions of the Creative Commons Attribution (CC BY) license (http://creativecommons.org/licenses/by/4.0/).
Share and Cite
Bagheri Moghaddam, F.; Fort Mir, J.M.; Besné Yanguas, A.; Navarro Delgado, I.; Redondo Dominguez, E. Building Orientation in Green Facade Performance and Its Positive Effects on Urban Landscape Case Study: An Urban Block in Barcelona. Sustainability 2020, 12, 9273. https://doi.org/10.3390/su12219273
Bagheri Moghaddam F, Fort Mir JM, Besné Yanguas A, Navarro Delgado I, Redondo Dominguez E. Building Orientation in Green Facade Performance and Its Positive Effects on Urban Landscape Case Study: An Urban Block in Barcelona. Sustainability. 2020; 12(21):9273. https://doi.org/10.3390/su12219273
Chicago/Turabian StyleBagheri Moghaddam, Faezeh, Josep Maria Fort Mir, Alia Besné Yanguas, Isidro Navarro Delgado, and Ernest Redondo Dominguez. 2020. "Building Orientation in Green Facade Performance and Its Positive Effects on Urban Landscape Case Study: An Urban Block in Barcelona" Sustainability 12, no. 21: 9273. https://doi.org/10.3390/su12219273
APA StyleBagheri Moghaddam, F., Fort Mir, J. M., Besné Yanguas, A., Navarro Delgado, I., & Redondo Dominguez, E. (2020). Building Orientation in Green Facade Performance and Its Positive Effects on Urban Landscape Case Study: An Urban Block in Barcelona. Sustainability, 12(21), 9273. https://doi.org/10.3390/su12219273