Abstract
The purpose of this study is to determine whether the support of top management significantly improves the level of environmental collaboration with participating companies upstream and downstream of the green supply chain and the impact on environmental performance. The results of the empirical analysis of 301 companies that are establishing a green supply chain are as follows. First, top management’s support positively affects the level of collaboration with suppliers and customers in the green supply chain. Secondly, support from top management has a direct impact on the company’s environmental performance. Thirdly, the environmental collaboration of participating companies partially plays a mediation role between the support of top management and the environmental performance. This study has significance in that it analyzes the theoretical mechanism of top management’s support for environmental collaboration with participating companies, leading to environmental performance, and draws implications.
1. Introduction
Over the years, companies have been doing business with little concern for the environmental impacts that business activities can bring, such as the waste and destruction of resources [1]. As the awareness of such externalities, which is unintentionally caused by corporate activities, has become increasingly recognized, the scope of corporate responsibility stipulated by stakeholders has become wider and now corporate social responsibility is seen as a source of sustainable competitive advantage for companies [2].
Although social responsibility activities can be carried out at various levels [3], the supply chain management system, in which many stakeholders participate, is also one of the essential elements required for a company to gain a competitive edge. In 2001, Sony’s failure to manage its supply chain accounts for why environmental management of the supply chain is important: Cadmium, which is defined as an environmentally harmful substance, was detected in the company’s game machine parts, and 1.3 million game machines that had been produced were recovered in total, and the huge losses were transferred to the company [4]. Thus, overlooking environmental factors in supply chain management can be a significant risk to an enterprise. In particular, the negative effects of the products produced by a company on the environment—that is, the externalities of the enterprises that are not intended by them—occur mainly in the procurement of the raw materials and the manufacturing and use of the parts. Thus, cooperation in the green supply chain becomes more important than anything else [5,6].
Today, companies are faced with new challenges that must address the environmental and social issues that surround the enterprise in order to reduce the risks in the supply chain and continuously improve supply chain performance [7]. In this context, green supply chain management, a concept that incorporates environmental and social issues into traditional supply chain management, is attracting attention as a major way to create a sound and sustainable competitive advantage for the enterprise. Green supply chain management means a set of activities necessary to build a competitive supply chain, namely, adding the social and environmental themes, such as the use of harmful substances and a poor working environment in the manufacturing process, to the existing supply chain management concept, thereby minimizing the risks that may occur in the value chain and improving the performance of the supply chain [8,9].
This green supply chain management is considered to be one of the essential elements for sustainable development and survival of companies, and more and more companies are striving to build green supply chains. In this respect, recently, academia has focused on green supply chain management, and research on it has been actively conducted [10]. For example, researchers have been examining supply chain collaboration measures [11], studying the variables consisting of green supply chains [12], factors promoting the introduction of green supply chains [13,14], and studying the correlation between green supply chain management and firm performance [10,15,16]. Researchers also have expanded the research scope centered around these topics.
The role of top management is crucial in the study of green supply chain management and performance [17,18]. This is because top management has the greatest influence on the organization, making major decisions in the organization [17,18,19], and their decisions affect the structure and performance of the organization [20].
The top management is the most important set of people in determining the strategy and direction of the company and in predicting the performance of the company. Especially, the influence of top management is one of the factors that should be considered in the decision or achievement of a production/operation field, which is one of the important functions of an enterprise. Rather than focusing on the impact of top managements only, scholars have focused on the management elements within the firm, including some of the top executives. In this case, it is hard to see the significance and impact of top management due to this variable act as a general variable for internal management, and it cannot be concluded that it is the unique effect of top management.
Therefore, this study focuses on the impact of top management’s supportive attitude on green supply chain management, one of the psychological characteristics of top executives, and explains environmental performance. Specifically, a high level of top management support for green supply chain management (SCM) is expected to promote green SCM implementation and thus achieve a high environmental performance. In addition, the key to successfully leading a green SCM is in working with supply chain partners. In general, collaboration among companies in a supply chain is a relationship in which participants set common goals, share information and resources [21], and not only reward but also share corresponding responsibilities [22,23].
Soosay et al. [24] suggested that collaboration in the supply chain is a capability that results in continuous innovation of the enterprise. In green SCM, collaboration among these participating companies has been a key issue for explaining the sustainable competitiveness of these companies [25,26,27]. It is interesting to note that there is relatively little research on the relationship between the top management’s support, which is the most crucial variable explaining the competitiveness of green SCM, and the level of cooperation with participating companies in green SCM.
In the meantime, studies related to green SCM have not independently examined the attitudes of top management, and they are generally used as a comprehensive concept of “internal environmental management” [12]. However, “internal environmental management” or “environmental management orientation” is a concept that integrates the attitude of the top management and the programs or systems of the enterprise. In that case, it becomes more difficult for top management to have an independent influence on green SCM because each company’s internal factors have a mixed effect on the outcome variables.
There is a study by Burki et al. [28] that deals with the role of top management and environmental collaboration with participating companies in a similar perspective to this one. However, in these studies, (1) it is difficult to know the situation of the suppliers because the target companies are confined to the customers; (2) this study controls the financial performance, the type of industry, the introduction period of green SCM, and the position in the green SCM—which their study has not been able to control; and (3) while this study deals with environmental performance as a dependent variable, their research was approached from an innovative point of view, such as process innovation and managerial innovation. Therefore, this study is different from previous studies. In addition, Chu et al. [29] analyzed the impact of top management on green SCM and corporate performance, but the impact path is headed toward overall green SCM and social capital from top management. Kumar and Paraskevas [30] also deal with the characteristics of the top management team to explain environmental strategy, focusing on the observable characteristics of the top management team, such as age, gender, and experiences, whereas this study rather focuses on the unobservable characteristic of top management—their attitudes.
To sum up, the aforementioned literature rarely explained the role of environmental collaboration, which is one of the most necessary requirements for increasing environmental contribution (environmental performance). In addition, the prior studies have limitations in showing how top management is impacting directly on promoting collaboration among companies. With regard to this, the main purpose of this study is to identify the impact of environmental collaboration on environmental performance and to analyze the direct role of top management in increasing such environmental collaboration. In particular, by analyzing the mediating effects of environmental collaboration not only with suppliers but also with customers in the supply chain, we tried to help them to understand the mechanism of environmental performance with the support of top management from a more integrated perspective. Put simply, this paper attempts to answer three fundamental research questions:
Research question 1.
How does the support of top management affect environmental collaboration among companies in the green supply chain?
Research question 2.
Is environmental performance significantly increased by environmental collaboration between companies in the green supply chain?
Research question 3.
Does environmental collaboration with customers and their suppliers play a mediating role in the green supply chain?
From the sample of 301 Korean manufacturers in 2014, we found the empirical results as follows. First, the top management’s support toward green supply chain increases the environmental collaboration with the supply chain participants. We found that the top management’s support for the green supply chain also increases corporate environmental performance. Lastly, the environmental collaboration with the supply chain partners significantly mediates the relationship between top management support and environmental performance.
Our paper has some theoretical and practical contributions. Theoretically, this study extends the green SCM literature by focusing on the effect of a corporation’s top management team. Our empirical results indicate that the top management’s characteristics and attitudes can affect the process and outcomes of firms, supporting the claims of the existing upper echelon theory. Moreover, we separate the independent effects of top management support on the green SCM, which has so far been considered comprehensively as a component of the company’s internal environmental management. In addition, this study proposes a mechanism that connects the support of a corporate top management team to its environmental performance, considering various control variables that could affect the dependent variables. Practically, our study provides a fresh insight into companies and the role of top managers in promoting the implementation of functional-level strategies. Our results indicate that the top management’s active supporting attitude is crucial for the smooth implementation of the company’s functional strategy regarding green SCM.
The rest of this paper is organized as follows. The next section provides the theoretical background to the work. This is followed by a discussion of the direct effect of top management’s support on the environmental collaboration with the supply chain participants and the environmental performance. This study then considers the mediating effect of the environmental collaboration with the supply chain participants. Next, the study’s methodology is explained, and the analytical results presented. The final section provides a discussion of the results and draws conclusions.
2. Theoretical Background
2.1. Top Management’s Support and Environmental Collaboration with Participants
The top management of a firm is rated as the top decision maker and the most influential of the firm [31]. Therefore, the attitudes and support levels of top executives have a significant impact on the attitude or participation of the organizational members or organizational partners in accepting such practices, management activities, and systems [32]. In addition, it is almost impossible for the members of the organization who are actively involved in the activities, or their partners, to provide high level collaboration for the execution of the management activities without active support or willingness of the top management for the specific activities of the company.
Thus, the willingness and active support of top executives for the implementation of specific activities play an important role in the overall direction of the internal members and external partners and in the formation of a value chain. It will also play an essential role in promoting collaboration between enterprises [33]. In other words, in order to discuss the impact of eco-friendly collaboration with supply chain participants on environmental performance within the green supply chain, consideration should be given to the degree of support and attitude of the internal top management. Top management’s support for specific activities of an organization plays an important role in overcoming the resistance to changes that may exist within and outside the company by promoting information sharing and communication among organizations [34]. However, compared to traditional supply chain management, implementing green supply chain management involves more effort and expense. In addition, since all changes are accompanied by resistance, there is the possibility that there may be organizational members, or supply chain participants, resisting or having a wait-and-see attitude towards these changes, internally or externally, and irrespective of the environmental or historical need for environmentally friendly supply chain management [35].
Under these circumstances, if the top executives of an enterprise show positive support and a willingness to change, and where this is recognized by the internal/external members of the organization, the members will actively share relevant information and participate in the process of justifying and accepting change in themselves. This will increase the degree of collaboration with the change [36]. Green supply chain management collaboration is defined as the degree of interaction between manufacturers developing and implementing pollution prevention technologies and their key suppliers and key customers [11]. Therefore, we hypothesize the following:
Hypothesis 1.
The degree of top management’s support in the green supply chain has a positive impact on the level of environmental collaboration with supply chain participants.
Hypothesis 2.
The degree of top management’s support in the green supply chain has a positive impact on the level of environmental collaboration with supply chain suppliers.
Hypothesis 3.
The degree of top management’s support in the green supply chain has a positive impact on the level of environmental collaboration with supply chain customers.
2.2. Top Management’s Support and Environmental Performance
According to the upper echelon theory, a company or organization grows and evolves to reflect the characteristics of its top management [31]. In particular, CEOs have authority over corporate management on behalf of shareholders and are also responsible for their performance. In addition, top executives, including top management, are the main decision makers in an enterprise, and the decision they make determines the performance of the enterprise and the maintenance or abolition of the enterprise [37,38]. The effects of top management’s characteristics and behavior on corporate behavior and performance—corporate financial performance, innovation performance, and social performance—have been steadily studied by scholars who have paid attention to the importance of top management. The upper echelon theory argues that psychological characteristics, such as aggressiveness and stability, as well as demographic characteristics, such as the age and gender of the CEO and top management, can have a significant impact on the selection of strategic activities and on corporate performance [31]. Zhao et al. [39] analyzed the relationship between CEOs’ psychological factors and firm performance, and found that CEOs’ sincerity, openness, emotional stability, and extroversion have a positive effect on corporate performance. Papadakis and Barwise [40] found that top management’s support and aggressiveness in corporate activities is an important explanatory factor for improved management performance. In addition, Abatecola et al. [41] conclude that the emotional stability, extroversion, authenticity, and strategic aggressiveness of top management are highly correlated with corporate performance.
Based on the results of the studies that have focused on the psychological characteristics of the top executives, it can be assumed that the support of the top management of a company plays a crucial role in achieving its original purpose and goal. Saraph et al. [42] argues that one of the key success factors for Total Quality Management (TQM) activity is the role of the CEO. In addition, Sila [43] found that the degree of commitment of top management, which indicates how a CEO is supporting and devoting a specific activity to a company, can lead to an improvement of its performance by successful execution of the company’s TQM. From this perspective, it can be seen that the top management’s active attitude and support are needed to achieve good environmental performance by implementing a green supply chain.
When companies want to implement green supply chain management, they need other equipment and systems, and they involve a lot of resources, costs, and efforts. This requires the companies to modify their existing practices and establish other business activities. Top management’s support is essential for having well-established activities in the green supply chain. In fact, the more senior management is interested in a company’s specific activities and tasks, the better it can be seen [44]. The fact that the top executives of a company show interest and support for specific activities means that they allocate sufficient resources to support the activities when they formulate budgets and show active interest in the planning and execution of production departments and support their activities.
Green supply chain management is a relatively recent concept for long-term survival, sustainability, and competitiveness of an organization. Here, active support from top management leads to smooth implementation of green SCM and, as a result, the company will achieve improved environmental performance and sustainability. With that in mind, we postulate the following:
Hypothesis 4.
Top management’s support for the green supply chain has a positive (+) relationship with corporate environmental performance.
2.3. Mediating Role of Environmental Collaboration with Participants
In order to smoothly implement a green supply chain, not only the company’s independent efforts are necessary but also the efforts of the suppliers included in the enterprise’s value chain [45]. Since there is no participant that can exist alone in the value chain of an enterprise, it is most important to establish a network of collaboration with participating companies to achieve a green supply chain. From this point of view, we expect that the level of green collaboration with supply chain participants can play a bridge between the level of top management’s support for the green supply chain management and environmental performance.
Green supply chain management can be said to be a plan and an activity that is used to collaboration with the supply chain participant in coordinating and cooperating regarding environmental problems to enhance the environmental performance of the company [46,47].
The coordination and cooperation between the supply chain participants, which is meant here, is also an extended concept that includes both the upstream and downstream of the supply chain and the closed loop of the supply [48,49]. In other words, environmental collaboration with the supply chain participants is planned by the suppliers located upstream of the supply chain and by customer companies located downstream, jointly planning and implementing environmental management and solving environmental problems [50]. It is important for companies to intervene directly with their suppliers and customers to jointly establish plans to improve and develop the green supply chain and find solutions to the problems [49].
Such collaboration on the supply chain is to provide suppliers and customers with information necessary for eco-friendly management, to develop a mutual understanding of environmental management and conduct joint technology development, and so achieve a green supply chain [11,46].
The high degree of collaboration with green supply chain participants can help suppliers and customers to develop their capacity to respond to environmental issues by acting as a motivator to make environmental performance more mindful and improved [45]. Achieving a high level of collaboration with suppliers and customers within a green supply chain affects the dissemination and integration of knowledge among each other, thereby acquiring valuable knowledge on eco-friendly management and preempting all green supply chain participants, helping to shape the proactive environmental management orientation and have improved environmental management capabilities [46]. Furthermore, through this process, the increased environmental response capacity of the entire supply chain participants has a positive impact on enhancing the company’s eco-efficiency performance [46]. Green et al. [51] found that environmental co-operation diffuses within the green supply chain, resulting in higher environmental performance. Taken together, the active support and attitudes of top management on the green supply chain can help motivate the value chain participants and the internal members of the organization, to promote environmental collaboration both internally and externally, making it possible to successfully implement green supply chain management.
Collaboration among all members in the green supply chain and efforts to implement a green supply chain will enhance a company’s eco-efficiency by strengthening its environmental management capabilities. In light of the above discussions, we hypothesize the following:
Hypothesis 5.
The degree of environmental collaboration among supply chain participants will mediate the relationship between top management’s support for green supply chains and environmental performance.
Hypothesis 6.
The degree of environmental collaboration with suppliers will mediate the relationship between top management’s support for green supply chains and environmental performance.
Hypothesis 7.
The degree of environmental collaboration with customers will mediate the relationship between top management’s support for green supply chains and environmental performance.
To sum up, this paper proposes to investigate a research model (see Figure 1).
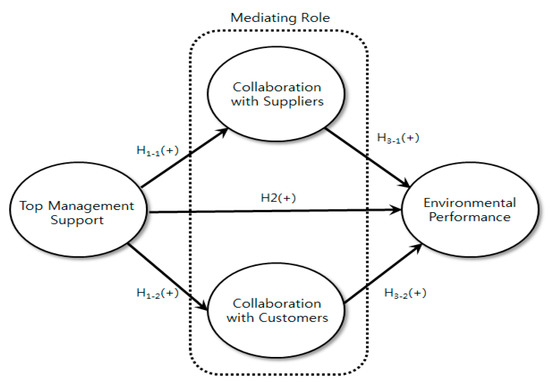
Figure 1.
The research model.
3. Methods
3.1. Sample Selection
We collected data from companies in manufacturing industries in South Korea. The Korean Business Directory 2013 issued by the Korea Chamber of Commerce and Industry (KCCI) was used to identify the Korean manufacturing companies. A total of 27,086 manufacturers were identified. Among them, 500 manufacturers operating mainly in Seoul were extracted as the research sample due to the accessibility and ease of the survey. In order to obtain participants, we explained the purpose of this study and survey via email and phone for 500 manufacturers. Then, the questionnaire was sent to the 500 companies by e-mail. With assistance of the companies, responses to the questionnaire were made by the executives who are in charge of environmental management or green supply chain management within the companies. In this way, we were able to secure reliability and accuracy in the questionnaire response.
3.2. Data Collection
The survey was conducted in 2014. During this period, a total of 500 questionnaires were distributed, of which 324 copies were collected. The return rate of the questionnaire is 64.8%. Data obtained from 301 questionnaires were used for the statistical analysis, with the exception of 23 questionnaires that were not appropriate for the analysis. Questionnaires excluded from analysis are those that cannot be used for analysis because the same number is continuously repeated or there were many missing values in the questionnaire. In addition, due to the simplicity of the model, it was expected that a meaningful hypothesis test could be performed with a sample of 301 parts, excluding 23 copies.
The industry composition ratio of this sample was 15.7% for medicals and pharmaceuticals, 15.0% for electronics and communication equipment, and 11.7% for chemicals and plastics. In addition, the number of employees was 500–800, the highest with 21.3%; 100–299, with 15.3%; 50–99, with 18.7%; and 10–49, with 15.7%. The year of establishment of the company was the most in 30–50 years with 45.0%, followed by 10–29 years with 36.0%. The positions of the respondents were in the order of manager 34.3%, assistant manager 30.7%, and deputy manager 15.0%. SPSS 21.0 was used as the statistical package to test the research hypotheses.
3.3. Measures
3.3.1. Independent Variable
Support from top management is defined as “the attitude of top management to support green supply chain management” [12]. In order to measure the top management support for green SCM, we used Zhu et al.’s [12] items that include “our top management team supports green SCM” and “our top management team commits green SCM”. A 7-point Likert scale was used, ranging from 1 (“strongly disagree”) to 7 (“strongly agree”).
3.3.2. Mediating Variables
The level of environmental collaboration with supply chain participants, defined as the cooperation with suppliers and customers in order to achieve environmental goals in the green SCM, was measured using Vachon and Klassen’s [11] scale. On that scale, the supply chain participants featured two facets, (1) suppliers and (2) customers. We adopted a 7-point Likert scale (1 = strongly disagree, 7 = strongly agree).
In particular, we used four items to assess the level of environmental collaboration with suppliers from Vachon and Klassen’s [11] questionnaire. The items include “we are developing a mutual understanding of responsibilities regarding environmental performance with our suppliers”, “we are working together to reduce environmental impact of our activities with our suppliers”, “we are conducting joint planning to anticipate and resolve environmental-related problems with our suppliers”, and “we are making joint decisions about ways to reduce overall environmental impact of our products with our suppliers”. The level of environmental collaboration with customers was captured by using four items from Vachon and Klassen’s [11] questionnaire. The items include “we are developing a mutual understanding of responsibilities regarding environmental performance with our customers”, “we are working together to reduce environmental impact of our activities with our customers”, “we are conducting joint planning to anticipate and resolve environmental-related problems with our customers”, and “we are making joint decisions about ways to reduce overall environmental impact of our products with our customers.”
3.3.3. Dependent Variable
Environmental performance is defined as “the degree of improvement of environmental pollution, reduction of environmental risks and amelioration of environmental conditions in the firms” [16]. As a dependent variable, environmental performance was measured using constructs developed by Zhu and Sarkis [16]. The items include “Decrease in fines for environmental accidents in the last 3 years”, “Improvement in the enterprise’s environmental situation in the last 3 years”, and “Reduction of water/solid wastes in the last 3 years”. These measurement items were operationalized on a seven-point Likert scale from 1 (“not at all”) to 7 (“highly significant”).
3.3.4. Control Variables
Based upon a careful review of previous empirical studies on green SCM and environmental performance, we found some control variables designed to rule out potential confounding factors that could affect environmental performance. Five control variables were added to the research model.
In previous studies on green SCM, financial performance has often been treated as a dependent variable [12], but financial performance could positively affect environmental performance [52]. When a company has sufficient slack resources due to its high performance, they are likely to invest in environmentally friendly activities with their slack resources. Thus, we controlled the financial performance of a company. In addition, depending on which industry a company belongs to, the level of green SCM implementation could vary. In the case of industries that are directly affected by overseas regulations, the implementation level may be greater. So, we controlled the industry-specific effects by including industry dummy variables. Compared to a company that has just introduced green SCM, it is obvious that the more time a company has had to introduce green SCM, the more opportunities there are to correct the problems on that supply chain, to cooperate with the supply chain participants, and to enhance the environmental performance; also, the position of the company in the supply chain is likely to have different effects on the collaboration and environmental performance among the participating companies. For these reasons, a company’s introduction time of green SCM and its position in the supply chain were included as control variables. In general, larger firms have more available and superior resources, which has a significant impact on their performance [53]. Environmental collaboration and performance among supply chain participants on green SCM, which could affect the corporate level performance, could also be influenced by the corporate size. Therefore, the company size was controlled in our research model.
The company size is measured by number of employees. The number of employees is a nominal variable, having 5 categories: (1) less than 50 employees; (2) 50–100 employees; (3) 100–300 employees; (4) 300–500 employees; and (5) more than 500 employees. To put the nominal variable into our research model, we generated 5 dummy variables regarding the number of employees, coded as 1 (observation that belongs to a certain category) or 0 (otherwise). The type of industry and the introduction time of green SCM are also measured as a nominal variable, so that these variables are converted into dummy variables and put into our regression model. In terms of the industry variable, there are 10 industry categories: (1) chemicals and plastics; (2) pulp, printing, and furniture; (3) steel and assembled metals; (4) machinery and shipbuilding; (5) automobile and transportation equipment; (6) electronics and communication equipment; (7) medical and pharmaceuticals; (8) textile and clothing; (9) electrics and construction; and (10) other industries. Regarding the introduction time of green SCM, there are 5 categories: (1) less than a year; (2) less than two years; (3) less than 5 years; (4) less than 10 years; and (5) more than 10 years.
3.4. Method Bias Test
Harman’s single factor test [54] was used to verify the likelihood of the common method bias in this study. If the common method bias is present in our research model, all independent and dependent variables are likely to converge into a single factor or a dominant factor are likely to explain most of the total variance when an exploratory factor analysis is performed. This was not the case in our study as a single factor model of the unrotated solution explained only 25.78 percent of variance and all the variables did not converge to a single factor. Therefore, we conclude that the common method bias is not present in our model.
4. Results
4.1. Reliability and Validity Tests
To confirm validity, an exploratory factor analysis (Pearson’s principal component analysis) was conducted with rotation (Varimax rotation with Kaiser normalization). All variables were confirmed valid since their factor loading values were more than 0.4; also, the factor loading values of the sub-variable items were close to or greater than 0.5, concluding that the construct validity is confirmed. The results of the factor analysis are shown in Table 1. The Kaiser–Meyer–Olkin measure of sampling adequacy was 0.729, and the obtained chi-square value was 943.356 for the Bartlett’s Test of Sphericity (p < 0.001), confirming the validity of the model.

Table 1.
Exploratory factor analysis results.
Cronbach’s alpha was used to test the reliability of all the measures. The Cronbach’s alpha results ranged between 0.6 and 0.8 (see Table 1). These values are slightly below the standard value of 0.7 suggested by Nunnally and Bernstein [55], but it is an empirical standard rather than an absolute one. Moreover, considering that the number of items in the questionnaires and the difficulty in understanding the items could affect the test results, our test results are still acceptable [56]. In this case, the CR (Composite Reliability) values can be used alternatively [57], for which all values were found to be over 0.7. Therefore, we conclude that the reliability of the measures is valid (see Table 1).
4.2. Correlation Analysis
Table 2 provides the descriptive statistics and the correlation matrix for all variables used in the study. The mean of the perceived environmental performance measured by the Likert-type 7-point scale was 4.27, and the mean of the level of the top management support was 4.44. The level of environmental collaboration with suppliers and customers were 4.76 and 3.87, respectively. Since some significant correlations were found between the variables, we calculated the variance inflation factor (VIF) to detect the multicollinearity. The computed VIF values of all variables were less than 2, which is substantially below the cutoff threshold value of 10. Therefore, we conclude that multicollinearity is not a serious issue in the research models.
Table 2.
Descriptive statistics and correlation matrix.
4.3. Hypotheses Testing
To test the hypotheses, we employed the hierarchical multiple linear regression analyses. We tested the mediation hypotheses in accordance with the method proposed by Baron and Kenny (1986). Their method is composed of the estimation of three regression models. The first model regresses the level of environmental collaboration with the suppliers (Model 2 in Table 3) and customers (Model 2 in Table 4) in terms of the top management support, represented by Hypothesis 1. The second equation (Model 2 in Table 5) estimates the corporate environmental performance in terms of the top management support and controls, represented by Hypothesis 4. The last equation (Model 3 in Table 5) explains the corporate environmental performance in terms of the mediator (the level of environmental collaboration with suppliers and customers) and the other independent variables (the level of top management support and control variables), represented by Hypothesis 5. In order to establish the mediation effect, three conditions must hold: (H1) the top management support must affect the environmental collaboration between the suppliers and customers (Model 2 in Table 3 and Table 4); (H2) the top management support must affect the environmental performance (Model 2 in Table 5); and (H3) the environmental collaboration with the suppliers and customers must affect the environmental performance (Model 3 in Table 5). The mediation holds if the coefficient of top management support, initially significant in Model 2 in Table 5, turns out to be non-significant when the environmental collaboration between the suppliers and customers are included (Model 3A).
Table 3.
Impact of top management support toward green SCM on the level of environmental collaboration between suppliers: regression models.
Table 4.
Impact of the top management support toward green SCM on the level of environmental collaboration with customers: regression models.
Table 5.
Mediation analysis regression results.
Regarding the first condition, as shown in Table 3 and Table 4, the results of Model 2 suggest that the top management support toward green SCM has a positive effect on the environmental collaboration between suppliers (β = 0.34, p ≤ 0.01) and customers (β = 0.20, p ≤ 0.01) in the supply chain, supporting Hypothesis 2 and 3. This result is empirical evidence that the top management support for green SCM increases the level of collaboration among the supply chain participants, one of the essential factors of a successful green SCM. Model 2 in Table 5 shows that the top management support toward green SCM positively and significantly affects corporate environmental performance (β = 0.28, p ≤ 0.01), holding the second condition of the mediation effect and supporting Hypothesis 4. Lastly, Model 3 in Table 5 allows the effects of the top management support on the corporate environmental performance to be mediated by the environmental collaboration between suppliers and customers, testing the final condition for mediation. Even after controlling the collaboration with suppliers and customers, the impact of top management support on the environmental performance is positive and significant (β = 0.14 and p ≤ 0.05), but the value of the regression coefficients is less than the value shown in Hypothesis 4 (β = 0.28 and p ≤ 0.01). Therefore, the relationship between the top management support and the corporate environmental performance is partially mediated by the environmental collaboration between the supply chain participants, supporting Hypothesis 6 and 7.
In summing up the above, it is shown that, with the support of a corporation’s top management team—who plays a key role in green SCM—the level of environmental collaboration between the participants in green SCM is significantly increased, and the environmental performance is consequently also increased.
5. Discussion and Conclusions
This study examined how the support of the corporate top management team in green SCM increases the environmental collaboration with the suppliers and customers in their supply chain, and how the environmental performance is eventually improved through this relationship. In addition, this study analyzed the mediating effect of environmental collaboration with the supply chain participants between the top management support and the corporate environmental performance, reflecting the fact that the success or failure of green SCM depends on the level of collaboration between the participants in a green supply chain. Accordingly, this study closely analyzed the effect of the top management’s support [18,20,31], through environmental collaboration with the participating supply chain companies [46,50], on environmental performance [16]. The main findings based on the analysis results of this study are as follows.
First, this study broadens the horizon of green SCM research by focusing on the effect of a corporation’s top management team in discussing the performance of green SCM. Specifically, we employed upper echelon theory [31,38,39] to explain the significant impact of top management team, the group that has the greatest influence in a company, on collaboration among the green SCM participants, and subsequently on environmental performance. In this study, we distinguish the roles of a company’s top management team and highlight the separate independent effects they could have on the green SCM, which has so far been considered comprehensively as a component of the company’s internal environmental management [12,15]. Therefore, it has theoretical contributions in that it clearly analyzes the role of a top management team under green SCM, which has been relatively lacking in previous discussions on the topic. In addition, the scalability of this study could be even greater in that it analyzes the influence paths together, i.e., the environmental collaboration among both suppliers and customers, as suggested by Burki et al. [28].
Secondly, this study finds a mechanism that connects the support of a corporate top management team to its environmental performance. In other words, the top executives’ active support for green SCM has a direct positive impact on the environmental performance of the company itself and leads to active collaboration of suppliers and customers in the supply chain, thereby enhancing perceived environmental performance. This result supports the existing discussion on the importance of collaboration among supply chain participants [11,46,51], which has been emphasized continuously in green SCM. This also provides an opportunity to identify the nature of the organic organization, in which active support from the corporate executives leads to active cooperation from the participating firms outside the company and eventually returns to improved performance.
Thirdly, in inferring the relationship between the support of top management team and the cooperation among green SCM participants and environmental performance, this study clarifies the theoretical structure by controlling various external variables that may affect the dependent variable, such as financial performance, industry type, the introduction time of green SCM, corporate position within green SCM, and company size. For instance, firms with a higher financial performance have more slack resources, which can lead to sufficient investment in environmental performance. In this study, we tried to prevent this issue from affecting our research model by controlling for financial performance.
Fourthly, this study has practical implications to shed light on the role of top managers in promoting implementation of corporate strategies and activities. No matter how good and appropriate a strategy is formulated from an analysis of the internal and external environment, if members fail to implement it, the company will eventually fail to change and achieve the desired outcomes. This paper shows that the top management’s active supporting attitude is important for the smooth implementation of the company’s functional strategy, in this case, green SCM. Implementing green SCM in response to changes in the external environment of companies will give them an opportunity to increase their sustainability. In fact, the most essential factor to become a company with a high environmental performance by managing the green supply chain is the continuous support of the top management. The study empirically confirms that if corporate top executives continue to manage the green supply chain with a strong will, it will result in a high level of collaboration among the participants within the supply chain, which in turn results in an increase in the environmental performance of the company.
This research contributes to theory and provide various theoretical implications by clearly analyzing the mechanism between the top management’s support toward green SCM and environmental collaboration among participants of a supply chain and thus environmental performance, which has been relatively neglected in the green SCM literature. However, this study has some limitations and hopes that future research could overcome these issues.
First, in this study, the level of top management supporting attitudes toward green SCM was regarded as the most important psychological characteristic of the top executives, affecting the environmental performance and collaboration of the supply chain participants. However, a top management team also has other demographics as well as psychological characteristics, like risk aversion and neuroticism. Therefore, if the future research reflects the various characteristics of the top management, it would generate further contributions.
Secondly, consideration should be given to a wider context, nationally or culturally, since the characteristics of a company’ top executive may vary depending on culture or country; it would be nice if further studies are conducted in this regard. If future research on countries with a similar collective cultural nature to Korea yields the same results, it could further enhance the validity of the findings from this study. On the contrary, it would be an interesting follow-up study to expand the study to countries with different individualistic cultures to identify the effects of different cultures.
Thirdly, this study is based on a survey conducted in 2014, so there is a possibility that there might be some changes in the application situation of green SCM. Moreover, the recent spread of the COVID-19 pandemic could also affect the application of green SCM. These issues could not be reflected in this paper due to limitations, but future research that reflects these issues could give more implications and contributions.
Fourthly, there could be different or similar incentives to cooperate in a green supply chain. According to Tacheva et al. [58], there are two major incentives for cooperation, with partners driven from a shareholder’s perspective and stakeholder’s perspective. Although the incentives for cooperation among green SCM participants was not considered in this paper, it is likely that more meaningful results could be obtained if research with this incentive variable added in the future is conducted.
Author Contributions
Conceptualization, methodology, and formal analysis, J.L.; data curation and validation, H.-Y.J.; writing—original draft preparation, writing—review and editing, and funding acquisition, J.L. and H.-Y.J. All authors have read and agreed to the published version of the manuscript.
Funding
This research received no external funding.
Conflicts of Interest
The author declares no conflict of interest.
References
- Carroll, A.B.; Buchholtz, A.K. Business and Society: Ethics, Sustainability, and Stakeholder Management, 10th ed.; Cengage Learning: Boston, MA, USA, 2016; ISBN 978-1-305-95982-8. [Google Scholar]
- Maignan, I.; Ferrell, O. Corporate social responsibility and marketing: An integrative framework. J. Acad. Mark. Sci. 2004, 32, 3–19. [Google Scholar] [CrossRef]
- Shin, S.H. Disclosures and asset returns. Econometrica 2003, 71, 105–133. [Google Scholar] [CrossRef]
- Gunther, M. The green machine. Fortune 2006, 154, 42–57. [Google Scholar] [PubMed]
- Albino, V.; Dangelico, R.M.; Pontrandolfo, P. Do inter-organizational collaborations enhance a firm’s environmental performance? A study of the largest US companies. J. Clean. Prod. 2012, 37, 304–315. [Google Scholar] [CrossRef]
- Lee, S.Y.; Cheong, I.M. Sustainable supply chain initiatives in the Korean automotive industry. In Handbook of Sustainability Management; World Scientific: New Jersey, NJ, USA, 2012; pp. 609–624. [Google Scholar] [CrossRef]
- Lee, S.Y.; Lee, W.H. The effects of sustainable supply chain management on relational social capital and supplier sustainability performance: An integrative model of the fair, green, and responsible supply chain. Korean Manag. Rev. 2014, 43, 275–302. [Google Scholar]
- Hassini, E.; Surti, C.; Searcy, C. A literature review and a case study of sustainable supply chains with a focus on metrics. Int. J. Prod. Econ. 2012, 140, 69–82. [Google Scholar] [CrossRef]
- Seuring, S.; Müller, M. From a literature review to a conceptual framework for sustainable supply chain management. J. Clean. Prod. 2008, 16, 1699–1710. [Google Scholar] [CrossRef]
- Corbett, C.J.; Klassen, R.D. Extending the horizons: Environmental excellence as key to improving operations. Manuf. Serv. Oper. Manag. 2006, 8, 5–22. [Google Scholar] [CrossRef]
- Vachon, S.; Klassen, R.D. Green project partnership in the supply chain: The case of the package printing industry. J. Clean. Prod. 2006, 14, 661–671. [Google Scholar] [CrossRef]
- Zhu, Q.; Sarkis, J.; Lai, K.H. Confirmation of a measurement model for green supply chain management practices implementation. Int. J. Prod. Econ. 2008, 111, 261–273. [Google Scholar] [CrossRef]
- Lee, S.Y. Drivers for the participation of small and medium-sized suppliers in green supply chain initiatives. Supply Chain Manag. Int. J. 2008, 13, 185–198. [Google Scholar] [CrossRef]
- Wu, G.C.; Ding, J.H.; Chen, P.S. The effects of GSCM drivers and institutional pressures on GSCM practices in Taiwan’s textile and apparel industry. Int. J. Prod. Econ. 2012, 135, 618–636. [Google Scholar] [CrossRef]
- Choi, S.B.; Min, H.; Joo, H.Y.; Choi, H.B. Assessing the impact of green supply chain practices on firm performance in the Korean manufacturing industry. J. Logist. Res. Appl. 2016, 20, 129–145. [Google Scholar] [CrossRef]
- Zhu, Q.; Sarkis, J. Relationships between operational practices and performance among early adopters of green supply chain management practices in Chinese manufacturing enterprises. J. Oper. Manag. 2004, 22, 265–289. [Google Scholar] [CrossRef]
- Mintzberg, H. The Nature of Managerial Work; Harper & Row: New York, NY, USA, 1973. [Google Scholar]
- Quinn, J.B. Strategies for Change: Logical Incrementalism; Irwin Professional Publishing: Burr Ridge, IL, USA, 1980. [Google Scholar]
- Andrews, K.R. The concept of corporate strategy. In Resources, Firms, and Strategies: A Reader in the Resource-Based Perspective; Oxford University Press: Oxford, UK, 1997; ISBN 978-0-19-878180-6. [Google Scholar]
- Mackey, A. The effect of CEOs on firm performance. Strat. Manag. J. 2008, 29, 1357–1367. [Google Scholar] [CrossRef]
- Barratt, M.; Oliveira, A. Exploring the experiences of collaborative planning initiatives. Int. J. Phys. Distrib. Logist. Manag. 2001, 31, 266–289. [Google Scholar] [CrossRef]
- Phillips, N.; Lawrence, T.B.; Hardy, C. Inter-organizational collaboration and the dynamics of institutional fields. J. Manag. Stud. 2000, 37, 23–43. [Google Scholar] [CrossRef]
- Spekman, R.E.; Kamauff, J.W.; Myhr, N. An empirical investigation into supply chain management: A perspective on partnerships. Supply Chain Manag. 1998, 3, 53–67. [Google Scholar] [CrossRef]
- Soosay, C.A.; Hyland, P.W.; Ferrer, M. Supply chain collaboration: Capabilities for continuous innovation. Supply Chain Manag. 2008, 13, 160–169. [Google Scholar] [CrossRef]
- Diabat, A.; Govindan, K. An analysis of the drivers affecting the implementation of green supply chain management. Resour. Conserv. Recycl. 2011, 55, 659–667. [Google Scholar] [CrossRef]
- Green, K.W.; Zelbst, P.J.; Bhadauria, V.S.; Meacham, J. Do environmental collaboration and monitoring enhance organizational performance? Ind. Manag. Data Syst. 2012, 112, 186–205. [Google Scholar] [CrossRef]
- Vachon, S. Green supply chain practices and the selection of environmental technologies. Int. J. Prod. Res. 2007, 45, 4357–4379. [Google Scholar] [CrossRef]
- Burki, U.; Ersoy, P.; Najam, U. Top management, green innovations, and the mediating effect of customer cooperation in green supply chains. Sustainability 2019, 11, 1031. [Google Scholar] [CrossRef]
- Chu, S.H.; Yang, H.; Lee, M.; Park, S. The impact of institutional pressures on green supply chain management and firm performance: Top management roles and social capital. Sustainability 2017, 9, 764. [Google Scholar] [CrossRef]
- Kumar, A.; Paraskevas, J.P. A proactive environmental strategy: Analyzing the effect of SCM experience, age, and female representation in TMTs. J. Supply Chain Manag. 2018, 54, 20–41. [Google Scholar] [CrossRef]
- Hambrick, D.C.; Mason, P.A. Upper echelons: The organization as a reflection of its top managers. Acad. Manag. Rev. 1984, 9, 193–206. [Google Scholar] [CrossRef]
- Cha, S.H.; Yang, D.H. Influence of organizational and HR department characteristics on human resource outsourcing. Korean J. Manag. 2008, 16, 159–190. [Google Scholar]
- Rai, A.; Borah, S.A.; Ramaprasad, A. Critical success factors for strategic alliances in the information technology industry: An empirical study. Decis. Sci. 1996, 27, 141–155. [Google Scholar] [CrossRef]
- Teo, T.S.; Tan, M.; Buk, W.K. A contingency model of Internet adoption in Singapore. Int. J. Electron. Commer. 1997, 2, 95–118. [Google Scholar] [CrossRef]
- Coch, L.; French, J.R., Jr. Overcoming resistance to change. Hum. Relat. 1948, 1, 512–532. [Google Scholar] [CrossRef]
- Gioia, D.A.; Chittipeddi, K. Sensemaking and sensegiving in strategic change initiation. Strateg. Manag. J. 1991, 12, 433–448. [Google Scholar] [CrossRef]
- Boone, C.; De Brabander, B.; Van Witteloostuijn, A. CEO locus of control and small firm performance: An integrative framework and empirical test. J. Manag. Stud. 1996, 33, 667–700. [Google Scholar] [CrossRef]
- Takeuchi, R.; Lepak, D.P.; Wang, H.; Takeuchi, K. An empirical examination of the mechanisms mediating between high-performance work systems and the performance of Japanese organizations. J. Appl. Psychol. 2007, 92, 1069. [Google Scholar] [CrossRef]
- Zhao, H.; Seibert, S.E.; Lumpkin, G.T. The relationship of personality to entrepreneurial intentions and performance: A meta-analytic review. J. Manag. 2010, 36, 381–404. [Google Scholar] [CrossRef]
- Papadakis, V.M.; Barwise, P. How much do CEOs and top managers matter in strategic decision-making? Br. J. Manag. 2002, 13, 83–95. [Google Scholar] [CrossRef]
- Abatecola, G.; Mandarelli, G.; Poggesi, S. The personality factor: How top management teams make decisions. A literature review. J. Manag. Gov. 2013, 17, 1073–1100. [Google Scholar] [CrossRef]
- Saraph, J.V.; Benson, P.G.; Schroeder, R.G. An instrument for measuring the critical factors of quality management. Decis. Sci. 1989, 20, 810–829. [Google Scholar] [CrossRef]
- Sila, I. Examining the effects of contextual factors on TQM and performance through the lens of organizational theories: An empirical study. J. Oper. Manag. 2007, 25, 83–109. [Google Scholar] [CrossRef]
- Pfeffer, J.; Jeffrey, P. The Human Equation: Building Profits by Putting People First; Harvard Business Press: Boston, MA, USA, 1998; ISBN 0-87584-841-9. [Google Scholar]
- Lee, S.; Lee, K. A study on the relationships between social capital accumulation, green supply chain management and supplier operational performance: A path analysis. J. Korean Prod. Oper. Manag. Soc. 2013, 24, 239–269. [Google Scholar]
- Bowen, F.E.; Cousins, P.D.; Lamming, R.C.; Farukt, A.C. The role of supply management capabilities in green supply. Prod. Oper. Manag. 2001, 10, 174–189. [Google Scholar] [CrossRef]
- Handfield, R.; Sroufe, R.; Walton, S. Integrating environmental management and supply chain strategies. Bus. Strategy Environ. 2005, 14, 1–19. [Google Scholar] [CrossRef]
- Linton, J.D.; Klassen, R.; Jayaraman, V. Sustainable supply chains: An introduction. J. Oper. Manag. 2007, 25, 1075–1082. [Google Scholar] [CrossRef]
- Sarkis, J. A strategic decision framework for green supply chain management. J. Clean. Prod. 2003, 11, 397–409. [Google Scholar] [CrossRef]
- Vachon, S.; Klassen, R.D. Environmental management and manufacturing performance: The role of collaboration in the supply chain. Int. J. Prod. Econ. 2008, 111, 299–315. [Google Scholar] [CrossRef]
- Green, K.; Morton, B.; New, S. Greening organizations: Purchasing, consumption, and innovation. Organ. Environ. 2000, 13, 206–225. [Google Scholar] [CrossRef]
- Waddock, S.A.; Graves, S.B. The corporate social performance–financial performance link. Strateg. Manag. J. 1997, 18, 303–319. [Google Scholar] [CrossRef]
- Cho, J.; Lee, J. Internationalization and performance of Korean SMEs: The moderating role of competitive strategy. Asian Bus. Manag. 2018, 17, 140–166. [Google Scholar] [CrossRef]
- Podsakoff, P.M.; MacKenzie, S.B.; Lee, J.Y.; Podsakoff, N.P. Common method biases in behavioral research: A critical review of the literature and recommended remedies. J. Appl. Psychol. 2003, 88, 879. [Google Scholar] [CrossRef]
- Nunnally, J.C.; Bernstein, I.H. Psychometric Theory, 3rd ed.; McGraw-Hill: New York, NY, USA, 1994; ISBN 9780070478497. [Google Scholar]
- Helms, L.S. Basic Concepts in Classical Test Theory: Tests Aren’t Reliable, the Nature of Alpha, And Reliability Generation as Meta-Analytic Method; Eric Document Reproduction Service: San Antonio, TX, USA, 1999. [Google Scholar]
- Hair, J.F.; Black, W.C.; Babin, B.J.; Anderson, R.E. Multivariate Data Analysis, 6th ed.; Pearson Education, Uppersaddle River: New Jersey, NJ, USA, 2006. [Google Scholar]
- Tacheva, Z.; Simpson, N.; Ivanov, A. Examining the role of top management in corporate sustainability: Does supply chain position matter? Sustainability 2020, 12, 7518. [Google Scholar] [CrossRef]

Publisher’s Note: MDPI stays neutral with regard to jurisdictional claims in published maps and institutional affiliations. |
© 2020 by the authors. Licensee MDPI, Basel, Switzerland. This article is an open access article distributed under the terms and conditions of the Creative Commons Attribution (CC BY) license (http://creativecommons.org/licenses/by/4.0/).