Abstract
Due to the rapid increase in population and the change in age structure toward the elderly, the phenomenon of societal ageing is being witnessed in many countries. The elderly travel less than the adult population due to decreasing mobility with an increasing age. In this study, we aimed to analyze the expectations and satisfaction of public transport users in Thailand using traditional importance performance analysis (IPA), gap analysis, and IPA integrated with competitor performance. We aimed to explain the differences in the analysis results produced by the three methods. The data were obtained from surveying 2250 elderly and 450 non-elderly adults. This study presents guidelines for improving the public transport service quality in Thailand to meet user needs. The results of this research showed that each approach provides its own distinctive aspects and theoretical differences, which lead to different interpretations. The results from the three approaches showed that equipment that increases safety for public transportation service users is an important factor for all elderly passengers that must be improved. Public transportation services in different regions should be developed to provide more reliable and regular services.
1. Introduction
1.1. The Ageing Society
In 2019, the number of elderly (aged 65 years and over) increased to 703 million worldwide, highlighting the global phenomenon of population ageing. Southeast Asia has the world’s largest number of elderly people, estimated at 260 million people, or 37% of the world’s total. This number is expected to remain stable until 2050 [1]. The World Health Organization [2] has predicted that in 2030, the number of elderly (60 years and over) around the world will reach 1.4 billion people, and increase to 2.1 billion by 2050. In 2019, Thailand had a population of 66.56 million [3] and had a proportional population of the elderly (aged 60 years and over) of 16.73%, or 11.13 million people [4]. The number of elderly people in Thailand is as high as that of many developed countries. By 2022, Thailand will be categorized as a super-aged society, as the proportion of the elderly will rise to 26.9% in 2030 and to 37% in 2050. The pressure produced by the rapidly increasing elderly population is posing a considerable challenge, as illustrated in Figure 1a,b.
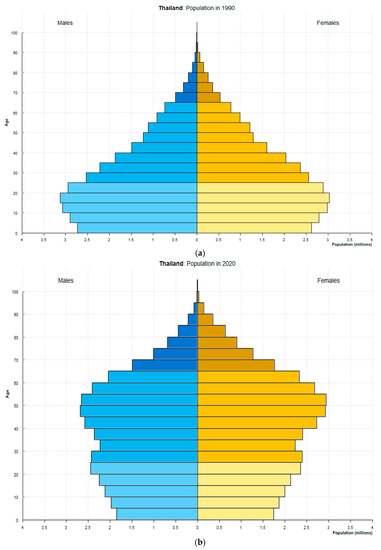
Figure 1.
The statistical trend of the Thai population by age: Population pyramids of Thailand in (a) 1990 and (b) 2020. Source: Population Division [5].
1.2. Literature Review of Elderly and Travel
Travel is undertaken by those of all ages, and the elderly travel for a variety of purposes. Thus, the unavailability of public transportation service readiness causes future problems for the elderly because public transport benefits them by providing freedom to travel [6].
1.2.1. Public Transport Factors
Service quality is studied in many research fields. The transport sector places importance on the service quality, as travel is considered an important aspect of daily life. The different contexts of developing and developed countries affect travel behavior, for example, personal car travel is a form of travel that competes with public transport in developing countries [7]. The factors of service quality using 24 attributes of bus service [8] were studied in Cambodia using the traditional importance performance analysis (IPA) method to provide guidelines for the government to improve bus service quality. There has correspondingly been a study of customer satisfaction on bus service in Beijing, China. The study investigated six factors, including punctuality, safety, convenience, comfort, reliability, and economy, in which punctuality was at a low satisfaction level mainly influenced by three factors: Passenger age, Travel purpose, and Travel time (Peak time, Non-Peak time, Weekends) [9]. Research related to improving the quality of retail delivery services suggests that it should focus on improving logistics services and overall satisfaction rather than only a single variable [10]. Travel behavior and attitudes toward high-speed trains were studied in the United Kingdom [11], and the service quality for train passengers in India was studied based on service quality [12]. For Thailand, the service quality of the public transport system was examined through a comparative study of the service quality of intercity trains using various analysis methods [13].
1.2.2. The Elderly
Most research related to the elderly has been based on medical treatment guidelines; research related to public transport of the elderly is a relatively new concept in developing countries. Hu and Wang [14] conducted a comparative study of the difference between the elderly’s travel behavior in developed and developing countries like China. The results indicated that 30% of the elderly in developed countries chose to travel by private car. Similarly, in Taiwan, elderly passengers tended to use public transport less than cars due to safety, which is an important factor considered when choosing an airport access mode by elderly passengers [15]. The elderly were not satisfied if there were no assigned seats for them, and also expressed dissatisfaction with the environments at stations or transit stops [16]. The fare and sufficient seats were important factors for the elderly who traveled by train and by bus in Hong Kong [17]. In Thailand, the research was conducted on factors affecting the elderly’s mobility, with an emphasis on the development of city plans and transportation planning. The research objective was to enhance ageing mobility when traveling [18] by analyzing data in specific urban areas such as Bangkok. In addition, it was found that the elderly were unable to drive by themselves and were more likely to stop driving than those of other ages since most of disabled or the elderly who have body discrepancy had more walking restrictions, and difficulty in climbing and descending stairs. Thus, public transportation is challenging for the elderly, especially in the countryside or in remote areas where there is a shortage of public transport. This also causes the elderly’s travel limits, which affect their mental state [19].
From the literature review, we found that the studies on transportation service quality were conducted to increase service user satisfaction. Previously, only one or two methods were used for analysis. To fill the knowledge gap, we aimed to compare the three methods of analysis for assessing the elderly’s expectations and satisfaction toward public transport in a city: (1) Traditional IPA, (2) gap analysis, and (3) IPA integrated with competitors’ efficiency to develop transportation system management measures. In this research, we compared the analysis of expectations and satisfaction of users of all three methods to demonstrate the uniqueness of each theory, its results, and different interpretations. We also examined users’ viewpoints in different age range groups by considering 10 dimensions of factors for high satisfaction; the findings from the three methods can be applied to help develop this society that is ageing and to ensure the sustainability of future development. Moreover, the IPA analysis provides comprehensible interpretations and clearly straightforward results, which are the strengths of how those involved or those who are interested can repeat the method used.
2. Materials and Methods
2.1. Data Collection
We focused on a vulnerable population—the elderly (60 years and over). This research was approved by Ethics Committee for Researches Involving Human Subjects, Suranaree University of Technology (Project code: EC-72-62). Face-to-face interviews were chosen to collect data due to their flexibility by collecting information from the passengers in the community such as department stores, medical institutions, parks, bus stops, bus stations, government offices, and religious places.
The question items were tested using item–objective congruence (IOC) by experts in transportation. Statistics were used to determine the consistency between each question, which was successively adjusted according to the recommendations from the pilot test. For data collection, a total of 2700 questionnaires were obtained from 5 regions by surveying the provinces where the population number is 100,000 and up, which are the north, central, southern, and northeast regions—and divided in line with the Thailand National Statistical Office’s common practices by collecting 450 samples from each region. In this study, the data were collected by surveying from the passengers of 29 provinces as shown in Appendix A. An additional 450 surveys were collected from people using public transport, both elderly and non-elderly (aged 18–59 years) in Bangkok and metropolitan areas, where the management and transportation systems are different from the aforementioned four regions. The questionnaire was divided into 2 parts: Part 1 included social-demographic characteristics and travel behavior, such as sex, income, living status, travel purpose, travel time (the sum of access time to bus stop, waiting time, in-vehicle time, and egress time), and the number of travelers who travel with participants; Part 2 included question items consisting of 10 dimensions or 39 attributes regarding service quality, which were acquired from the literature review, as shown in Table 1. The satisfaction level with service was measured using a 5-point Likert scale (1, the lowest satisfaction level; 5, the highest satisfaction level).

Table 1.
Summary of factors influencing public transit service quality.
2.2. Methodology
The objective of this research was to analyze the passengers’ expectations and perceptions focusing on the elderly and public transportation areas in different regions in Thailand to lead to be sustainable development and to equally access transportation system. The area to be surveyed was divided into 5 regions. The 10 dimensions that were considered included (1) vehicle characteristics, (2) access, (3) safety, (4) reliability, (5) convenience, (6) waiting time, (7) staff, (8) information, (9) station/stop, and (10) affordability. The analyses were classified into three approaches. Firstly, traditional importance performance analysis (Traditional IPA) is the technique widely used for analyzing user expectations and satisfaction to improve service quality based on the priorities of product or service attributes based on the concept of Martilla and James [25]. The results of the IPA are displayed in the form of a grid in a two-dimensional graph with plotted importance and efficiency values. The x-axis shows the level of efficiency or customer satisfaction; the y-axis indicates the degree of importance. As a result, the graph is divided into four quadrants, as shown in Figure 2. Quadrant I, or “concentrate here”, indicates the priorities for improvement as the service efficiency is lower than the median value, but user expectation on its importance is high. For Quadrant II, or “keep up the good work”, operators or service providers should maintain the efficiency of service levels. Quadrant III, or “low priority”, is the area where the attributes are of low importance and low efficiency. Therefore, it is not important to quickly improve the attributes in this area. Quadrant IV, or “possible overkill”, is the area in which the operators are least interested because it is considered low priority, but very high proficiency.
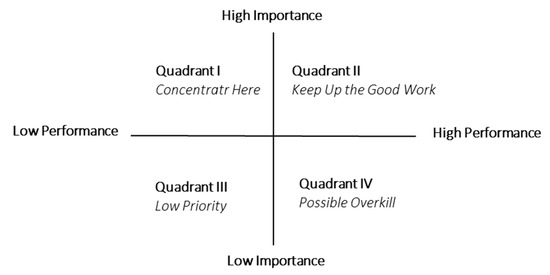
Figure 2.
The Traditional IPA framework. Source: Martilla and James [25].
The second approach, gap analysis, involves analyzing the difference between service perception and user expectations. The level of service provision is determined by the comparison between customer expectations and actual performance perceptions. When customers are satisfied with the service they receive, services are perceived by customers as being better than expected. Passenger satisfaction is therefore important for organizations aiming to increase the service quality of public transport operation [26]. The difference in value is calculated as where i is an indicator of service quality of public transport. In this paper, this is called Gap1 Analysis. The final approach is based on the basic principles of IPA, but the essential aspect of this approach is the integration performed by comparing differences in the effectiveness of the attributes and the areas of interest with those of competitors [27]. This is different from the traditional IPA method. The IPA strategy shows the strengths and weaknesses to be urgently improved or adjusted. The consideration is focused only the interesting areas which potentially create a unique advantage, in comparison with competitors to form a development strategy, when integrated into Gap2 with reference to competitors or Bases. In this case, the purpose is to achieve the distribution of prosperity and development for equality in society by taking the capital city like Bangkok as the base for the public transport development in Thailand. This approach can help identify the attributes needing improvement when comparing performance with competitors by plotting the importance value on the y-axis, as in the traditional IPA approach, and plotting the performance gap on the x-axis. The performance gap is calculated as . Here, we did not focus on comparison with competitors, but instead used data of attitudes toward public transport in the country’s capital compared with those of other regions in Thailand. As Bangkok is the capital of Thailand, with a dense population of 9.89 million, of which elderly people comprise 1.63 million, which is considered a remarkable proportion of the total 66 million in 2019 nationwide. Thus, Bangkok and its metropolitan areas were chosen to be the Base city in reference to other regions. We called this method IPA with Gap2 Analysis, as summarized in Table 2.
Table 2.
Comparison of the 3 methods related to passenger expectations and perceptions.
3. Results and Discussion
3.1. Respondents’ Social-Demographic Characteristics and Travel Behavior
According to statistical analysis, of the 2250 elderly people, divided into 1259 men and 991 women, 46.67% live with their children. They have different careers: 47.73% were business owners, 26.98% were employees, 12% were farmers, and 11.8% were general contractors. Of these respondents, 70% have personal income not exceeding 30,000 baht per month (calculated from the total regular income of the elderly, income from children, and pension income).
From the survey, we found that all elderly chose to travel in the morning, and 80% of them spent more than 30 min on a public transportation trip. The majority of the elderly traveled alone or together with another person. The travel purposes were mainly to travel or relax, visit relatives or friends, shopping, and government transactions; the unpunctuality of public transport was a travel experience that the elderly had experienced, as shown in Table 3 and Table 4.
Table 3.
Social-demographic characteristics of respondents.
Table 4.
Travel behavior.
3.2. Descriptive Statistics
Table 5 provides information about importance and performance of factors and variables of service quality obtained from the elderly passenger samples throughout Thailand. Waiting time was the most important factor with 4.60, followed by reliability and safety at 4.56, accessibility and vehicle characteristics at 4.53, convenience at 4.52, station/stop at 4.57, information at 4.45, staff at 4.44, and the least important factor was affordability at 3.69. When considering the details of attributes, the elderly passengers assigned the highest importance to W1 (there is a long waiting time while at the station or the stop) at 4.62, followed by R1 (service is stable and regular) at 4.59. From the perspective of performance, the values were comparable. Therefore, when using the importance and performance of each attribute for IPA analysis, more efficiently assessing weaknesses and improving each factor relevant to users will be useful for agencies.
Table 5.
Factors and variables of service quality (N = 2250).
3.3. Analysis and Discussion of Each Approach
3.3.1. Traditional IPA
For the traditional IPA approach, we divided the analysis into two types by age group and regions to better visualize the different perspectives of the elderly and non-elderly in terms of their mobility levels.
Age-Based Analysis
For analysis based on age, the passengers were divided into two groups, elderly (older than 60 years) and non-elderly (aged 18–59 years), who use public transport in Bangkok and its metropolitan area. The elderly and non-elderly passengers had different service needs, as explained in Figure 3. Elderly passengers supported a simple transportation system that is easy to use (C1 = 4.651), followed by the convenience of boarding and disembarking from the vehicle. The height from the floor to the car was considered appropriate (C5 = 4.636), as was the waiting time at the station or bus stop (W1 = 4.627). For non-elderly passengers, they firstly focused on the waiting time at the station/stop (W1 = 4.660), followed by providing complete travel information (I1 = 4.627) and long waits for passengers at stops (W2 = 4.587). These findings agree with those of Chang [15], who reported that elderly passengers value a simple system and that these passengers were worried about the physical deterioration of transportation systems. For non-elderly passengers, the waiting time was more important than to the elderly.
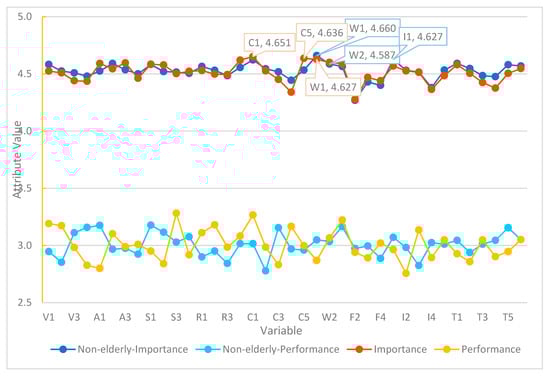
Figure 3.
Value of importance and satisfaction for elderly and non-elderly passengers.
When analyzing with IPA, a strategy to improve the quality according to the public transport priorities in Bangkok and its metropolitan area, both groups produced the same results including the cleanliness of the station and the stop (T2); the availability of facilities for the elderly such as ramps, elevators, handrails, etc. (A3); and the availability of facilities for the elderly such as Wi-Fi, toilets, stairs, handrails, and elevators (C2). All these factors appeared in the “Concentrate Here” quadrant, as shown in Table 6.
Table 6.
Summary of the attributes of passengers in Bangkok and its metropolitan area.
For the elderly, additional attributes were identified, as follows:
- Location, station, stop, and waiting time
From the traditional IPA approach, the elderly in Thailand assigned different values of importance than the non-elderly group in terms of font and sign size (T1, The size of the stop sign is appropriate) as well as station services such as shops, selling points, food, beverages, ATMs, etc. (T5, There are shops selling food, drinks, and ATMs), which performed more poorly than expected. We found that for the elderly in Hong Kong, the factors of having seats to accommodate the elderly and the environment of the station/stop considerably influenced their satisfaction level with public transport [16]. This finding is supported the research of Yu-ChunChang [15], who found that both groups of passengers were least satisfied with the space and convenience of the waiting area. We also found that waiting time (W1, There is a long waiting time while at the station or the stop) should be immediately improved as a “Concentrate Here” because the elderly’s mobility is reduced due to their age. According to Wong, et al. [17], elderly people want more frequent service to reduce waiting time, and improvements in waiting areas and stops. The satisfaction with the factor of frequency of the bus schedule in this research was still lower than the median value. If improvements are made, this factor could increase the service performance and, consequently, the satisfaction of all user groups. A previous study analyzed the mode of transportation used by the elderly and found that the elderly choose cheaper modes of transportation, and travel time was less important [28]. Similar to Yu-ChunChang’s research [15], the authors stated that elderly people, compared to the non-elderly, have more time and less income, so they are more interested in prices than waiting time.
Many studies showed that passengers perceive waiting time as being longer than real time as waiting incurs stress, complications, and less comfort than sitting on a vehicle [29]. In this regard, travel time includes waiting time at the station (or stop) and travel time in the vehicle. If waiting time is reduced by increasing the service frequency and facilities such as toilets, seats, Wi-Fi, shops, and ATMs at the station, benefits will be provided for all service users.
- Convenience and service access
Hu and Wang [14] surveyed the travel behaviors of Chinese elderly people and found that walking was most popular, followed by public transport, then other travel modes, which included bicycles, private vehicle, and taxis. This is inconsistent with Su and Bell [28], who stated that as people age, the conditions for their travel mode change. In terms of the public transport in Thailand, our findings suggested that the requirements for transportation mode are consistent with the physical characteristics of the elderly such as the height of step from the floor to the vehicle is suitable to facilitate their boarding and disembarking (C5). Public transit also provides convenient accessibility such as roads and pathways, and especially ramps and lifts (A1, A3), for wheelchair users, as well as providing complete and clear information regarding traveling, according the survey.
Regarding Thai elderly travel behavior, most of them travel alone or with another person. The clear information presentation and uncomplicated services are important for this passenger group. In Yu-ChunChang’s research [15], the results also indicated that the elderly ranked “user friendliness” second after safety.
- Safety
The elderly in Thailand focus on travel safety (S1) as well as the safety equipment inside the vehicle such as seat belts and glass hammers (S4), which increase passengers’ safety in addition to ensuring safe transit while on the vehicle (S2). For this issue, a study was conducted on the service quality of Thailand intercity train services for the development of the security system [13]. In addition, both groups of Taiwanese elderly and non-elderly passengers have ranked safety as the first priority for choosing a mode of transport to access the airport [15]. Indian passengers reported wanting to use public transport for their convenience, but that it lacked security for crime prevention in addition to the transfer distance, which was not appropriate [24]. A case of tramway and commuter rail in Algiers was reported, indicating that safety is a priority that must be developed to increase passenger satisfaction [7]. Our findings support those of Harvey and Thorpe [11], who proposed focusing on travel security to promote high speed rail travel in the U.K. Our findings are confirmed by those of Mayo and Taboada [21], who used an analytic hierarchy process (AHP). Overall, the security factor ranked the highest for those older than 60 years, and safety was ranked second after environmental factors.
Regional Analysis
The area analysis was divided into five regions: north, central, northeast, south, and Bangkok. When using tradition IPA analysis, the results were distinctive, all survey areas had S4 (There is safety equipment inside the vehicle such as seat belts and glass hammers) appearing in the most important quadrant and P1 (the fare is suitable for the income) in the “Keep Up the Good Work” or Q2, where it is recommended that these activities be maintained. The results are summarized in Table 7. In other words, safety is an important issue from the elderly’s perspective on public transport in all regions in Thailand, as well as in Pakistan, where 82% of elderly people assigned importance to safety and did not specially focus on the fare factor [30].
Table 7.
Summary of the attributes of passengers by traditional IPA.
3.3.2. Gap between Importance and Performance (Gap1)
Gap1 indicates users’ satisfaction arising from their expectations before using the service and awareness after using the service. If, after service, the customers are more satisfied with the service than expected, they are satisfied [26]. From this approach, the difference between perception and expectations was negative, which means that the service as perceived by customers after using the service was less than expected. The results were negative in all five areas, as shown in Table 8, and as supported by Yu-ChunChang [15]. When plotting the satisfaction and importance values of all factors on the line graph, we found that the total passenger satisfaction was low. This approach explained that after using services, customers perceive them as being unsatisfactory, or expected that the service would have been better. This analysis has limitations, as indicated by the case of cleanliness and neatness of stations and stop signs. The station is clean (T2) and the temperature inside the vehicle is appropriate (V3) received the same difference value in the Northeastern area (gap = 1.256). However, given the T2 importance (4.167) and performance (2.91) and the V3 importance (4.407) and performance (3.15), these attributes had different importance values that were not reflected in the gap value.
Table 8.
Gap between performance (P) and importance (I).
3.3.3. Gaps between Focal Performance and Benchmark Performance (Gap2)
This analysis was based on the basic principles of IPA by maintaining the core of this approach for further development. The analysis was separately conducted by region; the results are as follows: When comparing the transportation services between the north and Bangkok, the attributes appearing in the QI quadrant were A2, R1, C1, and I3. The attributes in the northeast region in the Q1 quadrant were S3, R1–R4, C1, W2, and I3. The attributes for the southern region had in QI were V2, A3, A4, S1, S4, R1, W2, I3, and T3. The attributes in QI in the central region were V1, V2, A2, A3, S3, S4, R1, R4, W2, and T3. The attributes in the QI area of the graph are values that were compared in importance between each region with the transportation service performance in Bangkok (Base). The attributes in QI for each region are those that should be immediately improved to equal Bangkok’s service level. This approach indicated that attribute R1 appeared in QI for all four regions, as shown in Figure 4. In other words, when the analysis was conducted by comparing the base city (Bangkok) to other regions in Thailand, we found that the disadvantages of public transportation systems included the lack of service stability as well as unreliability and stops.
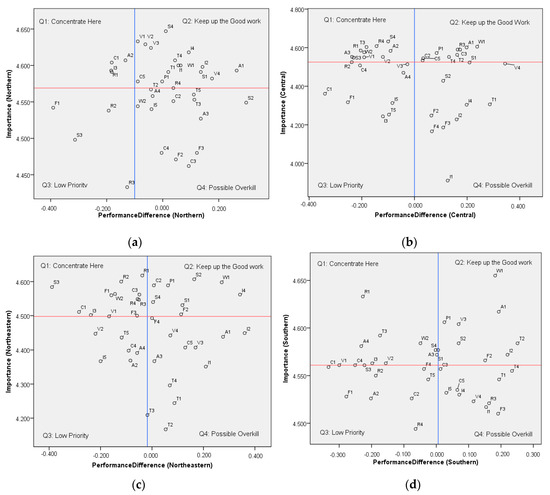
Figure 4.
The y axis shows the importance of regions, and the x-axis shows the difference values between the Base City and those regions: (a) Northern, (b) central, (c) northeastern, and (d) southern regions.
According to Wardman [29], the unreliability of the arrival time of public transport and the transfers between vehicles or between travel modes are considered waiting time for passengers. Similarly, according to Maruvada and Bellamkonda [12], Indian train passengers ranked “service reliability” as the worst dimension. This is consistent with Lunke [23], who found that waiting and transfer to the station reduce passenger satisfaction with public transport travel.
From the three analysis methods used to determine the importance and performance of public transport services in Thailand, the elderly passengers’ viewpoints are summarized according to the area in Table 9. We found that additional safety equipment such as seat belts, glass hammers, etc., is needed. This factor is active with all regions regardless of any method, and the public transport services are stably and consistently active in every region when compared with those of the capital.
Table 9.
Comparison of results from different approaches (factors appearing in the most important quadrant).
4. Conclusions
The analysis results of user expectations and satisfaction from all three approaches showed distinct strengths and theoretical differences that led to different interpretations. The traditional IPA, which acquires the easy and straightforward interpretation and can be reproduced, is suitable for guiding the policy implementation. If the gap between importance and performance approach is negative, it indicates that the user expects the service/attribute to be improved. However, it is difficult for entrepreneurs to consider the Gap1 approach only. This is the weakness of this approach, as the priority order of the factor to be developed or improved is not indicated. The IPA with the Gap2 approach is similar to traditional IPA, but it has a different objective, which is to compare the performance of a service to that of competitors. In this study, the Gap2 method is taken to integrate with the research to reflect the inequality of Thailand public transportation service system. Its findings are therefore useful as guidelines for stakeholders, such as transport operators or the government, to implement policy changes encouraging the elderly to use public transport, because it is a safer mode than driving by themselves due to their physical changes and mobility reduction. To ensure sustainable development, the issues that are important to the elderly should be improved and prioritized, such as safety, to increase efficiency of travel. Despite the fare reduction policy for elderly passengers, travel safety, or other services and facilities for the elderly, such as stairs, elevators, handrails, resting rooms, and wheelchairs, which are limited, cannot attract the elderly to use the service because they are more likely be at risk of accidents and crimes than other population groups.
Author Contributions
Conceptualization, S.J. and M.C.; formal analysis, M.C.; methodology, S.J.; data curation, M.C.; writing—original draft preparation, M.C.; writing—review and editing, S.J.; supervision, V.R.; funding acquisition, S.J. and V.R. All authors have read and agreed to the published version of the manuscript.
Funding
This research was funded by The Royal Golden Jubilee Ph.D. Program (Grant No. PHD/0015/2559) and the APC was funded by Suranaree University of Technology.
Acknowledgments
The authors would like to thank Thailand Science Research and Innovation (TSRI) and the Suranaree University of Technology for their joint support through the Royal Golden Jubilee Program (Grant No. PHD/0015/2559). The authors would like to express thanks to Piti Sukontasukkul for his constructive direction.
Conflicts of Interest
The authors declare no conflict of interest.
Appendix A
Table A1.
List of provinces surveyed.
Table A1.
List of provinces surveyed.
| Region | The Name of the Province |
|---|---|
| Bangkok and its metropolitan area | Nonthaburi, Samut Prakan, Samut Songkhram, and Samut Sakhon |
| Northern | Chiang Mai, Chiang Rai, Lampang, Nakhon Sawan, and Phetchabun |
| Northeastern | Khon Kaen, Nakhon Ratchasima, Buriram, Ubon Ratchathani, Sisaket, Udon Thani, Surin, Roi Et, Chaiyaphum, and Maha Sarakham |
| Central | Phra Nakhon Si Ayutthaya, Pathum Thani, Suphan Buri, Ratchaburi, and Chonburi |
| Southern | Nakhon Si Thammarat, Songkhla, and Surat Thani |
References
- United Nations, Population Division, World Population Ageing 2019, Department of Economic and Social Affairs, 2019, the United Nations: New York. Available online: https://www.un.org/development/desa/pd/sites/www.un.org.development.desa.pd/files/files/documents/2020/Jan/un_2019_worldpopulationageing_report.pdf (accessed on 31 December 2019).
- World Health Organization. Ageing and Health. 2018. Available online: https://www.who.int/news-room/fact-sheets/detail/ageing-and-health (accessed on 5 February 2018).
- The Bureau of Registration Administration, Number of citizens of Thailand, Department of Provincial Administration, Editor. 2020. Thailand. Available online: https://stat.bora.dopa.go.th/stat/pk/pk_62.pdf (accessed on 31 December 2019).
- United Nations, Department of Older Person, Statistics of Elderly in Thailand. 2020. Available online: https://www.un.org/en/development/desa/population/events/pdf/expert/29/session3/EGM_25Feb2019_S3_VipanPrachuabmoh.pdf (accessed on 31 December 2019).
- United Nations, Population Division. World Population Prospects. 2019. Available online: https://population.un.org/wpp/Graphs/1_Demographic%20Profiles/Thailand.pdf (accessed on 31 December 2019).
- Hounsell, N.; Shrestha, B.; McDonald, M.; Wong, A. Open Data and the Needs of Older People for Public Transport Information. Transp. Res. Procedia 2016, 14, 4334–4343. [Google Scholar] [CrossRef]
- Machado-León, J.L.; De Oña, R.; Baouni, T.; De Oña, J. Railway transit services in Algiers: Priority improvement actions based on users perceptions. Transp. Policy 2017, 53, 175–185. [Google Scholar] [CrossRef]
- Sum, S.; Champahom, T.; Ratanavaraha, V.; Jomnonkwao, S. An Application of ImportancePerformance Analysis (IPA) for Evaluating City Bus Service Quality in Cambodia. Int. J. Build. Urban Inter. Landsc. Technol. 2019, 13, 56–66. [Google Scholar]
- Weng, J.; Di, X.; Wang, C.; Wang, J.; Mao, L. A Bus Service Evaluation Method from Passenger’s Perspective Based on Satisfaction Surveys: A Case Study of Beijing, China. Sustainablity 2018, 10, 2723. [Google Scholar] [CrossRef]
- Huang, Y.-K.; Kuo, Y.-W.; Xu, S.-W. Applying Importance-Performance Analysis to Evaluate Logistics Service Quality for Online Shopping Among Retailing Delivery. Int. J. Electron. Bus. Manag. 2009, 7, 128–136. [Google Scholar]
- Harvey, J.; Thorpe, N.; Caygill, M.; Namdeo, A. Public attitudes to and perceptions of high speed rail in the UK. Transp. Policy 2014, 36, 70–78. [Google Scholar] [CrossRef]
- Maruvada, D.P.; Bellamkonda, D.R.S. Analyzing the Passenger Service Quality of the Indian Railways using Railqual: Examining the Applicability of Fuzzy Logic. Int. J. Innov. Manag. Technol. 2010, 1, 478–482. [Google Scholar]
- Jomnonkwao, S.; Champahom, T.; Ratanavaraha, V. Methodologies for Determining the Service Quality of the Intercity Rail Service Based on Users’ Perceptions and Expectations in Thailand. Sustainablity 2020, 12, 4259. [Google Scholar] [CrossRef]
- Hu, X.; Wang, J.; Wang, L. Understanding the Travel Behavior of Elderly People in the Developing Country: A Case Study of Changchun, China. Procedia Soc. Behav. Sci. 2013, 96, 873–880. [Google Scholar] [CrossRef]
- Chang, Y.-C. Factors affecting airport access mode choice for elderly air passengers. Transp. Res. Part Logist. Transp. Rev. 2013, 57, 105–112. [Google Scholar] [CrossRef]
- Wong, R.; Szeto, W.; Yang, L.; Li, Y.; Wong, S. Elderly users’ level of satisfaction with public transport services in a high-density and transit-oriented city. J. Transp. Health 2017, 7, 209–217. [Google Scholar] [CrossRef]
- Wong, R.; Szeto, W.; Yang, L.; Li, Y.; Wong, S. Public transport policy measures for improving elderly mobility. Transp. Policy 2018, 63, 73–79. [Google Scholar] [CrossRef]
- Srichuae, S.; Nitivattananon, V.; Perera, R. Aging society in Bangkok and the factors affecting mobility of elderly in urban public spaces and transportation facilities. IATSS Res. 2016, 40, 26–34. [Google Scholar] [CrossRef]
- United Nations. Report of the Independent Expert on the Enjoyment of All Human Rights by Older Persons; Rosa Kornfeld-Matte, H.R., Council, Ed.; The Office of the UN High Commissioner for Human Rights: Switzerland, 2018. Available online: https://digitallibrary.un.org/record/1638448 (accessed on 17 July 2018).
- Irfan, S.M.; Kee, D.M.H.; Shahbaz, S. Service Quality and Rail Transport in Pakistan: A Passenger Perspective. World Appl. Sci. J. 2012, 18, 361–369. [Google Scholar]
- Mayo, F.L.; Taboada, E.B. Ranking factors affecting public transport mode choice of commuters in an urban city of a developing country using analytic hierarchy process: The case of Metro Cebu, Philippines. Transp. Res. Interdiscip. Perspect. 2020, 4, 100078. [Google Scholar] [CrossRef]
- Baumann, C.; Hoadley, S.; Hamin, H.; Nugraha, A. Competitiveness vis-à-vis service quality as drivers of customer loyalty mediated by perceptions of regulation and stability in steady and volatile markets. J. Retail. Consum. Serv. 2017, 36, 62–74. [Google Scholar] [CrossRef]
- Lunke, E.B. Commuters’ satisfaction with public transport. J. Transp. Health 2020, 16, 100842. [Google Scholar] [CrossRef]
- Adlakha, D.; Parra, D.C. Mind the gap: Gender differences in walkability, transportation and physical activity in urban India. J. Transp. Health 2020, 18, 100875. [Google Scholar] [CrossRef]
- Martilla, J.A.; James, J.C. Importance-Performance Analysis. J. Mark. 1977, 41, 77. [Google Scholar] [CrossRef]
- Zeithaml, V.A.; Parasuraman, A.; Berry, L.L. Delivering Quality Service: Balancing Customer Perceptions and Expectations; The Free Press: New York, NY, USA, 1990. [Google Scholar]
- Feng, M.; Mangan, J.; Wong, C.; Xu, M.; Lalwani, C. Investigating the different approaches to importance–performance analysis. Serv. Ind. J. 2014, 34, 1021–1041. [Google Scholar] [CrossRef]
- Su, F.; Bell, M. Transport for older people: Characteristics and solutions. Res. Transp. Econ. 2009, 25, 46–55. [Google Scholar] [CrossRef]
- Wardman, M. Public transport values of time. Transp. Policy 2004, 11, 363–377. [Google Scholar] [CrossRef]
- Ahmad, Z.; Batool, Z.; Starkey, P. Understanding mobility characteristics and needs of older persons in urban Pakistan with respect to use of public transport and self-driving. J. Transp. Geogr. 2019, 74, 181–190. [Google Scholar] [CrossRef]


Publisher’s Note: MDPI stays neutral with regard to jurisdictional claims in published maps and institutional affiliations. |
© 2020 by the authors. Licensee MDPI, Basel, Switzerland. This article is an open access article distributed under the terms and conditions of the Creative Commons Attribution (CC BY) license (http://creativecommons.org/licenses/by/4.0/).