Abstract
The airport terminal is a complex building composed of many functional subsystems dimensioned to host passenger traffic, considering an appropriate level of service (LoS). The most widely known method to assess the LoS and design the terminal areas is the Airport Development Reference Manual by the International Air Transport Association (IATA). Based on this, a calculation tool in Microsoft Excel® was implemented to assess the capacity and dimension of the facilities for each functional subsystem of the terminal. The tool, composed of nine correlated spreadsheets, is a useful model to design new structures, evaluate the LoS currently offered, plan interventions, and face the new rules of passenger distancing due to the COVID-19 emergency. An international airport terminal with 20 million/year including Schengen and extra-Schengen passengers was studied. The LoS of the terminal subsystems was assessed and the areas needed for each subsystem were calculated. In the analyzed case study, most subsystems (departure hall, check-in, boarding gates, baggage claim, and arrival halls) were over-designed, according to the definition of the IATA LoS. This means that available spaces for queues and holding are sufficiently large to easily face the new rules of social distancing for passengers due to the recent COVID-19 emergency.
1. Introduction
The airport is a complex infrastructure composed of many functional subsystems that should satisfy the expected traffic demand over time by means of an appropriate airport master planning process. Studying airport capacity is commonly used to evaluate the suitability of each airport system to the traffic demand.
The study of airport capacity is a useful tool to plan maintenance works or to assess the level of service of functional subsystems both airside and landside. Of course, the development plan can take place only by analyzing the influence of the forecast works on economic, logistics, and safety issues [1] and analyzing the risk in the internal or surrounding areas in order to prevent and minimize the mechanical, social, and economical consequences of accidents. Moreover, the strategies adopted to increase airport capacity or manage the traffic demand for a given service level affect environmental sustainability: air transport accounts around 10% of all transport energy consumption in the EU and is responsible for approximately 15% of all CO2 emissions [2]. The increased emissions could be faced by suitable airport organization [3]. Moreover, not only the increased air traffic, but also the increased road traffic must be taken into account around the airport. Indeed, the variation in the total number of passengers also means a revision of the access to the airport. Therefore, any modification of airport capacity affects and depends on the environmental policy of airport operators and the social and transport organization [4].
Many studies have been published on airside capacity assessment to evaluate both the construction of new infrastructures [5,6], the introduction of new operative procedures [7], and to plan the maintenance work and the relative closure of some infrastructures [8,9,10]. Studies of airside capacity can be conducted with empirical and analytical methods [11,12,13] or simulation software [6,7,14,15,16,17]. These methods have been studied for several years and currently, there are some very sophisticated software products [18,19] that can give results very close to reality.
The landside capacity is as important as the airside capacity, indeed all the infrastructures in the airport serve the aircraft operations, and therefore the subsystem with the lowest capacity defines the final capacity of the whole airport.
Landside capacity is crucial in the event of a health crisis: in this period of managing COVID-19 infections, the restoration of air connections is subject to the possibility of maintaining the necessary separation distance between passengers who must transit through the terminals. In this regard, guidelines have been issued to manage passengers in airport terminals, both at a European level [20] and in individual countries (in Italy, [21]). Of course, not only the health of the passengers must be preserved. It is a specific task of the airport manager to safeguard the health of airport workers as well as ensure adequate procedures and areas for the correct performance of the duties of each worker.
Some methods are available to evaluate the landside capacity. The main types are simulation software [22] and empirical manuals [23,24]. Simulation models are widely used [25,26] and some software are available such as CAST [27], FlexSIM [28] AirSIM [29], and AIRLAB [30]. These models offer many and flexible opportunities to model queuing processes in many different scenarios, putting the passengers at the center of such models. Indeed, they can analyze passenger flow and queuing processes within airport terminals, allowing them to reproduce the operations of actual processes including implicit variables such as human behavior and attitudes [31]. Simulation approaches have been used to model every subsystem in the airport terminal and many studies can be found in the literature [32,33,34,35].
Cost and time consumption are the disadvantages of simulation approaches: this is why they are used in advanced phases of the project, when high calculation precision is required. They could be crucial to study particular situations, for example, those related to COVID-19 emergency management inside the airport terminal, even if current uncertainty about COVID-19 makes effective management very difficult. Indeed, past airport experience and a productivity-oriented operations mindset are not enough to understand the future development in the airport [36]. In the second group of available methods to evaluate the landside capacity, the empirical manuals, there are few generally accepted methods. The most widely used are the guidelines by the Federal Aviation Administration (FAA) [37] and the manuals by the International Air Transport Association (IATA) [23,24].
This article deals with this second group of methods, and particularly deals with the methods defined by the IATA, which will be described in the next section. The aim of the research was to implement a calculation tool to verify the level of service in the airport terminal for a study of the airport development plan. This study was part of the study on the terminal capacity to give an airport manager justification for expansion planning. The research started before COVID-19 to verify the level of service at an airport terminal, therefore, the traffic before COVID-19 was considered.
2. The International Air Transport Association (IATA) Reference Manuals
The landside capacity is defined as the number of passengers that can be served in a defined period and is strictly connected to the level of service of each functional component of the terminal.
The levels of service (LoS) can be defined as the ability of supply to meet demand [23] and represent a guiding framework for planning new terminal structures or for monitoring the operational service of existing structures.
Until the ninth edition of the manual [23], IATA defined six LoS (Table 1).

Table 1.
International Air Transport Association (IATA) level of service framework in the ninth edition of the manual [23].
For each level of service, IATA proposes minimum pro-capita surfaces for the main functional components of the terminal and level of service C was recommended as the minimum design objective, as it denotes good service at a reasonable cost.
Over the years, decision-makers have pushed their design teams to create terminals capable of providing passengers with an “excellent” level of service. This led to the creation of oversized structures, which remained substantially empty for most of their initial working life. Another problem of the previous editions of the IATA manual concerned the waiting times of passengers for processing; there was indeed no direct connection with the service levels and this caused the incorrect applicability of the maximum waiting times assumed by the IATA itself [38].
The tenth edition of the IATA Airport Development Reference Manual [24] is based on a new concept of LoS that aims to optimize expenses and increase the speed, quality, and efficiency of service. It defines the service levels by analyzing both space and waiting time in the various subsystems, and proposes the classification shown in Table 2.
Table 2.
IATA LoS matrix of terminal functional subsystems [24].
The Over Design level identifies high service levels, with very limited waiting times for passengers in the various control processes and the largest passenger surfaces. The Optimum level indicates an adequate level of service and stable conditions in the various operating subsystems. It corresponds to the “service level C” considered in the previous version of the Manual and is the new LoS concept target. The Sub Optimum level is not desirable as it is associated with areas that are undersized with respect to the flow of passengers to be served, or with waiting times higher than the acceptable values. Finally, the Under Provided level indicates a condition where there are uncomfortable and crowded spaces and unacceptable processing and waiting times. For each LoS, [24] lists the range of surface areas and waiting times to adapt the terminal level of service to demand (Table 3).
Table 3.
Space and waiting times for each terminal subsystem and each LoS [24].
This study presents a model for assessing the consistency and capacity of a terminal by analyzing its individual subsystems. The model was developed in Microsoft Excel® according to [24,39]. The proposed calculation model is a useful tool for defining the surfaces and equipment necessary to guarantee a standard level of service (i.e., optimum) to all the operating areas that make up the passenger terminal.
3. Methods
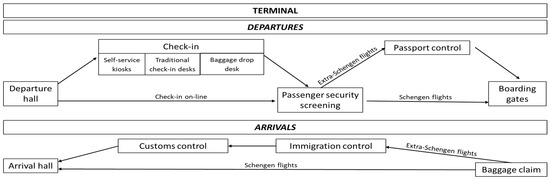
Figure 1.
Analyzed function subsystems.
The traffic demand to assess the LoS was evaluated by the typical peak hour passenger (TPHP), which is defined as the peak hour passenger traffic volume of the average day in the peak month [38]. This value is associated with the 90th (or 95th) percentile of the busiest hour of the year. This means that the infrastructure will meet 90% or 95% of the annual traffic with a predetermined level of service month.
In order to estimate the surfaces and equipment of each subsystem, [24] provided for the passenger peak in 30 min (of PHP); average time of passenger presence; percentage of escorts/receivers; processing time; pro capite surface; queuing time; percentage of passengers with baggage; and average number of passengers per flight. For each sub-system, the specific parameters, the theoretical formulas, the analytical procedure to be followed to obtain the number of facilities, the maximum queuing time, and the required areas were implemented in the Excel spreadsheet. All functional components (and the spreadsheets) considered movements that, generally, showed that passenger flow takes place inside the terminal.
3.1. Spreadsheet n.1—Departure Hall
All passengers and their companions are in the departure hall during the waiting period before going to the check-in area or in the time that elapses between registration and presentation at security checks, in the case that check-in has already been done online. Equation (1) gives the number of people, PD, in the departure hall:
where DPHP is the departing peak hour passengers; TP is the average residence time for passengers; TV is the average residence time for companions; and VRD is the number of visitors per passenger in the departure hall.
The required area, A1, in the departure hall (in m2) is given by Equation (2):
where SR is the percentage of seats; SPS is the space per seating person (m2); and SPST is the space per standing person (m2).
In the departure hall, the flow of departing passengers begins to separate: those who have to check-in will go to the appropriate area and those who have already checked-in online and printed their boarding pass will go to the security check.
3.2. Spreadsheet n.2—Check-In Facilities
Self-service stations, areas for traditional check-in (counters), and baggage drop facilities are recommended in this area by IATA [24]. With this arrangement, the queues and waiting times can be reduced and the use of spaces can be optimized.
3.2.1. Self-Service Facilities
The number of self-service kiosks (SS) can be calculated according to Equation (3):
where PK2_1 is the peak 30-min factor (% on DPHP) at the self service facilities; SSR is the ratio of passengers using self-service; PT_SS is the process time for passenger at self-service (seconds); MQT2_1 is the maximum queuing time (minutes) at the self service facilities; and Cf is a correction factor that depends on the variability in the distribution of passenger arrivals during the peak period and the maximum waiting time for processing: the shorter the maximum waiting time, the greater the variability of demand in the analysis of the 30 min period.
The maximum number of passengers waiting in queue (QMAX2_1) is given by Equation (4):
where Qf is a factor depending on MQT2_1.
Finally, the area A2_1 required for the self-service kiosks is given by Equation (5):
where SSa is the area occupied by a single self-service kiosk; AA is the adjustment area for a single self-service kiosk; SP is the space for person (m2/pax); and CAF is the circulation area factor (%).
3.2.2. Traditional Check-In
The number of service desks for economy, business, and first class passengers (CDY, CDJ, CDf, respectively) are calculated according to Equations (6) to (8):
where PK2_2 is the peak 30 min factor (% on DPHP) at the traditional check-in; PJ/f is the proportion of business or first class passengers (% of DPHP); CR is the ratio of passengers using traditional check-in facilities; PT_CDY/J/f is the process time for passengers at service desks for economy, business, and first class passengers (in seconds); MQT2_2Y/J/f is the maximum queuing time for economy, business, and first class passengers (in minutes) at the traditional check-in.
Equation (9) gives the total number of service desks (CD):
Equations (10)–(12) give the maximum number of passengers waiting in queues at desks for each passenger class, and Equation (13) gives the total number:
Finally, Equation (14) gives the space A2_2 required for the traditional check-in desks (in m2):
3.2.3. Baggage Drop Facilities
Equations (15)–(17) provide the number of baggage drop positions for economy, business, and first class passengers (BDY, BDJ, BDf, respectively):
where PK2_3 is the peak 30 min factor (% on DPHP) at the baggage drop facilities; BPR is the ratio of passengers using traditional check-in and by-passing the bag drop facilities (%); PT_BDY/J/f is the process time for passenger at baggage drop facilities for economy, business, and first class passengers (in seconds); MQT2_3Y/J/f is the maximum queuing time for economy, business, and first class passengers (in minutes) at the baggage drop facilities.
Equation (18) gives the total number of baggage drop positions (BD):
Equations (19) and (20) give the maximum numbers of passengers waiting in queue at baggage drop for economy/business passenger (QMAX2_3Y and QMAX2_3J, respectively):
The area A2_3 required for the bag drop facility (in m2) is given by Equation (21):
where BDd is the depth of the baggage drop process area (in m) including a courtesy distance between desks and queue; BDw is the width of one baggage drop position (in m), obtained from typical dimensions; and W2 is the corridor width behind the check-in desks.
3.3. Spreadsheet n.3—Passenger Security Screening
Once checked-in, passengers go to the security checks, where they arrive with a distribution proportional to the time taken for the check-in, calculated in the previous subsystem. The throughput 30-min demand depends on departing passengers arriving from the traditional check-in system (CD), departing passengers arriving by the baggage drop system (BD), and departing passengers who have already checked in online or self-service (Equation (22)):
where PK330MIN is the throughput 30-min demand arriving at the passenger security screening; PK3 is the peak 30-min factor (% on DPHP) at the passenger security screening; and BR is the ratio of passengers using baggage drop.
If there are many check-in desks, then the passenger flow is smooth and “quickly” arrives at the security system, consequently many lanes will be required to meet the demand for processing. In contrast, if there are few check-in desks, passengers remain “blocked”, so the capacity of the subsystem is reduced and they arrive at the security checks in a “staggered” manner.
The number of security lanes at the security check (SEC) is (Equation (23)):
where PTSEC is the process (throughput) time for passenger at security (in seconds) and MQT3 is the maximum queuing time (in minutes) at the baggage drop facilities passenger security screening.
Equation (24) gives the maximum number of passengers waiting in queues at the security screening (QMAX3):
The area A3 required for the security screening facility (in m2) is given by Equation (25):
where SECd is the depth of one security lane (in m); SECW is the width of one security lane (in m); SP is the space for person (m2/pax); and W3 is the egress width behind lanes (in m).
Once security checks have been carried out, passengers enter the airport’s airside and, depending on the type of flight they are boarding, they will go to their respective functional subsystems. The former can go to the boarding lounge, which, depending on the configuration of the infrastructure, can be located on the second floor of the terminal or in connected or remote piers, following the signs relating to the designated gate. The latter will have to carry out a passport check.
3.4. Spreadsheet n.4—Passport Control Area
The fourth-functional subsystem analyzed in the model was the passport control area. First, the throughput demand from the initial 30 min processing (PK430MIN) at the passport control desks was calculated according to Equation (26):
where DPHP_X is the departing peak hour extra-Schengen passenger (pax/h); PK4 is the peak 30-min factor (in % di DPHP_X); and CR is the ratio of passengers using traditional check-in facilities.
The number of departure passport control desks PD is Equation (27):
where PTPD is the process time for passenger at departure passport control (in seconds) and MQT4 is the maximum queuing time at passport control desks (minutes).
The maximum number of passengers waiting in queues at passport control (QMAX4) is given by Equation (28):
The area A4 required for the passport control facility (in m2) is given by Equation (29):
where SP is the space for person (m2/pax) and W4 is the corridor width behind desks of passport control (in m).
3.5. Spreadsheet n.5—Boarding Gates
Figure 2 shows a scheme of a generic pier with two gate fronts. This scheme is very common in European airports, where the lounge is generally divided in two parallel sides.
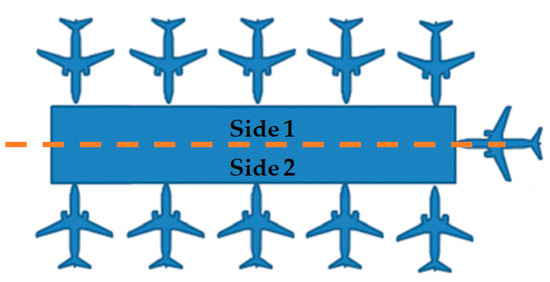
Figure 2.
Scheme of a generic pier with two gate fronts.
Equation (30) gives the number of gates for Schengen (GS) or extra-Schengen (GX) passengers:
where DPHPS/X is the departing peak hour Schengen/extra-Schengen passenger (pax/h); AVG LOAD is the average aircraft load (pax/mov.); Tturn is the time turnaround (in minutes); and Cfg is a generic, conservative correction factor that takes into account delays, inconveniences, etc.
Given the aircraft load factor (LF), Equations (31) and (32) give the area for seating passengers (AS) and area for standing passengers (ASt), and the total area A5 for waiting rooms is given by Equation (33):
where G is the number of gates; AS is the total number of seats offered by all aircraft (Schengen/extra-Schengen); SRf is the seat ratio adjustment factor; Gf is the open gate lounge factor; S(S/ST) is the space for seated/standing person (m2/pax); and X is the additional space ratio to account for boarding operation (% of global gate area).
Equation (34) gives the width of the pier on side 1 or side 2 (GLd1/2), which depends on the area of side 1 or 2 of the pier (A1/2) and on the pier length (PL):
The total width of the pier (PW) is given by the sum of the widths of the two sides of the pier and the width (W5) of the circulation corridor including moving devices (in m) (Equation (35)):
The other subsystems in the terminal are dedicated to arrivals.
3.6. Spreadsheet n.6—Baggage Claim
Figure 3 shows a scheme of the baggage claim facilities with the following meaning of the acronyms: CL(NB/WB) is the carousel frontage for passenger line up for narrow body (NB) or wide body (WB); Cw is the carousel width; SB is the side buffer to allow passenger movement around the reclaim belt on both sides; and EB is the end buffer to allow passenger movement around the reclaim belt on both sides.
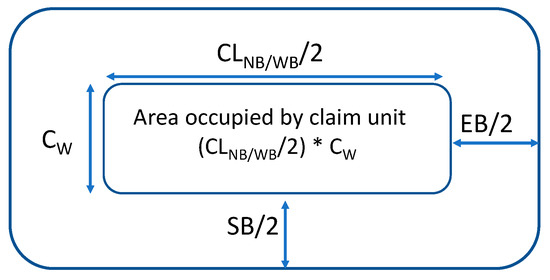
Figure 3.
Baggage claim facility, IATA model.
The evaluation of carousel frontage was calculated according to Equation (36):
where PAX(NB/WB) (S/X) is the number of NB/WB Schengen/extra-Schengen passengers in the design aircraft; SP6 is the claim frontage for passenger (in m); PRS/X is the ratio of Schengen/extra-Schengen passengers collecting bags (in %); and RRS/X is the recirculation rate Schengen/extra-Schengen (in %).
The number of baggage claim units is given by Equation (37):
where APHP_S/X is the terminating peak hour Schengen/extra-Schengen passengers (pax/h); PNB/WB is the proportion of passengers arriving by NB/WB (in %); and OTNB/WB is the average claim device occupancy time for NB/WB (in minutes).
The areas of the carousel (AC) for the NB/WB aircraft and of the baggage claim Schengen/extra-Schengen hall (A6) are Equations (38) and (39), respectively:
3.7. Spreadsheet n.7—Immigration Facility
After collecting their baggage, non-Schengen passengers go passport control, while Schengen passengers can go directly to the arrival hall. In order to size the passport control room, the first step is calculating the number of arrival passport control desks (PC) according to Equation (40):
where PK7 is the peak 30-min factor (in % of APHP_X); PT is the process time for passenger at arrival passport control (in seconds); and MQT7 is the maximum queuing time at the immigration facilities (in minutes).
The maximum number of passengers waiting in queues at the immigration facilities (QMAX7) is given by Equation (41):
while the required area of the arrival passport control facility (A7) is obtained from Equation (42):
where W7 is the corridor width behind desks at the immigration facilities (meters).
3.8. Spreadsheet n.8—Custom Process
The check on goods imported from non-Schengen countries is carried out in the customs area, which is generally located in the terminal area of the passenger arrival area, after the baggage delivery. Equation (43) gives the number of primary inspection booths (PI):
where PTPI is the process (throughput) time for passenger at primary inspection booth (seconds) PK8 is the peak 30-min factor (% on DPHP) at the custom process and MQTPI is the maximum queuing time at primary inspection (minutes).
The maximum number of passengers waiting in queue at primary inspection (QMAXPI) is given by Equation (44):
The area required for the primary inspection facility (API) results from Equation (45):
where Pld is the depth of one primary inspection booth lane (in m) and Plw is the width of one primary inspection booth lane (in m).
The number of X-ray units (XR) is calculated according to Equation (46):
where IR is the Ratio of Passengers to be Inspected (in %) and MQTXR is the maximum queuing time at the X-ray facility (minutes).
The maximum number of passengers in queue for X-ray (QMAXXR) is shown in Equation (47):
Finally, the area required for the X-ray facility (A8) results can be found from Equation (48)):
where W8 is the corridor width before/behind desks at custom process (meters) and XRw is the width of an X-ray control lane.
3.9. Spreadsheet n.9—Arrivals Hall
The last functional subsystem in the airport terminal building is the arrivals hall. Its required area A9 is calculated according to Equation (49):
where PA is the number of passengers in the arrivals hall according to Equation (50):
where APHP is the terminating peak hour passengers (pax/h); T(P/V) is the dwell time for Passengers/Visitors (minutes); VRA is the number of visitors per passenger in the arrivals hall; SR is the Seat Ratio (in %); and SP(S/ST) is the space for seated/standing person (m2/pax).
3.10. Case Study
The capacity of a European international airport terminal that before the COVID-19 pandemic had monitored 20 million/year (AP) including Schengen and extra-Schengen passengers was assessed with the described model. Its surveyed TPHP value was equal to 8000. The following passenger share among subsystems in the terminal and type of passengers were monitored; all percentages refer to TPHP:
- arrivals and departures components are 60% and 65% of the total passenger peak, respectively;
- arrival hourly peaks for Schengen and extra-Schengen flows are 50% and 40%, respectively; and
- departing hourly peaks for Schengen and extra-Schengen flows are 55% and 40% of the overall peak, respectively.
Table 4 lists the fleet mix operating in the analyzed terminal.
Table 4.
Fleet mix operating in the terminal.
The boarding gates are located in a pier with two fronts, similar to that one shown in Figure 2. NB aircrafts, mainly used for Schengen flights, are positioned on the stands of side 1, while WB aircrafts, used for intercontinental connections, are positioned on those of side 2.
4. Results
For each subsystem in the terminal, the required areas and facilities were calculated with regard to the suggested spaces and times provided by [23] to get the LoS “Optimum”. Table 5, Table 6, Table 7, Table 8, Table 9, Table 10, Table 11, Table 12, Table 13, Table 14 and Table 15 list the input and output values.
Table 5.
Input and output values for the departure hall.
Table 6.
Input and output values for check-in self-service facilities.
Table 7.
Input and output values for traditional check-in.
Table 8.
Input and output values for baggage drop facilities.
Table 9.
Input and output values for passenger security screening.
Table 10.
Input and output values for passport control.
Table 11.
Input and output values for boarding gates.
Table 12.
Input and output values for baggage claim.
Table 13.
Input and output values for the immigration facility.
Table 14.
Input and output values for the customs process.
Table 15.
Input and output values for the arrivals hall.
5. Discussion
According to the results listed in Table 5, Table 6, Table 7, Table 8, Table 9, Table 10, Table 11, Table 12, Table 13, Table 14 and Table 15, Table 16 compares the available and needed spaces to obtain the LoS.
Table 16.
LoS of the analyzed subsystems.
The results in Table 16 highlight that most of the existent subsystems satisfy the ordinary traffic demand: the observed over-designed spaces play a crucial role during the current COVID-19 emergency. Indeed, the new rules [15,16] with regard to social distancing in queues require a reconfiguration of queuing areas to keep lateral distance and reduce waiting time.
The only operational areas in which there are possible delays in the level of service, compared to the standards defined by [19], concern the areas dedicated to passenger security screening and passport control on departure area and immigration facilities in the arrival area.
As said in the introduction, this model was studied with the aim of evaluating the terminal capacity to give the manager justification for expansion planning. This method is very economical and time saving, and it is a useful tool for identifying preliminary strategies for the future development of the airport terminal. Based on the obtained results, the manager can prepare detailed plans of the areas to be modified or expanded. In this case study, for example, the passenger security screening and passport control in the departure area and immigration facilities in the arrival area need detailed projects that can be supported by more sophisticated method such as the simulation model [25,26,27,28,29,30,31,32,33,34,35].
With the pandemic, the development plan was suspended, but the airport manager was able to ascertain that the spaces for the movement of passengers were more than sufficient even when the traffic reaches pre-COVID-19 levels.
6. Conclusions
In this study, a model of evaluating airport terminal capacity was developed in Microsoft Excel® based on the IATA recommendations contained in the Airport Development Reference Manual, tenth edition. The calculation tool provides a measure of the areas and the number of facilities for each functional subsystem of an airport terminal for a given volume of traffic. The process involves the correlation among the different equations present on the same spreadsheet and/or in different sheets to simulate what happens between functional subsystems. The model is a useful tool to design new structures, evaluate the level of the service currently offered, and to plan interventions based on the estimates of future traffic. The correct definition of strategies for managing traffic demand with an adequate level of service also has a favorable impact on the protection of the health of passengers and airport workers. This is even more true during health crises such as the current one regarding COVID-19. A case study was developed with the implemented method: a European international airport terminal with 20 million/year including Schengen and extra-Schengen passengers was studied and the areas needed for the subsystems composing the terminal were assessed. The analyzed subsystems were departure hall, check-in, passenger security screening, passport control, boarding gates, baggage claim, immigration facility, inspection facility, and arrivals hall.
The level of service was too low only in the systems of passenger security screening and passport control in the departure area and immigration facilities at the arrival area. The inspection facilities had an optimum level of service while the other analyzed subsystems (departure hall, check-in, boarding gates, baggage claim, and arrivals hall) were over-designed.
On the basis of results derived from the illustrated method, the manager can prepare detailed plans of the areas to be modified or expanded. In this case study, for example, the passenger security screening and passport control in the departure area and immigration facilities at the arrival are, need detailed projects that can be supported by more sophisticated method such as the simulation model. This means that the spaces for queues and holding are sufficient to easily face the new rules of passengers socially distancing in queues and holding areas to face the COVID-19-emergency.
Author Contributions
Conceptualization, P.D.M., L.M., and M.P.; Methodology, M.P.; Software, M.P.; Validation, L.M. and M.P.; Formal analysis, P.D.M., L.M., and M.P.; Investigation, M.P.; Data curation, P.D.M. and M.P.; Writing—original draft preparation, P.D.M.; Review and editing, P.D.M., M.P., and L.M.; Supervision, P.D.M. All authors have read and agreed to the published version of the manuscript.
Funding
This research received no external funding.
Conflicts of Interest
The authors declare no conflict of interest.
References
- Graham, B.; Guyer, C. Environmental sustainability, airport capacity and European air transport liberalization: Irreconcilable goals? J. Transp. Geogr. 1999, 7, 165–180. [Google Scholar] [CrossRef]
- Stanners, D.; Bourdeau, P. (Eds.) Europe’s Environment: The Dobris Assessment; Office for Official Publications of the European Communities, Luxembourg/European Environment Agency: Copenhagen, Denmark, 1995. [Google Scholar]
- Postorino, M.N.; Mantecchini, L.; Paganelli, F. Improving taxi-out operations at city airports to reduce CO2 emissions. Transp. Policy 2019, 80, 167–176. [Google Scholar] [CrossRef]
- Button, K.; Nijkamp, P. Social change and sustainable transport. J. Transp. Geogr. 1997, 5, 215–218. [Google Scholar] [CrossRef]
- Lopes Craveiro, G. Airport Capacity Enhancement Analysis through Fast-Time Simulations. Lisbon’s Airport Case Study. 2017. Available online: https://pdfs.semanticscholar.org/8abf/eeef9fa6dd2b7113a94bf8cd4c30a1c5e5c1.pdf (accessed on 18 August 2020).
- Di Mascio, P.; Cervelli, D.; Comoda Correra, A.; Frasacco, L.; Luciano, E.; Moretti, L.; Nichele, S. Capacity studies for airport planning. J. Airpt. Manag. 2020, 14, 307–321. [Google Scholar]
- Di Mascio, P.; Cervelli, D.; Comoda Correra, A.; Frasacco, L.; Luciano, E.; Moretti, L. Effects of Departure MANager (DMAN) and Arrival MANager (AMAN) systems on airport capacity. J. Airpt. Manag. (accepted paper).
- Leonelli, F.; Di Mascio, P.; Germinario, A.; Picarella, F.; Moretti, L.; Cassata, M.; De Rubeis, A. Laboratory and on-site tests for rapid runway repair. Appl. Sci. 2017, 7, 1192. [Google Scholar] [CrossRef]
- Potente, C.; Ragnoli, A.; Tamasi, G.; Vergari, R.; Di Mascio, P. Quantitative Risk Assessment of Temporary Hazards and Maintenance Worksites in the Airport Safety Areas: A case study. Transp. Res. Procedia 2018, 35, 166–175. [Google Scholar] [CrossRef]
- Di Mascio, P.; Moretti, L. Implementation of a pavement management system for maintenance and rehabilitation of airport surfaces. Case Stud. Constr. Mater. 2019, 11, e00251. [Google Scholar] [CrossRef]
- Blumstein, A. An Analytical Investigation of Airport Capacity; Report Ho. TA-1358-G-1 Internal Research; Cornell Aeronautical Laboratory Inc.: New York, NY, USA, 1960. [Google Scholar]
- ACRP. Evaluating Airfield Capacity; Report 079; Transportation Research Board: Washington, DC, USA, 2012. [Google Scholar]
- Postorino, M.N.; Mantecchini, L.; Malandri, C.; Paganelli, F. A methodological framework to evaluate the impact of disruptions on airport turnaround operations: A case study. Case Stud. Transp. Policy 2020, 8, 429–439. [Google Scholar] [CrossRef]
- Ignaccolo, M. A simulation model for airport capacity and delay analysis. Transp. Plan. Technol. 2003, 26, 135–170. [Google Scholar] [CrossRef]
- Čokorilo, O. Human Factor Modelling for Fast-Time Simulations in Aviation. Aircr. Eng. Aerosp. Technol. 2013, 85, 389–405. [Google Scholar] [CrossRef]
- Tee, Y.Y.; Zhong, Z.W. Modelling and simulation studies of the runway capacity of Changi Airport. Aeronaut. J. 2018, 122, 1022–1037. [Google Scholar] [CrossRef]
- Di Mascio, P.; Carrara, R.; Frasacco, L.; Luciano, E.; Moretti, L.; Ponziani, A. Influence of Tower Air Traffic Controller workload and airport layout on airport capacity. J. Airpt. Manag. (accepted paper).
- FAA. Simmod Manual: How Simmod Work. 2010. Available online: http://www.tc.faa.gov/acb300/how_simmod_works.pdf (accessed on 22 August 2020).
- Airtopsoft. Airtopsoft Overview. Airtopsoft.com. Available online: http://airtopsoft.com (accessed on 22 August 2020).
- EASA ECDC COVID-19 Aviation Health Safety Protocol. Available online: https://www.easa.europa.eu/document-library/general-publications/covid-19-aviation-health-safety-protocol (accessed on 22 August 2020).
- ENAC. 2020/001- Emergenza COVID-19. Linee Guida per la Ripresa del Traffico Negli Aeroporti, a Partire Dalla “Fase 2”. Available online: https://www.enac.gov.it/ (accessed on 12 July 2020).
- Jim, H.K.; Chang, Z.Y. An airport passenger terminal simulator: A planning and design tool. Simul. Pract. Theory 1998, 6, 387–396. [Google Scholar]
- IATA. International Air Transport. Association, Airport Development Reference Manual, 9th ed.; IATA: Motreal, QC, Canada, 2004. [Google Scholar]
- IATA. International Air Transport. Association, Airport Development Reference Manual, 10th ed.; IATA: Motreal, QC, Canada, 2014. [Google Scholar]
- Lee, C.K.M.; Yaqiong, Y.N.; Yaqiong, L.; Taezoon, P. Empirical Analysis of a Self-Service Check-In Implementation in Singapore Changi Airport. Int. J. Eng. Bus. Manag. 2014, 6, 6. [Google Scholar] [CrossRef]
- Bevilacqua, M.; Ciarapica, F. Analysis of Check-in procedure using simulation: A case study. In Proceedings of the 2010 IEEE IEEM II, Macao, China, 7–10 December 2010; pp. 1621–1625. [Google Scholar] [CrossRef]
- CAST Terminal Simulation—ARC Aachen. Available online: https://arc.de/cast-terminal-simulation/ (accessed on 18 September 2020).
- Airport Simulation. Available online: https://www.flexsim.com/airport-simulation/ (accessed on 18 September 2020).
- Perboli, G.; Musso, S.; Perfetti, F.; Trapani, P. Simulation of new policies for the baggage check in the security gates of the airports: The Logiscan case study. Proc. Soc. Behav. Sci. 2014, 111, 58–67. [Google Scholar] [CrossRef][Green Version]
- Andreatta, G.; Brunetta, L.; Righi, L.; dan Jacur, G. Simulation vs. Analytical Models for The Evaluation of an Airport Landside. Comput. Sci. 2001, 67228513. Available online: http://www.aerohabitat.eu/uploads/media/25-01-2010_-_Simulation_vs_Analytical_models_-_Airport_side_Brunetta_Andreatta.pdf (accessed on 18 September 2020).
- Guizzi, G.; Murino, T.; Romano, E. A discrete event simulation to model passenger flow in the airport terminal. In Proceedings of the 11th WSEAS International Conference on Mathematical Methods and Computational Techniques in Electrical Engineering, Stevens Point, WI, USA, 28 September 2009. [Google Scholar]
- Postorino, M.N.; Mantecchini, L.; Malandri, C.; Paganelli, F. Airport Passenger Arrival Process: Estimation of Earliness Arrival Functions. Transp. Res. Proc. 2019, 37, 338–345. [Google Scholar] [CrossRef]
- Frey, M.; Kiermaier, F.; Kolisch, R. Optimizing Inbound Baggage Handling at Airports. Transp. Sci. 2017, 51, 1210–1225. [Google Scholar] [CrossRef]
- Cavada, J.P.; Cortés, C.E.; Rey, P.A. A simulation approach to modelling baggage handling systems at an international airport. Simul. Model. Pract. Theory 2017, 75, 146–164. [Google Scholar] [CrossRef]
- van Boekhold, J.; Faghri, A.; Li, M. Evaluating security screening checkpoints for domestic flights using a general microscopic simulation model. J. Transp. Secur. 2014, 7, 45–67. [Google Scholar] [CrossRef]
- Tuchen, S.; Arora, M.; Blessing, L. Airport user experience unpacked: Conceptualizing its potential in the face of COVID-19. J. Air Transp. Manag. 2020, 89, 101919. [Google Scholar] [CrossRef] [PubMed]
- AC-150-5360-13A-Airport-Terminal-Planning. Available online: https://www.faa.gov/airports/resources/advisory_circulars/index.cfm/go/document.current/documentNumber/150_5360-13 (accessed on 24 July 2020).
- ACRP. Volume 1. Research sponsored by the Federal Aviation Administration. In REPORT 25, Airport Passenger Terminal Planning and Design; Transportation Research Board: Washington, DC, USA, 2010. [Google Scholar]
- IATA. International Air Transport Association. 2015. Available online: IATA.org/service/consulting/documents/consapcsnlosiar (accessed on 3 January 2020).


Publisher’s Note: MDPI stays neutral with regard to jurisdictional claims in published maps and institutional affiliations. |
© 2020 by the authors. Licensee MDPI, Basel, Switzerland. This article is an open access article distributed under the terms and conditions of the Creative Commons Attribution (CC BY) license (http://creativecommons.org/licenses/by/4.0/).