Article

PET-Bottled Water Consumption in View of a Circular Economy: The Case Study of Salento (South Italy)

1
Laboratory of Hygiene, Department of Biological and Environmental Sciences and Technologies, University of Salento, 73100 Lecce, Italy
2
Department of Economics and Management, University of Salento, 73100 Lecce LE, Italy
3
Local Health Authority ASL Lecce, 73100 Lecce, Italy
*
Author to whom correspondence should be addressed.
Sustainability 2020, 12(19), 7988; https://doi.org/10.3390/su12197988
Submission received: 7 August 2020 / Revised: 24 September 2020 / Accepted: 25 September 2020 / Published: 27 September 2020
(This article belongs to the Special Issue Plastic Waste and Pollution)

Abstract

:
Polyethylenterephtalate (PET) is the preferred packaging material in the bottled water industry and represents the main cause of waste production. This work investigated the drinking water consumption habits, with particular reference to PET-bottled water, of people living in the province of Lecce (Apulia Region, Southern Italy) by age and geographical groups. Their perception about the quality of tap water was also explored. The survey was performed by the administration of a questionnaire to 4137 citizens. Bottled mineral water was consumed by about the 90.4% of respondents with an average consumption of 387.7 L/year per capita (375.2 L/year in PET-bottles, 12.5 L/year in glass bottles). Public supply system was used by the 61.5% of respondents with an average consumption of 169.4 L/year per capita. The consumption of tap water was negatively related to the perception of its bad quality and the residence in a big city (Lecce); while it was positively associated with the age group 16 years old. Effective communications strategies must be developed in order to promote the consumption of tap water and implement good practice of circular economy.

1. Introduction

The most common water supply systems for human consumption are tap water and bottled water. The former is distributed by aqueduct and available to consumers by tap, the latter includes the drinking water available on the market in glass or in polyethylenterephtalate (PET) bottles [1]. Lifestyle changes led to the growth of the bottled water market over the last decade, with more and more glass packaging being replaced by plastic packaging [2]. About 4% of the world’s oil and gas production is used as a raw material for plastics production and a further 3–4% is spent to provide energy for their production [3]. In addition, most of the plastic produced each year is used to produce short-life packaging that quickly becomes waste that, due to the durability of polymers, degrades slowly in the environment, accumulating and destroying natural habitats around the world. These reflections indicate how the current production and consumption of plastics is unsustainable and new strategies are needed to limit their use. Polyethylenterephtalate (PET) is the commonly used type of plastic and represents one of the main causes of waste production [4]. It is a sturdy material that is long lasting, chemically and thermally stable, and it can be easily recycled. These traits make it suitable for many uses, such as food and beverage packaging and in particular it is useful for bottled water production [5].
It is estimated that over 400 billion PET bottles are produced globally every year and the 46% of them are used as water packaging. By 2021, this production could increase by 20%, generating negative effects and contributing to the increase of plastic waste, released into the environment [6,7]. Italy is the second European country, after France, for the amount of bottled water produced and exported abroad [8]. Moreover, Italy holds the European record of bottled water consumption, with approximately 221 L/year per capita, while in 1980, was 47 L/year per capita [9]. This highlights the changes that have occurred in the last 30 years in the life habits of Italians, caused both by the introduction of polymer bottles instead of glass as well as a general perception of the better organoleptic and healthy quality associated with bottled water, compared to tap water [10]. The choice to drink bottled water creates significant environmental impacts, many of them related to the intrinsic chemical stability of PET, makes it highly resistant to environmental biodegradation. Actually, it requires very long degradation time that can last up to 500 years, producing waste accumulation in terrestrial and marine environment [11]. Moreover, the study of Gleick et al. [12], have calculated the energy-related footprint required for plastic bottled water manufacturing. Specifically, they analyzed the amount of energy consumption for the entire life cycle. At least 100 MJ Kg−1 of energy is utilized for processing virgin material into PET plastic bottle. The other following phases are needed in order to obtain the final product, such as bottling, sealing, labeling, refrigeration, and transport, that required additional energy consumption, 5.6–10.2 MJ L−1. In addition to energy costs, bottled water manufacturing also requires considerable water consumption. On average, it takes about 3 L of regular water to produce 1 L of bottled water so, in 2018, Italian consumption rates amounted to a wastage of 50 billion L of water a year [13]. Niccolucci et al. [9] calculated the water footprint for tap and bottled water in Italy, that is the volume of freshwater required, directly and indirectly, to provide final consumers with a certain volume of drinking water. Pasqualino et al. [14] instead calculated the Carbon Footprint to evaluate the gas emission concentration, caused by bottled water production.
According to plastic Europe, 355 million tons of plastic were produced in 2016, of which the 30% were used for packaging purpose. The increase of plastic consumption has resulted in a high amount of plastic littering ending up in the oceans, generating negative impacts on marine life and habitats, as it has been shown by Azzarello and Van Vleet [15], Derraik [16], Moore [17], Sazima et al. [18]. Not only ecological impacts, but also social and economic effects might be caused by marine littering (human health issue, seafood safety) [19]. In view of the negative effects generated by the production and consumption of bottled water on the environment, possible solutions for the protection of the ecosystem are needed. Increasing attention is being given to plastic pollution pressure on ecosystem by coastal areas. Despite plastic pollution being a global concern, coastal towns and countries crossed by rivers might act as hotspot of waste dispersion. A consistent literature exists at this regard. A great amount of plastic widespread in marine ecosystem, derived from coastal area, due to a mismanagement of waste, pressure of tourism and recreational activities, especially during summertime [20]. Didem Civancik-Uslu et al., [19] used an innovative indicator to demonstrate the negative impact of plastic bags on the marine environment, in terms of increasing marine littering. Other recent studies have recently identified single-use plastics, including plastic bags as one of the major contributors to marine litter, in addition to other environmental impacts [21,22]. In fact, the increasing population in coastal area, the vicinity to high urbanized centers, tourism, and marine traffic, are considered the main drivers of litter recorded in our seas. In addition, the morphology of the Mediterranean Sea, which is considered an enclosed basin, the long coastline (about 46,000 km), the presence of numerous islands, sub basin, and mesoscale surface circulation traits, can favor the storage of plastic in the sea [19,23,24]. Italy is a tourist destination for 50 billion of foreign, 60% of which are concentrated in coastal towns. The tourists increase the living population by 1/3, accompanied by an increase of waste production, which overloads the management skills of the municipality [25]. At this purpose, several policy initiatives (European, national, and local) have been introduced in order to take into account consumption and wastes management. Specifically, the European Union has suggested to increase the threshold of recycling of plastic packaging up to 55% by 2025 [26]. Furthermore, “the European Strategy for Plastics in a circular economy” aims to reach the 100% of recycled packaging by 2030, considering plastic materials among the five priority goals of actions to implement resource efficiency and reduced their dependence on natural capital. The concept of circular economy involves a production system and consumption in which biological material are replenished in the biosphere, while wastes are reduced, reused, or recycled. This strategy will play a crucial role in the resources management policies and in waste prevention. Many governs and international organizations have strongly promoted this approach, although there is still a long way to reach this goal [27,28,29]. Recycling rate of all plastic packaging, in Italy, is around 43%, confirming to be, in general, a “virtuous country”, because 58.1% of wastes are properly differentiated [30]. Moreover, separate collection of wastes varies according to North and South of Italy, in particular Puglia is below the national average (45.4%) [31]. Furthermore, the province of Lecce, compared to the other municipalities of Puglia, showed an average percentage of waste properly differentiated around 41.0%, of which plastic corresponds roughly to 13% of the total amount of waste [31].
In order to reduce the number of plastic bottles, it is necessary to take into account the main reasons which lead consumers’ choice towards bottled water supply rather than choosing public drinking water. The data from ISTAT [25] estimated that, the 29% of Italian families, about 7 billion and 500 thousand, does not drink water from public network. Although optimal quality standards are achieved, there is an increase in bottled water sales [32].
The aim of this study was to investigate the consumption of drinking water by the population living in the Province of Lecce with particular reference to the main supplies used and the factors related to the choice of supply including the consumers’ perception about the quality and safety of the water from public system. Moreover, the consumption of PET-bottled water was taken into account.

2. Materials and Methods

2.1. Study Area

The study area is part of the Salento Peninsula (Figure 1), located in the southern part of Puglia, which borders the Adriatic Sea to the east and the Ionian Sea to the south and west. It includes 97 municipalities, extends for 2799.07 km2 and has a total population of about 800,000 inhabitants.
The hydrology of the Salento peninsula is affected by its geological structure mainly composed of karst terrain, which causes the lack of surface water and a high development of underlying aquifers [33]. These comprise a shallow aquifer occupying only 35% of the territory and an extensive deep aquifer, intensively exploited in the past as a source of drinking water [34] and irrigation water [35]. The deep aquifer is supported by seawater from marine invasion which, in the last few decades, produced the increase in its salinity as a consequence of the increase in the extraction of water for irrigation purposes [36,37]. Moreover, deep aquifer is fed by waters mainly from higher layers and rains, which easily reaches it because of tectonic fractures and sandy layers [38,39]. The poor degree of filtration provided by the terrain and the increase in the spread of pollutants on the surface caused also the chemical and microbiological contamination of groundwater so as to interdict in many cases its use for drinking purposes [40,41,42,43,44,45].

2.2. Study Design

The study was part of the M.I.N.O.RE. (Non-Mandatory Regional Water Monitoring) project funded by Apulia Region in order to investigate the qualitative and quantitative state of the groundwater in Salento Peninsula and the consumption of drinking water among the people living in the study area [46].
The survey on drinking water habits was carried out by administering a questionnaire to a sample of citizens living in the Province of Lecce.
A preliminary analysis was performed in order to evaluate the internal consistency of items by the administration of the questionnaire to a restrict group (120 subjects of all ages living in the Province of Lecce). The items that resulted not clear or ambiguous were removed or reformulated. The final questionnaire, drawn up in Italian, included 16 items grouped in 4 main categories: (i) sociodemographic characteristics of the participants (gender, age, educational level, place of residence); (ii) type and daily intake of drinking water (water from public water system, including tap water without any treatment, tap water purified by domestic systems, such as purifier or water softener, and public water cooler, bottled mineral water, water from private wells); (iii) quality and safety perception of drinking water from public supply system; (iv) packaging choice (for bottled water consumers).
In order to verify any differences in relation to the age or geographical origin of the participants, the subjects were grouped into four age groups (≤16 years old, 17–39 years old, 40–64 years old, ≥65 years old) and the territory of the Province of Lecce was divided into ten areas (Campi Salentina, Casarano, Gagliano del Capo, Galatina, Gallipoli, Lecce, Maglie, Martano, Nardò, Poggiardo), corresponding to the Social Health Districts (SHD) (Figure 1).
The survey started in June 2019 and finished in February 2020. The questionnaires were administered in two ways: online, through the Google’s platform, or in paper form. In the first case the survey was promoted through social media (Instagram, Facebook), instant messaging application, and our website. Paper questionnaires were administrated in meeting places (supermarkets, church) or distributed in school prior authorization of the principal, and in case of underage participants, questionnaires were filled out by their parents. Schools were chosen on the basis of their centrality within each district.

2.3. Sampling Distribution

The survey involved 4137 citizens of the Province of Lecce, whose age and distribution per SHD were reported in the Table 1. The total population interviewed was quite evenly distributed among the first three age groups ≤16, 17–39, 40–64 (27%, 33%, and 30% respectively), while the age group ≥65 represented only the 10% of the total. The density of the respondents was similar in all districts with an exception of the district of Maglie, which showed the highest value (11.0%).

2.4. Data Analysis

At the end of the survey, questionnaires were coded and all the information was entered into a Microsoft Excell database. For descriptive statistics and graphical representations data were processed using MedCalc Software version 12.3 (MedCalc Software bvba, Ostend, Belgium). In order to verify if the qualitative and quantitative variables were different distributed among age or geographical groups Chi-square and one-way ANOVA tests were respectively used. A logistic regression analysis was performed to verify any association between the general consumption of tap water (dependent variable) and the negative perception concerning its quality, age group, educational level, house localization and residence area (independent variables); odd ratio (O.R.) and 95% confidence interval (C.I.) were calculated. Differences were considered significant for p < 0.05 . QGIS (Quantum Geographic Information System) software was used for geographical representations.

3. Results

The characteristics of respondents involved in the survey (gender, education level, and residence) were reported in Table 2. Females represented most of the respondents (60.6%), while males accounted for 39.4%. Participants’ educational level appeared quite high, since the main part of respondents had a high school diploma (55.0%), 32.7% had a university degree or higher while 10.9% had a middle school diploma. Lastly, only a small part had a primary educational level or no educational level (1.0% and 0.6% respectively). Lastly, most of the participants (85.0%) said they lived in an urban area while 15.0% lived in the countryside.
The results highlighted people’s trend towards a massive consumption of bottled water. In particular, bottled mineral water was consumed by about the 90.4% of citizens with an average consumption of 387.7 L/year per capita (375.2 L/year in PET-bottles, 12.5 L/year in glass bottles). Public supply system was used for drinking purpose by the 61.5% of respondents with an average consumption of 169.4 L/year per capita, including tap water without any treatment (25.9%), tap water purified by domestic systems (10.7%), and water from public water cooler (24.9%). Water from private wells was used by a limited part of the population (4.7%) while water from other sources (i.e., tanker) was used only by 0.5% (Figure 2). It is interesting to highlight that 41.9% of citizens living in the Province of Lecce, consumed exclusively bottled mineral water, while 7.7% used only water from public supply system, 0.7% from private wells, and 0.1% from other sources. The rest of the respondents (49.6%) said to drink water from mixed supplies.
An analysis about the bottled mineral water consumption was carried out. Considering the packaging choice, 96.7% of mineral water consumers (90.3% of total respondents) declared to buy water in PET bottles, 3.1% in glass bottles, and a limited part (0.2%) utilized both packaging.
Table 3 reports the consumption of PET-bottled mineral water by the respondents grouped per age and geographical area. Overall, in the Province of Lecce the average consumption of mineral water in PET bottles was 375.2 L/year per capita with a production of about 200 million plastic bottles per year (considering a population of about 800,000 inhabitants and an average content per bottle of 1.5 L). Significant differences (p < 0.05) appeared between age and geographical groups, with a higher average intake in age group of 17–39 (407.1 L/year) and in the district of Lecce (410.1 L/year), while the lowest values were registered in the older age group (331.2 L/year), and in the district of Poggiardo (326.6 L/year).
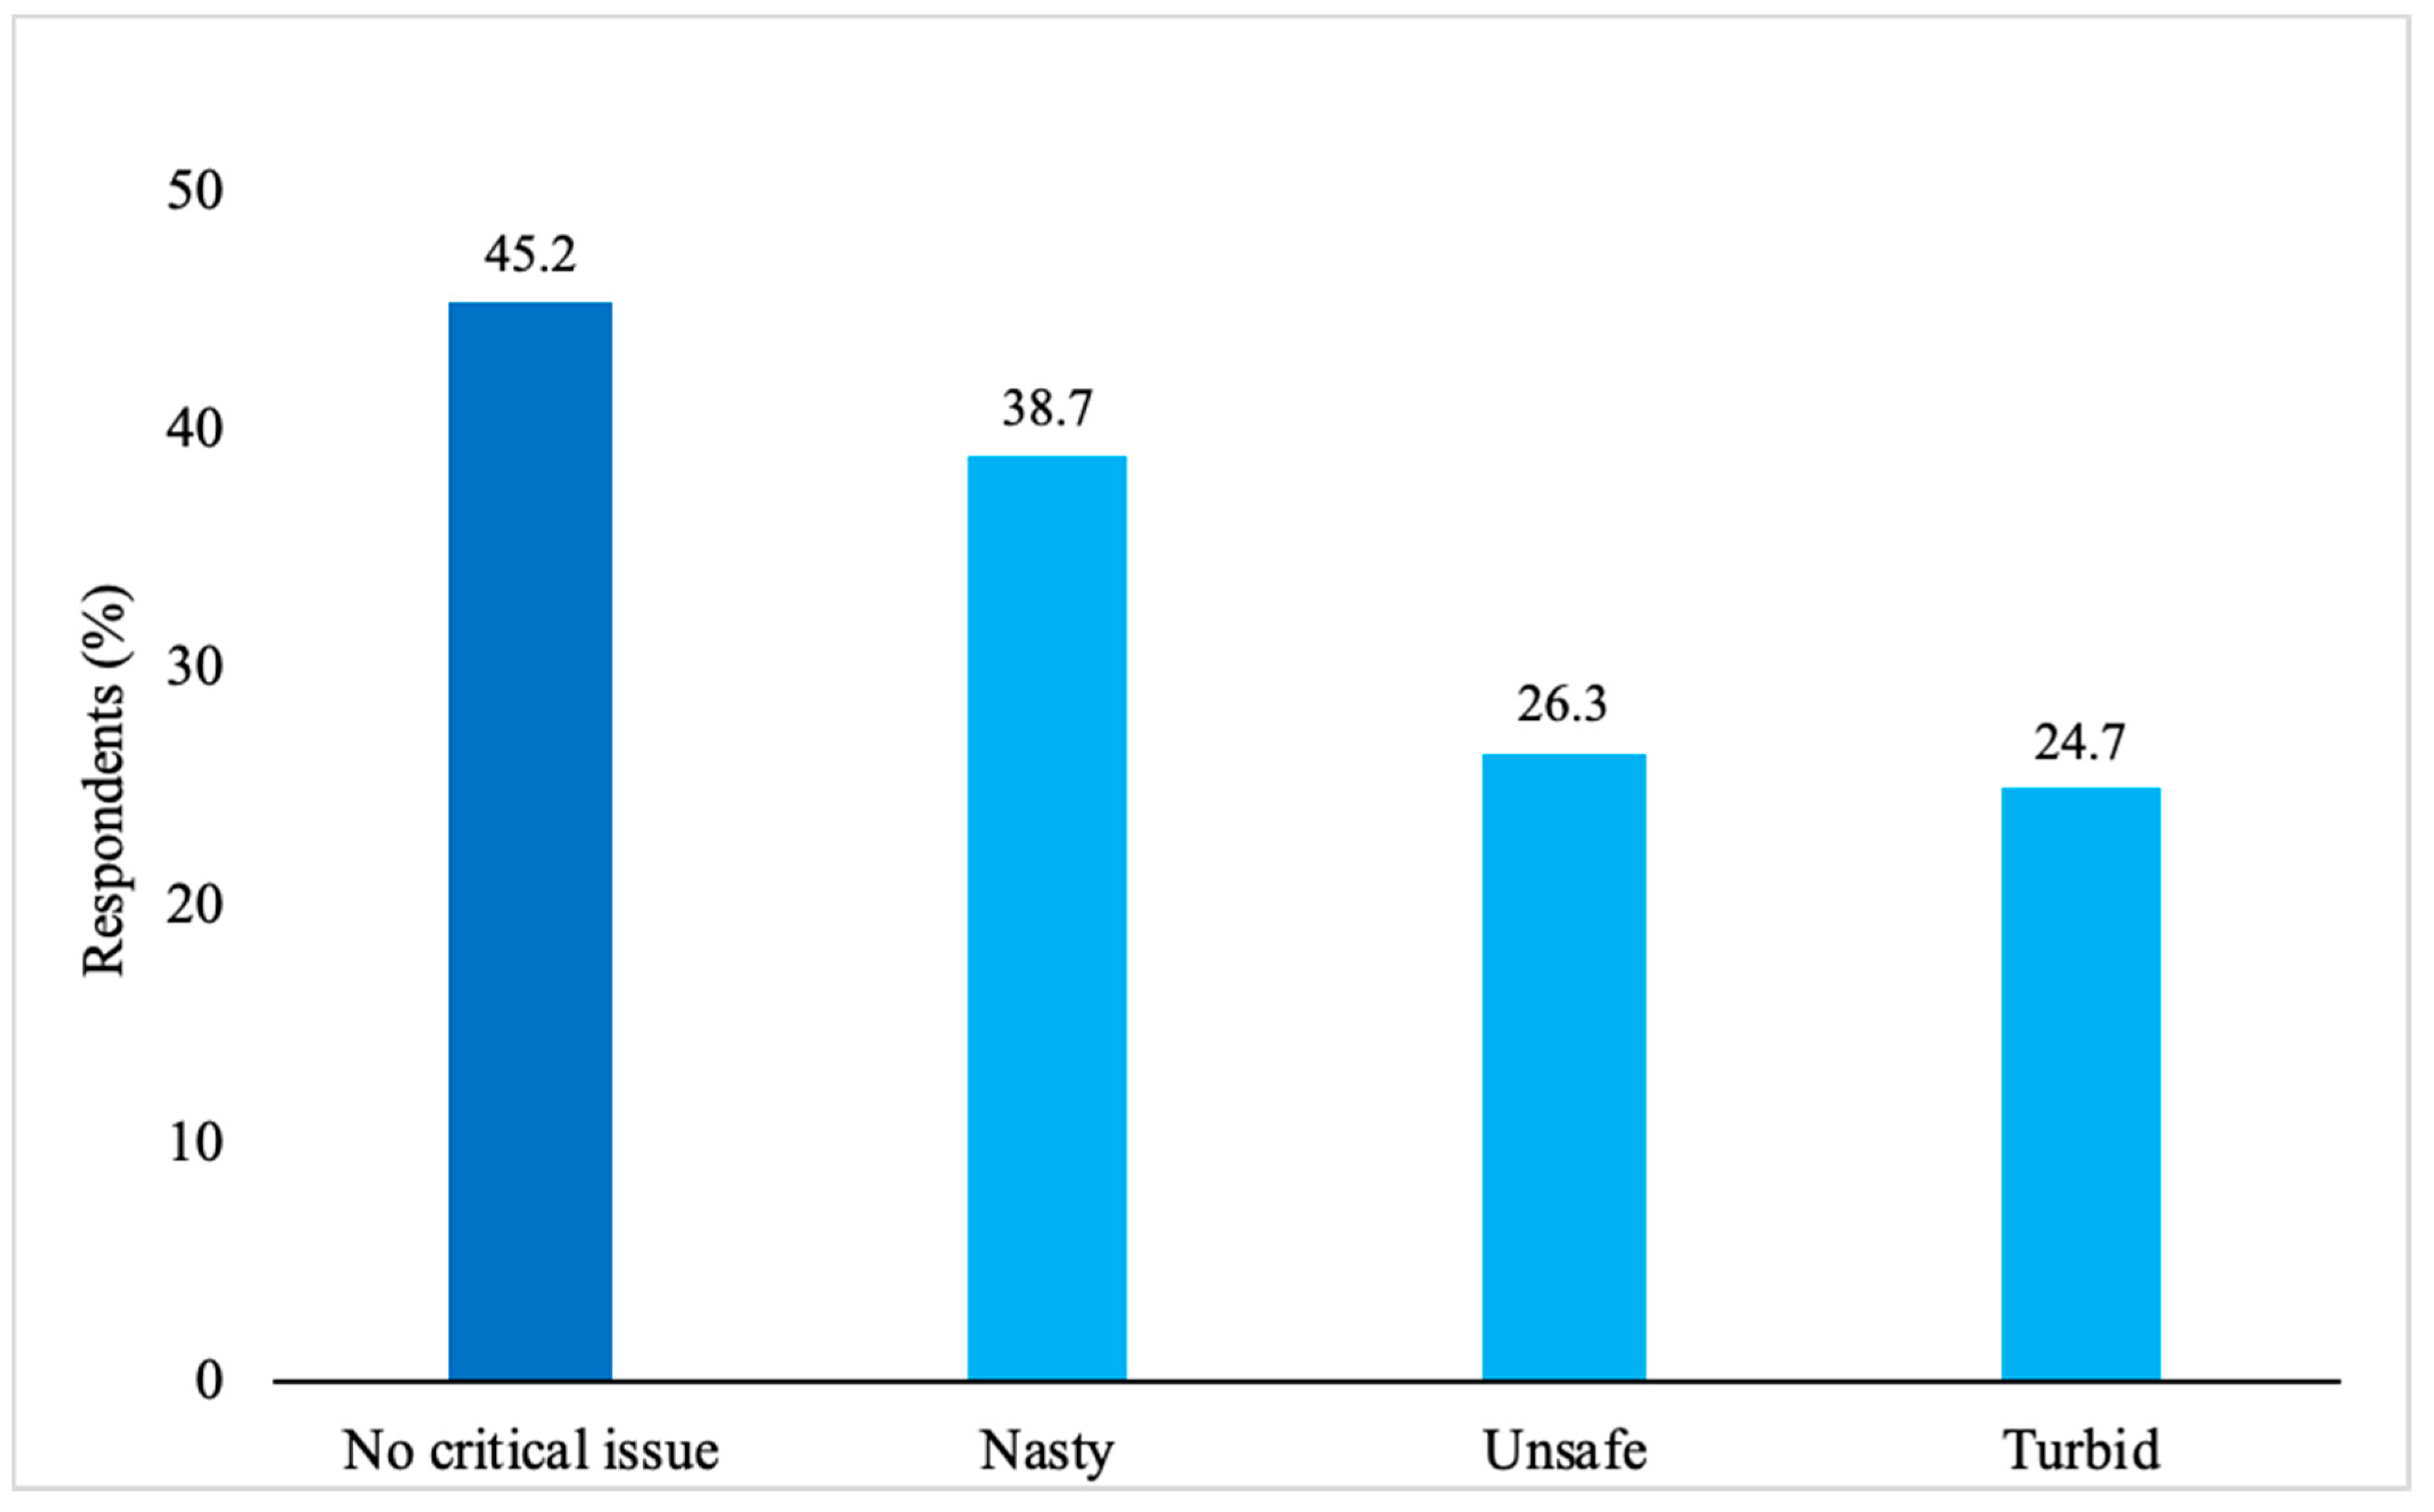
Concerning the public water supply network, 45.2% of the all respondents did not find any critical issue while 54.8% declared one or more problems: 38.7% considered tap water nasty, 26.4% unsafe, and 5.1% turbid (Figure 3).
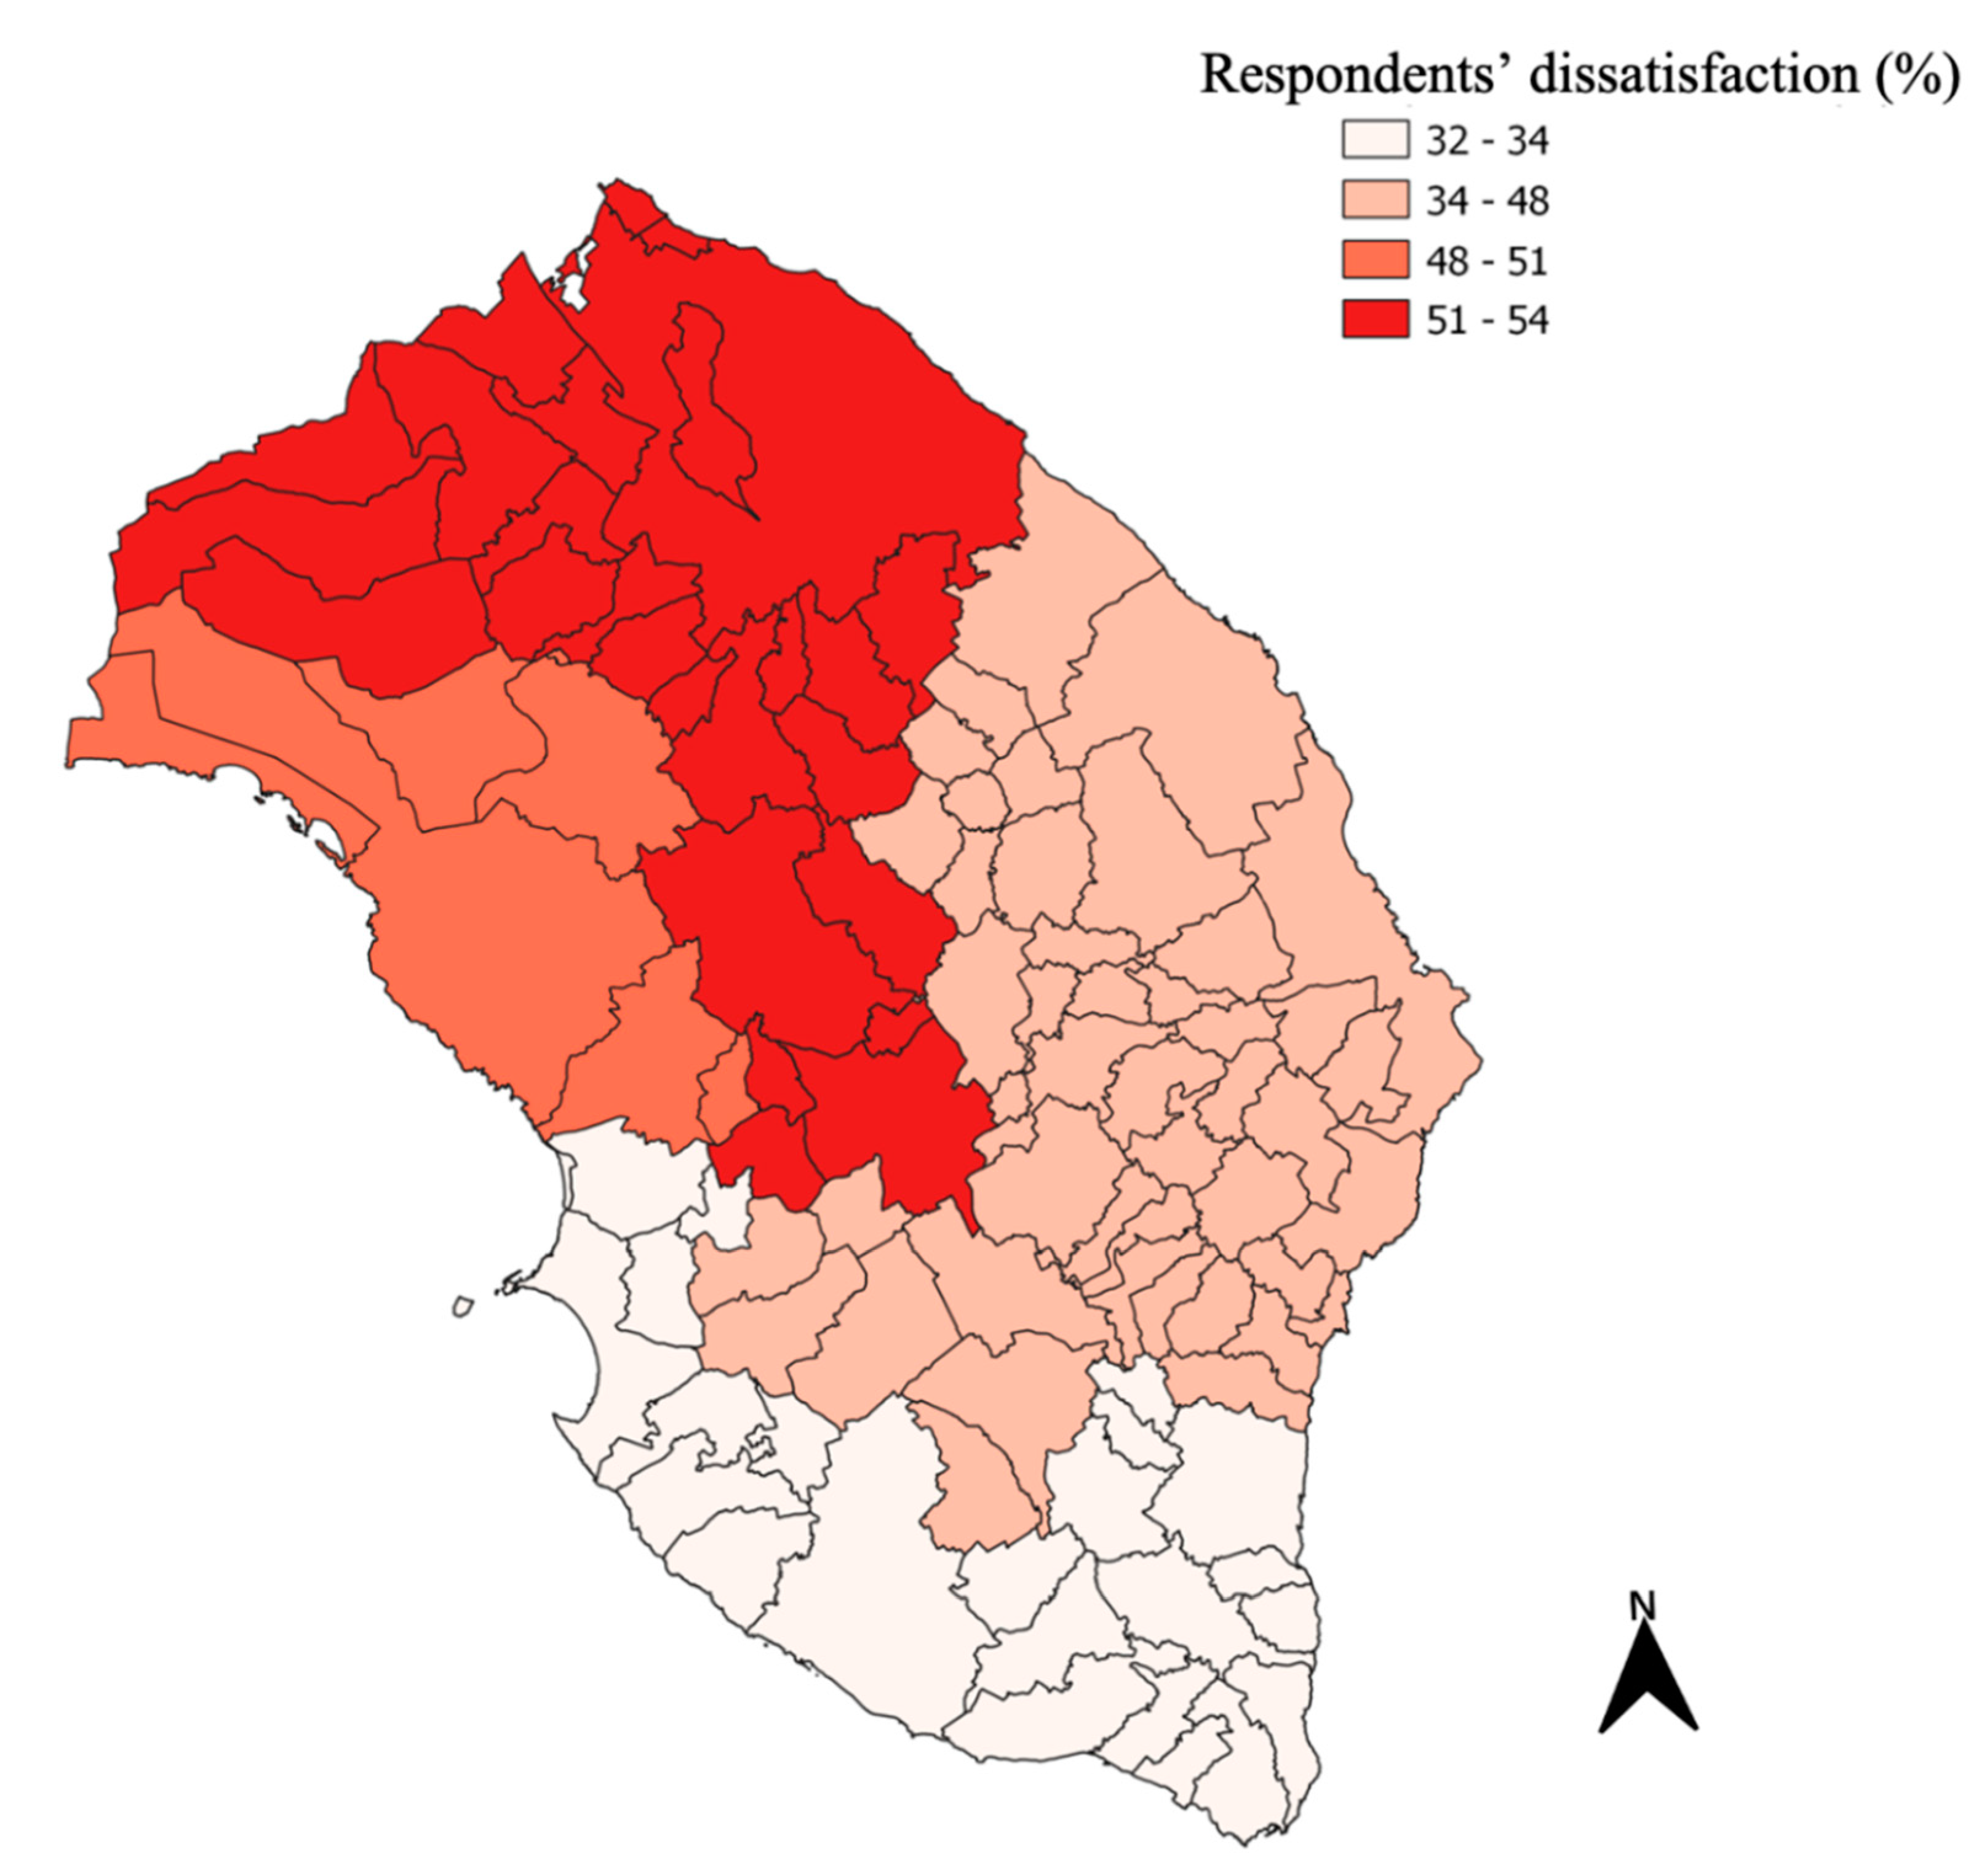
Data of drinking water perception were further evaluated on the basis of geographical division of the municipalities in their belonging health districts (SHD). The perception about the quality of public water supply was considered according to the residence of respondents (Figure 4). The prevalence of negative features (nasty, unsafe, or turbid) was not equally distributed among the different SHD (p < 0.005), with the highest level of negative perception in the SHD of Lecce (54.1%), Campi Salentina (54.0%), and Galatina (53.4%).
PET bottled water consumption, on the base of this distribution, showed a homogenous trend in the SHD: on average the 90.4% of respondents confirmed to avail of it. By contrast, drinking water by public supply has heterogeneous distribution ( p < 0.01 ) in the districts.
The choice of the drinking water typology was likely conditioned by the perception that consumers had about the quality of tap water. In particular, the logistic regression (Table 4) highlighted a negative association between the general consumption of water from the public aqueduct and the perception of its bad organoleptic characteristics or unhealthiness (O.R. 0.4077; 95% C.I. 0.2681–0.6202).
Moreover, the consumption of tap water was negatively associated with the age group 40–64 (O.R. 0.9542; 95% C.I. 0.6932–1.3134) and the SHD of Lecce (O.R. 0.6202; 95% C.I. 0.5369–0.7163); while it was positively associated with the age group 16 years old (O.R. 1.2237; 95% C.I. 10624–14095) and the SHD of Maglie (O.R. 1.474; 95% C.I.1.2285–17686), Nardò (O.R. 1.3585; 95% C.I. 1.2161–1.6387), Poggiardo (O.R. 1.6536; 95% C.I. 1.2521–1.8939). No association was identified with the educational level and house location.

4. Discussion

This survey allows for the evaluation of the consumption of drinking water by the residents in the province of Lecce, in relation to the supplies they used and the factors influencing their choice.
The data collected by the administration of a questionnaire to 4137 citizens highlighted an annual consumption of bottled water in the Province of Lecce of 387.7 L/year per capita, mostly packaged in PET bottles for a total of 375.2 L/year per capita, while the consumption of water from public supply system (including tap water without treatment, depurated tap water, and water cooler) was 169.4 L/year per capita.
Our results appeared higher if compared with those of other surveys carried out at national and international level and confirmed the general concerns regarding the lack of consumers’ faith in public aqueduct and the increase of plastic bottled water consumption. In particular, according to International Bottled Water Association (IBWA) [47], in Italy the annual per capita consumption of bottled water in 2019 was 201.8 L/year with an increase of 12.5% compared to 2014. Other Italian surveys reported an annual per capita consumption of bottled water of 206 L/year in 2015 [48] and 221 L/year in 2018 with a percentage of PET bottled water of 82% [8]. Finally, Tosun et al. [49], reviewing data from several studies, stated that Italy held the first place in Europe for bottled water consumption and the lower position for tap water consumption.
Furthermore, the growth of bottled water consumption might pose serious problems to the management of plastic wastes in the Salento peninsula also in relation to the environmental impact deriving from the close connection of the territory with the sea.
As reported by other authors, understanding why people are preferring plastic bottles is important to reduce harmful habits [50]. In addition to the well-known factors influencing the consumer’s choice in favor of PET packaging, such as its low cost and its practical use [51], in the Province of Lecce, there may be other possible explanations regarding the high consumption of PET-bottled water. First of all, the perception of the quality and safety of tap water seemed to be an important factor that influenced the choice of consumers regarding the supply of drinking water. Indeed, most of respondents consider nasty or unsafe water supplied by public network and this resulted in a lower consumption of tap water and higher consumption of PET-bottled water.
This relation between bad quality perception and consumption of tap water has been confirmed too by Tosun et al. [49], in Germany. In addition, the poor quality of groundwater available in the Salento peninsula, which feeds the local public aqueduct [37], could condition the perception of tap water safety and, consequently, the consumers’ preference for mineral bottled water. Probably, citizens are not informed about the real quality of tap water and their choice is on the basis of what they perceived as healthier.
Some geographical features also linked to sociocultural factors could influence the choice of drinking water typology. In fact, people living in bigger city as Lecce, consumed less tap water than people living in other areas of the province. This aspect should be investigated through further research in other metropolitan areas to verify whether this trend is typical of large cities.
Age could also influence the type of drinking water. The younger age group consumed tap water in greater quantities and would seem more sensitive to environmental problems probably because they were more involved in school messages regarding waste reduction, with particular reference to plastic waste.
An important concern regarding the PET-bottled water consumption is that, if not properly disposed, the plastic bottles may have a significant environmental impact, especially for the sea. This aspect is particularly relevant for the Province of Lecce, which extends for over 280 km of beaches and coastlines. Moreover, Salento peninsula has become, in the last 10 years, one of the most popular destinations, particularly for foreign tourists, which presumably involves an increase in the production of plastic waste especially close to the coast and in the summer months. At this purpose changing the global habits towards a sustainable choice, such as buying glass packaging or drinking public supply water, may be useful for the reduction of marine plastic pollution.
Consumers should be better informed about drinking water in order to make the right and informed choice between tap and bottled water. Information conveyed to citizens about the good quality of water supplied by public network should be combined with information about environmental impacts of plastic packaging especially in areas where plastic recycling is low. Providing the right information is a good strategy to induce people to adopt conscious, conscientious, and eco-friendly habits [46].
Actually, a negative impact on human health caused by the overuse of plastics bottles has been demonstrated [52,53,54]. Therefore, the awareness of the impacts produced by plastic, at human and environmental level, should bring people to adopt lifestyle choices in line with circular economy, limiting single-use plastic and promoting action to reduce, reuse, and lastly recycle the packaging.
These recommendations are included in the European Directive 2018/851 [55]. It indicates a waste management, based on an operational hierarchy, which gives top priority to prevention with respect to wastes disposal, by including all those processes aimed to reduce the amount of waste production, negative pressures on human health and the environment, and lastly toxic chemical compounds in products. In this perspective, efforts should be focused on promoting virtuous behaviors and increasing responsibility, encouraging the use of alternative supplies as well as the reusability and recyclability of packaging, rather than their production from raw material. Moreover, in order to induce a shift towards tap water, the EU commissions proposed: to improve access to water, upgrade drinking water standards, and increase the transparency of benefits of tap water [48].

5. Conclusions

Our results highlighted that:
  • the consumption of PET bottled water in Salento was very high, much higher than the Italian and European average; this situation leads to concern both for public health and the environment;
  • the perception of poor quality of tap water appeared to be decisive in the choice of consumers regarding the type of drinking water;
  • the younger age group consumed more tap water than the adult age groups;
  • in the area of the main town of the province (Lecce), a city with about 100,000 inhabitants, people consumed less tap water than in the smaller towns;
  • the cultural level of citizens did not seem to affect their choice.
These results lead us to affirm that effective communication strategies must be developed in order to promote the consumption of tap water and implement good practice of circular economy. These strategies must take into account the age of the population less sensitive to the problem, the perception regarding the quality of tap water, and the different social contexts to which they are addressed (i.e., population living in large cities or small municipalities), ensuring at the same time the best quality and safety of water supplied through public aqueduct.

Author Contributions

The following authors contributed in full to this work. I.G. and B.C. conceived the study, analyzed the sources and the literature and drafted the manuscript. F.B. and I.G. developed the framework and design methodology. P.P and F.B. contributed to data collection and analysis. F.D.L., G.D.F. and B.G. helped to draft the manuscript. T.G., P.P. and F.D.L supervised the research project and carried out a detailed revision. All the authors wrote the body of the paper, read, and approved the final manuscript. All authors have read and agreed to the published version of the manuscript.

Funding

This research was part of the M.I.N.O.RE. (Non-Mandatory Regional Water Monitoring) project funded by Apulia Region funded with Deliberation of the Regional Council August 2nd 2017, n. 1316.

Conflicts of Interest

The authors declare no conflict of interest.

References

  1. Dindarloo, K.; Ghaffari, H.R.; Kheradpisheh, Z.; Alipour, V.; Ghanbarnejad, A.; Fakhri, Y.; Goodarzi, B. Drinking water quality: Comparative study of tap water, drinking bottled water and point of use (PoU) treated water in Bandar-e-Abbas, Iran. Desalin. Water Treat. 2016, 57, 4487–4493. [Google Scholar] [CrossRef]
  2. Garfí, M.; Cadena, E.; Sanchez-Ramos, D.; Ferrer, I. Life cycle assessment of drinking water: Comparing conventional water treatment, reverse osmosis and mineral water in glass and plastic bottles. J. Clean. Prod. 2016, 137, 997–1003. [Google Scholar] [CrossRef]
  3. Hopewell, J.; Dvorak, R.; Kosior, E. Plastics Recycling: Challenges and Opportunities. Philos. Trans. R. Soc. B 2009, 364, 2115–2126. [Google Scholar] [CrossRef] [PubMed] [Green Version]
  4. Sinha, V.; Patel, M.R.; Patel, J.V. PET waste management by chemical recycling: A review. J. Polym. Environ. 2010, 18, 8–25. [Google Scholar] [CrossRef]
  5. Orset, C.; Barret, N.; Lemaire, A. How consumers of plastic water bottles are responding to environmental policies? Waste Manag. 2017, 61, 13–27. [Google Scholar] [CrossRef] [Green Version]
  6. Ballantine, P.W.; Ozanne, L.K.; Bayfield, R. Why Buy Free? Exploring Perceptions of Bottled Water Consumption and Its Environmental Consequences. Sustainability 2019, 11, 757. [Google Scholar] [CrossRef] [Green Version]
  7. Laville, S.; Taylor, M. A million bottles a minute: World’s plastic binge “as dangerous as climate change”. The Guardian, 28 June 2017. [Google Scholar]
  8. BEVERFOOD. 2019. Available online: https://www.beverfood.com/bevitaliadownload (accessed on 10 November 2019).
  9. Niccolucci, V.; Botto, S.; Rucani, B.; Nicolardi, V.; Bastianoni, S.; Caggi, C. The real water consumption behind drinking water: The case of Italy. J. Environ. Manag. 2011, 92, 2611–2618. [Google Scholar] [CrossRef]
  10. Ferrier, C. Bottled water: Understanding a social phenomenom. Ambio 2001, 3, 118–119. [Google Scholar] [CrossRef]
  11. Zheng, Y.; Yanful, E.K.; Bassi, A.S. A review of plastic waste biodegradation. Crit. Rev. Biotechnol. 2005, 25, 243–250. [Google Scholar] [CrossRef]
  12. Gleick, P.H.; Cooley, H.S. Energy implications of bottled water. Environ. Res. Lett. 2016, 4, 014009. [Google Scholar] [CrossRef]
  13. Van der Linden, S. Exploring beliefs about bottled water and intentions to reduce Consumption: The dual-effect of social norm activation and persuasive information. Environ. Behav. 2015, 47, 526–550. [Google Scholar] [CrossRef] [Green Version]
  14. Pasqualino, J.; Meneses, M.; Castells, F. The carbon footprint and energy consumption of beverage packaging selection and disposal. J. Food Engin. 2011, 103, 357–365. [Google Scholar] [CrossRef]
  15. Azzarello, M.Y.; van Vleet, E.S. Marine birds and plastic pollution. Mar. Ecol. Prog. Ser. 1987, 37, 295–303. [Google Scholar] [CrossRef]
  16. Derraik, J.G. The pollution of the marine environment by plastic debris: A review. Mar. Pollut. Bull. 2002, 44, 842–852. [Google Scholar] [CrossRef]
  17. Moore, C.J. Synthetic polymers in the marine environment: A rapidly increasing, long-term threat. Environ. Res. 2008, 108, 131–139. [Google Scholar] [CrossRef]
  18. Sazima, I.; Gadig, O.B.; Namora, R.C.; Motta, F.S. Plastic debris collars on juvenile carcharhinid sharks (Rhizoprionodonlalandii) in southwest Atlantic. Mar. Pollut. Bull. 2002, 44, 1149–1151. [Google Scholar] [CrossRef]
  19. Civancik-Uslu, D.; Puig, R.; Hauschild, M.; Fullana-i-Palmer, P. Life cycle assessment of carrier bags and development of a littering indicator. Sci. Total Environ. 2019, 685, 621–630. [Google Scholar] [CrossRef]
  20. Prevenios, M.; Zeri, C.; Tsangaris, C.; Liubartseva, S.; Fakiris, E.; Papatheodorou, G. Beach litter dynamics on Mediterranean coasts: Distinguishing sources and pathways. Mar. Pollut. Bull. 2018, 129, 448–457. [Google Scholar] [CrossRef]
  21. Steensgaard, I.M.; Syberg, K.; Rist, S.; Hartmann, N.B.; Boldrin, A.; Hansen, S.F. From macro-to microplastics-Analysis of EU regulation along the life cycle of plastic bags. Environ. Pollut. 2017, 224, 289–299. [Google Scholar] [CrossRef]
  22. Xanthos, D.; Walker, T.R. International policies to reduce plastic marine pollution from single-use plastics (plastic bags and microbeads): A review. Mar. Pollut. Bull. 2017, 118, 17–26. [Google Scholar] [CrossRef]
  23. Suaria, G.; Aliani, S. Floating debris in the Mediterranean Sea. Mar. Pollut. Bull. 2014, 86, 494–504. [Google Scholar] [CrossRef] [PubMed]
  24. Liubartseva, S.; Coppini, G.; Lecci, R.; Clementi, E. Tracking plastics in the Mediterranean: 2D Lagrangian model. Mar. Pollut. Bull. 2018, 129, 151–162. [Google Scholar] [CrossRef] [PubMed]
  25. ISTAT. Le Statistiche dell’Istat Sull’acqua Relativa Agli Anni 2015–2018; Istituto Nazionale di Statistica: Rome, Italy, 2019. [Google Scholar]
  26. European Commission. Proposal for a Directive of the European Parliament and of the Councilamending Directive 94/62/EC on Packaging and Packaging Waste; COM(2015)596; European Commission: Luxembourg, 2015. [Google Scholar]
  27. Geissdoerfer, M.; Savaget, P.; Bocken, N.M.; Hultink, E.J. The Circular Economy–A new sustainability paradigm? J. Clean. Prod. 2017, 143, 757–768. [Google Scholar] [CrossRef] [Green Version]
  28. Ghisellini, P.; Cialani, C.; Ulgiati, S. A review on circular economy: The expected transition to a balanced interplay of environmental and economic systems. J. Clean. Prod. 2016, 114, 11–32. [Google Scholar] [CrossRef]
  29. Lieder, M.; Rashid, A. Towards circular economy implementation: A comprehensive review in context of manufacturing industry. J. Clean. Prod. 2016, 115, 36–51. [Google Scholar] [CrossRef]
  30. Eurostat. How Much Plastic Packaging Waste Do We Recycle? Available online: https://ec.europa.eu/eurostat/web/products-eurostat-news/-/DDN-20191105-2 (accessed on 5 August 2020).
  31. ISPRA. Rapporto Rifiuti Urbani—Edizione 2018; Istituto Superiore per la Protezione e la Ricerca Ambientale: Rome, Italy, 2018.
  32. Doria, M.F. Bottled water versus tap water: Understanding consumers’ preferences. J. Water Health 2006, 4, 271–276. [Google Scholar] [CrossRef] [Green Version]
  33. Giudici, M.; Margiotta, S.; Mazzone, F.; Negri, S.; Vassena, C. Modelling hydrostratigraphy and groundwater flow of a fractured and karst aquifer in a Mediterranean basin (Salento peninsula, southeastern Italy). Environ. Earth Sci. 2012, 67, 1891–1907. [Google Scholar] [CrossRef]
  34. Masciopinto, C.; la Mantia, R.; Carducci, A.; Casini, B.; Calvario, A.; Jatta, E. Unsafe tap water in households supplied from groundwater in the Salento Region of Southern Italy. J. Water Health 2007, 5, 129–148. [Google Scholar] [CrossRef]
  35. Portoghese, I.; D’Agostino, D.; Giordano, R.; Scardigno, A.; Apollonio, C.; Vurro, M. An integrated modelling tool to evaluate the acceptability of irrigation constraint measures for groundwater protection. Environ. Model. Softw. 2013, 46, 90–103. [Google Scholar] [CrossRef]
  36. De Donno, A.; Prontera, L.; Galante, M.M.; Gabutti, G. Groundwater quality in the province of Lecce: Critical revision of the historical data. J. Prev. Med. Hyg. 2001, 42, 45–51. [Google Scholar]
  37. Coluccia, B.; Valente, D.; Fusco, G.; de Leo, F.; Porrini, D. Assessing agricultural eco-efficiency in Italian Regions. Ecol. Ind. 2020, 116, 106483. [Google Scholar] [CrossRef]
  38. Bagordo, F.; Migoni, D.; Grassi, T.; Serio, F.; Idolo, A.; Guido, M.; Zaccarelli, N.; Fanizzi, F.P.; de Donno, A. Using the DPSIR framework to identify factors influencing the quality of groundwater in Grecìa Salentina (Puglia, Italy). Rend. Fis. Acc. Lincei 2016, 27, 113–125. [Google Scholar] [CrossRef]
  39. Calò, G.; Gnoni, R.; Stani, M. Caratteri Idrogeologici delle Falde Superficiali della Penisola Salentina e Valutazione della Vulnerabilità degli Acquiferi; Amministrazione Provinciale di Lecce: Lecce, Italy, 1992. [Google Scholar]
  40. Bagordo, F.; Quattrocchi, M.; de Donno, A.; Signorile, G.; Liaci, D.; Gabutti, G. Chemical-physical and microbiological survey in groundwater of Salento. Annali di Igiene Medicina Preventiva e di Comunita 2003, 15, 639–647. [Google Scholar] [PubMed]
  41. De Donno, A.; Bagordo, F.; Grassi, T.; Liaci, D.; Rizzo, C.; de Rinaldis, A.; Buoncuore, F.; Gabutti, G. Hygienic risk factors in an urbanized wetland (Rauccio Park, Lecce, Italy). J. Prev. Med. Hyg. 2003, 44, 59–63. [Google Scholar]
  42. Lugoli, F.; Leopizzi, M.I.; Bagordo, F.; Grassi, T.; Guido, M.; de Donno, A. Widespread microbiological groundwater contamination in the South-eastern salento (Puglia-Italy). J. Environ. Monit. 2011, 13, 192. [Google Scholar] [CrossRef]
  43. Miglietta, P.P.; Toma, P.; Fanizzi, F.P.; de Donno, A.; Coluccia, B.; Migoni, D.; Bagordo, F.; Serio, F. A grey water footprint assessment of groundwater chemical pollution: Case study in Salento (southern Italy). Sustainability 2017, 9, 799. [Google Scholar] [CrossRef] [Green Version]
  44. De Giglio, O.; Caggiano, G.; Bagordo, F.; Barbuti, G.; Brigida, S.; Lugoli, F.; Grassi, T.; la Rosa, G.; Lucentini, L.; Uricchio, V.F.; et al. Enteric Viruses and Fecal Bacteria Indicators to Assess Groundwater Quality and Suitability for Irrigation. Int. J. Environ. Res. Public Health 2017, 14, 558. [Google Scholar] [CrossRef]
  45. Serio, F.; Miglietta, P.P.; Lamastra, L.; Ficocelli, S.; Intini, F.; de Leo, F.; de Donno, A. Groundwater nitrate contamination and agricultural land use: A grey water footprint perspective in Southern Apulia Region (Italy). Sci. Total Environ. 2018, 645, 1425–1431. [Google Scholar] [CrossRef]
  46. De Filippis, G.; Piscitelli, P.; Castorini, I.F.; Raho, A.M.; Idolo, A.; Ungaro, N.; Lacarbonara, F.; Sgaramella, E.; Laghezza, V.; Chionna, D.; et al. Water Quality Assessment: A Quali-Quantitative Method for Evaluation of Environmental Pressures Potentially Impacting on Groundwater, Developed under the M.I.N.O.Re. Project. Int. J. Environ. Res. Public Health. 2020, 17, 1835. [Google Scholar] [CrossRef] [Green Version]
  47. International Bottled Water Association IBWA. Beverage Marketing’s 2019. Available online: https://www.bottledwater.org/ (accessed on 22 September 2020).
  48. CENSIS 2018. Il Valore Sociale Rilevato del Consumo di Acque Minerali. Available online: https://www.censis.it/economia/il-valore-sociale-del-consumo-di-acque-minerali (accessed on 16 July 2020).
  49. Tosun, J.; Scherer, U.; Schaub, S.; Horn, H. Making Europe go from bottles to the tap: Political and societal attempts to induce behavioral change. Wiley Interdiscip. Rev. Water. 2020, 7, e1435. [Google Scholar] [CrossRef] [Green Version]
  50. Pacheco, M.H.S.; Kuriya, S.P.; Capobiango, C.S.C.; Pimentel, T.C.; Cruz, A.G.; Esmerino, E.A.; Freitas, M.Q. Exploration of gender differences in bottled mineral water consumption: A projective study of consumer’s perception in Brazil. J. Sens. Stud. 2018, 33, 124–134. [Google Scholar] [CrossRef]
  51. O’Donnell, C.; Rice, R. A communication approach to campus bottled water campaigns. Soc. Mark. Q. 2012, 18, 255–273. [Google Scholar] [CrossRef] [Green Version]
  52. Galloway, T.S.; Bergmann, M.; Gutow, L.; Klages, M. Marine Anthropogenic Litter; Springer Nature: Berlin/Heidelberg, Germany, 2015; pp. 343–366. [Google Scholar]
  53. Li, H.; Li, C.; An, L.; Deng, C.; Su, H.; Wang, L.; Jiang, Z.; Zhou, J.; Wang, J.; Zhang, C.; et al. Phthalate esters in bottled drinking water and their human exposure in Beijing, China. Food Additiv. Contam. 2019, 12, 1–9. [Google Scholar] [CrossRef] [PubMed]
  54. Wagner, M.; Schlüsener, M.P.; Ternes, T.A.; Oehlmann, J. Identification of putative steroid receptor antagonists in bottled water: Combining bioassays and high-resolution mass spectrometry. PLoS ONE 2013, 8, e72472. [Google Scholar] [CrossRef] [PubMed] [Green Version]
  55. EUR-Lex. Directive (EU) 2018/851 of the European Parliament. Available online: https://eur-lex.europa.eu/legal-content/EN/TXT/?uri=CELEX:32018L0851 (accessed on 14 July 2020).
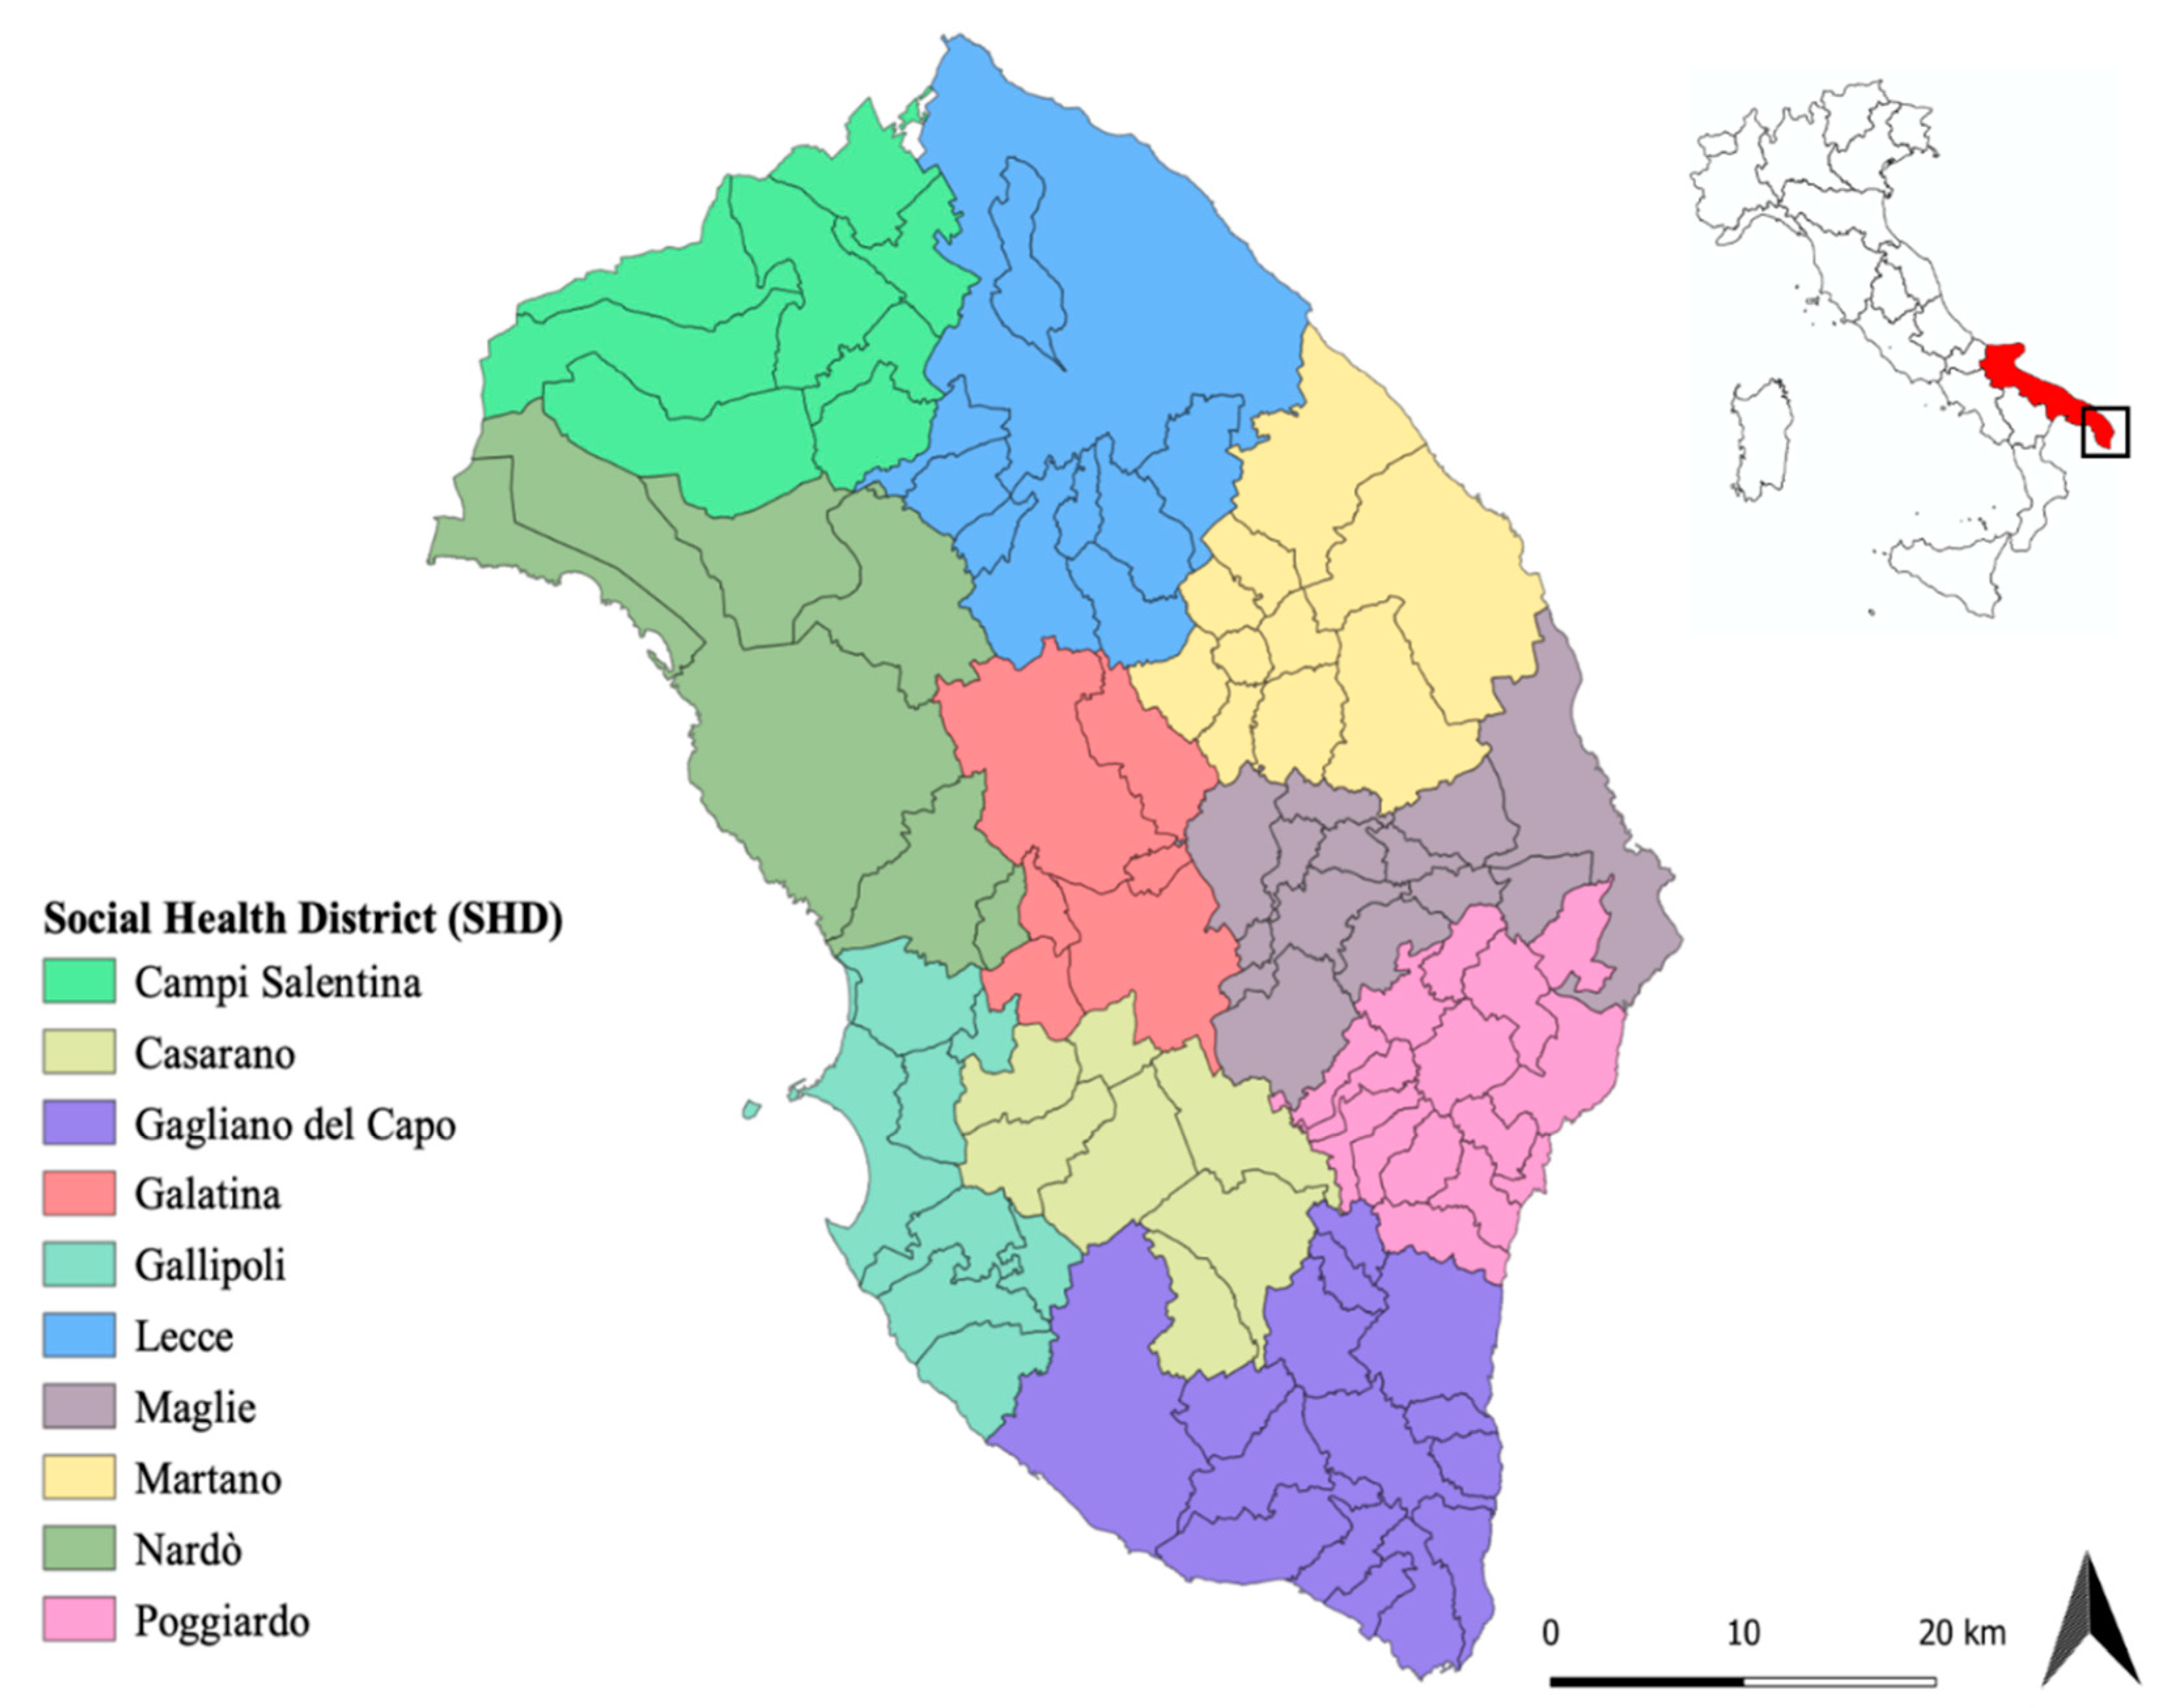
Figure 1. The study area subdivided into ten areas corresponding to the Social Health Districts (SHD) of Province of Lecce.
Sustainability 12 07988 g001
Figure 2. Main water supplies of Province of Lecce.
Sustainability 12 07988 g002
Figure 3. Consumer perception of public water supply.
Sustainability 12 07988 g003
Figure 4. Representation of respondents’ dissatisfaction (%) in Socio Health District (SHD).
Sustainability 12 07988 g004
Table 1. Sample distribution per SHD and age groups.
SHD≤1617–3940–64≥65Total
Campi Salentina6914711821355
Casarano1558910024368
Gagliano Del Capo8212011834354
Galatina45898743264
Gallipoli44717222209
Lecce328262283112985
Maglie20817516555603
Martano35846020199
Nardò10723315358551
Poggiardo37838544249
Province of Lecce1110135312414334137
Table 2. Sociodemographic feature of the sample.
RespondentsN-(%)
GenderMale1628 (39.4%)
Female2509 (60.6%)
Educational LevelNo Level25 (0.6%)
Primary School41 (1.0%)
Middle School451 (10.9%)
High School2275 (55.0%)
Higher levels1353 (32.7%)
ResidenceCountryside623 (15.0%)
Urban area3514 (85.0%)
Table 3. Bottled water consumption on average L per capita/year.
SHD≤1617–3940–64≥65Total
Campi Salentina326.1396.2380.2343.6374.1
Casarano357.0404.1395.8314.1376.1
Gagliano Del Capo340.8388.6370.0299.0362.7
Galatina356.6424.8390.3356.8390.7
Gallipoli385.0389.5369.6247.2366.7
Lecce368.4474.3414.0372.2410.1
Maglie311.3374.2363.2379.3349.9
Martano317.0397.7351.3284.2358.1
Nardò389.0389.5361.1306.5372.8
Poggiardo296.8368.3330.1266.2326.6
Province of Lecce349.6407.1378.8331.2375.2
Table 4. Simple logistic regression between water consumption from public aqueduct and quality perception, educational level, age groups, house location, and residence areas of respondents.
Independent VariablesO.R.95% C.I.p-Value
Negative Perception0.04770.2681–0.6202<0.0001
Degree1.0760.7878–1.46960.6451
Age group (years old)
  ≤161.22371.0624–1.40950.0051
  17–391.01230.8870–1.15530.8560
  40–640.81150.7094–0.92830.0023
  ≥651.02380.8358–1.25400.8204
House Location (Urban Area)0.98280.5513–1.75190.9531
Social Health Districts (SHDs)
  Campi Salentina 1.17190.9363–1.46680.1661
  Casarano0.84910.6844–1.05340.1369
  Gagliano del Capo0.82610.6635–1.02850.0876
  Galatina0.90570.7041–1.16500.4407
  Gallipoli0.91160.6882–1.20750.5188
  Lecce0.62020.5369–0.7163<0.0001
  Maglie1.4741.2285–1.7686<0.0001
  Martano1.15310.8596–1.54660.3418
  Nardò1.35841.1261–1.63870.0014
 Poggiardo1.65361.2521–1.18390.0004
O.R.: Odds ratio; C.I.: Confidence Interval.