Article

Forecasting the Utility Value of Hucul Horses by Means of Artificial Intelligence

by
Jadwiga Topczewska
1,* and
Tadeusz Kwater
2
1
College of Natural Sciences, University of Rzeszów; Zelwerowicza Street 4, 35-601 Rzeszow, Poland
2
Institute of Technical Engineering, State University of Technology and Economics in Jarosław, Czarneckiego Street 16, 37-500 Jarosław, Poland
*
Author to whom correspondence should be addressed.
Sustainability 2020, 12(19), 7989; https://doi.org/10.3390/su12197989
Submission received: 31 August 2020 / Revised: 23 September 2020 / Accepted: 24 September 2020 / Published: 27 September 2020

Abstract

:
The paper suggests the application of artificial neural networks (ANN) for the analysis of variables that significantly impact on the results of Hucul horses that participate at the National Breeding and Utility Championships for Hucul horses. The study exploits the results obtained during 2009–2015. The research material collected enabled the creation of a set of input data (for the artificial neural network), out of which independent learning and testing sets were isolated. The neural classification system in form of a multi-layered artificial neural network suggested in this paper was implemented in the programming environment Matlab, the 8.1.0.604 version. Each horse was described using features in three models. Experimental simulations were carried out separately for each model, conducting the learning and testing simulation process 10 times. In accepting the division of the evaluated group of horses into 10 classes for the analysis of the issue both the expert and network designated the classes, not without reservations due to imprecision of demarcations. The increase in class numbers would result in increased accuracy of selection (allocation to varied classes) of individuals. The average for 10 network responses which was 77% suggest an identical or a very similar horse class when compared with the expert’s value. Preliminary results of the application of artificial neural networks in predicting the utility value of Hucul horses, relying on a specific set of features seem promising.

1. Introduction

The application of artificial neural networks (ANN) has already become commonplace in modelling as well as in the optimization of several processes in technical studies [1,2]. It is also increasingly becoming a subject of interest to scientists engaged in issues concerning animal breeding and use and optimal nutrition [3,4,5,6,7,8]. This has been due, partly though, to the need to seek alternative methods with high potentials of application and offer reliable information (data) that enhances forecasting. Artificial neural networks have found their use in several fields of animal husbandry. The designing of an appropriate model that takes account of measurable and immeasurable features offers possibilities for, amongst others, forecasting the occurrence of lameness in horses [3], assessing animal behaviors while estimating their levels of welfare [9], analyzing the factors impacting on milk yield in cows [4] and goats [10], susceptibility to mastitis in cattle [6,11] as well as the risk of occurrence of complications in parturition [12], predicting the occurrence of African horse sickness [13], in genomic selection in cattle [14], and including research in the field of evolution [15]. Data analysis with the use of artificial neural networks would pave the way for precise classification and adjustments to the expected pattern, clustering, modelling, and forecasting. Their undisputed leverage over traditional methods is their ability to process, learn, and generalize information simultaneously. This offers the opportunity to exploit a variety of information, including incomplete data [16].
The Hucul horse breed has been consolidated in mountainous areas of several countries in Central Europe. Hucul horses are one of the oldest horse breeds. Reports, where many of its advantages were emphasized, date back to 1874. These primitive horses are characterized by remarkable resilience and strength, not being picky in terms of feed and feed use, high fertility, and longevity [17,18]. These features have made Hucul horses very popular, not only in mountain tourism, but also in hippotherapy, therapeutic riding, and recreation, which has significantly enhanced their maintenance in places dramatically different from their natural habitats [19,20]. Despite their increase in numbers, the population of Hucul horses is yet to attain the size considered safe for the preservation of genetic variety, this being the reason why the breed is covered by the Genetic Resources Conservation Program. One of the program’s assumptions is to assess the breeding and utility values in order to preserve the pattern of small but valiant mountain horse [21]. Moreover, measures are needed to preserve all female families as well as the male lines. Traditional methods for evaluating horse performance and breeding value are time-consuming and expensive, while covering only a fragment of the active population. Besides, the results may be impaired by errors accruing to the influence of both external and environmental factors. Such limitations call for the necessity to research alternative methods that allow the analysis of multiple variables covering several years. In order to maintain the Hucul population, it is important to monitor its utility value while taking cognizance of its genetic variety by propagating their families and lines, thus calling for the need to predict optimal choices for matchmaking. As with such little populated groups, there is an increasing level of inbreeding amongst them. The animal’s limited population is posing difficulties in estimating the breeding parameters which, in case of traditional statistical methods, is often due to the insufficiency of information regarding values of utility assessments. The need to collect data over a prolonged period, taking into account a lot of information in order to estimate the breeding value of horses has proved difficult, especially due to their low populations, as well as the varying maintenance conditions and means of assessing their performance values. Such limitations call for the necessity to research for alternative methods that allow for the analysis of multiple variables covering several years. Hence, this study that relies on artificial neural networks can become a crucially interesting tool which will allow the identification and analysis of features that significantly influence the utility values of Hucul horses and also significantly shorten the time necessary to obtain such information. The approach proposed for the manuscript is novel, as previous works using ANN on equines had focused on singular problems, for example lameness (3), colic (5), and African horse sickness (13). The use of ANN enables objective assessments of individual animals by taking into account only factors essential for determining horses’ performance and breeding values.
The paper suggests the application of artificial neural networks for the analysis of variables that significantly impacts the results of Hucul horses that participate at the National Breeding and Utility Championships for Hucul horses.

2. Materials and Methods

The study exploits the results obtained during 2009–2015 final competitions of the National Breeding and Utility Championships for Hucul horses. The program for breeding Hucul horses [21] stipulates that the test for utility value for horses aged 4 and above is for them to successfully complete the National Utility Championships, which covers assessments of the exterior (breeding championships), the Hucul path, and the test for fitness and resilience. The exterior assessment is carried out on a board in an upright position (evaluation for the type and built), while the walk and trot in a show arena (usually triangular with dimensions of 30 × 40 × 30m) with the evaluation for overall impression not being exempted. The tests are conducted anonymously by at least three independent judges. The maximum achievable score is 50 points. The path is a constituent item for assessing the character and skill in surmounting obstacles that may exist in the field. The test covers a distance of 5000m with about 30 naturally occurring or artificial obstacles. The test of endurance-condition is a trial with a rider over a distance of 15–20 km, at an optimum speed of 8–10km/h. A horse may obtain as many as 80 points for these two items for utility assessment. The final result is a sum of both the breeding and utility championships.
Contests for assessing the utility value of Hucul horses are held in the form of 7–9 eliminations to select 50 horses that qualify to participate in the final competition. The Hucul path contest was in 2009–2015 held over distances ranging from 3150 m (2010) to 5215m (2009), with the number of obstacles along the route ranging from 21 (2009) to 35 (2013). The test for fitness took place over a distance ranging from 15 km (2012) to 23 km (2011). The horses were, within 20 minutes of crossing the finishing line, subjected to veterinary examination during which their heart rate must not exceed 64 beats/minute for which they received from 1 to 3 points. Their movement (points are awarded for accurate, without reservation, irregular while lameness resulted in elimination) and average speed were also assessed.

2.1. Research Methodology

The research material collected enabled the creation of a set of input data (for the artificial neural network), out of which independent learning and testing sets were isolated. The explanatory variables were selected relying on the expert’s knowledge and indications.
Each horse was described using features in three models:
  • Model 1—with 21 explanatory variables that include sex, age, father, lineage, family, breeder, owner and the attributes being assessed during the championships.
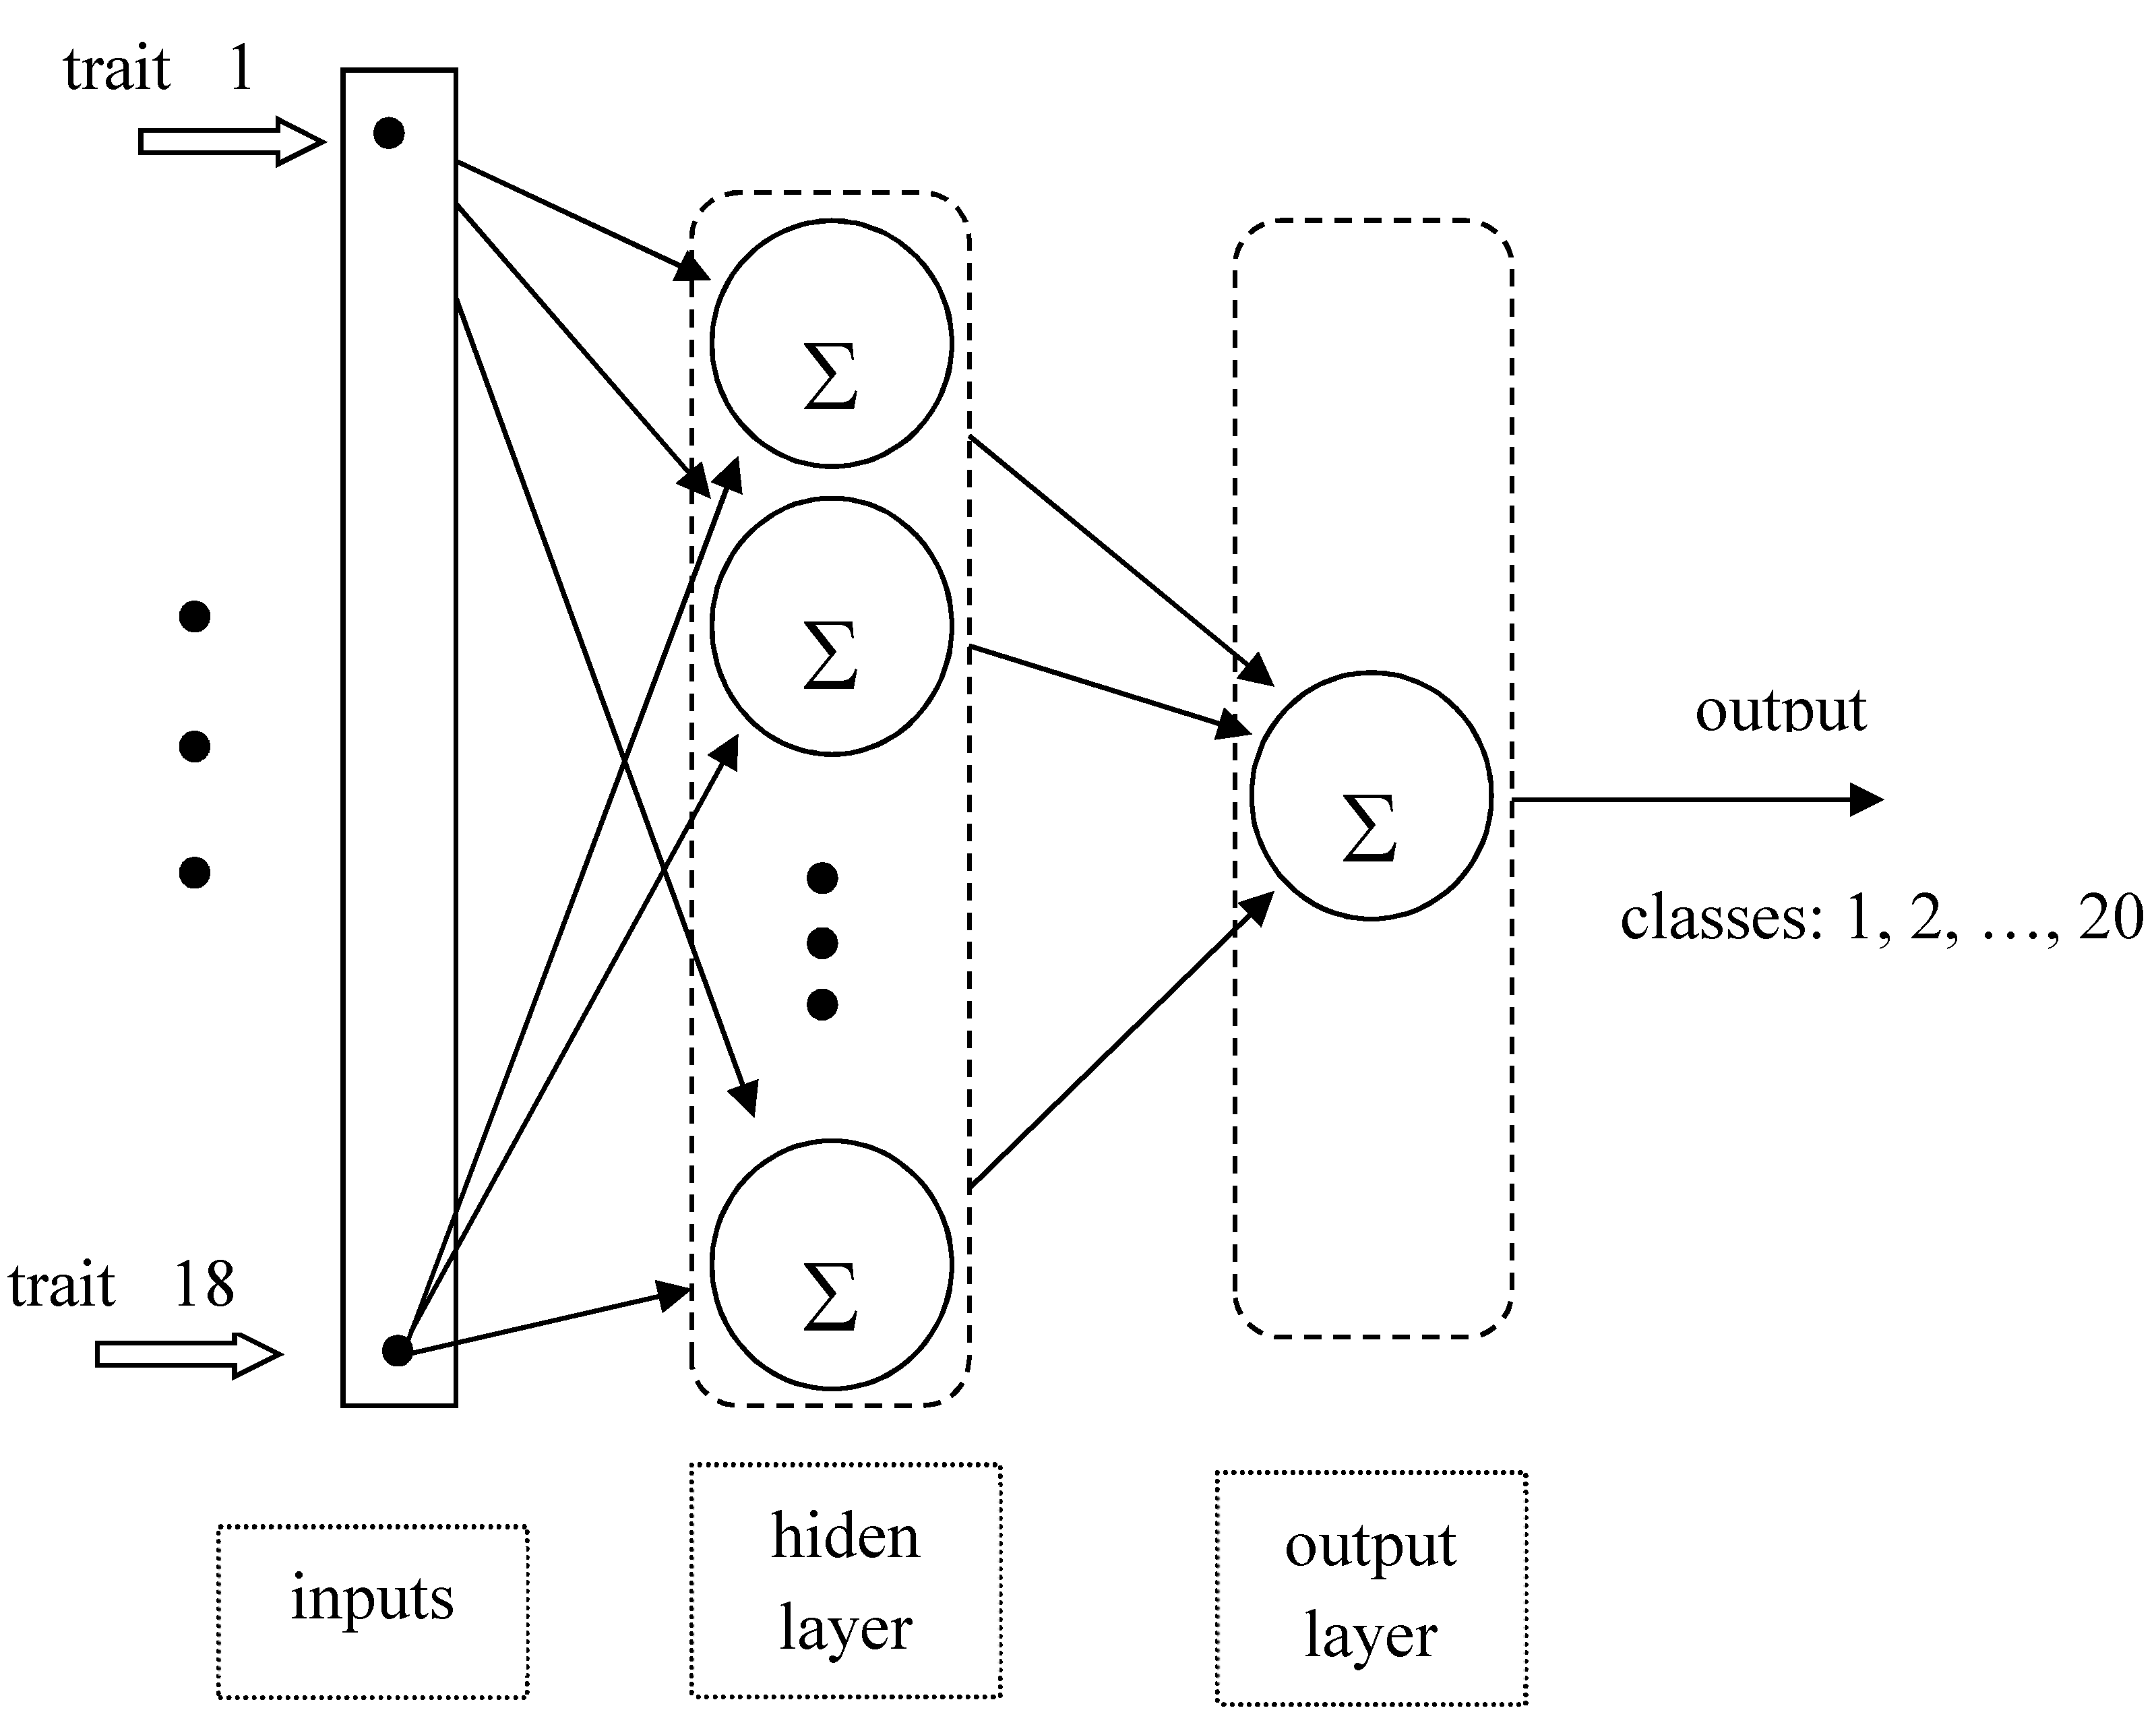
  • Model 2—with 18 explanatory variables similar to model 1 except for the breeder, forms of ownership and inbreeding coefficient.
  • Model 3—with 19 explanatory variables similar to model 2 but with information about the number of participations of the individual within the study period being included.
The sample was divided into classes based on data concerning each animal.
Model 1 consisted of 172 individuals that successfully completed all items of the championships, while models 2 and 3 were with full results including those with zero scores. There were 238 starts all together, including cases of multi participations. Horses in model 1 were classified in the range of 1 to 10 with Class 1 being for individuals that contested only once during the study period and took the 1st to 5th positions, while class 2 were with one start but occupying the 6th to 10th positions. The next classes took account of the number of starts and the fact that individuals scored relevant points in subsequent years.
For models 2 and 3 the classification was detailed, distinguishing class range from 1 (the best) to 20 (horses with weakest results). Since the utility championships covers evaluation of conformation, Hucul path and fitness test, the decision to assign a horse to a particular class depended on the scores obtained for the path and for the rally, amongst others. The first class consisted of individuals that scored a minimum of 70 points in both categories, while the 20th class consisted of those that were unable to complete any trial. The datasets analyzed during the current study are available in the University of Rzeszów database repository [22].

2.2. Configuration of the Artificial Neural Network

The design of the network is of key significance both for the learning process, and the quality of its operation in later stages. The set of input data, purpose, and results do have significant impact on the configuration. The process of learning neural networks benefitted from procedures available in MATLAB Toolbox. A key assumption for this model is taking cognizance of factual links between the set of explanatory variables (input) and the output. The neural classification system in form of a multi-layered artificial neural network suggested in this paper was implemented in the programming environment Matlab, the 8.1.0.604 version. The choice of MATLAB was dictated by the fact that it is a useful tool focused mainly on scientific and technical calculations. It boasts of a wide spectrum of software solutions/libraries, the so-called Toolboxes that can be used, for example to create and optimize neural networks. It is fully compatible with other programming environments.
The key factor for defining the ANN structure was the network’s ability to generalize, as provided by measures of the VCdim. (Vapnika-Chervonenkisa dimension), which is defined as the population of a set of learning data that can be flawlessly retrieved in all possible configurations for a given network topology. There is no straight-forward relationship between the framework of a multi-layered network and the measure of VCdim. in existence, although publications [23] do provide estimations of its limits using the following formula:
[K/2]NVCdimNw(1+log(Nn))
where [ ]—part of the overall number, N—number of network inputs (dimensions of the input vector), K—number of neurons in the hidden layer, Nw—the total number of network connections (which corresponds to the number of weights), Nn—the total number of neurons in the network.
The lower limit of the range corresponds, approximately, to the number of weights that connect the input layer with the hidden layer, while the upper limit is greater than twice the total number of weights in the network. Adopted estimates of the measure, on their own, enable the evaluation of the suitability of a set of data for a given network topology. Estimated values of the VC dimension are indications of the size of the learning set, which ensures a good generalization ability of the network [23,24]. This is no less than 10 times the value of the indicator.
For issues (objects) characterized by small numbers and non-linearity of the data set, a network topology dominated by the number of neurons in the hidden layer (not less than the number of total network connections) is acceptable and is described using the formula:
K = N M ,
where: M, N represent number of inputs and outputs, respectively. (K= 4.69 in the current study)
In practice, the number of hidden neurons is depicted as K or less, based on the highest quality network [25,26].
The size of the input vector for the network is equally a significant issue. Any reduction of the spatial dimensionality of the data leads to a simplification of the network’s framework, thus replacing the original set of variables with a new one gives fewer input variables. This results in, amongst others, increased learning speed, less required population of data sets and in a higher capacity of generalization, with size of the data set remaining unchanged. Having taken consideration of the ability of the network to function appropriately, the number of the learning samples (population/size of learning set) and size of the output signal of the network, we adopted for the structure (3 ANN for 3 models) input numbers 21, 18, 19 and some neurons in the hidden layer (from 2 to 5 in the current study), while for the output layer 1 neuron that generates values identifying them with a class from 1 to 10 or 20, respectively, was adopted. The ANN structure (framework) for model 2 is illustrated in Figure 1.
The neural network that was finally adopted for the simulation study was characterized, in the hidden layer, by the tangential transfer function (TANSIG Hyperbolic tangent sigmoid transfer function) and a linear function (PURELIN Linear transfer function) in its output layer. The learning process was achieved using the Levenberg-Marquardt (LM) method, which is the standard proposed for Matlab (where MATLAB Neural Network Toolbox is used to learn the parameters in the network) [27]. Moreover, the learning process was achieved with the stipulated accuracy through the adoption of conditions at end of learning, described as the sum squared error performance (SSE). Using the established network quality and a chosen distribution of weights as the start of learning as the threshold an algorithm was thus designed for the classification [16,28].
In circumstances where the learning network (for a given number of periods) ends with unsatisfactory quality a re-drawing of weights and learning follows suite. The choice of a favorable case/instance was made following comparisons of the SSE results. An unfavorable distribution of weights necessitated a repeated drawing of weights. The ANN algorithm ensured an effective attainment of the desired quality [16].

3. Results

The process of learning neural networks was conducted several times to eliminate the impact of random initial weights selection. A simple data validation was used by changing the sizes of the learning and testing sets. Experimental simulations were carried out separately for each model, conducting the learning and testing simulation process 10 times. Figure 2 illustrates average network responses (*), and expert suggestions (o) for the first model. The highest disparity between the expert and network’s classifications occurred in the 6th variant of data which reached about six classes. With regards the cases studied, the network assigned half of the cases to either a better or worse class than the expert showed. The maximum error designated as the difference between the network response and the expert’s prediction (Y-Z) was 5.246, whilst the minimum was 2.2467. In accepting the division of the evaluated group of horses into 10 classes for the analysis of the issue both the expert and network designated the classes, not without reservations due to imprecision of demarcations. Simultaneously, a large number of explanatory variables may be a hindrance in the selection of the most important variables that determine the final classification of horses. On the other hand, the large number of explanatory variables will call for the need for more classes. The responses of the neural network obtained with the limitations of model 1 ought to be treated as indicators for experts to introduce corrections to the classification of Hucul horses. This approach is in a way in support for artificial neural networks being used in decision making processes. The ability of a network to generalize on a validation sample enables the early selection of the optimal data model.
Going by the results for models 2 and 3 any increase in class numbers would result in increased accuracy of selection (allocation to varied classes) of individuals (Figure 3 and Figure 4). For a network with 18 features and 20 classes (Figure 3), the maximum positive error defined as the difference between the averages of 10 studies and the expert’s indications (Y-Z) was 1.468 (for the 9th individual), while the maximum negative error was 2.8472 (for the 4th case). The classification indicated by the network was very similar to the expert’s in six instances, while the responses were consistent in two. Greater consistency of response between the network and expert were obtained in comparison to model 1. The results obtained in model 2 with 18 explanatory variables (Figure 3) demonstrated that parameters such as ownership type and breeder, as well as levels of the inbreeding coefficient, were of little significance in the classification of Hucul horses. Model 3 takes account of the number of starts by horses, using codes to represent values directly resulting from their participation. The research results were, in this case, comparable to those from model 2 (Figure 4). The maximum positive error of 2.1759 occurred in the 9th individual, while the maximum negative value of 3.1587 was in respect of the 4th individual. The results obtained from comparing models 2 and 3 showed, however, that the additional variable concerning the number of starts of each horse was not significant for the artificial classification network. The results obtained indicated a slight increase in differences between the expert’s indications and the forecast obtained using the ANN only for the 4th and 9th individual. The indication by the expert, in this case, of an additional explanatory variable in the form of numbers of starts by each individual, hence the acquired experience, turned out to be of less significance for artificial neural network in horse classification.

4. Discussion

ANN, according to several authors [3,4,5,6,7,8,9,11,12,13,14,15], is a promising tool in analyzing and predicting lots of complex issues that exist in animal studies. As indicated by Fernández et al. [10], its advantage over traditional analytical methods is due to its accuracy of estimation as well as its ability to generalize even when less significant data is entered. An incredible aspect is the fact that artificial neural networks enable the capture of relationships and dependencies between the data in circumstances where the application of traditional analytical methods would not have yielded satisfactory solutions.
The basic difficulty in horse breeding is the consolidation and/or improvement of the functional features while maintaining the desired breed model. For this goal to be achieved, it is necessary to make the right choice of selection method although this can be an issue with scanty populations. The Hucul horse is a valuable race for its several unique features, although their number is rather very limited. Besides, only a small group is entered for the eliminiations and subsequently for the national championships. The number, according to data provided by Polish Horse Breeders Association [21], of older mares listed in the main register for Hucul horses in 2009 was 1172 individuals and 1361 in 2015, but only 8% of them made it to the finals of the championship. The situation was somewhat better in respect of the stallions (19%). This fact constitutes real limitation in obtaining detailed information that is relevant to both breeders and users. Complete information about the utility value, on the contrary, constitutes an indispensible tool in taking decisions concerning breeding and are crucial components of breeding success.
The arbitrary adoption of the number of classes in the current studies is a conventional assumption solely for the optimization of the functioning of artificial neural networks as an advisory system. Ten classes were suggested for the first model in the analysis conducted, but the output information obtained show that the proposed classification that relied on results obtained by Hucul horses was rather too general. The class difference between that given by the expert and the average of 10 network responses was too high and lacked repeatability (Figure 2).
A major contributory factor for the proper functioning of artificial neural networks is its learning, but not just its structure. For the learning process to be optimal, it is necessary to precisely define the expected responses to input signals. Hence the number of classes was increased in model 2 to reflect the championship results for horses increased to 20. In total, 18 features were considered in the analysis. The results obtained are very promising and could serve as start off points for early prognosis of future utility values of Hucul horses, relying on a specific set of features. The average for 10 network responses which was 77% suggest an identical or a very similar horse class when compared with the expert’s value. The maximum error occurred only in one instance for just two classes (Figure 3). Gorgulu et al. [4], while forecasting the milk yield of cattle using varied methods, obtained greater compatibility of responses using artificial neural networks than when standard statistical methods were applied. Nadimi et al. [9], in using artificial neural networks in testing animal behaviours in respect of their welfare levels posted only about 14% of wrong answers.
The input data were, in model 3, supplemented with additional information concerning the number of starts of each animal over the period covered by the analysis. The network configuration, in comparison with model 2, differed only by one size of the input vector, while retaining the 20 classes (Figure 4). With the application of 20 classes (expected data) and 19 features (output data) the maximum difference between responses of the artificial neural networks and the expert’s evaluation was 2 classes, namely in 2 instances, with the other responses being similar without exceeding 1 class. It is significant to note that the greatest difference observed in both trial models concerned the same instance. This probably indicates the high sensitivity of artificial neural networks to individual differences in certain features. It should be expected that the observed differences could also arise from a more objective evaluation and precise results of the network as against the expert’s rating. The high compatibility of responses by the artificial neural network with the expected assumptions at the preliminary stage of the study point to the factual possibilities of its practical application. This fact also drew the attention of Schobesberger and Peham [3], who obtained a 78.6% compatibility while estimating the occurrence of lameness amongst trotters. The high level of compatibility obtained in the current studies is an indication of the propriety of choice of both the input model and the network structure. The high sensitivity of ANN to the information contained in the model was also confirmed in studies by Panchal et al. [11]. The ANN model designed with the mentioned studies was applied in cattle classification and to predict the occurrence of mastitis, relying on the parameters of milk quality being evaluated.

5. Conclusions

The three models tested differed in their numbers of explanatory variables as well as the number of proposed classes for the classification of Hucul horses. It has been demonstrated that the best results in the form of compliance between the expert’s indication and the neural network were obtained for 18 explanatory variables and 20 classes. Such explanatory variables as sex, age, and genealogy turned out to be significant, while the breeder, ownership type, level of inbreeding coefficient, as well as the number of horse starts were less significant.
Preliminary results of the application of artificial neural networks in predicting the utility value of Hucul horses, relying on a specific set of features seem rather promising. It thus offers potential possibilities of evaluation, relying on available information, and a larger group of horses rather than individual horses partaking in utility championships. The results obtained can also serve as a good tool in search of individual animals for optimal matchmaking.

Author Contributions

Conceptualization: J.T. and T.K.; Methodology: J.T. and T.K.; Software: T.K.; Validation: J.T. and T.K. Formal Analysis: J.T. and T.K.; Investigation: J.T. and T.K.; Resources: J.T. and T.K.; Data Curation: J.T. and T.K.; Writing—Original Draft Preparation, J.T.; Writing—Review and Editing, J.T.; Visualization: J.T. and T.K. Supervision: J.T. and T.K.; Project Administration: not applicable; Funding Acquisition: not applicable. All authors have read and agreed to the published version of the manuscript.

Funding

This research received no external funding.

Conflicts of Interest

The authors declare no conflict of interest.

References

  1. Becker, T.; Enders, T.; Delgado, A. Dynamic neural networks as a tool for the online optimization of industrial fermentation. Bioproc. Biosyst. Eng. 2002, 24, 347–354. [Google Scholar] [CrossRef]
  2. Torrecilla, J.S.; Aragon, J.M.; Palancar, M. Optimization of an artificial neural network by selecting the training function. Application to olive oils mills waste. Ind. Eng. Chem. Res. 2008, 47, 7072–7080. [Google Scholar] [CrossRef]
  3. Schobesberger, H.; Peham, C. Computerized Detection of Supporting Forelimb Lameness in the Horse Using an Artificial Neural Network. Vet. J. 2002, 163, 77–84. [Google Scholar] [CrossRef]
  4. Gorgulu, O. Prediction of 305-day milk yield in Brown Swiss cattle using artificial neural networks. S. Afr. J. Sci. 2012, 42, 280–287. [Google Scholar] [CrossRef]
  5. Fraiwan, M.A.; Abutarbushb, S.M. Using Artificial Intelligence to Predict Survivability Likelihood and Need for Surgery in Horses Presented With Acute Abdomen (Colic). J. Equine Vet. Sci. 2020, 90, 102973. [Google Scholar] [CrossRef]
  6. Hyde, R.M.; Down, P.M.; Bradley, A.J.; Breen, J.E.; Hudson, C.; Leach, K.A.; Green, M.J. Automated prediction of mastitis infection patterns in dairy herds using machine learning. Sci. Rep. 2020, 10, 4289. [Google Scholar] [CrossRef] [Green Version]
  7. Shanhinfar, S.; Page, D.; Guenther, J.; Cabrera, V.; Fricke, P.; Weigel, K. Prediction of insemination outcomes in Holstein dairy cattle using alternative machine learning algorithms. J. Dairy Sci. 2014, 97, 731–742. [Google Scholar] [CrossRef] [Green Version]
  8. Saxena, P.; Parasher, Y. Application of Artificial Neural Network (ANN) for Animal Diet Formulation Modeling. Proc. Comput. Sci. 2019, 152, 261–266. [Google Scholar] [CrossRef]
  9. Nadimi, E.S.; Jørgensen, R.N.; Blanes-Vidal, V.; Christensen, S. Monitoring and classifying animal behavior using ZigBee-based mobile ad hoc wireless sensor networks and artificial neural networks. Comput. Electron. Agric. 2012, 82, 44–54. [Google Scholar] [CrossRef]
  10. Fernández, C.; Soria, E.; Martín, J.D.; Serrano, A.J. Neural networks for animal science applications: Two case studies. Expert. Syst. Appl. 2006, 31, 444–450. [Google Scholar] [CrossRef]
  11. Panchal, I.; Sawhney, I.K.; Sharma, A.K.; Dang, A.K. Classification of healthy and mastitis Murrah buffaloes by application of neural network models using yield and milk quality parameters. Comput. Electron. Agric. 2016, 127, 242–248. [Google Scholar] [CrossRef]
  12. Zaborski, D.; Grzesiak, W. Detection of difficult calvings in dairy cows using neural classifier. Arch. Tierz. 2011, 54, 477–489. [Google Scholar] [CrossRef] [Green Version]
  13. Eksteen, S.; Breetzke, G.D. Predicting the abundance of African horse sickness vectors in South Africa using GIS and artificial neural networks. S. Afr. J. Sci. 2011, 107, 20–28. [Google Scholar] [CrossRef] [Green Version]
  14. Ehret, A.; Hochstuhl, D.; Gianola, D.; Thaller, G. Application of neural networks with back-propagation to genome-enabled prediction of complex traits in Holstein-Friesian and German Fleckvieh cattle. Genet. Sel. Evol. 2015, 47, 22. [Google Scholar] [CrossRef] [PubMed] [Green Version]
  15. Kasperski, A.; Kasperska, R. A new approach to the automatic identification of organism evolution using neural networks. BioSystems 2016, 142–143, 32–42. [Google Scholar] [CrossRef]
  16. Castillo, E.; Guijarro-Berdiñas, B.; Fontenla-Romero, O.; Alonso-Betanzos, A. A Very Fast Learning Method for Neural Networks Based on Sensivity Analysis. J. Mach. Learn. Res. 2006, 7, 1159–1182. [Google Scholar]
  17. Purzyc, H. A general characteristic of Hucul horses. Acta Sci. Pol. Med. Vet. 2007, 6, 25–31. [Google Scholar]
  18. Topczewska, J.; Krupa, W. Impact of maintenance systems on the Hucul mares reproductive rates. Arch. Tierz. 2016, 56, 246–254. [Google Scholar] [CrossRef] [Green Version]
  19. Fornal, A.; Radko, A.; Piestrzyńska-Kajtoch, A. Genetic polimorphism of Hucul horses population based on 17 microsatellite loci. Acta Biochim. Pol. 2013, 60, 761–765. [Google Scholar] [CrossRef] [Green Version]
  20. Topczewska, J.; Krupa, W. Effect of some factors on championship results and performance in Hucul horses. Ann. Anim. Sci. 2018, 18, 209–224. [Google Scholar] [CrossRef] [Green Version]
  21. Hucul Horse Breeding Program; PZHK-Polish Horse Breeders Association: Warsaw, Poland, 2014.
  22. Topczewska, J. A Set of Source Data of Hucul Horses. University of Rzeszów Database Repository, 2020. Available online: http://repozytorium.ur.edu.pl/handle/item/5698 (accessed on 27 September 2020).
  23. Hush, D.; Horne, B. Progress in supervised neural networks. IEEE Signal. Process. Mag. 1993, 10, 8–39. [Google Scholar] [CrossRef]
  24. Vapnik, V. The Nature of Statistical Learning Theory; (Information Science and Statistics); Springer: Berlin/Heidelberg, Germany, 2000; ISBN 978-0-387-98780-4. [Google Scholar]
  25. Madsen, K.; Nielsen, H.B.; Tingleff, O. Methods for Non-Linear Least Squares Problems, 2nd ed.; Technical University of Denmark: Lyngby, Denmark, 2004. [Google Scholar]
  26. Larochelle, H.; Bengio, Y.; Louradour, J.; Lamblin, P. Exploring Strategies for Training Deep Neural Networks. J. Mach. Learn. Res. 2009, 1, 1–40. [Google Scholar]
  27. Demuth, H.; Beale, M. Neural Networks Toolbox; For Use with MATLAB; MathWorks. Inc.: Natick, MA, USA, 2002. [Google Scholar]
  28. Duch, W.; Korbicz, J.; Rutkowski, L.; Tadeusiewicz, R. Neural Networks, Biocybernetics and Biomedical Engineering; 6 Academic Publishing House EXIT: Warsaw, Poland, 2000. (In Polish) [Google Scholar]
Figure 1. The artificial neural networks (ANN) structure.
Sustainability 12 07989 g001
Figure 2. Network results 21-2-1 and 10 classes.
Sustainability 12 07989 g002
Figure 3. Network results 18-2-1 and 20 classes.
Sustainability 12 07989 g003
Figure 4. Network results 19-2-1 and 20 classes.
Sustainability 12 07989 g004

