1. Introduction
“Most of the people in the world are poor, so if we knew the economics of being poor, we would know much of the economics that really matters. (Schultz, 1980)”.
Poverty alleviation is considered one of the developing and developed countries’ most important development priorities. Advancement in achieving this objective may be what policymakers, especially in developing countries, have so desperately needed in recent decades to achieve by fostering economic growth, implementing reform policies, or combining both. However, the poverty rates have varied considerably across countries, depending on the actual success of their economic growth, which leads to sustainable development [
1,
2,
3,
4]. The efforts of international institutions and public authorities on sustainable development can also support the process of reducing poverty and increasing the wellbeing of the population. Given the complexity of the phenomenon and its implications, the tools to achieve these objectives are various and require long-term actions [
5,
6,
7,
8,
9,
10,
11,
12,
13]. Reducing poverty is not just linked to the economic conditions; it is an integrated process also including environmental, social, ethical, legal and other issues depending on the international sphere. For instance, the policymakers may sometimes find that there is a trade-off between environmental conditions and poverty reduction. Poverty reduction also may lead to environmental destruction—higher living conditions need more resources. Because of the frequent overlapping of the abovementioned issues, the process of poverty reduction becomes a challenge in itself. Given this complexity, and the existence of different trade-offs, the authors support the idea that a country ensuring sustainable development can easily construct the right balances and get the best policy outputs regarding poverty reduction and other conditions.
Studying poverty has been difficult since there is no fixed measure for it. While the World Bank is the main source to observe how the poverty level changes in each country, it has also set the international minimum poverty line. This poverty line was revised in 2015, where a person is considered to be poor if they earn under USD 1.90/day [
14]. This calculation of poverty is focused mostly on the economic worth of the expenditure by a person. On the other hand, measurements of income are only used in countries where there are no effective metrics for consumption. However, this value seems to be too low to define whether someone is categorized as poor in all countries of the world. As the world grows wealthier and poverty is more concentrated, the World Bank has proposed two higher values of the poverty line, that of USD 3.20/day for lower-income countries and USD 5.50/day for upper-middle-income countries [
15]. Hence, since this study considers EU and WB countries, which have been classified as upper-middle-income countries, the authors decided to consider USD 5.50/day as the poverty line.
Income inequality and economic growth for years has been seen as the major contributor to poverty [
16,
17,
18,
19,
20,
21], and higher initial inequality tends to diminish positive growth, and reduced growth impacts on absolute poverty. Moreover, it is now widely agreed that economic growth alone is not a sufficient condition for achieving the poverty alleviation goal successfully [
22]. Understandably, economic development brings lower poverty rates, since without economic progress we would not have an increase in the average income, thus increasing the poverty rate through time. Nonetheless, this development is not the sole necessity. The occurrence of poverty is determined by income distribution as well. The greater the share of any growth that the poor capture, the quicker the poverty alleviation rate will be [
23].
Furthermore, regarding the problem with slow economic development, high inequality presented and eventually high poverty rates, Wilkinson, and Pickett [
24] observed, in 2010, that this uneven income distribution has had a direct impact on people’s lives. This inequality has led to poor governance in societies, the living conditions are worsened, and homicide rates are increased. Moreover, health, education and the quality of life seem to worsen in these unequal societies.
Poverty is influenced by many economic and social factors of a country and has been a hot issue regarding finding solutions to eradicate it. From income inequality to price indexes and changes in investment opportunities, it is difficult to pinpoint the exact reason what causes it and how to at least bring the levels down. However, the main objective of this paper is to analyze the relationship between poverty at USD 5.50, income inequality, economic growth, governance, investment environment, education, and lastly, unemployment in both the European Union and Western Balkans. Furthermore, we also want to observe whether these factors significantly impact the dependent variable, namely poverty. The last aim is to see if there is a time trend between the key variables, which are poverty, income inequality, and economic growth, in order to complete the comparison between European Union and Western Balkan countries.
The research questions of this paper are:
As mentioned above, two economic regions will be taken into consideration regarding the analysis of this paper. The Western Balkan countries included will be Albania, Bosnia and Herzegovina, Montenegro, North Macedonia and Serbia. Due to sovereignty issues in Kosovo and the lack of data, despite the fact that it lies in the Western Balkan region, the authors will not consider it. Meanwhile, the EU countries involved in this analysis are Austria, Belgium, Bulgaria, Croatia, Cyprus, Czech Republic, Denmark, Estonia, Finland, France, Germany, Greece, Hungary, Ireland, Italy, Latvia, Lithuania, Luxembourg, Malta, Netherlands, Poland, Portugal, Romania, Slovakia, Slovenia, Spain, Sweden. The time period that is considered is from 2009 to 2018 due to the fact that data before these years are difficult to find, especially for the Western Balkan countries. The authors are working with unbalanced panel data and the method used is panel estimated generalized least square.
The
Section 2 consists of the literature review, where different related studies done in the past are presented. The
Section 3 of this paper refers to the data and methodology presentation, while the
Section 4 gives detailed information on the primary factors such as poverty, income inequality and economic growth, accompanied by the trend of secondary factors such as education, and governance, unemployment, and investment environment. There we also present a graphic representation of the above variables for the Western Balkans and the EU countries, in order to observe the difference between the two economic regions. Then, the
Section 5 contains the analysis and discussion, where the authors discuss where these two regions differ and where they share the same trends. Lastly, the
Section 6 is the conclusion, where there is a brief summary of all the things discussed previously.
2. Materials and Methods
Poverty reduction has been an important topic of study throughout the years. Reducing poverty has been one of the main goals of sustainable development ever since it was created. Poverty occurs both in developing countries and in developed countries. While poverty in developing countries is much more widespread, both types of countries are adopting poverty reduction measures. While there are many factors contributing to poverty, this literature review will focus on economic growth, income inequality, unemployment, education, investment, governance and economic quality.
2.1. Economic Growth
The key finding from the last half of century of study and policy development is that economic growth is the most efficient way to lift a country out of poverty and achieve their broader aspirations for a better life. Adams’s [
25] findings from cross-country studies show that a 10% increase in a country’s income will reduce the poverty rate by between 20 and 30%. Furthermore, Fosu [
26], in his study from 2015 focusing on Sub-Saharan countries, concluded that economic growth played an essential part in reducing poverty, and that income inequality also has a direct relationship with poverty. On the other hand, Majid [
27] suggested in 2003 that while both national income and inequality affect poverty as explained thus far, the role of national income in tackling poverty is decreasing, and inequality is growing over the development cycle. Changes in GDP have caused changes in poverty up until now, but increases in inequality can only impact poverty in middle-income countries by contrast. Based on new data sets created for the study of the impact of economic growth on poverty, there does not appear to be a clear relationship between these two. While it remains a positive relationship, the study suggests that economic growth aids developing countries [
28].
Fields conducted in 2000, a study on African economic growth and the dynamics of poverty, inequality and economic wellbeing [
29]. The author stated that new patterns of growth are needed to adapt well in the new century and in order to prevent more inequalities in the world economy. Furthermore, the author also deducted that there are no cases in which the effect of growth is offset by inequality. Thus, economic growth is indeed a factor that reduces poverty.
Moreover, Braithwaite and Mont, in a study of developing countries such as Mozambique, found in 2009 that swift growth happening in a short period of time was associated with poverty reduction [
30]. From 1996 to 2002, the economy increased by 62% and the poverty ratio declined from 69% to 54%.
Other economists suggest that economic growth does not reduce poverty. Jackson [
31] found in 2017 that economic growth is a myth and questionable as an impact on eradicating growth. Growth alone does not appear to be a sufficient situation to decrease poverty. Iniguez-Montiel [
32] in his paper published in 2011 discussed the role of growth, income inequality and poverty in the case of Mexico during the period of 1992–2008. The findings indicate that during the period of 2000–2006, economic growth was highly valuable when considering poverty reduction. However, after 2006, he noticed the trend reversing. With high inequality and decreasing per-capita income, the poverty rate rose to pre-2002 levels.
2.2. Income Inequality
Ncube, Anyanwu and Hausken [
33], in their study from 2013, on inequality, growth and poverty in the Middle East and North Africa (MENA), showed that income inequality reduces economic growth and increases poverty in the region. A similar positive relationship was supported by [
34] in the case of Pakistan between 1993 and 2008, showing that inequality plays a significant role in increasing the poverty rate.
Small changes in the distribution of wealth can have a huge impact on the headcount of national income poverty [
35]. As demonstrated by evidence from Cote d’Ivoire and Bangladesh [
36], shifts in income distribution have an even greater impact on indicators of the extent and severity of deprivation.
Kakwani, in 2003, and Son, in 2007, [
37,
38] suggested that inequality elasticity will always be positive, because a decline in inequality will minimize poverty. As argued by Ravallion [
39], high initial inequality remains, because poverty would become more indifferent to growth at a high level of inequality.
2.3. Education
Balamurali, Janflone and Zhu, in 2015, [
40] conducted a study on the American market. Their regression results indicated that there is indeed a positive correlation between education and the income to poverty ratio. An increase in education indicated a 15.5% increase in income to poverty ratio.
Sumarto and De Silva, in 2015, [
41] analyzed the impact of health and education resources on Indonesian economic development and poverty. They noted that while education plays an important role in reducing poverty, schooling has a limited impact on economic growth for developing countries.
Furthermore, Janjua and Kamal, [
42] in 2011, tried to find out why the population are living in poverty across the globe, with primary focus on the impact of education on poverty. The paper indicates that a better education leads to better farming methods, thus in higher incomes and eventually reducing the probability of living in poverty. Additionally, the studies concluded that high per capita income growth is a moderate factor in reducing poverty, a decline in income inequality has played a greater role only in countries with higher per capita incomes and, last but not least, secondary education has played a major role in eradicating poverty. Moreover, Van der Berg [
43] stated, in 2008, that there are 3 instruments in which education impacts poverty:
Higher levels of education promote higher earnings.
Better quality of education has a positive impact on economic growth thus increases economic prospects.
Higher levels of education indicate better social benefits and decreasing poverty, resulting in better healthcare.
2.4. Governance
Aloui, in 2019 [
44], attempted to explore the relationship between governance and poverty in Sub-Saharan Africa. The author studied this connection from 1996 to 2016 in a regression model where poverty is the dependent variable. His studies concluded that governance shows both positive and negative impacts on poverty reduction. This finding suggests that factors of governance play a major role in poverty, and the primary function of effectiveness of government. The relationship between governance and poverty alleviation varies by developmental level.
On the other hand, a study conducted by Kwon and Kim [
45] that included 98 countries examined the policy that ‘good governance’ leads to poverty reduction. This correlation was analyzed through the use of an empirical panel-data calculation using Worldwide Governance Indicators. The empirical evidence does not support the claim that good governance leads to a decrease in poverty. Good governance only alleviates poverty in middle-income, not the least developed, countries.
Furthermore, a study performed by Khan [
10] stated that the dominant market-enhancing governance ideology aims to improve market efficiency through changes to ‘good governance’, supposedly to cause or maintain growth. However, there are limitations to it. Neither the theory nor evidence clearly supports the plausibility of enhancing distributive results for the poor across the pro-poor parts of the agenda for good governance.
2.5. Unemployment
Martínez, Ayala and Ruiz-Huerta’s [
46] research examined the contribution of unemployment in the different OECD countries to income inequality and deprivation. Those relationships were examined using micro-data from the Luxembourg Income Analysis. They find that a sub-group study confirms the minimal effect of unemployment on earnings distribution in most of the countries considered. It does seem evident, though, that the unemployed are among those with the highest risk of poverty.
A study presented by Mardiyana and Ani [
47] defended the case that unemployment has a significant positive effect on poverty. The data collection form used was the analysis in 2011–2016 of documents obtained from East Java’s BPS (Badan Pusat Statistik) in East Java. Their findings conclude that both education and unemployment effect poverty by 96.6%, while the remaining 3.4% is affected by other factors that are not present in their analysis.
Siyan, Adegoriola and Adolphus [
48] used the VAR model between three variables: unemployment, poverty level and inflation rate. The result show that inflation and poverty are bi-causal in nature. Unemployment rate and poverty are related to two-way causality. There is one-way causality between the rate of unemployment and that of inflation.
2.6. Investment Environment
While investment is thought to improve a country’s economy, Anderson, De Renzio and Levy’s [
49] findings suggest that the link between investment and poverty reduction is not proven. While there is more indication that public capital is competitive in the sense that it supports private investment and other development factors, there is a strong need to be cautious about selecting the optimum level of expenditure and distribution across sectors. Hemmer and Nguyen [
50] also concluded, in 2002, that investment, especially in foreign direct investment (FDI), does not do much for the poor because foreign employers prefer to hire qualified workers who are likely to be non-poor. FDI may outstrip local small businesses, making local workers poor or poorer. Furthermore, a study in Latin America done by Quiñonez, Sáenz and Solórzano [
51] found that foreign direct investment flows towards Latin America have grown dramatically over the last decades. Yet there is no consensus on whether or not the pattern has actually benefited the country. Specifically, empirical evidence is scarce and uncertain about the anticipated positive impact of foreign direct investment on poverty reduction. The authors conducted a panel data analysis with 13 economies from 2000 to 2014. While FDI was not a contributor to the reduction in the economy, macroeconomic stability, infrastructure, human capital development and financial development are significantly related with poverty reduction.
On the other hand, Klein, Aaron and Hadjimichael [
52] said that FDI remains one of the most important factors of poverty reduction. According with Bevan, Estrin and Meyer, some of the FDI’s positive contributions to poverty alleviation are achieved through spillover effects, job creation and increased investment capital [
53]. In addition to spillover ties, foreign direct investment provides the developing nation with many advantages. Several of the advantages are a spike in investment capital needed for economic growth and opportunities for employment. The impact of FDI on host country poverty is not a clear relationship but is determined by a variety of factors [
52].
However, in a study done by Gohou and Soumaré, in 2012 [
54], on the relationship between FDI and welfare in Africa, they affirmed the positive and strongly important relationship between net inflows of FDI and poverty reduction in Africa but considered major variations between African regions. They also noted that the effect of FDI on welfare in developing countries is greater than that of developed countries. However, in West Africa, the relationship has been found to be ambiguous.
All of the factors described above are key indicators that will explain the relationship of them with poverty rate and if they are significant or not. Meanwhile, this study will give a deeper analysis of the relationship of the poverty rate with income inequality, economic growth and other economic factors related to governance and investment. Additionally, this study will offer some comparison data on WB and EU cases.
The novelty of this work is that there are not many studies done when comparing the European Union and Western Balkans, especially on poverty and economic development. Furthermore, while many have discussed the perfect trio of poverty, income and economic growth, the authors intend to further continue researching the effect of education, governance, unemployment, investment environment and economic quality on poverty, especially in the Western Balkans case.
Based on the literature review, our hypotheses are presented below:
Hypothesis 1. Education has a significant negative impact on poverty rate on both EU and WB.
Hypothesis 2. Economic growth has a significant negative impact on poverty rate on both EU and WB.
Hypothesis 3. Income inequality has a significant positive impact on poverty rate on both EU and WB.
Hypothesis 4. Unemployment has a significant positive impact on poverty rate on both EU and WB.
Hypothesis 5. Governance has a significant negative impact on poverty rate on both EU and WB.
Hypothesis 6. Investment environment has a significant negative impact on poverty rate on both EU and WB.
3. Data and Methodology
The purpose of this study is to compare the difference between two different economic levels, such as the EU and WB, regarding poverty rate levels and the factors that contribute to them. In order to conduct this study, secondary data were collected. The authors took the data from World Bank and Legatum Prosperity for the period between 2009 and 2018. The primary variables will be the poverty rate at $5.50, which will also serve as the dependent variable, GDP per capita, Gini coefficient serving as a proxy for income inequality, unemployment, governance, education and investment environment. A summary of the data chosen for the analysis is provided below.
GDP per capita is a measure of a country’s economic output that accounts for its number of people. It divides the country’s gross domestic product by its total population. That makes it a good measurement of a country’s standard of living. It is expressed in dollars.
The Education Index is a calculation of the average number of years of education received by people of ages 25 and older in their lifetime based on education attainment levels of the population converted into years of schooling based on theoretical duration of each level of education attended.
Gini coefficient measures the extent to which the distribution of income (or, in some cases, consumption expenditure) among individuals or households within an economy deviates from a perfectly equal distribution [
55].
Governance measures the extent to which there are checks and restraints on power and whether governments operate effectively and without corruption.
Investment Environment measures the extent to which investments are adequately protected and are readily accessible.
To further explain the variables, more information is summarized in
Table 1 as below.
Unemployment rate is the proportion of unemployed labor force, expressed as a percentage.
In order to find out the impact of income inequality and economic growth on the Western Balkan and EU poverty rate, the multiple regression analysis was used to find out the regression equation and to derive conclusions on the effects that the chosen independent variables have on the dependent variable. After we performed the needed adjustments to run the regressions and to derive conclusions, we ended up with a sample of 254 observations for the European Union and 32 observations for the Western Balkan area.
In order to have more accurate results, GDP per capita was expressed in logarithm form. Similarly, taking the logarithmic form of variables helps to straighten out exponential trends of growth and removes heteroscedasticity. Before running the regression, the stationary of data will be checked using the unit root test. The usual method of estimation for the regression model is the panel generalized least square method, which can be considered as the benchmark for analyzing panel data; hence, in our work, the PGLS estimators are used to analyze the impact of income inequality and economic growth on the European Union and Western Balkans’ poverty rate at $5.50.
The multiple regression equation can be presented as follows:
The regression equation is based on different authors that have analyzed the relationship between poverty, income inequality and economic growth, including [
29], who researched the impact these factors have on each other in the case of the African economy.
Furthermore, Majid, in the study from 2003 [
27], also incorporated GDP per capita as well in order to better analyze the income inequality distribution. Unemployment has also been one major factor considered when considering poverty induction, such as the book published by OECD in 2008 [
56]. However, the authors also wanted to introduce something new to the plethora of research done on poverty by including education, governance, investment environment, and living conditions as part of economic wellbeing.
Table 2 shows the detailed explanations per each variable used in the regression model.
There are two methods used to measure the above regression equation for the panel data: fixed model effect (FE) and random effect (RE). The Hausman check was performed to distinguish between models described above. The Hausman test indicates further acceptance of the random effect, and if this test hypothesis (Hausman test) is accepted or rejected can be deduced according to its findings. In order to make sure that our results will not be biased, and that our model is appropriate, we will provide the correlation matrix, and will be using the White-Cross section in order to eliminate both heteroskedasticity and serial correlation.
4. Empirical Results
4.1. Descriptive Statistics
This section of the work will focus more on the descriptive analysis of poverty, income inequality and economic growth of both EU and WB countries. The authors will compare and observe whether there appears to be a correlation between the three factors. For the European Union, we have considered all 27 countries involved and for the Western Balkan area, we have included 5 countries (Albania, Bosnia and Hercegovina, Montenegro, North Macedonia, and Serbia).
From
Figure 1, the poverty rate pattern does not appear to be consistent throughout the years, especially in the case of the Western Balkan countries. In the case of the EU, Romania has the highest rate of poverty with 15.6%, and on the other hand, many countries with a high GDP showed low levels of poverty at USD 5.50. From the data, we can also observe that the countries with the most volatility are countries where a deep economic recession is felt, such as Greece and Italy. Meanwhile, for countries such as Bulgaria, Croatia and Romania, one factor contributing to this rate may be the low GDP per capita and their proximity with the Balkan region. Another factor contributing to the high levels of poverty rate is the unemployment rate. In Greece, the unemployment rate goes up to 19% in 2018, and in Italy, the rate is approximately 11%. In the EU, the average unemployment rate for 2018 was 7.3% according to the World Bank. Moreover, the education index in these countries is also lower than more developed countries such as Germany, France or the Nordic countries.
4.1.1. Poverty Rate at $5.50
On the other hand, regarding the poverty rate in the Western Balkan countries between 2009 and 2018, we notice that the poverty rate has increased a lot from previous years, with the biggest increase in 2012 with a poverty rate of 28.85%. The country with the highest rate is Albania, with a rate of 38% on average. One reason why this high number is seen in the case of Albania may be due to political turmoil, low education index and high unemployment rate when compared with the other Western Balkan countries.
4.1.2. Economic Development
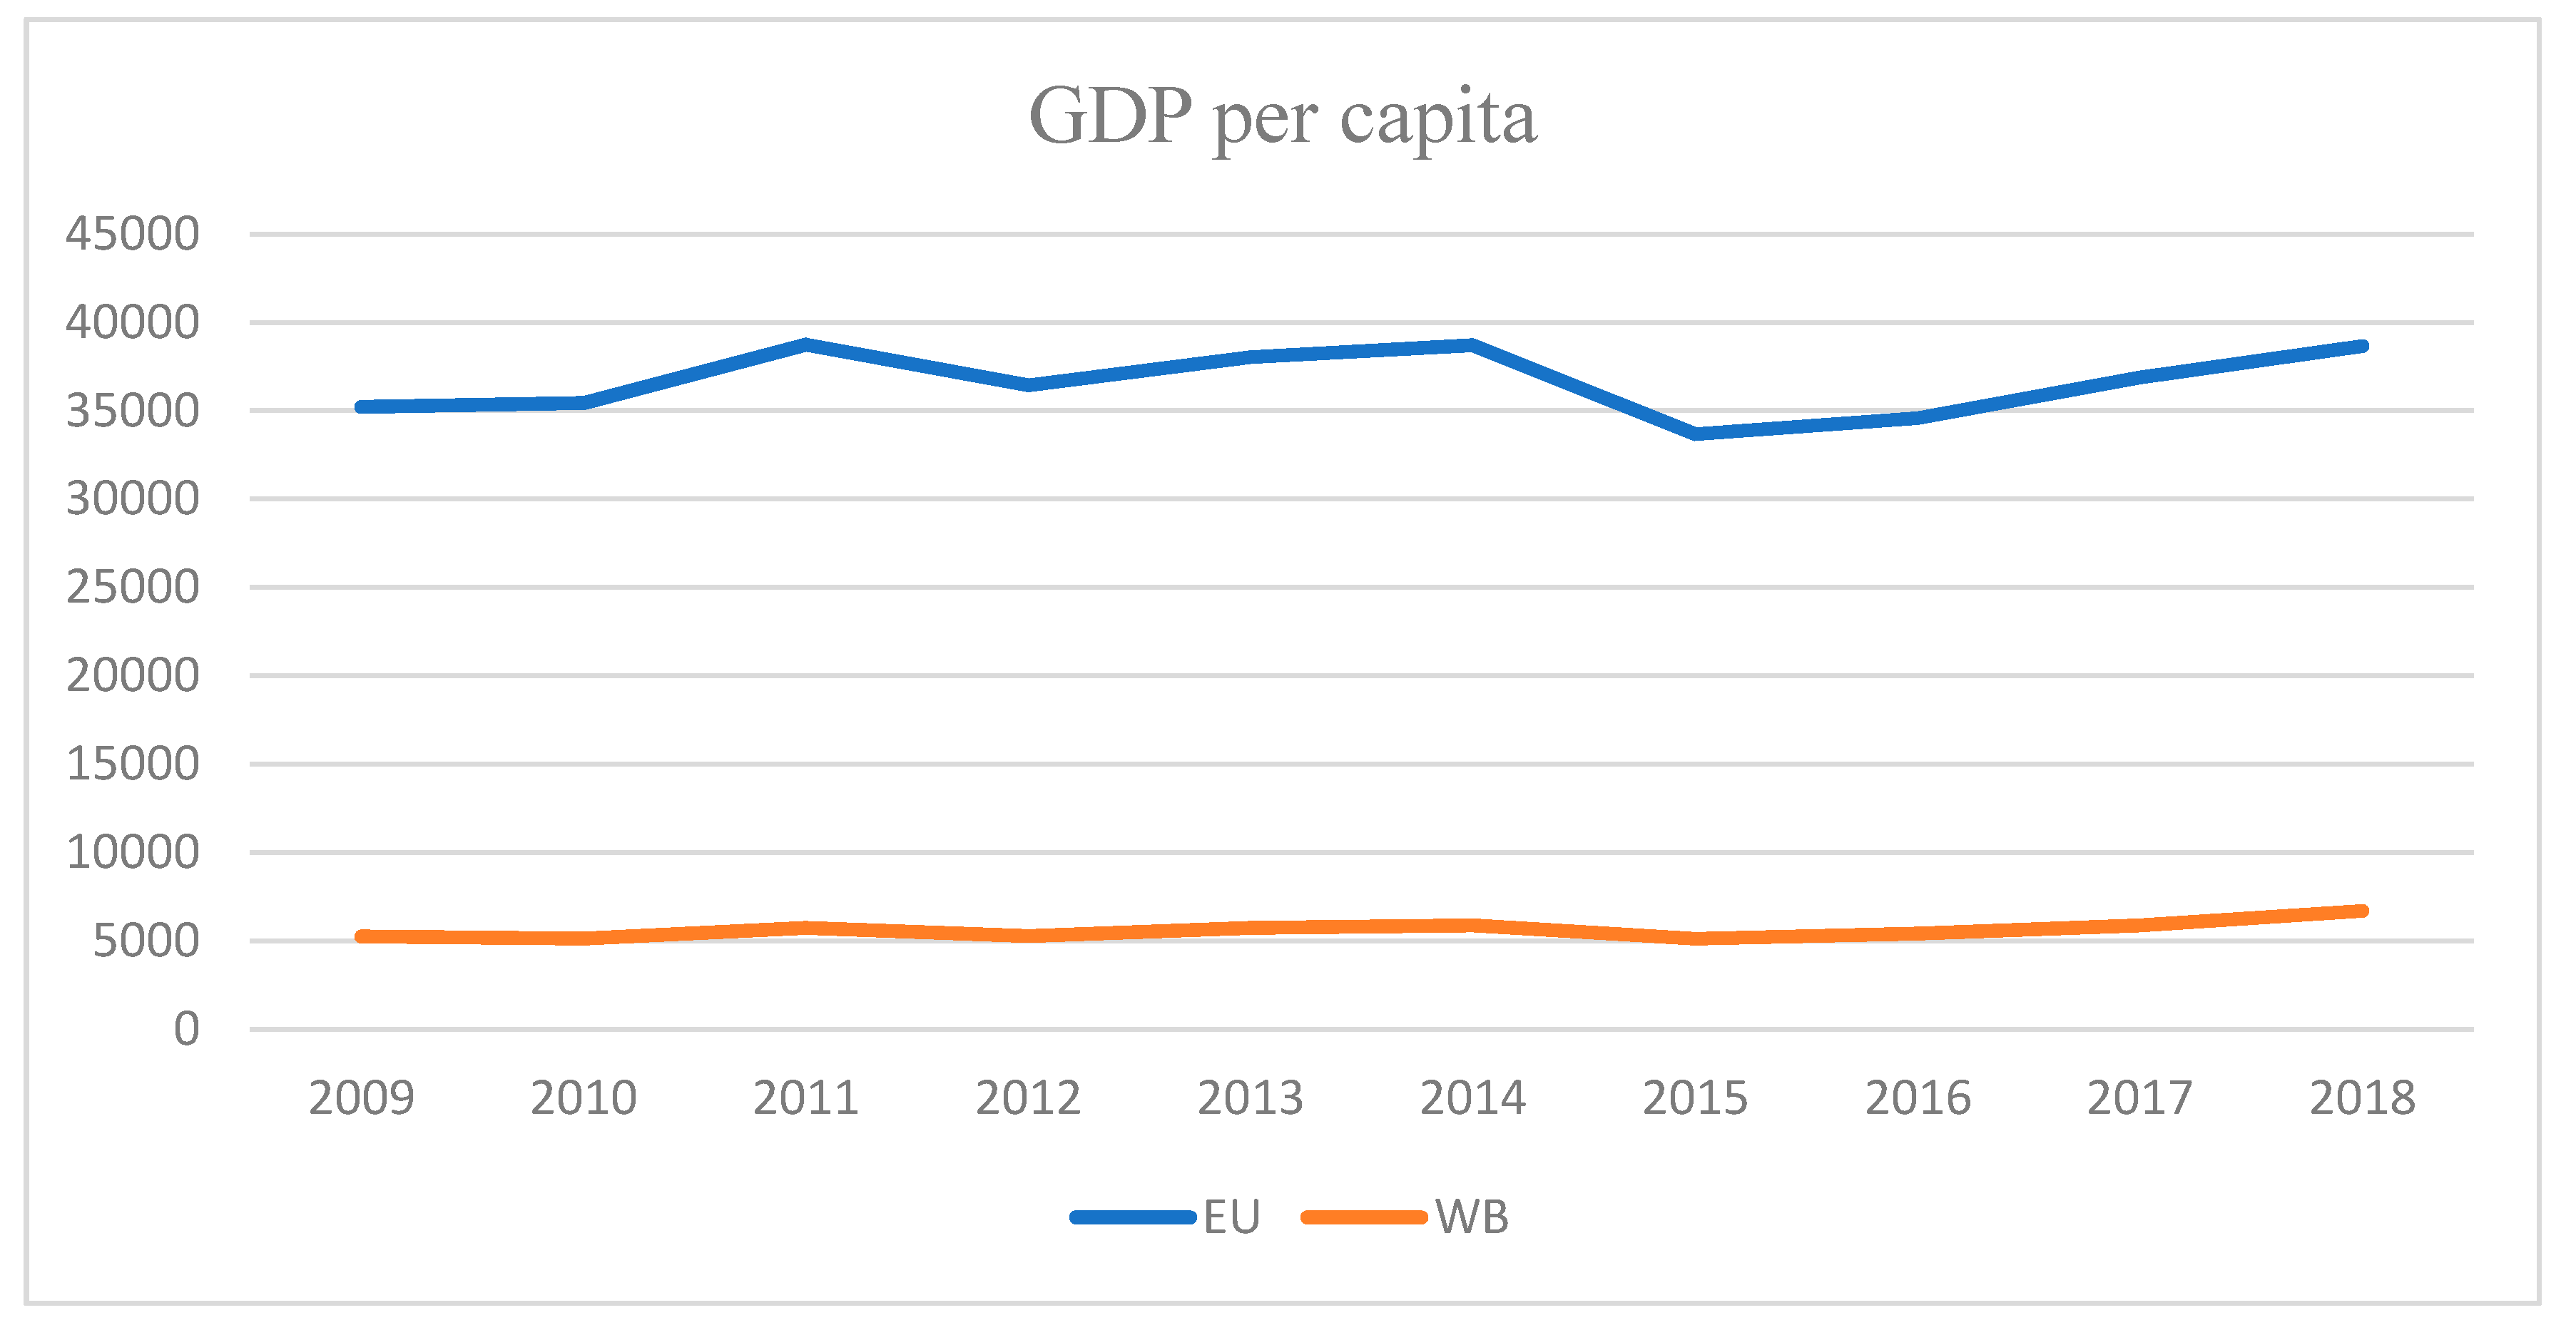
To measure the economic development of a country, the authors used GDP per capita as a proxy in order to analyze how well a country is performing in terms of one another. The data in
Figure 2 are retrieved from World Bank, and the time chosen is 2009 until 2018, as mentioned in the methodology section as well.
From comparing the two areas, it is clear that there consists a major gap in GDP per capita levels. This is also noticeable in the GDP per capita as well. Furthermore, we see that because there are these major differences in economic growth, the poverty level is also different. In the Western Balkans, we notice a much higher poverty rate than when comparing it to the EU zone.
To add to this further, the unemployment rate in Western Balkan countries appears to be much higher than in the European Union. The highest rate with 20% is taken by Bosnia and Herzegovina and the lowest rate with 13.6% is in Serbia. Furthermore, the GDP per capita is also the highest in Serbia with USD 6.285, and the lowest stands in Albania with USD 4.532.
From the data, we notice that the three countries with the highest GDP per capita are Luxembourg with 10% (or USD 116,639), Norway, which takes up 7% (or USD 81,697) and Ireland with 7% (or USD 78,806). These countries also appeared to have lower poverty rates at USD 5.50, higher investment opportunities when compared with other EU countries, the living conditions appear to better here, with an average of 95.4 out of 100 points, and the education index is also higher with an average of 88% when the EU average is 85%. Furthermore, the GDP per capita in these three countries, with an average of USD 92,381.000, is also higher than the EU average GDP per capita, ~USD 37,000.
On the other hand, in
Figure 2, we also have the GDP per capita of the Western Balkan countries. From the data, we can observe that Serbia and Montenegro take up the largest share of their GDP per capita with 22% and 26% of the total GDP per capita, or USD 7246 and USD 8844, respectively.
So, we can conclude that GDP per capita is an important factor in the elimination of the poverty rate and the improvement of the living conditions and the investment environment for the development and growth of the economy.
4.1.3. Income Inequality
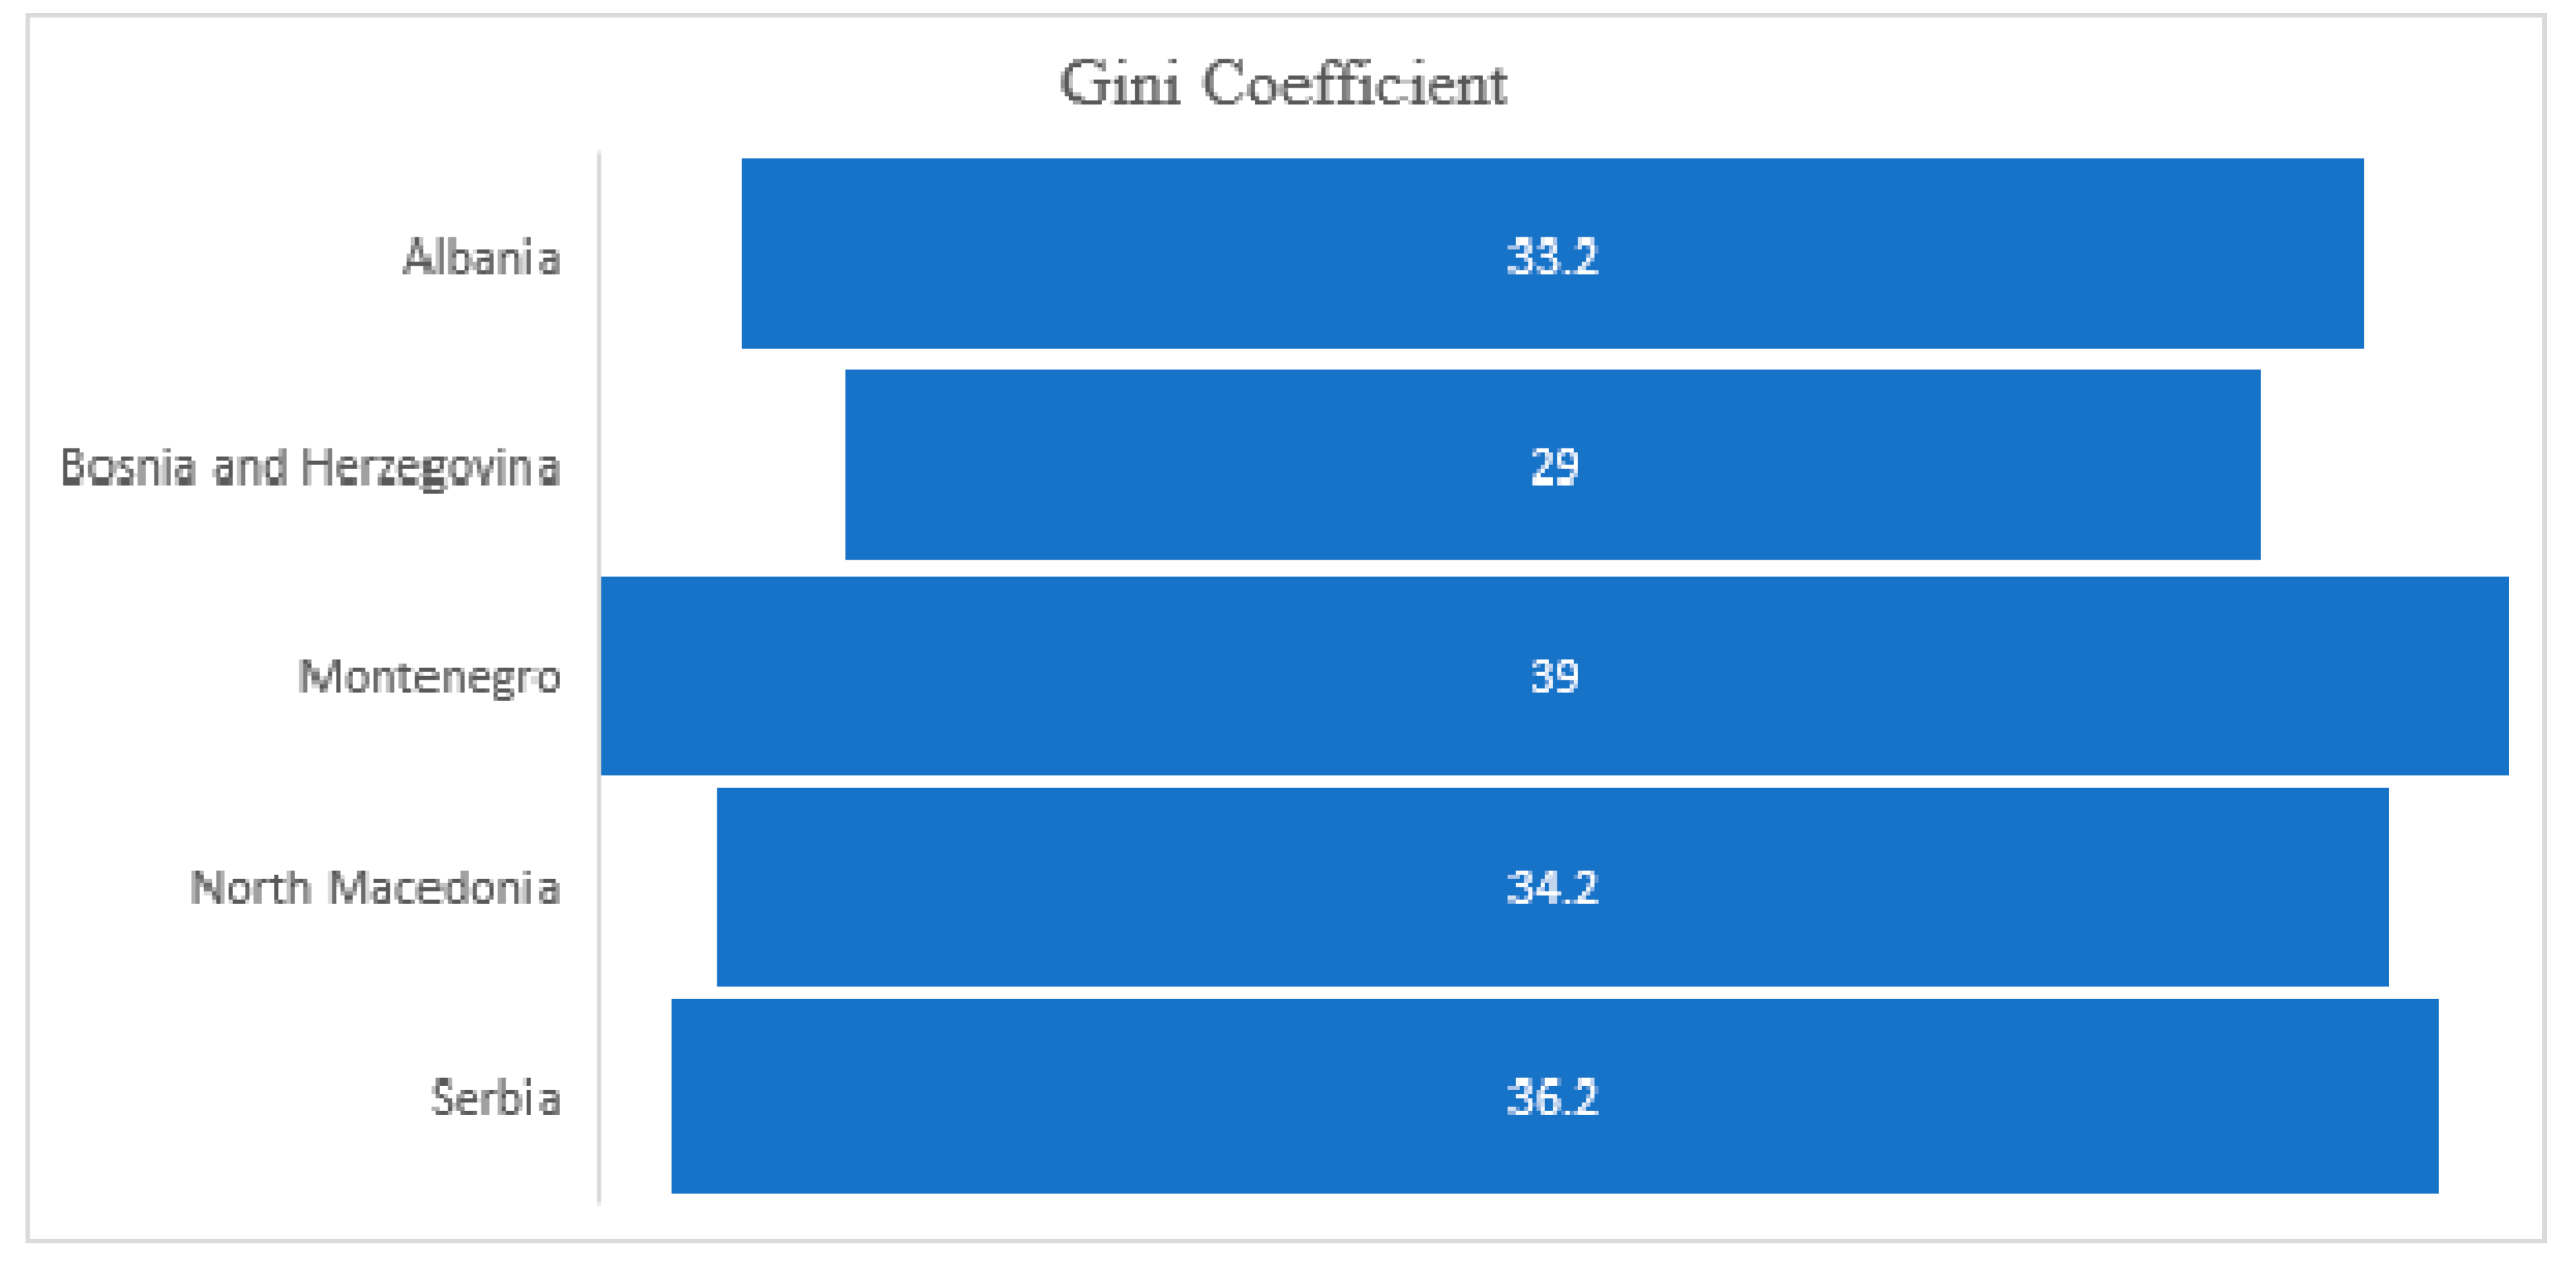
To analyze income inequality, the Gini coefficient is taken as a proxy as it is the best indicator to measure income distribution of a population. The data used are from the World Bank, and the time chosen is 2009 until 2018, as mentioned in the methodology section and shown in
Figure 3.
One surprising factor that came up when we compared the results was that, despite the huge differences in GDP per capita and the above-mentioned factors, the distribution of the wealth among the population in the Western Balkans was in the same levels as most of the European countries. From the data, we can observe that in Western Balkan countries, Montenegro has the highest number; however, in the EU area, Bulgaria surpasses it with one point more. These may come with the change in taxes on wages or as the result of exercising fair fiscal pressure in order to reduce inequality.
In the
Appendix A section, the descriptive statistics are shown in order to see the full comparison between the two economic areas. Just as explained in the previous analysis, the average poverty rate in the Western Balkans is higher than in the European Union. The difference between the rates is 1.8%. Furthermore, the difference in economic growth of both GDP and GDP per capita also leads to huge difference between the two areas, along with the unemployment rate. On the other hand, the Gini coefficient is almost the same, with a difference of only three points more in the Western Balkans region. From this, we can come to the conclusion that the major contributor to the poverty rate in the Western Balkans is not income inequality as much as the macroeconomic factors such as economic growth, and investment opportunities.
4.2. Econometric Analysis
In the previous section, we compared the trends between the two areas in a more generalized term. However, to properly conduct the analysis, we need to discover the relationship between independent variables and the dependent variable, namely the poverty rate at USD 5.50. Furthermore, as we mentioned at the beginning of the chapter, we will also do tests in order to see if our results are biased or not. Again, we will run these tests for both economic regions in order to be fair with our results as well.
4.2.1. Multicollinearity Test
Starting with the multicollinearity test using linear correlation matrix for both the EU and WB regions, as we can observe from
Table 3, the authors notice that poverty shares a strong positive relationship with factors such as the Gini coefficient, which we have used as a proxy for income inequality, and unemployment.
On the other hand, poverty rate also shares a negative relationship with the Education Index, GDP per capita, governance, and investment environment, which is acceptable as all of these variables contribute in the development of the economy. In both cases, we notice the same results in terms of sign; however, the impact is much higher in the EU than in the WB.
Although the correlation matrix is useful to find multicollinearity, it only shows the bivariate relationship between the independent variables. Furthermore, we have also used variance inflation factors approach in order to test whether multicollinearity exists, as a second test. Generally, variance inflation factor (VIF) is preferred over the correlation matrix as it shows the correlation of variables with each other. In
Table 4, we observe that the variance in each case is below 5, meaning that the regressors are not inflated. So, based on both tests, we conclude that there is no multicollinearity between the variables.
4.2.2. Hausman Test
As was mentioned at the beginning of the chapter, we will also test whether we are working with fixed effect or random effect. That is why we will use the Hausman test. In
Table 5, based on both results, we conclude that a fixed effect model is more appropriate for analyzing the relationship between the poverty rate with the other independent variables.
So, because we are using unbalanced panel data to minimize both heteroskedasticity and serial correlation problem, when running the fixed regression, we will also run the White-Cross section in order to eliminate both problems mentioned above.
4.2.3. Unit Root Test
The last test we will use is the unit root test to verify the stationary nature of the data, as shown in
Table 6. We will base our analysis on the Levin, Lin and Chu unit root test. The chosen level of significance is 5%.
The hypotheses of such a test are:
As shown in both tables above, each variables’ p-values are less than 5%, which rejects the null hypothesis, which supports the unit root existence, thus the non-stationary. This suggests that all the variables are stationary, and we do not need to transform them into first difference.
4.2.4. Fixed Effect for European Union and Western Balkans
After we conducted all the tests and based in the Hausman test as well, we decided that a fixed effect model is more appropriate in order to analyze the effect of the independent variables on poverty rate in the case of the European Union and the Western Balkans. The results of the models are shown in
Table 7 for both regions.
Our model ended up with 254 observations for the European Union and 32 observations for the Western Balkans, due to missing data. Despite that, the models ended up with more than 80% explanatory power. Variable GDP per capita is taken as a logarithmic in order to avoid out exponential trends of growth and to remove heteroscedasticity.
From the results of the regression, we expected, in accordance with the literature review, that income inequality has the tendency to complement the poverty rate and economic development or wellbeing has the tendency to diminish it. From the tables above, the results of both EU and WB when it comes to income inequality are the same. In both cases, the Gini coefficient positively impact the poverty rate at $5.50, as concluded in the literature review chapter as well. However, when we looked at GDP per capita, it seems to have reversed roles on impacting the poverty rate. In the case of the EU, while GDP per capita has a negative impact on poverty with every 1% increase in GDP per capita, it decreases with 1.35 units. Moreover, in the case of the Western Balkans, the GDP per capita has a negative impact on the poverty rate with 48.7 units increase and it is highly significant in both cases. This suggests that increasing and improving the GDP per capita of developing countries such as WB would tremendously decrease the poverty rate. All other control variables such as unemployment, education index, and investment environment all negatively impact the poverty rate in both cases. While governance has a positive impact on the poverty rate in the Western Balkans case, when considering its p-value, that is more than the 10% significance level, we did not consider it as it may be a factor of low observations.
Economic growth is seen as an important factor when considering poverty eradication. However, the relationship has its turning point based on the Kuznets curve. At some point, the economic development has an indirect relationship with the level of income a country has. Based on the theory, we also conducted another regression where the logarithmic term (GDP per capita) is taken as a quadratic function, to observe whether we are dealing with a U-shaped form or not. The results, shown in the
Appendix A section for both cases, show that in fact we are not dealing with a “turning point”, since in both the EU and the WB countries, the values are highly insignificant, despite having a negative impact on the poverty rate. Based on these results, we will only be focusing on the non-quadratic regression estimation as seen in
Table 7.
5. Analysis and Discussion
Based on the fixed effect model used for both the European Union and the Western Balkans, the regression model is as expressed below:
Hypothesis 5. Governance has a significant negative impact on poverty rate on both EU and WB.
Hypothesis 6. Investment environment has a significant negative impact on poverty rate on both EU and WB.
Factors such as governance and investment environment also have an impact on lowering the poverty rate. A good political state influences better economic policies and better harmony in wellbeing as well. Ensuring the safety and health of the workers, developing education programs and implementing strategies capable of measuring and assessing intellectual capital and paying taxes were viewed as highly important when analyzing the overall wellbeing of the employees [
57] However, we notice that these factors are more significant in the EU case than in WB. This may also be a reason for the lower observations in data. Nonetheless, it appears that Western Balkan countries need to work more in these terms in order to improve their economy and perform better in order to lower their poverty rate. Furthermore, in terms of the hypotheses we set up at the beginning, we conclude that governance shares different results in the two cases. Meanwhile, in the case of WB, it was neither significant at 10% level nor does it negatively impact the reduction in poverty.
This can also be a reason for many political disruptions and high corruption levels happening in the Western Balkans that have impacted the increase in poverty [
58,
59]. Wajid, Mahmood and Sarwar [
60], in their study from 2011, found similar results in research conducted for Pakistan; while income inequality is the main reason for poverty, poor governance affects poverty in the long term rather than in the short term. We partially accept Hypothesis 5 in the case of the European Union, as it does significantly impact the poverty negatively. However, we reject this hypothesis in the case of Western Balkans. On the other hand, we decline Hypothesis 6. While it does negatively impact poverty, it is not significant in either case, suggesting that with the improvement of the investment environment of a country, it will provide more employment opportunities and thus alleviate the poverty level.
Hypothesis 1. Education has a significant negative impact on poverty rate on both EU and WB.
As we saw from the regression table in the previous chapter, the education index has a negative impact on the poverty rate. Great education is often seen as practically an indication of future success and increased future profits. Despite the fact that degrees in today’s age are becoming saturated and it seems that with this competitiveness, people are finding other options to stay employed or even get hired in the first place. The increasingly competitive environment of the job market has led to underemployment among many people; however, in both cases of the European Union and Western Balkans, that does lead to poverty below the USD 5.50 line. Completing a post-secondary education at global level, in today’s world, will make the difference between a life of poverty and a stable economic future. Educational structures, both at the micro- and macro-level, play a significant role in promoting the transition to social upward mobility [
61]. An integrated human capital management plan that considers the future value of all human capital inputs would help minimize historical inefficiencies and inequities and maximize the returns to scarce resources [
62]. Thus, we partially accept Hypothesis 1. Education shares a negative impact on poverty in both EU and Western Balkans, despite not being significant.
Hypothesis 2. Economic Growth has a significant negative impact on poverty rate on both EU and WB.
In the case of economic growth and development, while GDP expansion is definitely seen as an important factor for reducing the poverty rate, it is not the absolute factor. Economic growth is not enough on its own to reduce poverty, especially if the aim is to reduce poverty swiftly and sustainably [
63]. On the other hand, GDP per capita has been said to be the main source of poverty reduction in most countries and especially developing ones such is the Western Balkans. Countries witnessing higher growth rates are achieving a quicker decline in poverty. Poverty reduction is largely due to growth, which leads to higher employment and higher real wages [
64]. So, economic growth does have a significant impact on reducing poverty, thus we do not reject Hypothesis 2.
Hypothesis 3. Income Inequality has a significant positive impact on poverty rate on both EU and WB.
The purpose of this work was to compare two different economic regions with each other. Because there is a huge gap between economic development due to various factors that contribute to its growth and wellbeing, it appears that the poverty rate is higher in the Western Balkans region than when comparing it with the European Union. However, while there are disparities in there, income inequality is at the same level.
Furthermore, income inequality is highly significant in impacting the poverty rate of both economic regions. However, based on the descriptive statistics shown in the previous chapter, this income inequality is higher in the Western Balkans region than in the European Union, suggesting that there are differences when comparing developed countries with post-communist ones. High inequality is expected to be associated with high poverty. An increase in inequality may be such that the poor are left intact or do not grow, but an increase in inequality is often also associated with an increase in poverty. Furthermore, we notice that while in both cases, income inequality is significant, in the European Union case it does not have that strong of an impact as when compared with the Western Balkans. So, the latter must work on distributing the wealth between the population more evenly.
Hypothesis 4. Unemployment has a significant positive impact on poverty rate on both EU and WB.
Unemployment has been one of the main causes that has impacted the spike in the poverty rate. In both EU and WB, not only is it significant at the 10% significance level, but it also positively influences poverty. While not everyone who is unemployed lives in poverty, it also seems evident that those who are unemployed include those who are most at risk of poverty. Not only that, but the impact of unemployment in the Western Balkan countries on poverty is much higher when compared with EU countries. This result is consistent with the study of Vladi and Hysa [
65], which strongly confirmed that unemployment has a crucial impact in the GDP of Western Balkan countries. This could be caused by the fact that the economic growth and the investment opportunities available in this region are much lower than the exposure the EU gets due to other macroeconomic reasons. There is ample evidence that unemployment raises the risk of deprivation and leads to inequality, as well as a number of adverse social effects on the unemployed themselves, their families and their societies [
66]. Thus, to conclude, we do not reject Hypothesis 4 on unemployment and its impact on poverty regarding EU and WB.
6. Conclusions
Our work analyzes the impact of income inequality and economic growth on the poverty level of European Union and Western Balkans. From the original model, we also wanted to observe the impact of other factors as well, such as education, unemployment, governance, and investment environment.
Since there are not many studies done on poverty as a comparison between EU and WB, from the analysis and results conducted, the key findings are that income inequality is indeed higher in the Western Balkans than it is in the European Union, but especially GDP per capita was the variable that showed a huge gap between the two zones. This resulted in a further increase in the poverty rates. However, from the economic growth that Western Balkan countries have been showing the past few years [
67], we notice that the poverty rate and income inequality have also seen a major decline, suggesting that these factors are tightly connected with each other.
Furthermore, a novelty to the research gap is also governance and unemployment, which are also major key players in reducing the poverty rate. In both the EU and WB, we saw that the variables were not only highly significant, but the coefficients of reducing the poverty rate were also high. Other factors such as investment environment also control the poverty rate; however, this will differ for each case. However, as the study of Hysa et al., 2020 [
68] suggested, the policymakers and authorities that are engaged with the growth and development policies and implementation of the right structures should also target the relevant innovation. As such, the innovation capacities in the country make the poverty level reduce, the income inequality reduce and thus it contributes to the sustainable development. To conclude, income inequality and economic growth do impact the poverty rate in the European Union and Western Balkan countries. However, more factors that contribute to the poverty rate for both cases are also governance and unemployment. Other factors such as investment environment and education will differ based on the economic growth and the political stability of that country, being consistent also with the findings of Hysa and Çela [
69].
7. Limitations and Recommendations
The limitations of this study were mainly the lack of data in the case of the Western Balkan region, as we only ended up with 32 observations out of 125 in total. This also became a setback in taking into consideration a greater number of years. Moreover, since in the Western Balkan region Kosovo is also part of it, due to political issues thus resulting in missing data, we could not include it in the analysis. For further studies, a greater number of years could be taken into consideration in order to see the trend and analyze the comparison between the regions better. Additionally, we have considered poverty at the USD 5.50 line, so the results will vary accordingly. Furthermore, CPI could also be taken into consideration to see how it affects the poverty rate over the years. An interesting continuation of the research would also be the analysis of which sector (low-skilled vs. high-skilled; rural-urban) is impacted the most by these factors.
Regarding all the factors that came as a significant variable in influencing the worsening of the poverty rate, Western Balkan countries could increase the minimum wage. In WB, the minimum wage is relatively lower than when compared to EU minimum wages. Moreover, another problem associated with this low minimum wage is that in these countries, the labor taxes are high. The Western Balkans are experiencing severe taxation on labor and the low-wage workers are suffering the consequences. A low-wage, high-tax trap in these countries translates into substantially less opportunities for low-skilled employees to work (at least in the formal sector) and, on the employers’ side, less opportunities to recruit low-wage employees and invest in labor-intensive low-wage sectors. This, in effect, contributes to lower levels of jobs and development, higher informal work and higher gaps in salaries and income available.
Furthermore, based on the results, education is a key component in reducing poverty. The main components contributing to persistent inequality across generations are differences in early education and school quality. Education investments, starting in early childhood, can enhance financial mobility, lead to increased productivity and eliminate poverty.
Lastly, while poverty still remains an important issue where the solution is specific to each targeted country, there are certain factors that contribute to its decrease. In the case of the Western Balkans, the living conditions, including health, income, employment, education and even the political health of a country, are crucial to reducing the poverty level and causing an increase and harmony in the economic development of that country.


