Abstract
Ecological environment evaluation is of great significance to achieve the Sustainable Development Goals (SDGs) and promote the harmonious development of economy, society, and environment. To evaluate environmental SDGs, single environmental indicators have been analyzed at national or large regional scale in some literature, while the urban integrated environment is ignored. Therefore, it is necessary to systematically and quantically evaluate the sustainability of ecological environment integrating the water, soil, and air environment at the urban scale. This study aims to construct the Integrated Perception Ecological Environment Indicator (IPEEI) based on the Driver-Pressure-State-Impact-Response (DPSIR) framework to solve the above-mentioned problems. The IPEEI model was proposed based on the three-level association mechanism of the Domain-Theme-Element, and the DPSIR framework conforming to the relevant standards for indicator determination. Moreover, the multi-dimensional, multi-thematic, and multi-urban quantitative evaluations were conducted using the entropy weight method, and the comprehensive evaluation grades by the Jenks natural breaks classification method of the geospatial analysis. Nine cities in the Wuhan Metropolitan Area were selected as the experimental areas. The results were consistent with the Ecological Index and local government’s planning and measures, which demonstrated that IPEEI can be effectively verified and applied for the evaluation of urban ecological environment sustainability.
1. Introduction
From the perspective of ecological environment, urban sustainability is more related to the effective use of natural resources and the changing status of ecological environment according to the specific requirements of human beings. The sustainability of smart cities in the ecological environment field is to meet people’s current and future needs of water, soil, and air environment, etc. Ecological environment problems brought about by rapid social development and economic growth are specifically manifested in the contradiction among the environment resource, environment pollution, and environment deterioration [1,2,3]. Nowadays, the Chinese government has made many efforts to improve energy efficiency and reduce pollution emissions, and promote the transformation of enterprises into green and low-carbon modes through technological progress and the increasing of the expenditure on environmental protection projects. Thus, it is also necessary to consider the impact of green and sustainable development policies of the local government for the energy conservation and emission reduction. Compared to the concept of smart city, smart sustainable city, defined by the Telecommunication Standardization Sector of the International Telecommunication Union (ITU-T) Focus Group on Smart Sustainable Cities (FG-SSC), is more concerned about the sustainability aspect, with the aim of ensuring the improvement of the quality of life, the efficiency of urban operation and services, the competitiveness, and the needs of present and future generations with respect to economic, social, and cultural aspects [4,5,6]. However, there is still no consensus on the main factors which can make a city more sustainable [7].
To evaluate the performances of smart sustainable cities, many indices and frameworks of smart cities have been proposed for supporting policy-making of the local governments at urban level. Yigitcanlar et al. [8,9] proposed a large flexible smart city index based on the smart cities framework and local circumstances and characteristics, which can provide a quantitative evaluation of the smartness of urban regions through the index that is specifically tailored for each comparative case study, such as various local government areas in Australia. Lombardi et al. [10] developed a novel framework for classifying smart city performance indicators and identified the interrelations between smart city components, which can offer a truthful and realistic indicator model representation in the field of smart cities’ evaluation, but measuring what options exist to improve urban performance is still needed. Bhattacharyaa et al. [11] provided a smart sustainable city development index to evaluate the urban sustainable development performances for developing countries. Carli et al. [12] proposed a multi-criteria decision making technique to assess the sustainable development of metropolitan areas. However, with the limitation of a relatively subjective evaluation of the analytic hierarchy process [11,12], it is necessary to develop an objective indicator framework to measure the smartness and sustainability of smart sustainable cities for decision-making.
For the better evaluation of the cities’ development progress towards the Sustainable Development Goals (SDGs), many international standards have been proposed based on the actual situation of local urban development, such as the International Organization for Standardization (ISO) 37120:2014 [13], ISO 37120:2018 [14], ITU-T Y.4901/L.1601 [15], ITU-T Y.4902/L.1602 [16], ITU-T Y.4903/L.1603 [17], and the evaluation indicators for new-type smart cities of China (GB/T 33356-2016) [18]. With a consistent and standard method of the measure for sustainable progress, relevant indicators of smart sustainable cities have been defined in those standards. The comparison of the indicator system defined in the above mentioned six standards is shown in Table 1.

Table 1.
Standards and indicator system for smart sustainable cities.
All six standards classified the indicators, including core indicators and optional indicators, but only the standard of GB/T 33356-2016 assigned weights to the indicators. Although the grade division of the indicator are all performed in the six standards, the divisions of dimensions are different, among which the ISO standards provide the most complete details. Each of these dimensions provides a separate view of progress for smart sustainable cities, and sub-dimensions that focus on more specific areas are used to refine them. For example, indicators in the ITU standards form various parts of a city’s performance in different dimensions, including the economy, environment, society and culture. In general, the indicators in the six standards all provide the means for self-assessments towards the sustainability of cities for the criteria establishment. However, some standards lack specific descriptions of indicator definitions and calculation. In addition, for the indicators in the environment area, the six standards all include water, soil, and air environment, but they are not comprehensive. Therefore, there is a lack of unified indicator definition and assessment for integrated perception of ecological environment.
Previous works on the sustainability of smart cities include China’s national plan on implementation of the 2030 agenda for sustainable development [19], SDGs knowledge service system of Deqing County in China [20], and the big earth data in support of the SDGs [21], etc. Based on statistics and geographic information data of Deqing County since 2014, Chen et al. [20,22,23] developed the Deqing County’s sustainable development knowledge service system by using SDGs indicator model, knowledge map, Geographic Information System (GIS), data cleaning and processing, analysis and calculation, custom assembly, and visual display technologies. However, the sustainable assessment of Deqing County is carried out through interdisciplinary and multi-agency communication and coordination, which does not apply to the calculation of indicators in most urban scale studies, especially in terms of data access. Zhang et al. [21] realized the construction of big earth data support the SDGs indicator system and integration from the perspective of the earth system to study the relationship and coupling between the five SDGs, including the zero hunger, clean water and sanitation, sustainable cities and communities, life below water, and land life on land. However, most application cases are targeted at a single environmental indicator and are carried out at the provincial and national scales. Therefore, the existing researches have many problems on the sustainable development indicator system, such as the single indicator and coarser spatial scale for the evaluation in environment areas.
Quantitative evaluation adopts a certain formula or model to calculate the indicator system, and evaluates the indicator according to the size of the calculation results, which can provide information support and a decision-making basis for the ecological environment sustainability. In order to distinguish the importance degree of different indicators on the evaluation, it is necessary to further determine the weight of each indicator. Objective weighting method, in which the weights are obtained from the actual data of indicators, can determine the weight with higher accuracy from the full use of the effective information provided by the original indicator. The entropy weight method [24,25], as one of the objective weighting methods, only depends on the discreteness of the data itself and is suitable for multi-layer structure evaluation. However, the entropy weighting method only provides an objective method to determine the weight to express the importance of each indicator. For the complex environmental issues, it still needs to rely on the multi-level and multi-objective indicators construction to explain the relationship that is deeply interrelated in a systemic way.
The Driver-Pressure-State-Impact-Response (DPSIR) framework is widely used in sustainable development [26,27,28], and is useful for analyzing and identifying solutions to environmental problems [29,30]. DPSIR concept model was first proposed by the Organization of Economic Cooperation and Development [31] in 1993 to revise the Pressure-State-Response model and Driving force-State-Response model, and has gradually become an effective tool to solve the problem of the relationship between environment and social development. Since 2003, some scholars have tried to solve the problems of sustainable development, environmental management with water and soil resources by this framework, and put forward feasible and operable countermeasures and suggestions. At present, the DPSIR framework is mainly applied to the management and protection of water, soil, marine resources, and coastal organisms, as well as the decision-making and implementation of environmental management science.
There are many researches on the ecological environment indicator system based on the DPSIR framework. Apostolaki et al. [32] integrated water resource management concept to ensure sustainable use of water resources for watershed management. Zare et al. [33] proposed quantitative sustainable development models for water resource management to support modelers in identifying and collecting data. Lange et al. [34] proposed a framework for drought analysis by the hydrology, meteorology, and society. Jia et al. [35] developed a model to carry out sustainable application at the national scale for the groundwater resources. Wu et al. [36] aimed at the green development assessment of Beijing by considering resource depletion, environmental damage, and ecological benefits. Wang et al. [37] integrated an environment warning system in water, soil, and atmospheric fields. Jia et al. [38] evaluated the spatial and temporal variation of sustainable utilization of water resources in Henan province, China. Qiao et al. [39] established a co-benefits indicator system to evaluate the co-benefits of city policies for megacities with the entropy method. However, the abovementioned studies mainly focused on the analysis of a single environmental problem, or the comprehensive environmental evaluation based on the relatively subjective prior knowledge from different evaluators. Therefore, in order to overcome the subjectivity in the process of indicator construction and weight determination, the construction and evaluation of ecological environment indicators need to be improved in support of urban sustainability.
To solve the abovementioned problems, including the inconsistency of standard and indicator definitions, single environment analysis, and the insufficient spatial resolution, it is necessary to systematically design the ecological environment indicators, and enhance the indicator evaluation at the urban scale. This study constructs the Integrated Perception Ecological Environment Indicator (IPEEI) based on the DPSIR framework to define more detailed indicators integrating water, soil, and air environment, and provide the quantitative evaluation for the smart sustainable city at the urban scale. Nine cities in the Wuhan Metropolitan Area were selected as the experimental areas for the evaluation of ecological environment sustainability.
2. Methodology
This part is about how the IPEEI model, based on the DPSIR framework, is constructed to integrate the water, soil, and air environment, and the entropy weight method is used to assign the weights of the indicators of the IPEEI model for the indicator evaluation. The construction of the IPEEI model for smart sustainable cities is illustrated in Figure 1. Firstly, by analyzing the system architecture and indicator element of sustainable cities, the three-level association mechanism of the Domain-Theme-Element is built. Secondly, using the DPSIR conceptual framework to explain the causal relationship among the three-level association mechanism, and referring to international standards, SDGs hierarchy, and other relevant studies, the IPEEI model is put forward for the integrated perception. Thirdly, through the weight assignment of the indicators of the IPEEI model with the entropy weight method, further quantitative evaluation for the dimension and theme of IPEEI, and the comprehensive evaluation grade analysis for the urban sustainability, are carried out.
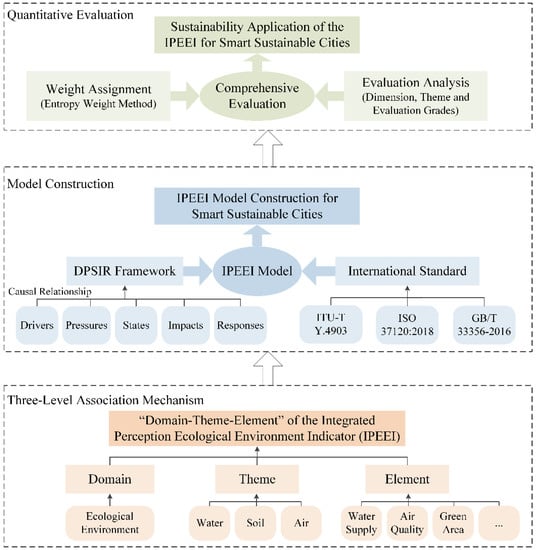
Figure 1.
Construction of the Integrated Perception Ecological Environment Indicator (IPEEI) model for smart sustainable cities.
2.1. Three-Level Association Mechanism of the Domain-Theme-Element
The exploitation and utilization of resources in sustainable development are to make them circulate along specific paths by adjusting the process of resource cycle, so as to meet the special needs of different sectors such as society, economy, and ecological environment, and make resources, ecological environment, and social economy coordinate and develop sustainably. By sorting out the common characteristics and specific themes of the ecological environment field, this paper analyzes the integrated perception elements of the ecological environment, and establishes the three-level association mechanism of the Domain-Theme-Element.
As shown in Figure 2, the three-level association mechanism of the Domain-Theme-Element is constructed with the domain focusing on the ecological environment, the themes for the water, soil, and air environment, and the elements including the water resources, water supply, water use, urban landscaping, and air pollution, etc. There are a variety of elements in urban ecological environment. Taking the urban water resources as an example, total water resources include surface water resources and groundwater resources. Urban water supply includes water supply quantity, integrated production capacity of water supply facilities, and density of water supply pipelines in built district, etc. Urban water use is divided into industrial water, domestic water, and ecological environment water. Urban drainage includes wastewater discharge quantity, density of sewers in built district, wastewater treatment rate, and wastewater treated quantity, etc.
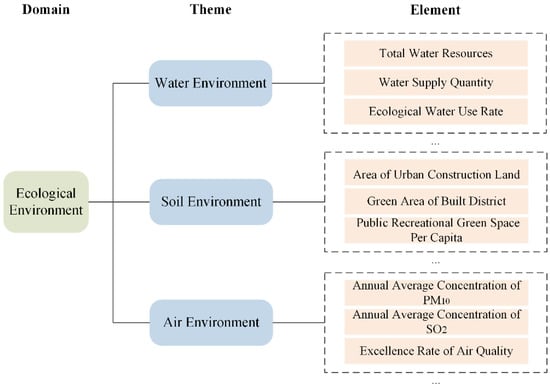
Figure 2.
Three-level association mechanism of the Domain-Theme-Element for IPEEI.
2.2. IPEEI Model Construction based on the DPSIR Framework
2.2.1. DPSIR Framework
For the DPSIR framework, driver dimension is stimulated by social, economic, and natural factors, and generally it will not change significantly in a short time, except for emergencies. The pressure dimension includes the special demands, such as the coordination and sustainability of the society, economy, and ecology on environmental resources in different sectors. The state dimension includes the characteristics of physical chemistry and other observed elements for environmental resources, whose dynamic changes are the basis for studying the driver and pressure dimensions, as well as the starting point for analyzing impact and response factors. The impact dimension is the change of state dimension, which is always delayed, and needs to establish the correlation between pressure, state, and impact dimension through the statistical data, such as the impact and constraints of ecological environment on the scale of social and economic development. The response dimension includes the effects of management measures taken and policy makers’ efforts to solve environmental problems, which are generally lagging.
The DPSIR framework of urban resource information model reveals a causal relationship chain of cause-and-effect relationships between the beginning and the end of urban development. At the early stage of urban development, within the strength of the driver and stress dimensions that carry capacity of resources, resources can meet the requirements of urban development, and play a role of nourishing and supporting the resource system in a stable and orderly state. As shown in Figure 3, the causality chain shows that population, economy, meteorology, and the corresponding environment and energy consumption, produce change as the driver dimension in the development of urbanization, and thus produce pressure dimension on the population, environment, and energy consumption. Some state factors in the environment system with the change of the environment conditions have direct effects on the impact dimension, for example, various energy consumptions. These impacts urge us to ensure the sustainable development of cities in the process of accelerating environment and municipal health development, and further adopt corresponding countermeasures and policies for the positive responses. In turn, response measures act on other dimensions engineered by population, economy, and energy.
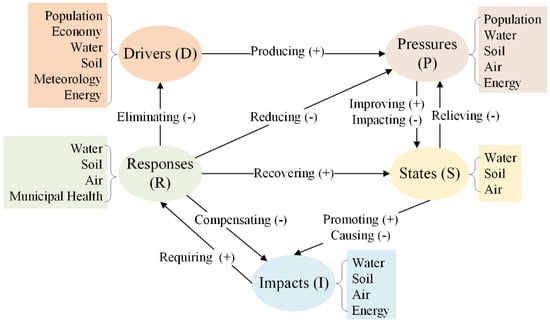
Figure 3.
Causal relationship chain of the Driver-Pressure-State-Impact-Response (DPSIR) framework for ecological environment in smart sustainable cities.
Therefore, the organizational structure of the DPSIR framework is clearly defined, and the causal relationship among various factors is very important for the social, economic, and environmental development. It is necessary to find out the interrelationship among various factors in the five dimensions, so as to reflect the internal coordination of urbanization development and play an important role in the environmental sustainability.
2.2.2. IPEEI Model
Referring to the three-level association mechanism of the Domain-Theme-Element and the construction analysis based on the DPSIR framework with the causal relationship chain of five dimensions, the IPEEI model for determining the detailed indicators needs to be developed. Considering the data sources, indicator perception requires not only traditional social and economic statistics data, but also the raw monitoring data obtained by sensor observation and the high-level information from complicated processing and analysis. The IPEEI model is further constructed by focusing on the relevant indicators defined in the sustainability standards of ITU and ISO, as well as the existing literature research on ecological environment.
As shown in Table 2, the driver dimension represents the factors that promote the development and change of resources, and mainly adopts the indicators of ecological environment, population, economy, meteorology, and energy themes. The pressure dimension describes the demand for environment resources in various sectors of social and economic development, and its side effects on the population and energy, mainly the population status and the resource consumption. The state dimension describes the ability of the environment system to meet the production and living needs of human beings and the current development and utilization of resources, which can be represented by the degree of development and utilization, the quality status of ecological environment, the amount of available environment resources, and the capacity of sewage treatment, etc. The impact dimension refers to the final result on the ecological environment, which can reflect more long-term changes than relevant state indicators, especially in the changes of the quantity and the quality of ecological environment resources. The response dimension describes the management measures taken for the vulnerability of environment system, such as the resource comprehensive utilization, pollution treatment and prevention, and municipal public facilities construction, etc.
Table 2.
Integrated Perception Ecological Environment Indicator (IPEEI) model based on the Driver-Pressure-State-Impact-Response (DPSIR) framework.
2.3. Quantitative Evaluation of the Entropy Weight Method
According to the characteristics of entropy, the degree of randomness and dispersion of an indicator, and disorder of an event can be judged by calculating the entropy value. The greater the degree of indicator dispersion, the greater the weight influence on the comprehensive evaluation; otherwise, the same indicator with little data difference in different samples is considered to be of little reference significance. The application of the entropy weight method is to make use of the effective information provided by the original indicator value as much as possible for quantitative evaluation. The calculation of the entropy weight method includes the data normalization, entropy quantification, weight determination, and indicator weighted average [24].
(1) Data normalization
Data normalization differs in formulas for positive and negative indicators, and the formula is as follows:
where is the normalized value of the th indicator, and the value range is [0,1]. is the original value of the th indicator. and are the maximum and minimum values of the th indicator among all samples, respectively.
(2) Entropy quantification
Shannon entropy is used to quantify the information (i.e., disorder) of message, which can be recognized as H as defined in certain formulations of statistical mechanics [40,41]. The formula of the Shannon entropy of the th indicator is as follows:
where is the entropy value of the th indicator. is the probability parameter of the value of an indicator for one sample to the sum of the values of this indicator for all samples. is a constant calculated from the total number of samples.
(3) Weight determination
The formula of weight determination of the th indicator is as follows:
(4) Indicator weighted average
The evaluation of sustainable development using all indicators by indicator weighted average is as follows:
Particularly, for the indicators that with several categories, the evaluation of sustainable development can be calculated for each category , as follows:
In addition, due to the different formulas of data normalization for the entropy weight method, it is necessary to distinguish the positive and negative indicators. For the positive indicators, a larger value indicates a better result, and on the contrary, a smaller negative indicator value indicates a better result [25]. Thus, the positive and negative indicator division of the entropy weight method in the IPEEI model is as shown in Table 3.
Table 3.
Positive and negative indicator division of the entropy weight method in the IPEEI model.
3. Case Study
3.1. Study Area
The Wuhan Metropolitan Area (WMA) is located in the eastern part of Hubei, China (Figure 4) with a total area of 58,052 km2. The WMA is composed of Wuhan as the center, and eight other cities within 100 km that includes Huangshi, Ezhou, Xiaogan, Huanggang, Xianning, Xiantao, Qianjiang, and Tianmen. The terrain structure of the WMA is high in the northeast and south, low in the middle and west, and broad Jianghan plain in the central and western regions with not much undulating terrain, accounting for about 50% of the total area. WMA has a subtropical monsoon humid climate with four distinct seasons, abundant sunshine, abundant rainfall, and the same season of rain and heat. WMA is rich in water resources due to the highly developed regional water system and numerous rivers and lakes. The WMA is chosen as the typical case of the study, not only because of its role of the first nationwide comprehensive reform experimental area of the resource-saving and environment-friendly society in China [42], but also the factors of its new-type urbanization development, complex shape and local dispersion, and increased ecological environment problems.
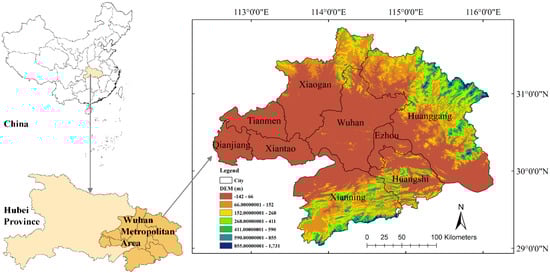
Figure 4.
Location maps of the Wuhan Metropolitan Area (WMA).
3.2. Data Collecting and Processing
Through the Hubei Provincial Bureau of Statistics (http://tjj.hubei.gov.cn), the National Bureau of Statistics (http://www.stats.gov.cn), the Ministry of Housing and Urban-Rural Development of the People’s Republic of China (http://www.mohurd.gov.cn), the Department of Ecology Environment of Hubei Province (http://sthjt.hubei.gov.cn/), the Wuhan Ecology and Environment Bureau (http://hbj.wuhan.gov.cn/), and other relevant departments of each city in the WMA, the data collecting of the 75 indicators of IPEEI in the WMA from 2014 to 2017 is carried out from the following sources: (1) The City Statistical Yearbook of each city in the WMA; (2) the Statistical Communique of Hubei Province on the National Economic and Social Development; (3) the China Statistical Yearbook on Environment; (4) the China City Statistical Yearbook; (5) the Urban Construction Statistical Yearbook; (6) the Environmental Situation Bulletin of each city in the WMA; (7) the Environmental Situation Bulletin of Hubei Province; (8) the City Water Resources Bulletin of each city in the WMA; and (9) the Water Resources Bulletin of Hubei Province.
For the data processing of the collected indicator data, it is mainly to calculate the data normalization of the entropy weight method as mentioned in part 2.3 for the next entropy quantification, weight determination, and indicator weighted average in the WMA.
3.3. Results
3.3.1. IPEEI Weight Assignment of the WMA
The weight assignment, namely the weight determination coefficient, of all the 75 indicators for the IPEEI model from 2014 to 2017 in the WMA is shown in Table 4. The weight assignment of IPEEI takes the indicator with the most positive impact on the urban ecological environment sustainability as 1 as a reference. According to the weight determination of the entropy weight method, the sum of the values of all the 75 indicators for the IPEEI model in the same year is 1. The size of the weights of IPEEI can be used to distinguish the importance degree of different indicators on the sustainability evaluation.
Table 4.
Weight assignment of all the 75 indicators for IPEEI from 2014 to 2017 in the Wuhan Metropolitan Area (WMA) (unit: %).
Taking the result of 2014 as an example, the indicators of the top ten of the weight rankings are the R14, R7, R11, R12, R3, I8, S12, R13, R1, and D10; and the indicators of the bottom ten of the weight rankings are the D13, I7, S6, P3, I10, I5, P11, P10, P2, and I11. The results reflect most indicators of response dimension, such as the annual construction funds of municipal public facilities (R14), wastewater treated quantity (R7), domestic waste collected and transported amount (R11), and harmless treatment capacity of domestic waste (R3), making great positive contributions to the sustainable development of urban ecological environment. On the other hand, some indicators of other dimensions, such as the area of urban construction land (D13), quantity of water for household use (I7), water supply loss (S6), and population with access to gas (P3), may hinder the sustainable development of urban ecological environment. For the other three years from 2015 to 2017, the results are similar to that of 2014 with slight differences in weights of specific indicators.
3.3.2. Dimension and Theme Evaluation of IPEEI
For the five dimensions of drivers, pressures, states, impacts, and responses of IPEEI, the indicator weighted average and change trend of each dimension from 2014 to 2017 in the WMA are shown in Figure 5. In terms of dimension, the indicator weighted average of each dimension from 2014 to 2017 in the WMA remains relatively stable for the same city; while the indicator weighted average results of the same dimension for the different cities in the WMA are relatively different. For example, the indicator weighted average results of the response dimension for Wuhan from 2014 to 2017 are 0.39, 0.39, 0.41, and 0.38; while the indicator weighted average results of the driver dimension for Huanggang, Wuhan, and Tianmen in 2014 are 0.15, 0.11, and 0.04, respectively. Besides, in terms of cities in the WMA, taking the result of 2014 as an example, the cities with the largest indicator weighted average of the driver, pressure, state, impact, and response dimensions are, respectively, Huanggang, Xianning, Xianning, Tianmen, and Wuhan.
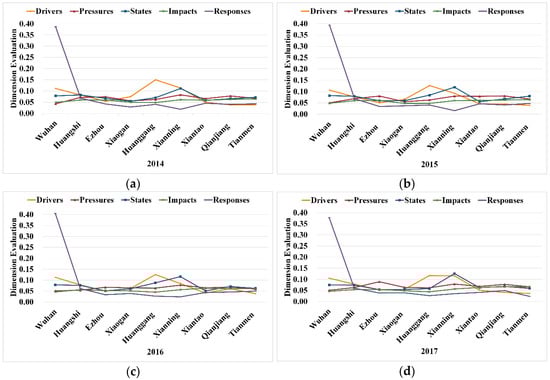
Figure 5.
Indicator weighted average of each dimension, including drivers, pressures, states, impacts, and responses of IPEEI in (a) 2014, (b) 2015, (c) 2016, and (d) 2017 in the WMA.
For the themes of water, soil, air environment, and other themes, e.g., population, economy, meteorology, energy, municipal health, of IPEEI, the indicator weighted average and change trend of each theme from 2014 to 2017 in the WMA are shown in Figure 6. In terms of theme, the indicator weighted average of each theme from 2014 to 2017 in the WMA, similar to the results of dimension, remains relatively stable for the same city; while the indicator weighted average results of the same theme for the different cities in the WMA are relatively different. For example, the indicator weighted average results of the water theme for Wuhan from 2014 to 2017 are 0.23, 0.24, 0.24, and 0.23; while the indicator weighted average results of the air theme for Wuhan, Tianmen, and Ezhou in 2014 are 0.13, 0.06, and 0.04, respectively. Besides, in terms of cities in the WMA, taking the result of 2014 as an example, the cities with the largest indicator weighted average of the water, soil, air environment, and other themes are all Wuhan.
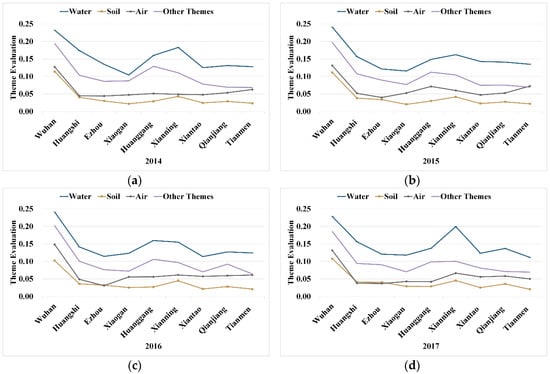
Figure 6.
Indicator weighted average of each theme, including water, soil, air environment, and other themes of IPEEI in (a) 2014, (b) 2015, (c) 2016, and (d) 2017 in the .
3.3.3. Comprehensive Evaluation Grades of the WMA
The comprehensive evaluation grades of the IPEEI model for the cities in the WMA from 2014 to 2017 are realized by means of the indicator weighted average and the GIS technology. The comprehensive evaluation of the indicator weighted average for all 75 indicators of IPEEI, and the time trend of the comprehensive evaluation from 2014 to 2017 in the WMA, are as shown in Figure 7. In terms of comprehensive evaluation, the results of each city from 2014 to 2017 in the WMA remain relatively stable for the same city; while the results of the different cities in the WMA are relatively different. For example, the comprehensive evaluation results of Wuhan from 2014 to 2017 are 67%, 68%, 69%, and 65%, which are all the highest in the WMA; while the comprehensive evaluation results of Wuhan, Xianning, Ezhou, and Xiaogan in 2014 are 67%, 39%, 29%, and 26%, respectively.
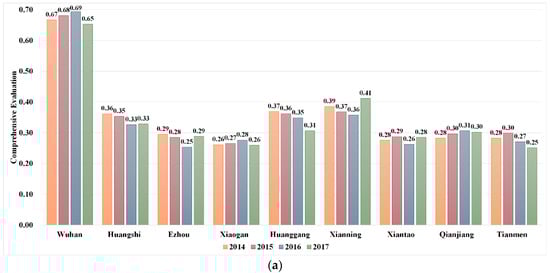
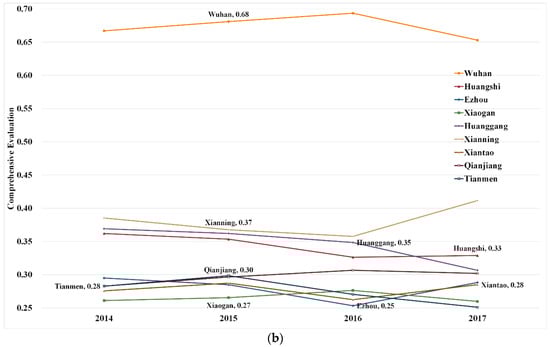
Figure 7.
Comprehensive evaluation and the time trend of IPEEI from 2014 to 2017 in the WMA: (a) Comprehensive evaluation of the indicator weighted average for all 75 indicators of IPEEI; (b) time trend of the comprehensive evaluation.
The Jenks natural breaks classification method of the geospatial analysis by the ArcGIS software [43] is used for the classification of the comprehensive evaluation of IPEEI for different cities. The Jenks natural breaks classification is based on natural grouping inherited from data with the well grouped of similar values and the maximized differences between classes, and the category boundary value of the method is set according to the position where the difference in data value is relatively large [44]. According to the Jenks natural breaks classification, the spatial distribution maps of the comprehensive evaluation grades for IPEEI from 2014 to 2017 in the WMA are as shown in Figure 8. The results are divided into four grades, and the darker the green, the higher the sustainability. The four types of the comprehensive evaluation grades are excellent, good, general, and poor, and the values are 1, 2, 3, and 4, respectively. The comprehensive evaluation grades vary for different cities from 2014 to 2017 in the WMA, but the grades in 2014 and 2015 are almost the same with slightly different graded boundary values. For example, for the four comprehensive evaluation grades of IPEEI in the WMA from 2014 to 2015, Level 1 city includes Wuhan with excellent sustainability; Level 2 cities include Xianning, Huanggang, and Huangshi with good sustainability; Level 3 cities include Ezhou, Qianjiang, Tianmen, and Xiantao with general sustainability; and Level 4 city includes Xiaogan with poor sustainability.
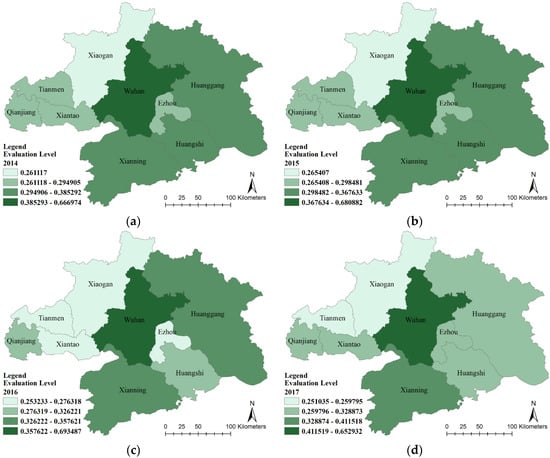
Figure 8.
Spatial distribution maps of the comprehensive evaluation grades for IPEEI in (a) 2014, (b) 2015, (c) 2016, and (d) 2017 in the WMA.
4. Discussion
4.1. Feasibility and Reliability of the IPEEI
The Ecological Index (EI) is a comprehensive indicator that defined in the standard of the Technical Criterion for Ecosystem Status Evaluation (HJ 192-2015) [45] by the Ministry of Ecology and Environment of the People’s Repub1ic of China, which is used to evaluate the ecological environment status and change trend of county, province, and ecological area. EI is composed of six sub-indexes, including biological richness index, vegetation coverage index, water network denseness index, land stress index, pollution load index, and environmental restriction index. The comprehensive evaluation of EI [45] is further calculated through the weights obtained by expert scoring method, and the formula is as follows:
According to the standard of the HJ 192-2015, EI takes the area with the best ecological environment status as 100 as a reference, and the value range is [0,100]. The evaluation descriptions of the ecological environment status for EI [45] is shown in Table 5. The original value of EI for different cities in the WMA from 2014 to 2017 (Figure 9a) can be divided into two grades: Xianning, with an excellent ecological environment status of high vegetation coverage, rich biodiversity, and stable ecosystem; and the other cities, with a good ecological environment status of relatively high vegetation coverage, relatively rich biodiversity, and suitability for life.
Table 5.
Evaluation descriptions of the ecological environment status for the Ecological Index (EI).
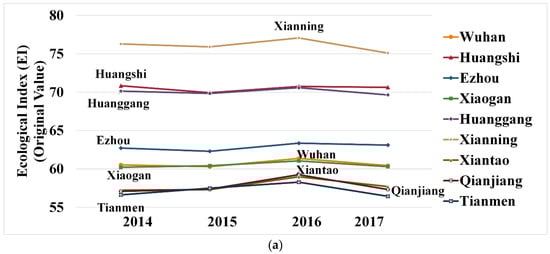
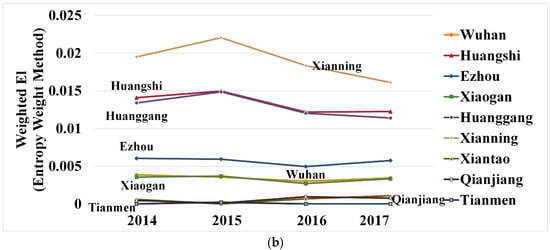
Figure 9.
Comparison between the original value of Ecological Index (EI) and the weighted EI of the entropy weight method for IPEEI in the WMA: (a) Original value of EI; (b) weighted El.
Compared to the original value of the EI, the weighted EI results of the entropy weight method for IPEEI in the WMA from 2014 to 2017 (Figure 9b) show that: (1) Xianning with the highest results in different years; (2) the same ranking of all the cities in the same year, which are all consistent with the original value of the EI, which prove the feasibility of IPEEI. Moreover, the change trends of the original EI and the weighted EI in the WMA are inconsistent in 2015 and 2016. For example, the original EI of Xianning in 2015 is lower than that of 2016, but its weighted EI is higher than that of 2016. That is because, unlike the numerical comparison that considers only the indicator of the EI, the weight determination of the weighted EI is according to the numerical comparison of all cities’ indicators of IPEEI in the same year, which is better to rank all cities for the comprehensive evaluation of IPEEI. Meanwhile, the weighted values of EI also retain the relative size of the original value for different cities. The abovementioned results reflect the reliability of the comprehensive evaluation for IPEEI.
4.2. Systematic Analysis of the IPEEI Model
Referring to the sustainability related standards of ISO and ITU [13,14,15,16,17,18], the proposed IPEEI model (Table 2) in this paper covers a comprehensive range, e.g., population, economy, meteorology, energy, municipal health, and ecological environment, and mainly focuses on the fields of water, soil, and air environment to meet the needs of ecological environment sustainability. For ecological environment standards, each organization and department have their own standards respectively, which leads to the insufficient problem of coordination among different standards. With the proposed three-level association mechanism of the Domain-Theme-Element, the IPEEI model is able to avoid the content of repetition, non-compatible and contradictory phenomenon, making the perception and evaluation of ecological environment be effectively applied in practical scenarios.
For the DPSIR framework, compared with the existing indicator research [32,33,34], the IPEEI model is not aimed at a single environmental problem, such as single environmental indicator calculation and risk assessment. The IPEEI model is able to provide the causal relationship chain of the DPSIR framework in ecological environment (Figure 3) for the specific indicator construction in smart sustainable cities. Additionally, the entropy weight method is used to analyze the indicator weight assignment to the sustainability of multi-dimensional (Figure 5) and multi-thematic (Figure 6) quantitative evaluation for the integrated water, soil, and air environment. Besides, relevant studies [35,36,37,38,39] focus on the relationship between urban sustainability and social and economic factors in time series, with less consideration and quantitative analysis of regional differences in sustainability level. For IPEEI, it is applied to the sustainability evaluation grades according to the indicator weighted average and Jenks natural breaks classification of the comprehensive analysis (Figure 7 and Figure 8).
4.3. Spatio-Temporal Variation of the IPEEI Evaluation
The spatio-temporal variation of the IPEEI comprehensive evaluation is analyzed from the multi-dimensional and multi-thematic aspects in the WMA from 2014 to 2017, as shown in Figure 10. In terms of the spatio-temporal variation, for the same city in different years, the IPEEI evaluation results of each dimension or theme from 2014 to 2017 in the WMA all remain relatively stable; while for different cities in the same year, the results are relatively different. In terms of the cities, for the driver, pressure, state, impact, and response dimensions, the representative cities with great influence are, respectively, Huanggang, Xianning, Xianning, Tianmen, and Wuhan; for the water, soil, air environment, and other themes, the representative cities with great influence are all Wuhan. Besides, given the trends of the comprehensive evaluation grades of IPEEI in the WMA from 2014 to 2017 (Figure 8), the relatively stable cities include Wuhan of Level 1, Xianning of Level 2, Qianjiang of Level 3, and Xiaogan of Level 4; the cities with declining trends include Huanggang and Huangshi from Level 2 to 3, and Tianmen from Level 3 to 4; and the cities with recovering trends include Xiantao and Ezhou from Level 4 to 3.
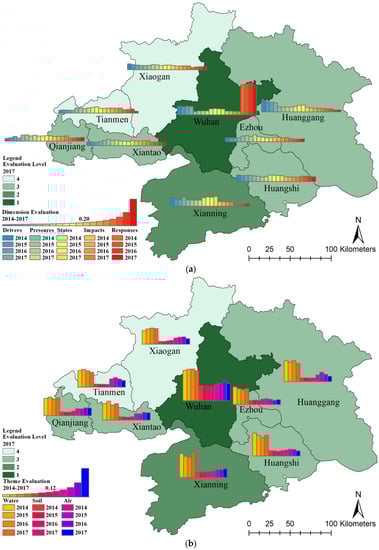
Figure 10.
Spatio-temporal distribution maps of the variation analysis for IPEEI from 2014 to 2017 in the WMA: (a) Dimension evaluations from 2014 to 2017 with the comprehensive evaluation grade in 2017; (b) theme evaluations from 2014 to 2017 with the comprehensive evaluation grade in 2017.
Moreover, considering the dimensions (Figure 5), water, soil, air (Figure 6), and other themes of population, economy, meteorology, energy, and municipal health of IPEEI (Figure 11), the spatio-temporal variation of multi-urban comprehensive evaluation in the WMA is analyzed. Wuhan is the typical city with the perfect response, the significant ecological environment proportion, and the excellent comprehensive evaluation grade in the WMA, which is benefited from its construction of municipal public facilities (e.g., R14), resource conservation (e.g., R1 and D10), pollution control (e.g., R7, R11, and R3), and urban landscaping (e.g., I8 and S12), etc. In spite of the heavy population pressure (e.g., P1, P4, P2, and P3), Xianning has the best environmental status, especially the highest EI (S1), under the environment-friendly economic development (e.g., D7, D4, and D5), which conforms to its “eco-city” position. Similar to Xianning, Qianjiang and Xiaogan also have greater population pressure, but the tertiary industry accounts for a lower proportion of GDP (D7) in their respective economic development structures, which reduces the sustainability of their urban development. While Xiaogan’s energy consumption and status (e.g., P16, I13, and I14) are more serious than Qianjiang, leading to its lower sustainable level. Besides, Huanggang, Tianmen, and Xiantao, as the light industrial cities with slight secondary industry development based on processing of agricultural and sideline products, also have high energy consumptions (e.g., P16, I13, and I14), but they are relatively leading, respectively, in economy (e.g., D7, D4, and D5), municipal health (e.g., R14 and R13), and population (e.g., P1, P4, P2 and P3), which also lead to different trends of sustainable comprehensive evaluation. For example, the ascending municipal health of Xiantao promotes its sustainable development, while the per capita regional GDP (e.g., D5) of Huanggang and the population pressure of Tianmen cause their trends to decline. It’s also worth pointing out that compared with Ezhou under the recovering trend of comprehensive evaluation, which is also a new industrial city with the rapid secondary industry development of energy material production, Huangshi should pay attention to environmental protection (e.g., S16, R13, and R14), while developing industry (e.g., D6). In fact, with the severe environmental status (e.g., S7, S13, and R13), the comprehensive evaluation level of Ezhou is low, so it still needs to improve the sustainable development of urban ecological environment. In general, the abovementioned results are relatively consistent with the overall and regional planning of the WMA [46,47] and measures taken by the local government to save energy and reduce emissions, optimize industrial structure, and strengthen infrastructure support.
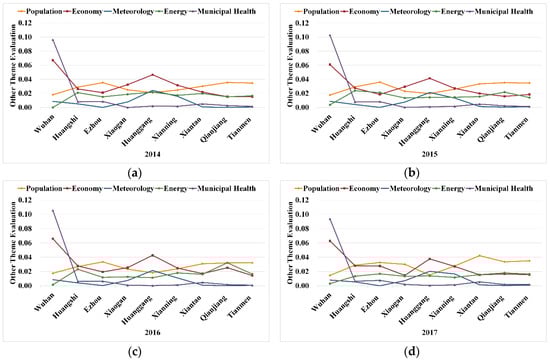
Figure 11.
Indicator weighted average of other themes, including population, economy, meteorology, energy, and municipal health of IPEEI in (a) 2014, (b)2015, (c) 2016, and (d) 2017 in the WMA.
5. Conclusions
To solve the problems of the inconsistency of standard and indicator definitions, single environment analysis, and the insufficient spatial resolution, considering the indicator construction and sustainability evaluation, IPEEI based on the DPSIR framework was proposed in this study integrating with the water, soil, and air environment. Referring to the sustainability related standards, the IPEEI model covers a comprehensive range, e.g., population, economy, meteorology, energy, municipal health, and ecological environment. In addition, the multi-dimensional, multi-thematic, and multi-urban quantitative evaluations using the entropy weight method, and the comprehensive evaluation grades according to the Jenks natural breaks classification method, were realized for the ecological environment sustainability. Taking the WMA as a case study, the reliability of IPEEI was verified by comparing the results with EI, and the results were also consistent with the planning and measures taken by the local government.
The results of the indicator construction and quantitative evaluation of IPEEI can be used for scenario analysis in the perception and evaluation of the urban ecological environment sustainability. IPEEI can also be adapted to the systematic analysis and spatio-temporal analysis for the sustainability assessment. However, due to the limited data access and spatiotemporal restrictions, some relevant indicators, such as the soil pH and wind speed, are needed for indicator extension in support of more precisely environmental components. This is the deficiency of IPEEI that needs to be improved in the future.
Author Contributions
Conceptualization, Y.L.; methodology, Y.L. and W.D.; software, Y.L.; validation, Y.L.; formal analysis, Y.L.; data curation, Y.L.; writing—original draft preparation, Y.L.; writing—review and editing, Y.L., W.D., N.C., and X.W.; supervision, W.D., N.C., and X.W.; project administration, W.D. and N.C. All authors have read and agreed to the published version of the manuscript.
Funding
This research was funded by the National Key Research and Development Program of China (Grant no. 2018YFB2100500), the Fundamental Research Funds for the Central Universities (Grant no. 2042020kf0011), the National Nature Science Foundation Program of China (Grant nos. 41890822, 41771422, 41971351), and the Creative Research Groups of Natural Science Foundation of Hubei Province of China (Grant no. 2016CFA003).
Acknowledgments
The authors are grateful to the City Statistical Yearbook of each city in the Wuhan Metropolitan Area, and the Statistical Communique of Hubei Province on the National Economic and Social Development from the Hubei Provincial Bureau of Statistics (http://tjj.hubei.gov.cn), the China Statistical Yearbook on Environment, and the China City Statistical Yearbook from the National Bureau of Statistics (http://www.stats.gov.cn), the Urban Construction Statistical Yearbook from the Ministry of Housing and Urban-Rural Development of the People’s Republic of China (http://www.mohurd.gov.cn), the Environmental Situation Bulletin of each city in the Wuhan Metropolitan Area, the Environmental Situation Bulletin of Hubei Province, the City Water Resources Bulletin of each city in the Wuhan Metropolitan Area, and the Water Resources Bulletin of Hubei Province from the Department of Ecology Environment of Hubei Province (http://sthjt.hubei.gov.cn/) and the Wuhan Ecology and Environment Bureau (http://hbj.wuhan.gov.cn/). The authors are also grateful to anyone for their advice and help about this manuscript.
Conflicts of Interest
The authors declare no conflict of interest.
References
- Tian, H.; Lindenmayer, D.B.; Wong, G.T.W.; Mao, Z.; Huang, Y.; Xue, X. A methodological framework for coastal development assessment: A case study of Fujian Province, China. Sci. Total Environ. 2018, 615, 572–580. [Google Scholar] [CrossRef] [PubMed]
- Zuo, X.; Hua, H.; Dong, Z.; Hao, C. Environmental Performance Index at the Provincial Level for China 2006–2011. Ecol. Indic. 2017, 75, 48–56. [Google Scholar] [CrossRef]
- Chen, Y.; Zhou, H.; Zhang, H.; Du, G.; Zhou, J. Urban flood risk warning under rapid urbanization. Environ. Res. 2015, 139, 3–10. [Google Scholar] [CrossRef] [PubMed]
- Ibrahim, M.; El-Zaart, A.; Adams, C. Smart sustainable cities roadmap: Readiness for transformation towards urban sustainability. Sustain. Cities Soc. 2018, 37, 530–540. [Google Scholar] [CrossRef]
- International Telecommunication Union Focus Group on Smart Sustainable Cities (ITU-T FG-SSC). Technical Report on Smart Sustainable Cities: An Analysis of Definitions; ITU-T FG-SSC; United Nations: New York, NY, USA, 2014. [Google Scholar]
- International Telecommunication Union Focus Group on Smart Sustainable Cities (ITU-T FG-SSC). Shaping Smarter and More Sustainable Cities: Striving for Sustainable Development Goals; ITU-T FG-SSC; United Nations: New York, NY, USA, 2016. [Google Scholar]
- Azevedo Guedes, A.; Carvalho Alvarenga, J.; dos Santos Sgarbi Goulart, M.; Rodriguez y Rodriguez, M.; Pereira Soares, C. Smart Cities: The Main Drivers for Increasing the Intelligence of Cities. Sustainability 2018, 10, 3121. [Google Scholar] [CrossRef]
- Yigitcanlar, T.; Hewa Heliyagoda Kankanamge, R.N.E.; Butler, L.; Vella, K.; Desouza, K. Smart Cities Down Under: Performance of Australian Local Government Areas; Queensland University of Technology: Brisbane, QLD, Australia, 2020. [Google Scholar]
- Yigitcanlar, T.; Kamruzzaman, M.; Buys, L.; Perveen, S. Smart Cities of the Sunshine State: Status of Queensland’s Local Government Areas—2018 Summary Report; Queensland University of Technology: Brisbane, QLD, Australia, 2018. [Google Scholar]
- Lombardi, P.; Giordano, S.; Farouh, H.; Yousef, W. Modelling the smart city performance. Innov. Eur. J. Soc. Sci. Res. 2012, 25, 137–149. [Google Scholar] [CrossRef]
- Bhattacharya, T.R.; Bhattacharya, A.; McLellan, B.; Tezuka, T. Sustainable smart city development framework for developing countries. Urban Res. Pract. 2018, 13, 180–212. [Google Scholar] [CrossRef]
- Carli, R.; Dotoli, M.; Pellegrino, R. Multi-criteria decision-making for sustainable metropolitan cities assessment. J. Environ. Manag. 2018, 226, 46–61. [Google Scholar] [CrossRef]
- International Organization for Standardization (ISO). Sustainable Development of Communities—Indicators for City Services and Quality of Life; ISO 37120:2014; ISO: Geneva, Switzerland, 2014. [Google Scholar]
- International Organization for Standardization (ISO). Sustainable Cities and Communities—Indicators for City Services and Quality of Life; ISO 37120:2018; ISO: Geneva, Switzerland, 2018. [Google Scholar]
- International Telecommunication Union Focus Group on Smart Sustainable Cities (ITU-T FG-SSC). Key Performance Indicators Related to the Use of Information and Communication Technology in Smart Sustainable Cities; ITU-T Y.4901/L.1601; ITU-T FG-SSC; United Nations: Geneva, Switzerland, 2016. [Google Scholar]
- International Telecommunication Union Focus Group on Smart Sustainable Cities (ITU-T FG-SSC). Key Performance Indicators Related to the Sustainability Impacts of Information and Communication Technology in Smart Sustainable Cities; ITU-T Y.4902/L.1602; ITU-T FG-SSC; United Nations: Geneva, Switzerland, 2016. [Google Scholar]
- International Telecommunication Union Focus Group on Smart Sustainable Cities (ITU-T FG-SSC). Key Performance Indicators for Smart Sustainable Cities to Assess the Achievement of Sustainable Development Goals; ITU-T Y.4903/L.1603; ITU-T FG-SSC; United Nations: Geneva, Switzerland, 2016. [Google Scholar]
- Standardization Administration of the P.R.C. Evaluation Indicators for New-Type Smart Cities; GB/T 33356-2016; China National Information Technology Standardization Network: Beijing, China, 2016. (In Chinese) [Google Scholar]
- The State Council of the P.R.C. China’s National Plan on Implementation of the 2030 Agenda for Sustainable Development; United Nations: New York, NY, USA, 2016.
- Chen, J.; Peng, S.; Zhao, X.; Ge, Y.; Li, Z. Measuring regional progress towards SDGs by combining geospatial and statistical information. Acta Geod. Cartogr. Sin. 2019, 48. (In Chinese) [Google Scholar] [CrossRef]
- Big Earth Data Program Chinese Academy of Sciences. Big Earth Data in Support of the SustainabIe DeveIopment GoaIs; Chinese Academy of Sciences: Beijing, China, 2019. [Google Scholar]
- Chen, J.; Liu, W.; Wu, H.; Li, Z.; Zhao, Y.; Zhang, L. Basic Issues and Research Agenda of Geospatial Knowledge Service. Geomat. Inf. Sci. Wuhan Univ. 2019, 44. (In Chinese) [Google Scholar] [CrossRef]
- Chen, J. Framing the Spatio-Temporal Changes in Global Cultivated Land Using GlobeLand30. Sci. Agric. Sin. 2018, 51. (In Chinese) [Google Scholar] [CrossRef]
- Gao, P.; Wang, X.; Wang, H.; Cheng, C. Viewpoint: A correction to the entropy weight coefficient method by Shen et al. for accessing urban sustainability (Cities 42 (2015) 186–194). Cities 2020, 103, 102742. [Google Scholar] [CrossRef]
- Shen, L.; Zhou, J.; Skitmore, M.; Xia, B. Application of a hybrid Entropy–McKinsey Matrix method in evaluating sustainable urbanization: A China case study. Cities 2015, 42, 186–194. [Google Scholar] [CrossRef]
- Sun, C.; Wu, Y.; Zou, W.; Zhao, L.; Liu, W. A Rural Water Poverty Analysis in China Using the DPSIR-PLS Model. Water Resour. Manag. 2018, 32, 1933–1951. [Google Scholar] [CrossRef]
- Leng, S.; Zhai, Y.; Jiang, S.; Lei, Y.; Wang, J. Water-environmental risk assessment of the Beijing-Tianjin-Hebei collaborative development region in China. Hum. Ecol. Risk Assess. Int. J. 2016, 23, 141–171. [Google Scholar] [CrossRef]
- Zhou, G.; Singh, J.; Wu, J.; Sinha, R.; Laurenti, R.; Frostell, B. Evaluating low-carbon city initiatives from the DPSIR framework perspective. Habitat Int. 2015, 50, 289–299. [Google Scholar] [CrossRef]
- Gari, S.R.; Newton, A.; Icely, J.D. A review of the application and evolution of the DPSIR framework with an emphasis on coastal social-ecological systems. Ocean Coast. Manag. 2015, 103, 63–77. [Google Scholar] [CrossRef]
- Sekovski, I.; Newton, A.; Dennison, W.C. Megacities in the coastal zone: Using a driver-pressure-state-impact-response framework to address complex environmental problems. Estuar. Coast. Shelf Sci. 2012, 96, 48–59. [Google Scholar] [CrossRef]
- Organization of Economic Cooperation and Development; Group on the State of the Environment. OECD Core Set of Indicators for Environmental Performance Reviews, Environmental Monograph No.83; OECD: Paris, France, 1993.
- Apostolaki, S.; Koundouri, P.; Pittis, N. Using a systemic approach to address the requirement for Integrated Water Resource Management within the Water Framework Directive. Sci. Total Environ. 2019, 679, 70–79. [Google Scholar] [CrossRef]
- Zare, F.; Elsawah, S.; Bagheri, A.; Nabavi, E.; Jakeman, A.J. Improved integrated water resource modelling by combining DPSIR and system dynamics conceptual modelling techniques. J. Environ. Manag. 2019, 246, 27–41. [Google Scholar] [CrossRef]
- Lange, B.; Holman, I.; Bloomfield, J.P. A framework for a joint hydro-meteorological-social analysis of drought. Sci. Total Environ. 2017, 578, 297–306. [Google Scholar] [CrossRef] [PubMed]
- Jia, X.; O’Connor, D.; Hou, D.; Jin, Y.; Li, G.; Zheng, C.; Ok, Y.S.; Tsang, D.C.W.; Luo, J. Groundwater depletion and contamination: Spatial distribution of groundwater resources sustainability in China. Sci. Total Env. 2019, 672, 551–562. [Google Scholar] [CrossRef] [PubMed]
- Wu, H.; Yu, Y.; Li, S.; Huang, K. An Empirical Study of the Assessment of Green Development in Beijing, China: Considering Resource Depletion, Environmental Damage and Ecological Benefits Simultaneously. Sustainability 2018, 10, 719. [Google Scholar] [CrossRef]
- Wang, W.; Sun, Y.; Wu, J. Environmental Warning System Based on the DPSIR Model: A Practical and Concise Method for Environmental Assessment. Sustainability 2018, 10, 1728. [Google Scholar] [CrossRef]
- Jia, Y.; Shen, J.; Wang, H.; Dong, G.; Sun, F. Evaluation of the Spatiotemporal Variation of Sustainable Utilization of Water Resources: Case Study from Henan Province (China). Water 2018, 10, 554. [Google Scholar] [CrossRef]
- Qiao, W.; Sun, X.; Jiang, P.; Wang, L. Analysis of the Environmental Sustainability of a Megacity through a Cobenefits Indicator System—The Case of Shanghai. Sustainability 2020, 12, 5549. [Google Scholar] [CrossRef]
- Shannon, C.E. A mathematical theory of communication. Bell Syst. Tech. J. 1948, 27, 379–423. [Google Scholar] [CrossRef]
- Gao, P.; Li, Z.; Zhang, H. Thermodynamics-Based Evaluation of Various Improved Shannon Entropies for Configurational Information of Gray-Level Images. Entropy 2018, 20, 19. [Google Scholar] [CrossRef]
- Yang, X.; Ma, C.; Zhang, A. Decomposition of Net CO2 Emission in the Wuhan Metropolitan Area of Central China. Sustainability 2016, 8, 784. [Google Scholar] [CrossRef]
- De Smith, M.J.; Goodchild, M.F.; Longley, P.A. Geospatial Analysis—A Comprehensive Guide, 6th ed.; The Winchelsea Press: London, UK, 2018. [Google Scholar]
- Natural Breaks (Jenks). Available online: http://webhelp.esri.com/arcgisdesktop/9.2/index.cfm?TopicName=Natural_breaks_(Jenks) (accessed on 28 July 2020).
- Ministry of Ecology and Environment of the P.R.C. Technical Criterion for Ecosystem Status Evaluation; HJ 192-2015; Ministry of Ecology and Environment of the P.R.C.: Beijing, China, 2015. (In Chinese)
- Hubei Provincial Development and Reform Commission. Outline of the Overall Plan for the Wuhan Metropolitan Area. Available online: http://fgw.hubei.gov.cn/fbjd/xxgkml/ghjh/201703/t20170327_1543776.shtml (accessed on 28 July 2020). (In Chinese)
- Hubei Provincial Development and Reform Commission. Regional Development Plan of the Wuhan Metropolitan Area (2013–2020). Available online: http://fgw.hubei.gov.cn/fbjd/xxgkml/ghjh/201703/t20170327_1543802.shtml (accessed on 28 July 2020). (In Chinese)
© 2020 by the authors. Licensee MDPI, Basel, Switzerland. This article is an open access article distributed under the terms and conditions of the Creative Commons Attribution (CC BY) license (http://creativecommons.org/licenses/by/4.0/).