Article

Green Infrastructures in the Peri-Urban Landscape: Exploring Local Perception of Well-Being through ‘Go-Alongs’ and ‘Semi-Structured Interviews’

by
Rocío Santo-Tomás Muro
*,
Carlota Sáenz de Tejada Granados
and
Eva J. Rodríguez Romero
Department of Architecture and Design, Institute of Technology, Montepríncipe Campus, Universidad San Pablo CEU, CEU Universities, 28668 Madrid, Spain
*
Author to whom correspondence should be addressed.
Sustainability 2020, 12(17), 6836; https://doi.org/10.3390/su12176836
Submission received: 27 July 2020 / Revised: 20 August 2020 / Accepted: 21 August 2020 / Published: 23 August 2020

Abstract

:
Providing conditions for health and well-being, especially for those most exposed to social and environmental inequalities, is a precondition for sustainable development. Green infrastructures in peri-urban areas have the potential to improve the quality of life of locals by fostering healthy practices, providing views, or bringing nature closer to the city. This work explores the local perception of well-being within urban green infrastructures (UGI) in the peri-urban fringe of Madrid (Spain) through a combination of qualitative methods: “go-alongs” and “semi-structured static interviews”. The grounded-theory based codification of the data using NVivo software and their subsequent analysis results in the identification of social, natural, and perceptual elements that prove to play a relevant role in locals’ perception of well-being. Among these, connectivity with other green spaces, panoramic views and place-based memories are aspects that seem to make UGI serve the community at its full potential, including perceived physical and psychological well-being. We identify in each case study both positive characteristics of UGI and dysfunctional aspects and areas of opportunity. Lastly, a methodological, geographical, and theoretical discussion is made on the relevance of the case studies and pertinence of the two interview methods as valuable tools for analysis and intervention in the peri-urban landscape.

Graphical Abstract

1. Introduction

One of the main characteristics of the late 20th and early 21st century has been its rapid urbanization process, based on a substantial population growth, especially significant in the south-eastern countries of Europe [1]. The speed, pace and magnitude of these changes in the territory have made the identification and study of the main forces of change in the landscape a current and fundamental issue [2,3].
Peri-urban areas in Europe are growing four times faster than urban areas; more so, they are predicted to double in surface in the next 30 to 50 years [4]. These areas are subject to strong pressure to be urbanized, largely due to the accessibility that highways (among other grey infrastructures) offer, traversing these territories and connecting them with the city center. The peri-urban landscape has its own language and distinguishing elements [5], among which are the urban green infrastructures (UGI), which trespass the administrative boundaries of the city and define the expansion and morphology of these ‘areas of influence’. Additionally, known as ‘buffer zones’, UGI are often designed to soften the effects of urbanization in favor of a sustainable development in a process of ‘renaturation’ that, unfortunately, often ends up filling the pieces of wasteland in between grey infrastructures [6].
Goal 11 of the 2030 Agenda for Sustainable Development adopted by all United Nations Member States in 2015, entitled “Making cities and human settlements inclusive, safe, resilient and sustainable”, states the need for cities and communities to protect their natural and cultural heritage. One of these measures is the provision of universally accessible and inclusive green and public spaces in cities, considering the economic, social, and ecological links between urban and peri-urban spaces.
In this article, we explore the local perception of well-being within urban green infrastructures in the peri-urban area, aiming to address the following question: Do UGI in peri-urban contexts foster or prevent a feeling of overall well-being in the residents who frequently visit them?
To do so, we assess non-expert views through a combination of qualitative methods: “go-alongs” and “semi-structured static interviews”, carried out in the peri-urban fringe of Madrid (Spain). The analysis results in the identification of social, natural, and perceptual elements that prove to play a relevant role in the local’s perception of well-being. Findings also uncover valuable information on how (and how much) these public spaces are being used by the neighbors, identifying in each case study both positive characteristics of UGI, dysfunctional aspects and areas of opportunity.
This approach aims to provide new, contrasted tools to the existing toolset for those agents involved in the design and management of our environment, as well as bringing forward a new viewpoint towards the (often neglected) everyday landscapes surrounding large cities such as Madrid.

1.1. Urban Green Infrastructures

The concept of green infrastructure (GI) is broad and has varied according to the urban, social and political context. Although the concept as we know it today was coined at the beginning of the 21st century, throughout history, some green spaces have acted as precedents. The Emerald Necklace project in Boston by Frederick Law Olmster (1894), or the Garden City Movement initiated by Ebenezer Howard in 1898, are two examples of how nature inserted in the city as a system could change urban settings even before the formal definition of GI.
At present, we refer to urban green infrastructure (UGI) when we speak of an interconnected network of green spaces in urban areas. UGI deliver a wide range of ecosystem services, and their most representative factors are connectivity, multifunctionality, and accesibility. The European Commission in 2013 defined green infrastructure as a “successfully tested tool for providing ecological, economic and social benefits through natural solutions” [7]. Another definition of UGI is “the resilient landscapes that support ecological, economic and human interests by maintaining the integrity of, and promoting landscape connectivity, whilst enhancing the quality of life, place and the environment across different landscape boundaries” [8]. Overall, UGI acts as a network system, rather than an isolated space.
The natural spaces composing UGI act as a response to a growing fragmentation of landscape, linking urban and natural spaces together. In contrast, grey infrastructures connect spaces providing services to the city, but at the same time, contribute to the fragmentation of the territory, leaving voids that are often difficult to integrate within the urban fabric [9]. Although there are different competences attributed to either ‘green’ or ‘grey’ infrastructures, the fact is that the boundaries between one and another are often blurred, and therefore, act as a ‘grey-green continuum’ [10]. For instance, cycleways could be classified as part of both a grey and a green infrastructure.
Cities must combine both types of infrastructures to create a solid network system (e.g., metropolitan parks should have a solid transportation system surrounding them to enable accessibility). However, usually in cities, and more pointedly, in their peri-urban areas, grey infrastructure has been built first, to which green spaces have later been subordinated. This process should be the other way around; a strategic design of UGI should lead to a reduction of grey infrastructure, and therefore, to a reduction of its environmental impact.
The benefits of UGI range from environmental, to social and economic gains. In terms of environmental assets, UGI favor the principles of ecology, boosts biodiversity and helps mitigate the effects of climate change or ‘heat island’ effect [11]. Economic benefits include tourist attraction, promotion of entrepreneurship, or increase of property value [12]. From a social perspective, UGI play a key role in the improvement of physical and mental health, enabling contact with the community and boosting the identity and sense of place, which can lead to both eco-friendly designs and land conservation plans—“when people have some assurance that special places will be saved, they become more amenable to accommodating new development” [13]. Moreover, UGI located in peri-urban areas can potentially act as ‘buffer zones’, softening the effects of urbanization in favor of a more sustainable development [6].
Every UGI system comprises two types of elements: ‘nodes’ and ‘corridors’ (also known as ‘hubs’ and ‘links’) [13]. Nodes are the network anchors, while corridors are continuous portions of land that enable the connection between areas, linking the nodes and allowing connectivity throughout the network. The relevance of this connectivity (within the UGI, and of the UGI with its surrounding urban environment) is such that the European Union encourages the principal nodes of a city to be part of the Natura 2000 network [7].
In this context, there is a growing need to document and analyze the impact of UGI, especially from the perspective of landscape perception [14]. Despite the growing presence of recent literature assessing the effects of UGI in urban settings (e.g., [15,16]), and some cities implementing strategic plans towards green infrastructure design and management, most cases only develop individual projects of green spaces without conceiving these areas as part of a network system. Particularly, the urban fringe of the city of Madrid (as in the case of many large cities) suffers from a lack of holistic planning of its green infrastructure network.

1.2. Green Spaces, Local Perception and Well-Being

The World Health Organization (in its Constitution in 1946) defined health as “a state of complete physical, mental and social well-being and not merely the absence of disease or infirmity.” Research attention towards a positive relationship between people and their everyday environment in urban settings has led to the concept of ‘urban livability’ [17,18]: A term that contends that quality is not an attribute inherent in the environment, but is a behavior-related function of the interaction of environmental characteristics and person characteristics [19]. Therefore, in order to obtain a proper understanding of urban environmental quality and how it affects our everyday life, it is necessary to employ both objective and subjective evaluations [19,20].
As research in the 1970s anticipated (e.g., [21]) positive health effects of viewing landscapes which have been associated mainly to what are defined as ‘natural’ landscapes (for instance, short-term recovery from stress or mental fatigue [22], or long-term overall impreovement on people’s heath and well-being), while urban settings are often found to have a less positive (and sometimes negative) effect on health [23]. Exercising while being exposed to ‘natural’ environments (‘green exercising’) has also proven to have a sinergistic effect, producing positive effects not only from the exercising itself, but also in terms of improving self-esteem [24]. However, the quality and accessibility of these green spaces affects its use for physical activity [15], proving to be strong determinants of whether locals fully benefit from green spaces in terms of health outcomes.
Studies point to the greening of living environments as a promising tool for enhancing public health [25]. The benefits of providing landscaping or nature-like views in urban areas extend beyond aesthetics, including psychological ‘payoffs’ as higher levels of positive affect [21], or healthier everyday practices [26]. In this sense, UGI should provide long-term, landscape-specific ecosystem services essential for maintaining and improving human well-being; the very definition of landscape sustainability [27].
Finding ways to address this relation between local residents and UGI is especially relevant to those studying and holding responsibility for the built environment [28], resource management, public health, or agents considering interventions aimed to support the well-being of individuals and communities. In addition, and given the current context of growing valorization of ‘non-expert’ (or non-technical) knowledge as valuable input in placemaking processes, uncovering local narratives and perspectives seems particularly pertinent [29]. Especially since the European Landscape Convention defined ‘landscape’ as “an area, as perceived by people, whose character is the result of the action and interaction of natural and/or human factors” [30].

1.3. A Qualitative Approach: Semi-Structured Interviews and Go-Alongs

Much research has been carried out on the relationship, assessment and understanding of people and their surrounding environment, whether natural or urban. Landscape perception is a framework that allows us to study the different ways of approaching and experiencing the environment, identifying the characteristics that are most relevant during said experience. The study of experience depends largely on subjective aspects. Qualitative tools, generally used in the field of social sciences, allow different perspectives to be evaluated in the same research. Furthermore, qualitative research tools largely rely on specific social patterns, in order to move away from great generalities about the notions of place, thus putting the focus on more individualized and personal elements than quantitative techniques do [31].
In general, qualitative research is based on four principles: understanding the meaning of participants’ responses, investigating the influences provided by the context, understanding the processes that lead to the results, and admitting the subjectivity of the researcher himself [32]. Among the wide array of qualitative techniques, interviews (in multiple modalities) have become a very valuable source of information. The researchers’ role is to decide what type and characteristics these interviews should have, so that they can be adapted to the type of study being carried out, which is reflected in the type of questions (and answers) that shape the interview. Usually, the more open the question, the more the interviewee has the option of responding in his/her own words, although there is a risk that it will not touch on crucial issues that are the subject of the research [33].
Semi-structured interviews (SSIs) are based on a given script that organizes the interview, combined with some open-ended questions, where the interviewee is allowed to elaborate on his or her answers. SSIs’ adaptability, combined with a certain structure, have been determining factors for their use in diverse research projects concerning landscape perception (e.g., [34,35,36]).
In turn, go-alongs, or “walking interviews”, have proven to “empower” the participant during the interview and help the researcher build rapport with the community [37]. The dynamic nature of go-along interviews constitutes a technique of great phenomenological sensitivity, particularly suited to explore environmental perception, spatial practices, biographies, social architecture and social realms [38]. With the potential to access the transcendent and reflective aspects of lived experience in situ, this qualitative research tool has also been deemed appropriate in uncovering memories associated with seemingly ordinary landscape features of the peri-urban landscape [39]; proving its use for planners to better appreciate the sense of place of long-term residents and stimulate the process of place-making on new housing estates. Conducted in several forms and formats, this technique has been deployed in recent studies on commuting practices [40], memory mapping and micro-geographies in ordinary landscapes [39,41,42], or on the implications of place in health and well-being [37,43].
In the following sections, we present the case study in the south-east fringe of Madrid, and the selection of three UGI where field work was conducted. Findings are analyzed considering all three areas together, separately (in order to compare among UGI), and noting the variability in the discoveries depending on which perception assessment interview technique was used: semi-structured interviews or go-alongs.

2. Materials and Methods
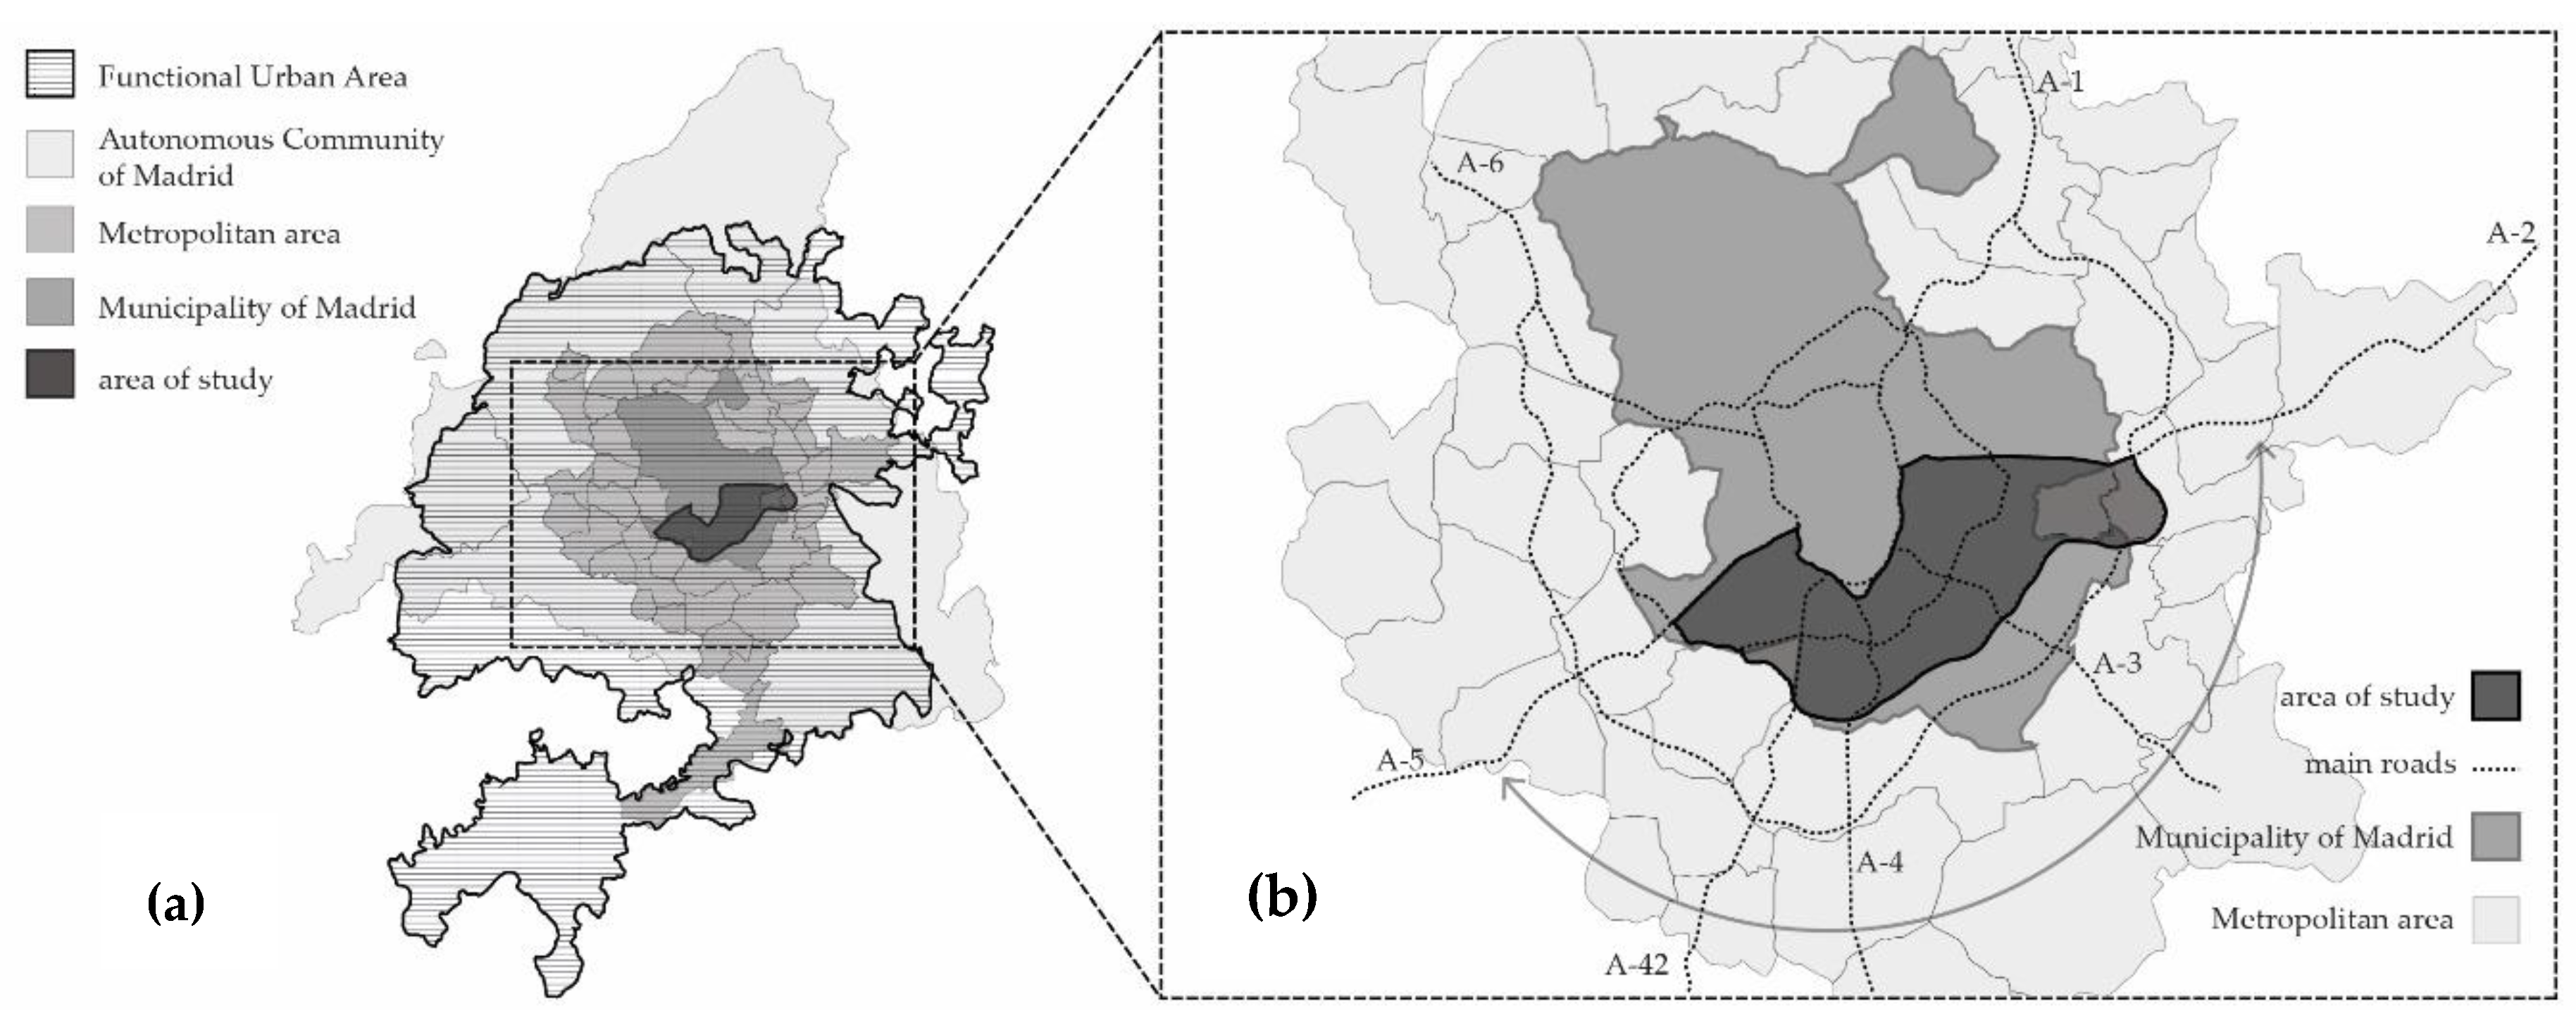
2.1. Case Study

Madrid is one of the main functional urban areas (FUA) in Europe [44], showing very high weighted density up to 30 km from the city center [45]. According to the mapping of the FUA by Eurostat Statistical Atlas 2017 (Figure 1a), the urban core comprises the municipality of Madrid, but also several surrounding municipalities which, together, draw a compact center that tends to grow along the main highway network.
The strong presence and influence of these grey infrastructures has determined the structure and morphology of such densely populated areas on the fringe of the urban core throughout the last decades [46], leading (in concert with other political and socio-economic factors) to ongoing peri-urban conflicts in terms of fragmentation, pollution, or lack of human scale and quality of life. In particular, in the south-east arch (Figure 1b), which combines a generally barren soil and less appealing landscape with an abundance of large infrastructures servicing the city center (highways, train tracks, electrical substations, water treatment plants, wastelands, etc.). Recent studies have identified an ‘explosion’ of vulnerability indicators (social, economic and physical) in these neighborhoods during 1991–2011 period [47], while landscape reports on the region and municipality of Madrid [48,49,50] either attend exclusively to natural landscapes (hence leaving the urban mesh out of its scope of interest), or lack the metropolitan scale needed to analyze the role and potential of UGI in this area.
Within this south-east fringe of the city, we select three areas with a high presence of urban green infrastructure (UGI) to conduct the field work (Figure 2):
-
Area A: UGI of Cuña Verde La Latina and its continuation towards the north (to Casa de Campo)
-
Area B: UGI of Parque Lineal del Manzanares and its continuation towards the south.
-
Area C: UGI of Cuña Verde de Moratalaz and its continuation towards the east.

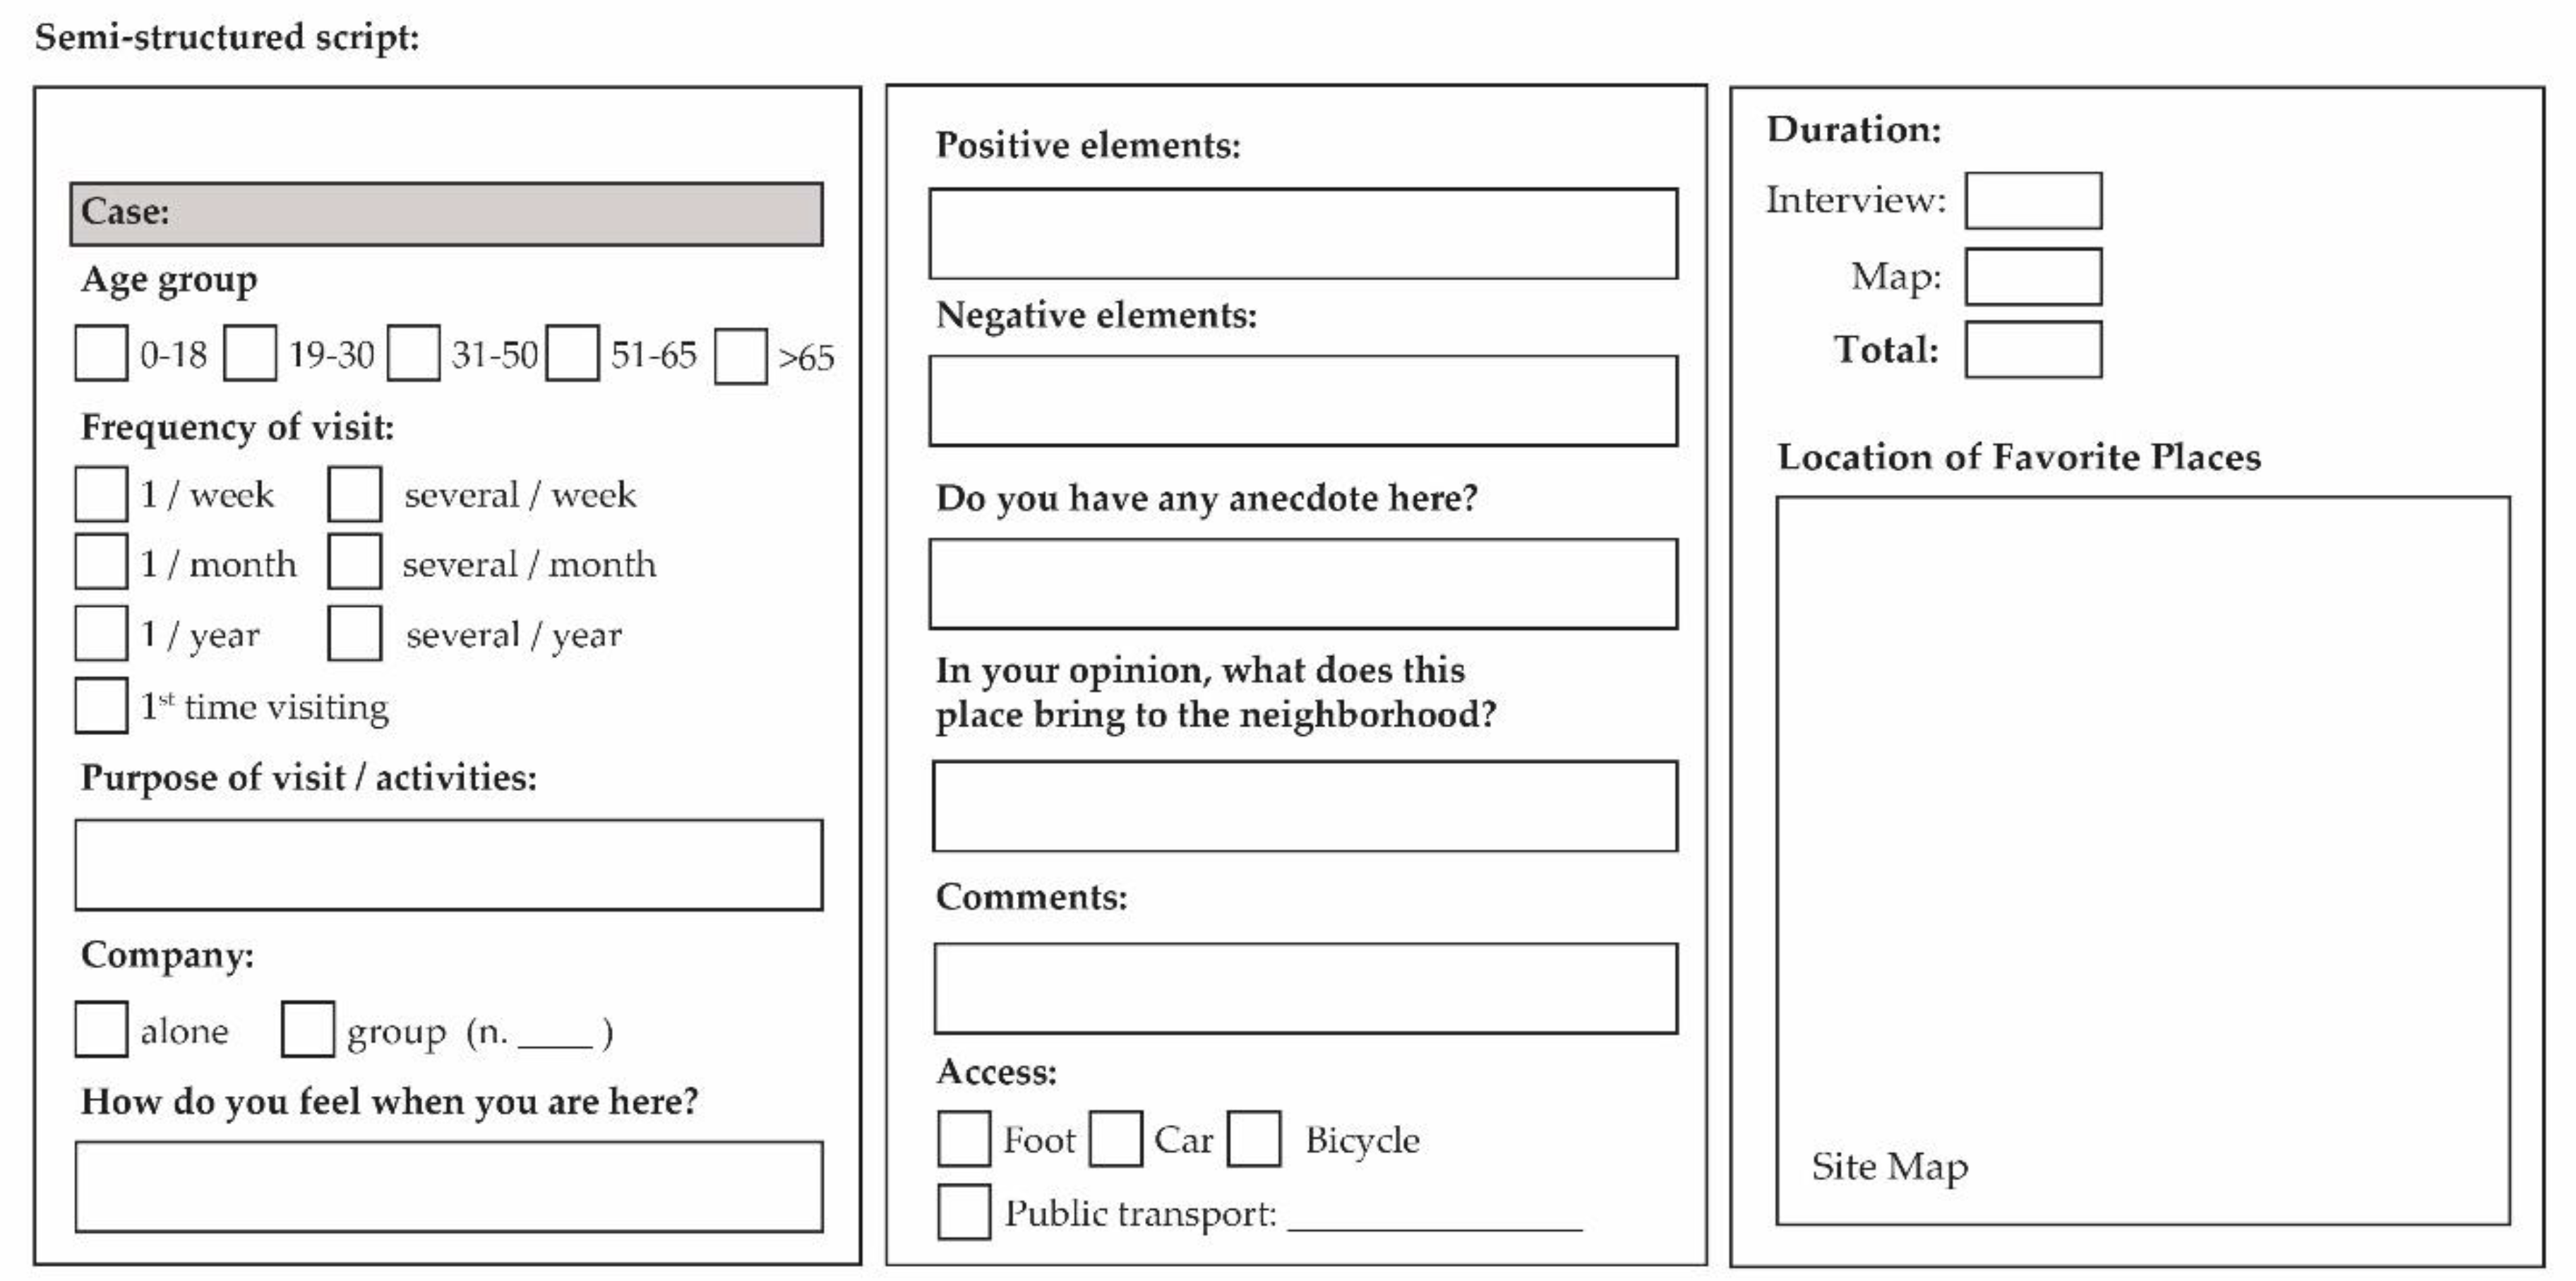
2.2. Field Work: Participant Observation and Perception Assessment Interviews

A combination of qualitative techniques comprises participant observation by the research team, as well as two types of interviews in order to collect the narratives and perceptions of the local residents who live and walk these peri-urban landscapes. Field work was carried out by the first two authors in spring of 2018 and summer of 2019, generally during weekday mornings (Figure 3). It was conducted in two time periods: For areas B and C, it started in 2018 as part of a larger characterization of the peri-urban landscape of Madrid (State Plan Project of the Spanish Ministry of Economy and Competitiveness, code HAR2014-57843-R; for further information on the project, see [14] and [51]), whereas area A was included later in the project and field work here was carried out in the summer of 2019.
Area A was included, in light of the publication in late 2018, of the geographical extent of the vulnerability belt around Madrid [47] (which included this area within the most vulnerable SE arch around Madrid). A second reason for including area A in the study was the Municipality’s plan to modify this area in contact with the A5 highway in the coming years, with the intention to change traffic flows to and from the city center and diminish the impact of this grey infrastructure on the surrounding neighborhoods. Though the final design of this intervention is still pending, it should include an improvement over the current state of the UGI in this area, and in this sense, collecting ‘clues’ from the locals could be very helpful at this stage. As an ample body of literature has stated before (e.g., [39,52]), urban expansion and renewal often comes at risk of losing certain elements or features of the existing landscape which are especially valuable to the locals. For this reason, go-along interviews were conducted in area A, being a suitable technique to explore issues of the place-attachment [38,41], as shown in the following sections.
For each field visit, firstly, participant observation of the area was carried out. This consisted of a description of the experience when first approaching the site, noting the environmental conditions and first impressions while walking around the area. In addition, pictures were taken throughout the walk. After this, the authors would approach locals present in the area to carry out one of the following perception assessment interviews, each type with its own set of rules and parameters:
-
Semi-structured static interviews, when located in a viewpoint of the UGI, or
-
Go-alongs, when located in less consolidated areas of the UGI and its immediate surroundings.
For the semi-structured interviews, before the field work, a script with a series of questions and possible topics was prepared (Figure 4). As the interview proceeded, we added conversational questions based on the answers, with topics emerging from the participant’s interests, allowing for further development of the original questions. This flexibility makes the concepts arising faithful to the interviewees’ experience of the place, instead of them simply filling out a questionnaire with closed answers. The use of a similar structure in every interview enables the subsequent comparison between cases and individuals.
The set of questions include naming the positive and negative elements of the environment, describing how they felt in the site, telling an anecdote that took place in that location, or commenting on what he or she thinks the space brings to the neighborhood. Data collection included the frequency of the participant’s visits to the site and how he or she accesses it. After these questions, the participants are asked to locate their favorite places on a map. Although some managed to locate them on said map, in most cases, this part consisted of making a list of preferred places, which the researcher later located on the map for the final record of the field work. Interviews were performed both individually or in groups, assessing both individual and collective experiences, and lasted an average of 10 minutes, although the time per interview was not limited.
The go-along interviews are ‘walking conversations’ taking place in the public space and lasting at least 10 minutes. In this case, “natural go-alongs” (instead of “contrived go-alongs”) are considered the most suitable form of walking conversations, given their potential to “empower” the participant [38] and build rapport with the community [37]. Carrying out these natural go-alongs entailed approaching people present in the area at that time and asking succinctly about the area. If the participant is willing, the researcher would then accompany the participant through his or her walk, asking as few questions as possible to avoid inducing topics or interfering in the participant’s narrative. The duration of the go-alongs varies greatly from one case to another, however, conversations under 10 minutes are not considered as they do not provide sufficient place-based information, in accordance with existing literature on the method (e.g., [39]) and in view of the results during the field work for this study.

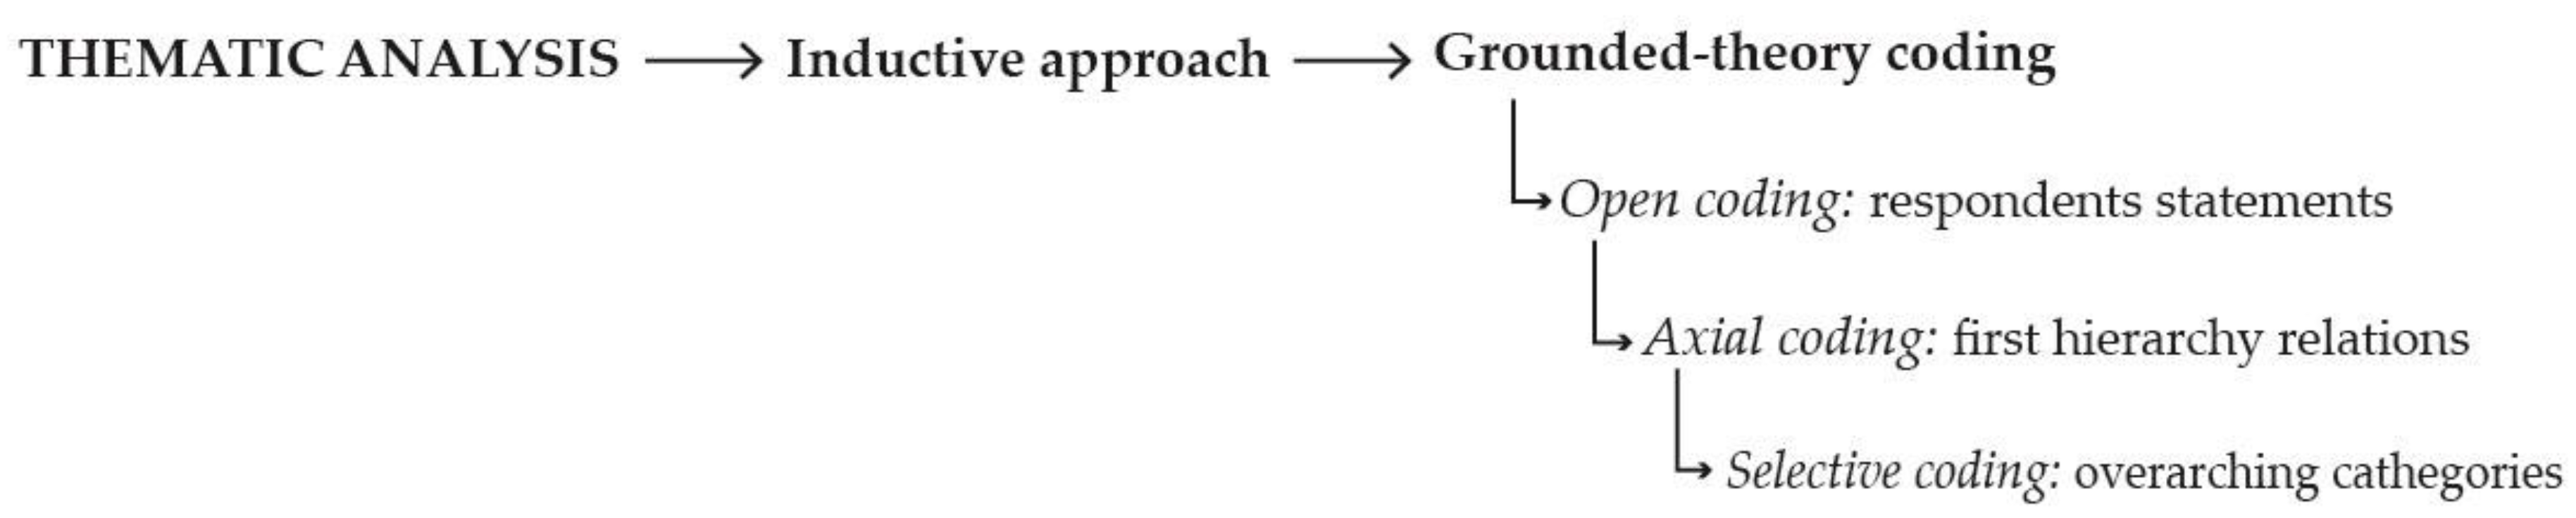
2.3. Deskwork: Coding with NVivo

The information collected during field work is analyzed using NVivo Software (NVivo 12 Plus for Windows). Although this qualitative analysis tool is useful for data storage and coding, the researcher is the analyst who interprets the information, not the program [53]. The program is truly effective, the more precise the coding is, which depends solely on the researcher.
The first step is to import the files to the program. Written transcripts of the interviews are loaded into the program in PDF format, as separate files. Once these elements have been imported, they are classified according to a series of attributes or properties: case of study, gender, age group, access mode and frequency of visit.
The coding is conducted by creating nodes, that is, analysis categories. Nodes can be themes, concepts, ideas, or experiences, which the researcher assigns to parts of the interviews. We followed an inductive approach (Figure 5): The nodes were defined after the completion of the interviews, based on both the knowledge generated from the literature review and the issues that arise from the interviews.
As part of the grounded-theory coding practices, we proceed to signal the categories that emerge directly from the interview data (open coding). After analyzing said categories, hierarchy relations are established between the initial nodes in order to sort them into broader categories (axial coding). Lastly, we compared similar axial nodes and unified them in an overarching node, comparing and building them into theory elements (selective coding) [54,55].
One sentence can be classified into different nodes at the same time. For example, the coding of the phrase “This is like a mini lung for the neighborhood, even if we have the road right next to us” (interview carried out in area C) began by defining two open nodes: ‘lung for the neighborhood’ and ‘proximity to roads’. Then, they were refined to generate axial nodes to ‘neighborhood references’ and ‘roads and highways’. Finally, they fell into broader categories or selective nodes: ‘context’, ‘social factor’ and ‘grey infrastructure’. The first part of the sentence would also fall into the ‘impact on physical health (positive)’ axial node, which is part of the ‘social factor’ selective node. We defined a total of 11 selective nodes, with their respective associated axial nodes:
  • Activities: Children’s parks, exercise, picnic, hang-out, walk the dog, bicycle ride, on my way to… (transit point), community activities, contemplation
  • Local accessibility: Barriers, walkability, parking spaces
  • Connectivity: References to other green infrastructures, cycle lanes, connectivity between roads
  • Context: Neighborhood references, historical references, landmarks
  • Economic factor: Nearby businesses, real estate value, management costs, good or poor maintenance
  • Environmental factor: Biodiversity, pollution, good air quality, nature and vegetation, blue spaces
  • Social factor: Age group, community interaction, impact on physical health (positive), impact on physical health (negative), mental health (positive), mental health (negative), social media, social justice (negative), social justice (positive)
  • Place attachment: Pride and sense of belonging, perception of quality of life, place-based worries and concerns, place-based memories
  • Safety perception: Lighting, surveillance, fear of marginal social groups, tranquility, sense of security
  • Sensory perceptions: Noise, smell, temperature, views, aesthetic valorization
  • Grey infrastructure: Transport infrastructure (roads and highways), electricity infrastructure (power lines and substations).
Once the nodes are defined, we resume to the coding. We mark words, phrases or paragraphs and we assign them to one or more nodes, depending on their meaning and intentionality (necessarily interpreted by the research team). Once the transcripts are coded, we proceed to make queries. To visualize the distribution of categories among the different transcripts, we use the matrix query and hierarchy bars, which display information crossing data from files, attributes, and nodes. The data is displayed either in a matrix form (rows and columns) or as a bar chart. We also checked which words were most cited in each area of study with a word cloud query. This allows for comparison between cases, type of interview, and areas, as will be displayed in the following section.

2.4. Sampling and Saturation

Alongside the field work, a theoretical sampling was carried out with the data collected. The theoretical sample does not have the same criteria as the statistical sample: “individuals are selected depending on the expectations they generate for the contribution of new ideas in relation to the theory we are developing, depending on the state it is in at that precise moment” [55]. In general, samples for qualitative studies are much smaller than the ones in quantitative studies, differing henceforth from probability and statistical sampling [56]. Therefore, more data does not always mean more information. Qualitative research focuses on the importance of meaning, by performing “purposive sampling”, and, particularly, “theoretical sampling”. Sampling will be stopped whenever theorical saturation is reached [57]; this is when the data obtained allow the objectives of the research to be developed, without the need for additional interviews. It is carried out based on the relevance of the cases, when new interviews do not bring up new concepts, and the responses begin to be systematically repeated [58].
We conducted a total of 28 interviews, of which 18 were semi-structured interviews (SSI) and 10 were go-alongs (GA). Theoretical saturation is checked through a series of queries using NVivo software, mostly through word frequency and hierarchy coding queries, which determined how many interviews were needed before repeating the same topics. Figure 6 shows a graphical representation of how the theoretical saturation is reached in area B through the nodes mentioned during the interviews; as we exceed 8 SSIs or 3 GAs per area, adding new interviews barely changes the hierarchical reference of the nodes. In semi-structured interviews, saturation is reached with 8 interviews per area (half during the weekend and the other half during a weekday). Variations in the topics (or nodes) mentioned between 8 and 10 SSI were minimal. Due to the fact that some questions followed a script, there are less differences between the nodes mentioned in SSIs overall. In the case of go-alongs, being longer, and in-depth interviews, Figure 6 shows how a lower number of interviews is required before topics start to repeat. In this case, variations in the topics mentioned between 3 and 4 go-alongs per area were minimal.

3. Results

This section comprises the set characterization, field work description and the subsequent analysis of the interviews, reflecting on the differences between methods and areas of study.

3.1. Set Characterization

We conducted a total of 28 interviews, of which 18 were semi-structured interviews (SSI) and 10 were go-alongs (GA) (Table 1). Of these interviews, 19 were completed during weekdays, while the remaining ones were performed over the weekends.

3.2. Field Work

In both cases of semi-structured interviews (SSIs) and go-alongs (GAs), approaching people in the areas of study was generally easy. Participants showed willingness to answer the questions, and agreed (except in one particular case) to be followed by the researcher. Conducting the interviews in broad daylight might have fostered in the locals this positive disposition, as well as the fact that the locals were comfortable in the site, given they all knew it well and represented their everyday scenery. They were, therefore, ‘in control’ of the situation and surroundings. We find it was also crucial (for the interview to take place and be fruitful) that researchers conducting the field work were respectful and polite in all interactions, acting intrigued and sympathetic towards the stories and issues that the locals would share. Nevertheless, more expressive and social participants would undoubtedly share more information and insights, regardless of whether the encounter was slighly shorter or longer in time.
Both SSIs and GAs entailed approaching strangers on site, asking whether he or she is willing to participate, and, if so, start asking open questions (in the case of SSIs) or just following the participant and asking as little as possible (in the case of GAs). From our experience in these case studies, we observed the following during field work:
-
During semi-structured interviews, in general, the first set of questions was answered in a more schematic way, whereas questions towards the middle (neighborhood influence and anecdotes) were answered more elaborately. Participants, in all cases, gave permission to be taped, which made the transcription phase much easier for the research team. When there was more activity and people around, interviews tended to be shorter. On the other hand, when the environment was calm and less people were around, participants would generally take more time to answer and elaborate. Shorter interviews often meant the participant did not want to answer all questions, or was not willing to elaborate much on his or her responses. Longer encounters, over 10 min, tended to reiterate ideas over and over, hence showing less variety in topics.
-
Go-alongs varied in length and duration, as well as in how fruitful the narrative was. Most participants did not feel comfortable being taped. Since this would have become a barrier and a source of mistrust between researcher and participant, the researcher would take notes, sketch, and take photographs of certain key views or elements mentioned by the participant while the GA was happening. The researcher would also make audio recordings recounting the experience right after finishing each interview, including literal quotes and other relevant details. The route would be geo-mapped and the photos geo-located using a smartphone; this would prove to be extremely helpful in the recollection of each GA for its transcription.
In terms of duration and length of the walk, the most fruitful encounters (meaning those where more relevant references to everyday practices and the environment were brought up) were those lasting between 30 min and 1 h, covering distances around 1 km. Participants would walk at different speeds depending on their physical condition and whether they were ‘exercising’ or simply ‘taking a walk’. In general terms, a faster pace while walking meant being exposed to a larger number of elements and views, but made it harder for the researcher to take notes and photos ‘on the move’, and left little time for participants to express calm reflections. A slower pace, on the other hand, often meant the participant was focusing on a certain issue or detail, and was not as attentive to the environment.

3.3. Analysis

The results deduced from the analysis of the data by NVivo are presented in two different levels: results from all areas (large scale) and results that arise from only one area (local scale).

3.3.1. Large Scale: Common Elements

Overall, the most referenced node was ‘activities’, where people stated that they usually went to the site to either walk, exercise or to walk their dog (Figure 6). Contemplation of views was fairly popular as well, along with riding a bicycle. Other activities such as going to music events or sunbathing were barely mentioned.
The node ‘sensory perceptions’ was also rather well mentioned, with an overall positive aesthetic valorization of the sites (although a high percentage of respondents also made negative valorizations of certain aspects of the space), references to the views, and allusions to the temperature during the interview.
Among the principal UGI factors, respondents generally named aspects of the ‘social factor’, especially mentioning the impact of those spaces in community interaction and pointing out different age groups: “This is a good area for parents to bring their children, to have fun, to run a bit, because on the street they can’t” (SSI, area C).
The most alluded elements from the ‘economic factor’ were the ones referring to maintenance (whether it was poor or good), and in the ‘environmental factor’, people mostly mentioned nature and vegetation, the river (if there was one near the area), and whether there was any wildlife.
In terms of ‘place attachment’, participants referenced ‘place-based memories’, ‘place-based worries and concerns’, ‘pride and sense of belonging’ and ‘perception of the quality of life’ in similar proportion. Memories included stories about how the area used to be: “When I first came here, this was all industry [he says, pointing around]. All industry. And look at it now” (GA, area B), or how they have personally contributed to the development of the site: “I planted one of the first trees, so we’ve seen everything” (SSI, area C). Most memories led to a sense of belonging towards the place, associating it to a positive valorization of quality of life: “Having this here is a wonder. And I’m telling you, we use this a lot” (GA, area B).
References of ‘safety perception’ showed a predominant sense of tranquility and security over fear of accidents or of certain marginal social groups, although these concerns were mentioned, especially in area B. Most of the respondents also expressed their acknowledgement that security during the day varied from security at night.
The most mentioned grey infrastructures were roads and highways, along with power lines and electric substations, although some references to the train tracks also came up. Most of these comments were complaints about the presence of said infrastructures, although positive valorizations included comments on the connectivity that roads, highways and trains enabled.
Lastly, local accessibility was barely mentioned, although most of the comments included in this node mentioned the importance of being able to access the site on foot from their homes.
Go-Alongs vs. Semi-Structured Interviews
Differences in the approach and location of the interviews (go-alongs in UGI in transformation with a generally strong presence of grey infrastructures; semi-structured interviews in consolidated UGI with lookouts providing panoramic views of the surrounding landscape) have led to variations in the topics that emerge from each method (Figure 7).
The main difference between nodes referenced in GAs and in SSIs is that, while the most mentioned node in GAs is ‘place attachment’, and, to a lesser extent, ‘activities’, in the SSIs, the most referenced ones are ‘activities’ and ‘sensory perception’, in a similar proportion, whereas ‘place attachment’ is barely metioned (Figure 8).
The ‘social factor’ node is mentioned in a similar proportion in both types of interview, however, the references to the axial nodes embedded varied remarkably. In GAs, the principal axial nodes include ‘community interaction’ and ‘negative social justice’, bringing up criticism towards the management of the space and problems arising from gentrification: “They want the people who live here to no longer have enough money to live here” (GA, area A). There are a few references to the negative impact of grey infrastructures (power lines and substations) on physical health: “We’ve been dealing with this cable problem for 30 years. When they pushed the most was when many cases of tumors appeared, cancer cases...” (GA, area A). Participants of GAs also mention the positive impact of green spaces on physical health, as these are open spaces available for people to walk. However, no GA participant commented on the effect on mental health. On the other hand, this very topic, ‘impact on mental health’ is the most cited axial node of the ‘social factor’ in SSIs. Moreover, people have a positive valorization of the impact these spaces have on their mental health, so they decide to go there in search for a place of calm and peacefulness: “It’s a place to disconnect, which brings peace of mind” (SSI, area B). Interviewees in SSIs also mentioned the positive impact of the UGI on physical health, and the difference in activities and areas available, depending on the age group.
Comments on the context were more predominant in GAs, particularly neighborhood references and mentions of landmarks. Some of the participants also noticed a city-countryside relation within the site, depending on the area of study. In SSIs, mentions of landmarks are few and limited to those linked to the views of the city. Comments mainly focused on how the UGI had a positive effect on the neighborhood: “It is a break, for the neighborhood. It brings life. For me it’s essential” (SSI, area C).
Although the proportion of references towards ‘safety perception’ was similar in both types of interview, the content was very different. Whereas in SSIs, there was a general agreement on a positive sense of security: “We’ve never had any incident or any feeling of insecurity” (SSI, area C), most of these comments in GAs referred to a fear of both accidents or social groups: “Well, there used to be a gypsy village there. It’s been removed now. There was trouble, with drugs and such...” (GA, area B); “It’s not a question of aesthetics anymore, it’s just that there are a lot of trees around... you know. Anything can happen, it’s a risk” (GA, area A), referring to the presence of overhead electric cables and pylons.
These abovementioned grey infrastructures were mostly mentioned during the GAs, as the walks often occurred near highways, train tracks or electrical substations. Most of the references were focused on power lines, stating their concerns and worries associated with them: “I think they should take it down, don’t you? It gives a lot of electricity” (GA, area C). On the other hand, in SSIs, participants mainly acknowledged roads and highways, as they were visible from the places where the interviews were conducted. Most of the comments focused on the contrast between green space and transport infrastructure, considering the former a solution towards the impact and problems associated with the latter.
The ‘environmental factor’ is referenced in a similar form in both types of interviews, with nature and vegetation being the most mentioned elements, as well as comments on ‘connectivity’, particularly referencing existing connections between other green spaces in the city and peri-urban areas.

3.3.2. Local Scale: Comparison between Areas

Conducting on-site interviews in three specific areas contained in the south-east arch of the urban fringe of Madrid has brought up certain common topics and issues, strongly linked to the ongoing problematics of the peri-urban landscape. However, comparing the results obtained in each area can also draw some light on how specific characteristics of each peri-urban site impact the perception and narrative of the locals. The presence and proximity to certain grey infrastructures, the connectivity between green spaces, or the sense of security, become crucial in understanding how locals perceive and use the public space and, in particular, the UGI.

Area A

The landscape of this highly populated area on the south-west border of the Municipality of Madrid is composed of high-rise residential blocks (mainly from the 1970s), the A-5 highway crossing though, and an array of pylons and cables to and from the electric substation. The aging population in this area becomes patent during on-site observation; participants are all over 50 years old and have lived in this area for decades. As mentioned in Section 2.2, the area will soon be subject to large-scale changes in terms of the relation with the highway crossing through, possibly providing an opportunity to improve the current condition of the UGI.
Go-along interviews were conducted in the abovementioned area. During the interviews, participants shared many facts and observations on the changes in the landscape: how it used to look, what they used to do in it… as well as showing strong feelings of collective mistrust (as neighbors) towards government and large energy corporations. Participants mentioned how neighbors feel a lack of social justice since these infrastructures (mainly electric) are so visible and close to their everyday activities; more so since they consider their landscape as purely urban, residential, and part of the city.
The strong presence of the highway not only entails noise and high levels of pollution, but also causes an important urban barrier between two areas of the neighborhood, forcing locals to cross over or under it, using passageways that foster feelings of insecurity and have led to conflicts with certain social groups. On the other hand, positive comments concentrated especially on the proximity to (and connectivity with) the protected green space of Casa de Campo, on the views from the highest topographical spot of the park, and on place-based memories of certain activities and feelings, many of which were expressed with nostalgia.
Analysis of interviews (GA) carried out in area A using NVivo software shows most references on ‘place attachment’ and ‘context’, followed by ‘social factor’ and ‘activities’ (Figure 9). As stated in Section 2.3, nodes are analysis categories that the research team assigns to parts of the interview transcripts for their analysis. These nodes or categories are determined by a group of key words, synonyms and/or expressions on a certain topic. Though longer interviews will obviously provide more time for the interviewee to mention a greater number of nodes, this is not always the case. The ‘productivity’ of the interviews in terms of duration and number of references to nodes is later discussed in Section 4, considering the results obtained for all three areas:
-
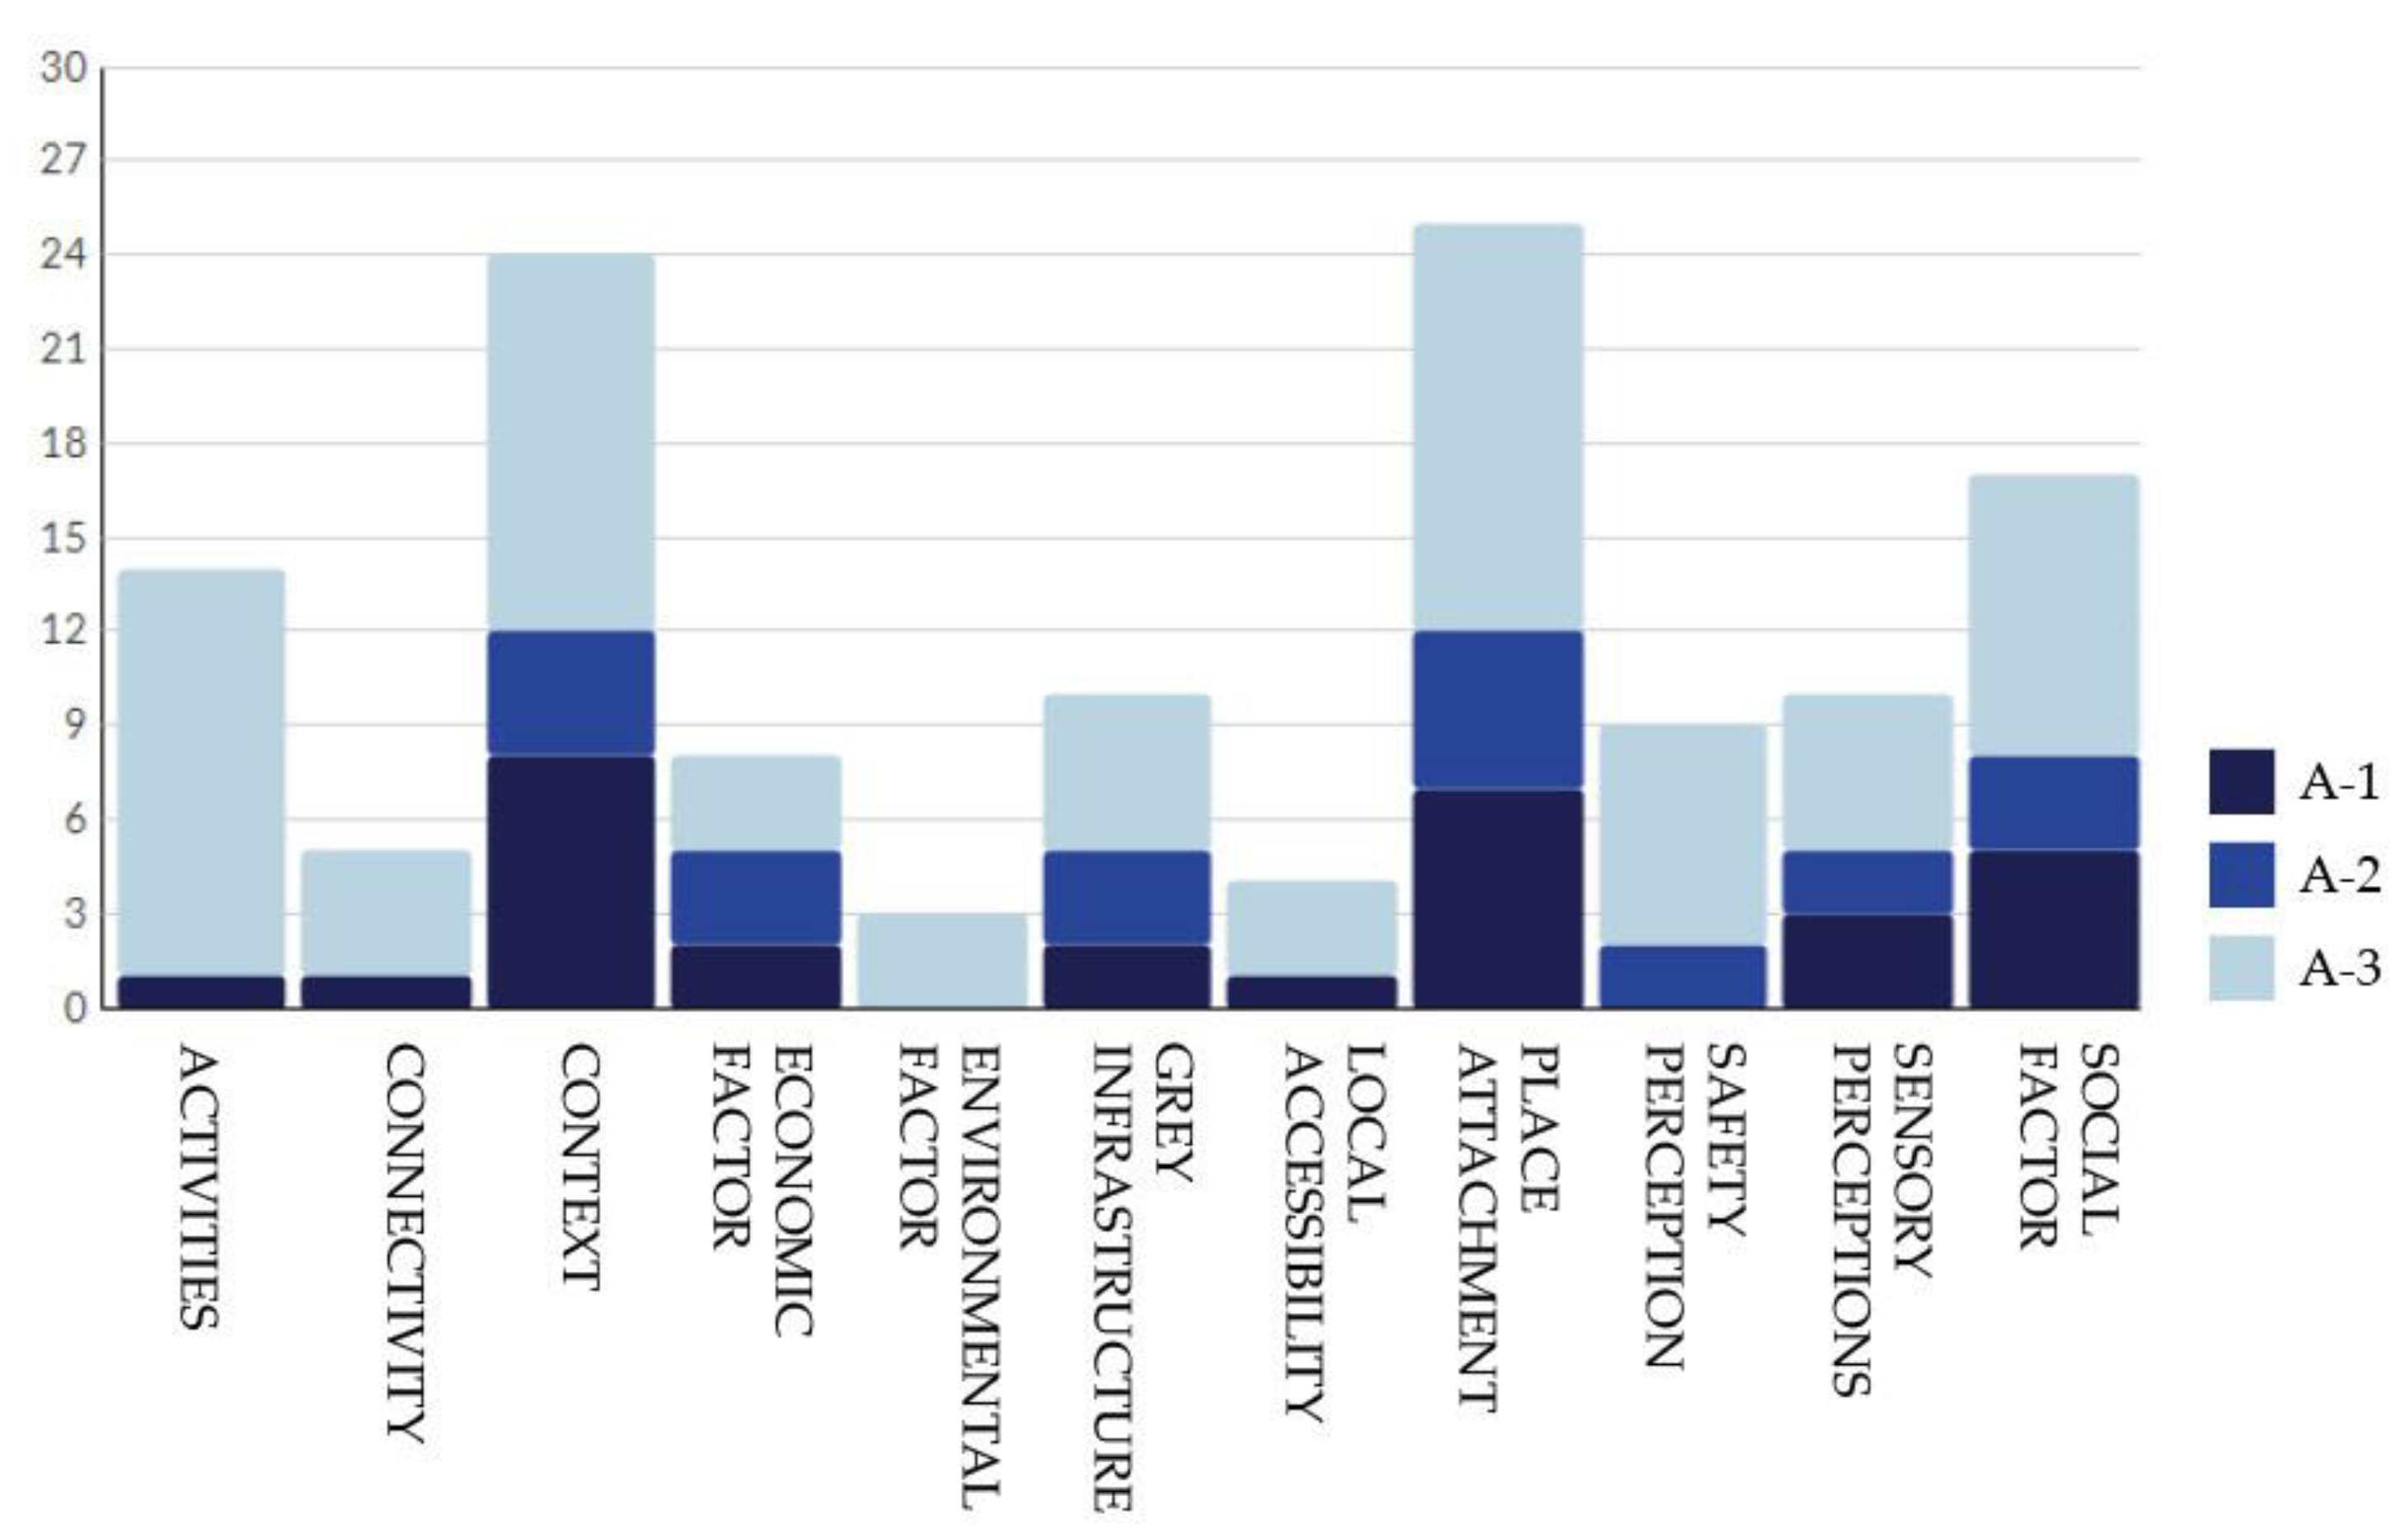
Within the concept of ‘place attachment’, most comments are place-based worries and concerns, though there are also a significant number of place-based memories, as well as (in slightly less amount) comments expressing pride, sense of belonging and perception of quality of life. “The problems we have here. This neighborhood… should be on the television! For all the issues it has” (GA).
-
Within the ‘context’ node, there are mainly neighborhood references, some comments on specific landmarks, and barely any historical reference. “There is a spot up there with wonderful views of the mountain range and of Madrid… I go up there sometimes because the views are awesome. […] If the day is clear, you can even see the planes landing in the airport. It’s really far, but you can see it perfectly” (GA).
-
Within the concept of ‘social factor’, references were made mainly in terms of community interaction and negative perceptions of social justice. “Yes, well… you can’t fight against that. There have been demonstrations, protests here… but the companies are very powerful and there’s nothing we can do. […] But hey, the neighborhood is nice. And it has this [pointing towards the green space of Casa de Campo]. This is a green lung that’s priceless. I come here every day. I take a walk, then I meet with some friends, we play cards or something…” (GA).
-
The most mentioned activity is walking, which is coherent with the fact that only GAs were conducted in this area. Surprisingly, cycling was barely mentioned, even though several cyclists passed by us during the GAs, and that the green cyclist belt cuts through the area, crossing over the highway and connecting the two green spaces of Cuña Verde Latina and Casa de Campo.
In slightly less proportion than the four nodes mentioned above, interesting references were made by participants in area A in terms of ‘sensory perceptions’, ‘safety perceptions’ and ‘grey infrastructures’. The following quote, for instance, brings these three concepts together when referring to local opposition towards electric pylons and overhead cables, so strongly present in the landscape: “It’s been a fight. Because it’s not only harmful to the eye, it’s a health issue. But there is nothing to do about it. It makes no sense that they’re here, so deep in the city. They pass really close to some buildings” (GA).
Amongst the most frequently used words for this area, we find ‘years’, ‘look’, ‘neighbors’, ‘neighborhood’, ‘people’, ‘highway’, ‘electric’ and ‘home’. These are coherent with the age group of the participants in the area and their willingness to share stories and impressions on the past and present landscape. These most repeated words are also coherent with the fact that these participants have lived in the area for a long time, hence sharing place-based memories, and showing a strong sense of community among neighbors who share common concerns regarding the unavoidable presence and proximity of certain grey infrastructures.

Area B

The landscape of this very heterogeneous area on the southern border of the Municipality of Madrid is strongly defined by industrial uses and large grey infrastructure (highways, train tracks, electrical substations, sports facilities, water treatment plants, etc.). Residential areas of various characters are scattered along the west side of the UGI where field work was conducted. This UGI, articulated along the river Manzanares in its urban and peri-urban section, has proven to be highly valued by the locals; participants in this area expressed interest in the different phases of this project (biodiversity, maintenance, etc.), which is still in transformation on its south end, and value especially “the countryside feel” while still being “so close to the city.” This city-countryside relationship is strengthened especially since it is both walkable and cyclable from Madrid Río.
The analysis of the interviews (SSIs and GAs) carried out in area B using NVivo software shows most references on ‘activities’, followed closely by ‘social factor’, ‘context’ and ‘sensory perceptions’ (Figure 10):
-
In terms of ‘activities’, the four main ones were walking, exercising, walking a dog and riding a bicycle. “I usually cross this bridge. If you continue straight along, it’ll take you to Madrid Río. I sometimes see people come from there, especially on bicycles. It’s really great that you can come all the way from downtown” (GA).
-
Within ‘social factor’, an array of references to age groups, community interaction, and positive impact on mental and physical health are collected, as well as some on education, social media and social justice. “I sometimes see journalists coming here, taking pictures… And now, in the summer, there are families, though it’s not too hot yet. Lots of kids” (SSI). “It’s super green now, after the rain… it’s beautiful. I sometimes take selfies here, to make my colleagues at work jealous. I tell them, ‘Hey, look, this is for you.’ And they say, ‘Don’t send us that, we’re so jealous!’” (GA).
-
The node ‘context’ contains many neighborhood references, however, the amount of comments on city-countryside relations is very significant. “From here, thanks to the views, you feel like you are both here and in Madrid” (SSI). “This is beautiful… It’s like being in the middle of the countryside!” (GA). “I feel like I’m not in the city, like I’m not in Madrid” (SSI).
-
Within ‘sensory perceptions’, references by locals in this area are mainly positive aesthetic valorizations and comments on views and temperature.
In addition to the abovementioned, we find a relevant amount of references to the ‘economic factor’, ‘environmental factor’, and ‘place attachment’ nodes. While comments on good and bad management of the UGI compose most of the references to the ‘economic factor’, the ‘environmental factor’ in this area has acquired a larger dimension, mainly thanks to the presence of the river. “The river has changed a lot, yes. They’ve taken great care of it now. They’ve put bicycles, paths to walk… much better” (GA). This UGI has been planned in phases, some of which are still in transformation. Therefore, depending on where we carried out the field work, we found more or less consolidation of the paths and vegetation. “Maintenance in this area is good. The part where we live is still not done, though” (SSI).
Amongst the most frequently used words for this area, we find ‘park’, ‘good’, ‘river’, ‘people’, ‘look’, ‘city’, ‘country’ and ‘Madrid’, coherent with an overall positive valorization of the UGI, a clear appreciation for natural elements, and the importance of connectivity from the city-center to the area of study.

Area C

In this area, located on the east border of the Municipality of Madrid, we find strong differences in the landscape depending on which side of the UGI we visit. The consolidated park (closer to the city center, designed for leisure and enjoyment, and provided with a viewpoint that offers panoramic views of the surrounding) contrasts with the landscape at the east side, strongly bounded by freight train tracks, large highway intersections, and wastelands, yet to be built.
This contrast has consequently manifested itself in the interviews; while GAs were conducted on the east side, next to the wasteland, an electric substation, and industrial premises, the SSIs were conducted around the viewpoint of the most consolidated park, closer to the city. Overall, participants in the GAs showed indifference towards the environment they were walking through: “There’s nothing interesting here, right?” (GA), as well as powerlessness in terms of making it better: “They used to say they were going to put a park here. But in the end, nothing. What can we do? Nobody can do anything about this. Not me, not you, probably” (GA). Conversely, the SSIs collected the most positive comments overall, especially in terms of healthy and enjoyable practices: “Happy. I come here to bring him (the dog) because he stresses out in the street” and “Freedom. I also come to do some exercise. I would define it as freedom and a healthy habit” (SSIs).
The analysis of the interviews (SSIs and GAs) carried out in area C using NVivo software shows a strong predominance of references to ‘activities’, followed by ‘sensory perceptions’, ‘social factor’ and ‘safety perception’ (Figure 11):
-
In terms of ‘activities’, the most frequently mentioned are walking, exercising and walking a dog, followed by contemplation and others (in less proportion): “It’s quiet, you can exercise. That’s important for a park. The mountain views, there are areas for kids…” (SSI).
-
‘Sensory perceptions’ are mainly referencing views and positive aesthetic valorizations, which are often linked to activities carried out in the park: “It’s an added value for the park. It’s nice to come see the sunset. Yesterday, for example, there was a concert here in the evening, and there were a lot of people watching the sunset” (SSI).
-
‘Social factor’ contains most references towards positive impact on mental health (from the park), followed by negative impact on physical health (from the electric substation): “There are other neighbors with other problems, and maybe it has something to do with this. Because it’s radiation, right? We don’t like it, truly. We don’t like it because it’s very close to the houses. Too close” (GA), and in less proportion, positive impact on physical health (also from the park): “Green areas, I think, are essential for the neighborhood. It’s a very large place to escape. It’s a relief. It’s great, truly. It brings a lot of life” (SSI).
-
‘Safety perception’ collects many positive references, in terms of tranquility, sense of security, or safety perception thanks to surveillance.
For this area, the most frequently used words of the transcripts do not seem to reflect any element or valorization specific to this site. We find words such as ‘park’, ‘city’, ‘neighborhood’, or ‘good’; all of which could refer to any UGI in any given city. This could be because there are two very contrasting landscapes and perceptions depending on where the field work was carried out. However, it could also infer that there are no distinctive elements, symbols, landmarks, or practices in this UGI which participants thought relevant to mention, as opposed to those of areas A and B.

4. Discussion

This case study on the perception of well-being associated to the use of peri-urban green infrastructures has brought up a broad range of reflections, which could be classified as:
-
Methodological: Static vs. Dynamic. Ordinary and Extraordinary.
-
Geographical: Peri-Urban Green Infrastructures of Madrid. The South-East Fringe.
-
Theoretical: Urban Green Infrastructure and Well-Being.

4.1. Static and Dynamic. Ordinary and Extraordinary

Differences between methods have led to a variety of feedback, according to their location and approach towards respondents, as stated in Section 3.3.1.
The site is intrinsically linked to the results obtained. Sites located in consolidated metropolitan parks with viewpoints implied a high affluence of people, which allowed to carry out several interviews in the same place, making semi-structured interviews (SSIs) more suitable for this type of places. In addition, interviewees in these sites generally tended to go elsewhere; the viewpoint was just a stop on their way, and therefore, short interviews were more effective. On the other hand, sites located in ordinary areas (where UGI is planned or in process of consolidation) meant a lower influx of people, and those few who were around were in the middle of their walk or daily affairs. Therefore, the researcher had to adapt to the actions and routines of participants, and accompany them on their route, which made go-alongs (GAs) a more adequate tool for these sites.
Variations in results depending on the site and method allows us to reflect on the different dynamics that we find within sites, depending on whether they are ‘extraordinary landscapes’ or ‘everyday sceneries’ [30]. As SSIs were performed at viewpoints in consolidated UGI, responses tended to value the views positively, highlighting the panoramas of the city over the rest of the visible landscape. Consequently, these panoramas of the city center could be considered extraordinary landscapes. On the other hand, sites where GAs were carried out did not seem to have any particular aesthetic characteristics that would make them stand out from others. They usually were considered part of the everyday sceneries. However, as SSI sites are used in the day-to-day life of the interviewees, landscapes previously considered as extraordinary become part of the everyday life of the neighbors, whereas seemingly anodyne landscapes where GAs took place have particular elements that could be considered extraordinary and especially valued by local residents. Both types of interviews left room for the unexpected [59], uncovering ‘extraordinary’ place attachment narratives, place-based memories and emotional attachment links to the landscape from everyday experience.
In terms of issues arising from each type of interview, it seems logical that perceptive aspects, and specifically visual factors, tend to predominate in SSIs, since they are located in viewpoints. In addition, having a predetermined (although flexible) script allows questions such as ‘types of activities performed in the area’ to always be part of the conversation, and therefore to appear as highly referenced topics during the interviews. On the flip side, the flexibility of the GAs and their longer duration allows for the interviewee to gain confidence, allowing a greater number of issues connected to their daily routines to arise. This could be why concepts such as place attachment predominate throughout these interviews.
Each method had its limitations. For instance, subjectivity during the interviews and coding cannot be totally erased from the process. In terms of coding, due to the researchers’ knowledge of the subject, some nodes could have been inevitably inferred by research interests, while others may have been overlooked. Some limitations of the GAs include not being able to predict the time you will spend on each interview, the route, or topics you will talk about. As for SSIs, the opposite can happen by sticking too closely to the script and missing interesting topics that may have arisen.
A relevant benefit of employing these methods is that they involve a modest number of material resources, making their implementation fairly economical in time and resources. Results show that these interview techniques deliver meaningful results with a relatively small sample of interviews. This represents an advantage when it comes to its use, informing the design process of both private or public projects.

4.2. Peri-Urban Green Infrastructures of Madrid. The South-East Fringe.

The south-east fringe of the city shares certain characteristics and is relatively homogeneous in terms of high population density and neighborhood vunerability (as mentioned in Section 2.1). However, this research on local perception of each area (A, B and C) sheds light on which sites function best as urban green infrastructure (UGI), and why. Combined with previously published expert-based analysis (e.g., [14,51]) and direct observation of this landscape type by the research team, it is possible to identify the following key issues concerning UGI and well-being in this peri-urban context.
All sites are part of fragmented environments, close to industrial land uses, which green spaces pretend to solve. However, while neighbors in area A refer to two separate green spaces, connected solely by a footbridge over the A-5 highway (a lost opportunity in many ways), in area B, several participants praise the possibility to reach the city center by foot or by bicycle through the park (and other adjacent parks), thus, counteracting the lack of certain public transportation services. Area C is somewhere in between; while neighbors appreciate the large scale of the green infrastructure, its influence remains local and it is the neighbors close by who enjoy its services, only establishing a visual connection with the city.
The key factor that makes possible for one area (B) to work better than the others is, in this case, ‘connectivity’. The Linear Park, along with its continuation (Madrid Río Park), acts as a network system, connecting the urban center with the rural environment (reaching the South-East Regional Park). This is the true meaning of ‘corridors’, defined in Section 1.1, since the park brings city and countryside closer. One of the the key elements making this possible is the river Manzanares, as it acts as a guiding thread for the infrastructure, even though it is not a particularly large or buoyant river.
Interstitial spaces found on the urban edge, adjacent to our study areas, play a fundamental role in potentially redefining spaces in areas A and C that are not functioning as well as they could. Considered ‘wedges’ of green landscape that run through the city—right now, they are acting as ‘nodes’ rather than ‘corridors’. Incorporating residual opportunity spaces nearby (mainly wastegrounds and brownfields) into the existing UGI has the potential to reduce land fragmentation around them and set true connection networks with better outcomes for a larger population.

4.3. UGIs and Well-Being

Well-being is an area of enquiry that crosses disciplinary boundaries, has multiple dimensions and is discussed using various terminologies [60]. This calls for a multidisciplinary conceptual framework of environmental quality and quality of life, beyond disciplinary differences [61]. The connection between the concepts that emerged from the interviews has allowed us to reflect on the meaning of well-being in its broadest sense, specifically on the effect that urban green infrastructure (UGI) may have on it.
Our study proposes a holistic framework, combining concepts and inputs from different perspectives. The following diagram (Figure 12) illustrates the relationship between landscape and well-being, structured around landscape characterization parameters: social, natural and perceptual [62]. The figure combines information collected from both the literature and the case study analysis, in order to create a mind map of how concepts relate to each other. Orbiting around the ‘concept wheel’ are the axial nodes related to each theoretical notion.
Revolving around the social elements that generate a feeling of well-being in our case studies, we find references to place attachment, community interaction, everyday practices and perhaps, the most commonly associated with the concept: health. We differentiate between mental and physical health, both necessary to reach a state of well-being (see Section 1.2). As mentioned in the Results section, most interviews carried out near lookouts commented on the positive effect of the environment on mental health issues such as stress or anxiety.
The high number of positive place-based memories arising from interviews indicate a strong sense of belonging towards the landscape, particularly if it becomes part of one’s daily routines. Recollections of past experiences between grandparents and grandchildren, lovers or friends imprint an emotional dimension to these sites, which makes the experience of wandering through them more meaningful. The fact of walking through these green infrastructures close to one’s home generates a feeling of “owning the landscape by walking through it” [63]. In a way, these green spaces act as an extension of our personal space beyond the neighborhood, enhancing feelings of place attachment and belonging.
Among natural factors linked to well-being are notions of environmental quality or landscape sustainability. There are several positive assessments of the fact that different species of animals can be found, especially among people with children, who associate the setting with both a playground and a learning space.
In addition, from our study, we assess the importance of the perceptual elements when fostering a perception of well-being. The aesthetic enjoyment of taking in the views of the city, along with other sensory perceptions such as a pleasant temperature are added values to these spaces, that allow us to perceive them in a positive way.
UGI, as ‘natural’ landscapes, guarantee an on-site perception of the passing of time. With the changes in the seasons, or the growth of vegetation and wildlife, the experience while using these spaces is never the same. For instance, visiting the area in the winter, with many leafless trees and snow on the mountains in the background, is very different from visiting it in summer, in search for tree shade to protect us from the heat. To be able to perceive the colors that appear in nature during the different seasons has been associated to positive impact on quality of life [64]. This, together with other evidence of the passing of time in the landscape (e.g., growth of trees, river flow, or shaded areas, depending on the season) were all aspects mentioned by participants in both interview types, as part of spontaneous narratives that expressed feelings of pride and belonging.
Overall, it remains clear that well-being does not depend solely on a single factor. A holistic understanding of landscape, and in particular of UGI, is needed to further understand the key factors within these landscape types that shape the locals’ perceptions of quality of life; all, in order to drive their design and management towards a more sustainable social and environmental development, making UGI serve the community at their full potential.
Moreover, recent changes due to the COVID-19 pandemic (with lockdowns and limitations in the use of public space in many countries and regions worldwide) have once again highlighted the importance of green infrastructure in the city in terms of perceived health and well-being. The relationship between public spaces, citizens and communities has varied, and this study is a ‘photograph’ of the moment before all these changes happened. A before-and-after comparison in the area of study of this research, severely affected by the first wave of the pandemic in early 2020, would be an interesting avenue of future research that may emerge from this investigation.

5. Conclusions

Urban green space interventions have the potential to affect a range of outcomes, including lifestyle and behavioral aspects, health and well-being, social equity and quality of life in general [65]. Interventions to increase or improve urban green space can deliver positive health, social and environmental outcomes for all population groups, particularly among those of lower socio-economic status [65]. In this sense, the south-east urban fringe of Madrid combines high population density levels with challenging socio-economic conditions of the neighborhoods, and therefore, could benefit especially from large-scale green spaces as part of their everyday scenery. The limited number of UGI in the area show uneven results in terms of positive valorization and use, depending on characteristics such as scale, presence of landmarks, relation with grey infrastructure, and, especially, its connectivity with other green spaces, both towards the city and the countryside.
Conducting interviews with locals is an opportunity to uncover relevant local perceptions and corroborate the potential of UGI to provide positive feelings and practices from a physical, mental and social perspective. This case study has provided an opportunity to explore the strengths and limitations of two interview techniques: semi-structured interviews and go-alongs, both very complementary and with great potential for their inclusion in the toolkit of researchers and practitioners involved in peri-urban studies and interventions.
This work states that a broader concept of well-being is needed to fully understand how (and how much) locals use the public space. Through this case study, not only the type and amount of activities, but also aspects of place attachment, behavior, actions and perception of healthy practices and environments, or feelings of safety, community and belonging, have proven to be fundamental in shaping the perceptions that locals have in relation to their quality of life.
Exploring the perception of well-being in certain areas where an array of well-established peri-urban issues are present (such as landscape and social fragmentation, or strong presence of grey infrastructures) is particularly relevant, given the intense growth prediction of peri-urban areas in the coming years [4]. UGI in these areas act as opportunity spaces that bring together natural and cultural dimensions. A better understanding of how they should be inserted in the city, paying special attention to both social and perceptive factors, proves to be fundamental in helping these landscapes produce positive impacts on locals’ perception of well-being.

Author Contributions

Conceptualization, C.S.d.T.G. and R.S.-T.M.; methodology, C.S.d.T.G. and R.S.-T.M.; software, C.S.d.T.G. and R.S.-T.M.; field work: C.S.d.T.G. and R.S.-T.M.; validation, C.S.d.T.G. and R.S.-T.M.; formal analysis, C.S.d.T.G. and R.S.-T.M.; investigation, C.S.d.T.G. and R.S.-T.M.; writing—original draft preparation, C.S.d.T.G. and R.S.-T.M.; writing—review and editing, C.S.d.T.G., R.S.-T.M. and E.J.R.R.; visualization, C.S.d.T.G. and R.S.-T.M.; supervision, E.J.R.R.; project administration, E.J.R.R.; funding acquisition, E.J.R.R. All authors have read and agreed to the published version of the manuscript.

Funding

This research has been part of the State Plan Project of the Spanish Ministry of Economy and Competitiveness (HAR2014-57843-R) entitled “Proximity landscapes of the city of Madrid. From the 19th century to the present” (2015–2018), and of the ongoing research project entitled “The peri-urban landscape of Madrid: views from the memory to the new city” funded by CEU-Banco Santander in its V Convocatoria de Ayudas a Proyectos Puente y Consolidación, and the Secretary of State for Research of the Spanish Ministry of Science and Innovation, code PID2019-110693RB-I00. We thank the Spanish Ministry of Education for the pre-doctoral scholarship (FPU14/05524), granted to co-author Carlota Sáenz de Tejada Granados, in its FPU Program, and Universidad CEU San Pablo Foundation for the pre-doctoral scholarship, granted to co-author Rocío Santo-Tomás Muro, in its FPI program.

Conflicts of Interest

The authors declare no conflict of interest.

References

  1. Chatel, C.; Morillas-Torné, M.; Esteve, A.; Martí-Henneberg, J. Patterns of Population and Urban Growth in Southwest Europe: 1920-2010. J. Urban Hist. 2017, 43, 1021–1040. [Google Scholar] [CrossRef]
  2. Antrop, M. Landscape change and the urbanization process in Europe. Landsc. Urban Plan. 2004, 67, 9–26. [Google Scholar] [CrossRef]
  3. Antrop, M. Why landscapes of the past are important for the future. Landsc. Urban Plan. 2005, 70, 21–34. [Google Scholar] [CrossRef]
  4. Piorr, A.; Ravetz, J.; Tosics, I. Peri-Urbanisation in Europe: Towards a European Policy to Sustain. Urban.-Rural Futures. A Synthesis Report of the PLUREL Project; PLUREL Consortium: Copenhagen, Denmark, 2011. [Google Scholar]
  5. Allen, A. Environmental planning and management of the peri-urban interface: Perspectives on an emerging field. Environ. Urban 2003, 15, 135–148. [Google Scholar] [CrossRef]
  6. Benedict, M.A.; McMahon, E.D. Green Infrastructure: Linking Landscapes and Communities. Island Press: Washington, DC, USA, 2006. [Google Scholar]
  7. European Commission. Green Infrastructure (GI) Enhancing Europe’s Natural Capital; European Comission: Brussels, Belgium, 2013. [Google Scholar] [CrossRef]
  8. Mell, I. Green Infrastructure: Concepts, Perceptions and its Use in Spatial Planning. Ph.D. Thesis, Newcastle University, Newcastle upon Tyne, UK, 2010. [Google Scholar]
  9. López, P.K.; Huerta, M.; Ángel, G. Identificación de una franja de periferias interiores de escala metropolitana en el sur de Madrid | Identifying a metropolitan inner peripheries set in the South of Madrid. Zarch 2017, 8, 118–131. [Google Scholar] [CrossRef]
  10. Davies, C.; MacFarlane, R.; McGloin, C.; Roe, M. Green Infrastructure Planning Guide. 2006. The Mersey Forest: Newcastle upon Tyne. Available online: http//www.greeninfrastructurenw.co.uk/resources/ (accessed on 16 June 2020). [CrossRef]
  11. Oke, T.R. The energetic basis of the urban heat island. Q. J. Royal Meteorol. Soc. 1982, 108, 1–22. [Google Scholar] [CrossRef]
  12. Mell, I.C.; Henneberry, J.; Hehl-Lange, S.; Keskin, B. To green or not to green: Establishing the economic value of green infrastructure investments in The Wicker, Sheffield. Urban For. Urban Green. 2016, 18, 57–267. [Google Scholar] [CrossRef]
  13. Benedict, M.E.; McMahon, J.D. Green Infrastructure: Smart Conservation for the 21st Century. Renew. Resour. J. 2002, 2, 20. [Google Scholar]
  14. Rodríguez Romero, E.J.; Granados, C.S.T.; Santo-Tomas Muro, R. Landscape perception in Peri-Urban Areas: An expert-based methodological approach. Landsc. Online 2019, 75. [Google Scholar] [CrossRef] [Green Version]
  15. Lee, A.C.K.; Maheswaran, R. The health benefits of urban green spaces: A review of the evidence. J. Public Health 2011. [Google Scholar] [CrossRef] [PubMed]
  16. Gascon, M.; Triguero-Mas, M.; Martinez, D.; Dadvand, P.; Rueda, D.R.; Plasència, A.; Nieuwenhuijsen, M.J. Residential green spaces and mortality: A systematic review. Environ. Int. 2016, 86, 60–67. [Google Scholar] [CrossRef] [PubMed] [Green Version]
  17. Pacione, M. Urban Liveability: A Review. Urban. Geogr. 1990, 11, 1–30. [Google Scholar] [CrossRef]
  18. Howley, P.; Scott, M.; Redmond, D. Sustainability versus liveability: An investigation of neighbourhood satisfaction. J. Environ. Plan. Manag. 2009, 52, 847–864. [Google Scholar] [CrossRef]
  19. Pacione, M. Urban environmental quality and human wellbeing—A social geographical perspective. Landsc. Urban Plan. 2003, 65, 19–30. [Google Scholar] [CrossRef]
  20. Menconi, M.E.; Artemi, S.; Borghi, P.; Grohmann, D. Role of Local Action Groups in Improving the Sense of Belonging of Local Communities with Their Territories. Sustainability 2018, 10, 4681. [Google Scholar] [CrossRef] [Green Version]
  21. Ulrich, R.S. Visual landscapes and psychological well-being. Landsc. Res. 1979, 4, 17–23. [Google Scholar] [CrossRef]
  22. Evered, E. The role of the urban landscape in restoring mental health in Sheffield, UK: Service user perspectives. Landsc. Res. 2016, 41, 678–694. [Google Scholar] [CrossRef]
  23. Velarde, M.D.; Fry, G.; Tveit, M. Health effects of viewing landscapes—Landscape types in environmental psychology. Urban For. Urban Green. 2007, 6, 199–212. [Google Scholar] [CrossRef]
  24. Pretty, J.; Peacock, J.; Sellens, M.; Griffin, M. The mental and physical health outcomes of green exercise. Int. J. Environ. Health Res. 2005, 15, 319–337. [Google Scholar] [CrossRef]
  25. Berg, M.M.V.D.; Wendel-Vos, W.; Van Poppel, M.; Kemper, H.; Van Mechelen, W.; Maas, J. Health benefits of green spaces in the living environment: A systematic review of epidemiological studies. Urban For. Urban Green. 2015, 14, 806–816. [Google Scholar] [CrossRef]
  26. Bell, S.L.; Westley, M.; Lovell, R.; Wheeler, B. Everyday green space and experienced well-being: The significance of wildlife encounters. Landsc. Res. 2018, 43, 8–19. [Google Scholar] [CrossRef]
  27. Wu, J. Landscape sustainability science: Ecosystem services and human well-being in changing landscapes. Landsc. Ecol. 2013, 28, 999–1023. [Google Scholar] [CrossRef]
  28. Bürgi, M.; Ali, M.P.; Chowdhury, A.; Heinimann, A.; Hett, C.; Kienast, F.; Mondal, M.K.; Upreti, B.R.; Verburg, P.H. Integrated Landscape Approach: Closing the Gap between Theory and Application. Sustainability 2017, 9, 1371. [Google Scholar] [CrossRef] [Green Version]
  29. De Bell, S.; Graham, H.; White, P.C.L. Evaluating Dual Ecological and Well-Being Benefits from an Urban Restoration Project. Sustainability 2020, 12, 695. [Google Scholar] [CrossRef] [Green Version]
  30. Council of Europe. European Landscape Convention; ETC No. 176. Council of Europe: Florence, Italy, 20 October 2000; p. 26. Available online: https://rm.coe.int/1680080621 (accessed on 29 May 2019).
  31. Flick, U. Investigación cualitativa: Relevancia, historia y rasgos. Introd. Investig. Cual. 2004. [Google Scholar] [CrossRef]
  32. Maxwell, J.A.; Reybold, L.E. Qualitative Research. Int. Encycl. Soc. Behav. Sci. Second Ed. 2015, 685–689. [Google Scholar] [CrossRef]
  33. Rapley, T.J. The art(fulness) of open-ended interviewing: Some considerations on analysing interviews. Qual. Res. 2001, 1, 303–323. [Google Scholar] [CrossRef]
  34. Falahatkar, H.; Aminzadeh, B. The sense of place and its influence on place branding: A case study of Sanandaj natural landscape in Iran. Landsc. Res. 2018, 45, 123–136. [Google Scholar] [CrossRef]
  35. Carlsson, J.; Lidestav, G.; Bjärstig, T.; Svensson, J.; Nordström, E.-M. Opportunities for Integrated Landscape Planning—The Broker, the Arena, the Tool. Landsc. Online 2017, 55, 1–20. [Google Scholar] [CrossRef] [Green Version]
  36. Zoderer, B.M.; Carver, S.; Tappeiner, U.; Tasser, E. Ordering ’wilderness’: Variations in public representations of wilderness and their spatial distributions. Landsc. Urban Plan. 2020, 202, 103875. [Google Scholar] [CrossRef]
  37. Carpiano, R.M. Come take a walk with me: The “Go-Along” interview as a novel method for studying the implications of place for health and well-being. Health Place 2009, 15, 263–272. [Google Scholar] [CrossRef] [PubMed]
  38. Kusenbach, M. Street Phenomenology: The Go-Along as Ethnographic Research Tool. Ethnography 2003, 4, 455–485. [Google Scholar] [CrossRef]
  39. Sáenz de Tejada Granados, C.; Van Der Horst, D. Tabula non-rasa: Go-along interviews and memory mapping in a post-mining landscape designated for urban expansion. Landsc. Res. 2019, 45, 6–25. [Google Scholar] [CrossRef]
  40. Jones, P.; Burwood, D. Cycling and the City: Reflections of Commuting Practices. Liminalities A J. Perform. Stud. 2011, 7, 1–38. [Google Scholar]
  41. Jones, P.; Bunce, G.; Evans, J.; Gibbs, H.; Hein, J.R. Exploring space and place with walking interviews. J. Res. Pract. 2008, 4, 1–9. [Google Scholar]
  42. Evans, J.; Jones, P. The walking interview: Methodology, mobility and place. Appl. Geogr. 2011, 31, 849–858. [Google Scholar] [CrossRef]
  43. Colley, K.; Brown, C.; Montarzino, A. Restorative wildscapes at work: An investigation of the wellbeing benefits of greenspace at urban fringe business sites using ‘go-along’ interviews. Landsc. Res. 2016, 41, 598–615. [Google Scholar] [CrossRef]
  44. Eurostat. Population statistics at regional level/es Estadísticas de población a nivel regional. Stat. Explain. 2016. Available online: https://ec.europa.eu/eurostat/statistics-explained/index.php/Archive:Estad%C3%ADsticas_de_poblaci%C3%B3n_a_nivel_regional (accessed on 16 June 2020).
  45. United Nations General Assembly. Habitat III New Urban Agenda: Quito Declaration on Sustainable Cities and Human Settlements for All. Habitat III Conf. 2016, 1–25. [Google Scholar]
  46. Gallardo, M.; Martínez-Vega, J. Three decades of land-use changes in the region of Madrid and how they relate to territorial planning. Eur. Plan. Stud. 2016, 24, 1016–1033. [Google Scholar] [CrossRef] [Green Version]
  47. Hernández Aja, A.; Rodríguez Alonso, R.; Rodríguez Suárez, I. Barrios Vulnerables de las Grandes Ciudades Españolas. 2018. Available online: http://oa.upm.es/51015/ (accessed on 16 June 2020).
  48. Mata Olmo, R.; San Herráis, C. Atlas de Los Paisajes de España; Ministerio de Medio Ambiente: Madrid, Spain, 2003. [Google Scholar]
  49. Consejería de Medio Ambiente y Ordenación del Territorio. Atlas. El Medio Ambiente en la Comunidad de Madrid; Comunidad de Madrid: Madrid, Spain, 2007. [Google Scholar]
  50. Madrid, A. Plan de Calidad del Paisaje Urbano de la Ciudad de Madrid; Ayuntamiento de Madrid: Madrid, Spain, 2009. [Google Scholar]
  51. Rodríguez Romero, E.J. Paisajes de Aproximación a la ciudad de Madrid; ConArquitectura: Madrid, Spain, 2018. [Google Scholar]
  52. Jones, P.; Evans, J. Rescue Geography: Place Making, Affect and Regeneration. Urban Stud. 2012, 49, 2315–2330. [Google Scholar] [CrossRef]
  53. Bergin, M. NVivo 8 and consistency in data analysis: Reflecting on the use of a qualitative data analysis program. Nurse Res. 2011, 18, 6–12. [Google Scholar] [CrossRef] [PubMed]
  54. Weil, J. Research Design in Aging and Social Gerontology: Quantitative, Qualitative, and Mixed Methods; Routledge/Taylor & Francis Group: Washington, DC, 2017. [Google Scholar]
  55. Hernández Carrera, R. La investigación cualitativa a través de entrevistas: Su análisis mediante la teoría fundamentada. Cuest. Pedagógicas Rev. Cienc. Educ. 2014, 23, 187–210. [Google Scholar]
  56. Ritchie, J.; Lewis, J. Qualitative Research Practice; SAGE Publications: Thousand Oaks, CA, USA; New Delhi, India, 2003. [Google Scholar] [CrossRef]
  57. Mason, J. Qualitative Researching; Sage Publications: London, UK, 2002. [Google Scholar]
  58. Glaser, B.; Strauss, A. The Discovery of Grounded Theory; Aldine Press: Chicago, IL, USA, 1967. [Google Scholar]
  59. Kvale, S. Las Entrevistas en Investigación Cualitativa; Ediciones Morata: Madrid, Spain, 2011. [Google Scholar]
  60. Colles, R.; Millman, Z. Landscape, Well-Being and Environment; Routledge: London, UK; New York, NY, USA, 2013. [Google Scholar]
  61. Van Kamp, I.; Leidelmeijer, K.; Marsman, G.; De Hollander, A. Urban environmental quality and human well-being. Landsc. Urban Plan. 2003, 65, 5–18. [Google Scholar] [CrossRef]
  62. Tudor, C. An Approach to Landscape Character Assessment. Natural England: London, UK, 2014. [Google Scholar]
  63. Careri, F. Walkscapes: El Andar Como Práctica Estética; Gustavo GFili: Barcelona, Spain, 2003. [Google Scholar]
  64. Kaplan, R.; Kaplan, S. The Experience of Nature: A Psychological Perspective; Cambridge University Press: Cambridge, UK, 1989. [Google Scholar]
  65. WHO Regional Office for Europe. Urban Green Space Interventions and Health: A review of Impacts and Effectiveness. Copenhagen, Denmark. 2017. Available online: http://www.euro.who.int/en/health-topics/environment-and-health/Housing-and-health/publications (accessed on 23 August 2017).
Figure 1. (a) Functional urban area of Madrid according to Eurostat Statistical Atlas 2017; (b) Location of the area of study in the south-east fringe of the city.
Sustainability 12 06836 g001
Figure 2. Main urban green infrastructures (UGI) and location of interviews in the area of study.
Sustainability 12 06836 g002
Figure 3. Photographs taken by the authors during field work.
Sustainability 12 06836 g003
Figure 4. Semi-structured interview model.
Sustainability 12 06836 g004
Figure 5. Coding process.
Sustainability 12 06836 g005
Figure 6. Graphical representation of theoretical saturation using data from area B and NVivo displays. GA: Go-alongs, SSI: Semi-structured interviews.
Sustainability 12 06836 g006
Figure 7. Hierarchy chart of the nodes mentioned in all the interviews.
Sustainability 12 06836 g007
Figure 8. Hierarchy Chart. Comparison between nodes mentioned in go-alongs vs. semi-structured interviews.
Sustainability 12 06836 g008
Figure 9. X-axis: Nodes mentioned in interviews in area A. Y-axis: Number of references to the nodes.
Sustainability 12 06836 g009
Figure 10. X-axis: Nodes mentioned in interviews in area B. Y-axis: Number of references to the nodes.
Sustainability 12 06836 g010
Figure 11. X-axis: Nodes mentioned in interviews in area C; Y-axis: Number of references to the nodes.
Sustainability 12 06836 g011
Figure 12. Well-being and landscape characterization: a concept diagram.
Sustainability 12 06836 g012
Table 1. Attributes of respondents.
Number of PeopleGenderAge GroupFrequency of VisitAccessDurationLengthAreaType of Interview
1Male51–65Several/monthFoot25 min.600 mAGA
1Female51–65Every dayFoot15 min.200 mAGA
1Male>65Every dayFoot50 min.1 kmAGA
1Male>65Every dayFoot10 min.350 mBGA
1Female31–50Every dayFoot55 min.2.8 kmBGA
1Male>65Every dayFoot35 min.930 mBGA
1Male51–651/weekFoot35 min.2.3 kmBGA
1Male31–50Several/monthFoot10 min.325 mCGA
1Female>651/weekFoot10 min.100 mCGA
1Female31–50Every dayFoot10 min.405 mCGA
2Male and Female51–65Several/weekFoot4.5 min.n/aBSSI
1Female51–65Several/weekFoot11 min.n/aBSSI
3Male (1) and Female (2)19–301/yearFoot8.5 min.n/aBSSI
2Male and Female65 (1) and 0–18 (1)Every dayFoot14.5 min.n/aBSSI
3Female0–18 (2) and >65 (1)1/yearFoot30.5 min.n/aBSSI
1Female>65Several/weekFoot7 min.n/aBSSI
1Female 51–65Several/weekFoot4.5 min.n/aBSSI
1Female31–50Several/weekCar9 min.n/aBSSI
1Male31–50Every dayCar10 min.n/aBSSI
1Male31–501/weekFoot7.5 min.n/aBSSI
2Male and Female31–50Several/weekFoot5 min.n/aCSSI
2Male and Female51–65Several/weekFoot6.5 min.n/aCSSI
2Male and Female51–65Several/weekFoot6 min.n/aCSSI
2Female19–301/monthFoot5 min.n/aCSSI
1Male>65Several/weekFoot6 min.n/aCSSI
1Male31–501/weekPublic transport6.5 min.n/aCSSI
1Male31–50Several/weekFoot6.5 min.n/aCSSI
1Male51–65Several/weekFoot4.5 min.n/aCSSI

