Article

Analysis on Decoupling between Urbanization Level and Urbanization Quality in China

1
School of Public Administration, Hebei University of Economics and Business, Shijiazhuang 050061, China
2
Key Laboratory of Land Surface Pattern and Simulation, Institute of Geographic Sciences and Natural Resources Research, Chinese Academy of Sciences, Beijing 100101, China
3
Handan Surveying Center of Land and Resources, Handan 056000, China
4
Chongqing Institute of Geology and Mineral Resources, Chongqing 400000, China
5
University of Chinese Academy of Sciences, Beijing 100049, China
6
Hebei Urban & Rural Planning and Design Institute, Shijiazhuang 050061, China
7
School of Management Science and Engineering, Hebei University of Economics and Business, Shijiazhuang 050061, China
8
GIS Big Data Platform for Socio-Economy in Hebei, Shijiazhuang 050061, China
*
Author to whom correspondence should be addressed.
Sustainability 2020, 12(17), 6835; https://doi.org/10.3390/su12176835
Submission received: 17 July 2020 / Revised: 12 August 2020 / Accepted: 17 August 2020 / Published: 23 August 2020

Abstract

:
After the first industrial revolution, urbanization level worldwide has increased rapidly. As the largest developing country in the world, China has witnessed a rapid improvement in its urbanization level in recent years. Nevertheless, the quality of urbanization has not been improved simultaneously. The relationship between the level and the quality of urbanization has thus become a hot topic for researchers. By introducing the concept and model of decoupling in the field of resources and environment into the analysis of urbanization level and quality, this study evaluated the relationship between urbanization level and urbanization quality of 285 prefecture-level cities in China from 2005 to 2014. It was found that: (1) The urbanization level and urbanization quality in China are unbalanced because the former is growing in a faster rate than the latter. The average urbanization level of China has increased by 27.40% from 42.99% in 2005 to 54.77% in 2014, while the increase of urbanization quality, however, is much slower with only 11.21% for the same period. It can be concluded that China has paid more attention to urbanization level than urbanization quality. (2) From 2005 to 2014, the relationship between China’s urbanization level and quality showed a total of eight decoupling states, of which the main ones were strong negative decoupling (non-ideal state) and growth negative decoupling (close to ideal state), accounting for 38.32% and 33.49% of the total number of samples in China, respectively. (3) The change of urbanization level and urbanization quality in China can be divided into two stages: for the first stage from 2005 to 2010, with rapid improvement in urbanization level, and the other from 2011 to 2014, with rapid improvement in urbanization quality. (4) Spatially, the areas with significant decoupling between urbanization level and urbanization quality are mainly distributed in underdeveloped areas such as the west; and the decoupling presents the spatial pattern of the highest in the west, the second in the middle, and the lowest in the east.

1. Introduction

In the late 18th century, the first industrial revolution brought about technological reform as well as social change, promoting the rapid development of urbanization worldwide. By 2019, the world’s urbanization level has reached 54%, including 82% in North America, 74% in Europe and 68% in Oceania, and 49% and 43% in Asia and Africa [1]. The urbanization rates in developed countries have been relatively high and stable. In recent years, the urbanization of developing countries has made major contributions to the development of urbanization in the world. During 2008–2018, China’s urbanization rate has seen an annual growth of 1.26% from 46.99% to 59.58%, while in Australia, only a 0.01% annual growth from 84.94% to 86.01% [2].
On the one hand, urbanization promotes regional economic development [3], industrial development [4] and sports culture communication [5]. While on the other hand, due to one-sided pursuit of urbanization development speed, problems of poor urbanization quality in some regions emerge. For example, urban slums appeared in India during its urbanization process. A study of Mumbai found [6] that 23% of people in urban slums may have high-risk suffering from mental disorders due to poor urbanization quality and other reasons. In addition, the investigation of health facilities in Orissa area shows [7] that many health problems are caused by the unsound sanitation facilities in the process of urbanization. In addition, unreasonable rapid urbanization will also have many negative effects on the ecological environment. For example, rapid urbanization occupies a large number of ecological land [8,9,10], causing water and air pollution [11,12], leading to the reduction of biodiversity (such as the density decrease of bird and vegetation) [13], reducing the service function of the ecosystem [14], and even causing the change of the global food structure [15]. The low quality problem caused by the excessive pursuit of urbanization level intensifies the contradiction between resources, environment and population, which is already severe and fragile. Therefore, to clarify the quantitative relationship between the quality and the level of urbanization, and promote their coordinated development, has become the key to solve the problems above.
The term “urbanization quality” is a comprehensive concept reflecting the quality of urbanization, which corresponds to the level of urbanization [16,17]. The level of urbanization is generally expressed by demographic indicators, i.e., the proportion of urban population to the total population [18,19]. However, the quality of urbanization is expressed by a series of composite indicators reflecting the quality of urbanization, which is far more complicated than the level of urbanization [20,21]. For the researches on the early stage of urbanization, urbanization is generally understood as the population shift from rural to urban areas, the expansion of urban area [22,23] and the enhancement of economic strength [24]. With the deepening of research, researchers began to realize that urbanization is not a simple shift of population, land and economy, but the shift of many lifestyles, cultures and values accompanying these shift processes [25,26,27]. Therefore, they began to pay attention to the quality of urban life [28,29], and raised the judging standard to judge the urbanization quality by the level of residents’ living standard. At present, there are three types of internationally influential urbanization quality evaluation systems. One is the index system established by the British geographer Cloke in the 1970s [30,31,32,33], which is composed of 16 indexes from the aspects of population, occupation, living environment and distance from the urban center. The second is the urbanization quality evaluation system established by United Nations Centre for Human Settlements (habitat), which is representative in the international urbanization quality evaluation and mainly includes City Development Index (CDI) and Urban Indicators Guideline (UIG) [34,35,36,37]. The third is Index System of Urban Modernization, mainly including per capita GDP, the proportion of tertiary industry in GDP, the proportion of non-illiterate population, and the proportion of added value of agriculture in GDP [38,39,40]. At present, the research on the quality of urbanization mainly focuses on the construction of an index system [21], comprehensive measurement [41], and coordinated development of population, economy and land [17,29,42]. It can be seen that building a multi-index system to assess the urbanization quality has been widely adopted in related researches.
Considering the close relationship between the level and the quality of urbanization, many researchers have carried out related researches to reveal the impact of level on the quality. For example, Shuang [43] constructed the urbanization level evaluation system by 4 indexes of GDP, population density, proportion of non-agricultural population and proportion of non-agricultural output value, and constructed the urbanization quality evaluation system by 28 indexes from four aspects of economic development, quality of life, social development and ecological environment. Then, they took Baoshan District of Shanghai as an example to discuss the relationship between level and quality of urbanization. Hu [44] firstly sought the optimal pattern of level and speed of urbanization by applying optimal control theory, and then constructed the urbanization quality evaluation system by 31 index systems from aspects including urbanization development coordination degree and sustainable development level of urbanization. After that, Hu discerned the relationship between the urbanization level and quality based on the coupling analysis of the two index systems. In general, there are relatively few studies on the level and the quality of urbanization. In addition, the case areas for research are mostly at a relatively small scale (for example, at the district/county level) rather than at the national scale. Due to the huge regional differences, the conclusions obtained from small regions may not necessarily be applicable in other regions.
Theoretically, overhasty urbanization will inevitably lead to a decline in urbanization quality. However, possibilities exist that new technology and policy will bring about rapid development of urbanization level at the same time of ensuring urbanization quality, i.e., achieving decoupling of the level and the quality of urbanization. “Decoupling” theory was first put forward by the Organization for Economic Co-operation and Development (OECD) [45]. At present, there are many researches on decoupling; for example, some studied the relationship between energy supply and human development in many countries over many years based on the decoupling index of energy footprint. It was found that thanks to the improvement of energy efficiency, the energy supply and human development in high-income countries and low-energy consumption countries have been decoupled [46]. In terms of the decoupling between economic growth and carbon emissions, Wang et al. [47] analyzed the coupling relationship between energy carbon emissions and economic growth in Guangdong Province by applying Tapio decoupling model. It was found that Guangdong realized the decoupling of energy-related carbon emissions and economic growth by adjusting the energy structure and industrial structure. Wu et al. [48] analyzed the coupling trend of world economic growth and carbon dioxide emissions from 1965 to 2015 by adopting the decoupling elasticity analysis (TEA) and IGTX decoupling model. The results showed that the decoupling degree of economic growth and carbon dioxide emissions was high in developed countries, but was unstable and lacked regularity in developing countries. Li et al. [49] studied the decoupling relationship between China’s urban economic growth and carbon emissions from 2000 to 2015 focusing on the central plains urban agglomeration. The study found that among the Central Plains of China, a small number of cities achieved strong decoupling, most cities achieved weak decoupling, and some cities showed an irregular decoupling state. Zhang et al. [50] analyzed the decoupling relationship between land use intensity and ecological environment by applying the decoupling model. The study found that with the input of labor and capital, the land use intensity and ecological environment in Gansu province of China have been decoupled. It can be seen that existing researches have focused on the decoupling of economic growth and carbon emissions, economic growth and pollution, and few have involved decoupling of the level and the quality of urbanization.
In summary, tremendous researches have been conducted in terms of the quality of urbanization as well as the evaluation of urbanization level. However, few have been seen on quantitative measurement of the synergy between urbanization level and urbanization quality. Qualitative or semi-quantitative methods are mainly used in existing researches, and theories and methods of other fields are seldom used. In addition, the existing researches on the relationship between the level and the quality of urbanization are mostly carried out in small areas at the district or county level instead of macro national level, which is not conducive to the systematic summary of the relationship between the two. Therefore, by taking 285 prefecture-level cities as examples, and establishing a comprehensive index system of urbanization quality and introducing the concept of “decoupling” in the field of environment, this paper systematically evaluates the relationship between urbanization level and urbanization quality. Specifically, the research objectives of this paper are as follows: (1) systematically evaluate the urbanization quality of 285 prefecture-level cities in China, and reveal the regional differences of urbanization quality in China; (2) quantitatively evaluate the coupling relationship between China’s urbanization quality and urbanization level by using decoupling model; (3) reveal the regional differences between urbanization quality and urbanization level in China.

2. Method and Data

2.1. Measurement of Urbanization Level

At present, urbanization level is generally evaluated by population index or composite index, of which the former one is most commonly used. In this study, urbanization rate is used as the single index reflecting the urbanization level, i.e., the proportion of urban population to the total population:
U = P u / P
where U represents urbanization level, PU represents urban population, P represents total population.

2.1.1. Evaluation of Urbanization Quality

The quality of urbanization involves the fundamental changes of economic structure, social structure, mode of production and lifestyle. In this paper, the urbanization quality is also evaluated from these aspects. Based on the existing results [17,29,38,39,40,42] of comprehensive measurement index system and following the principles of systematicness, integrity, effectiveness, scientificity and operability, we constructed the urbanization quality evaluation index system involving 4 categories and 25 sub-categories. Among them, land urbanization quality indexes mainly reflect the changes of regional landscape, economic urbanization quality indexes mainly reflect the changes of economic structure, social urbanization quality indexes mainly reflect the changes of residents’ lifestyle, and ecological urbanization quality indexes mainly reflect the changes of urban living environment.
The selection of indicators for evaluating the quality of urbanization in this study mainly references previous researches. As a whole, the urbanization quality of this study mainly considers four kinds of factors: land urbanization quality, economic urbanization quality, social urbanization quality, and ecological urbanization quality. This assessment framework of urbanization quality mainly references the research of Zhang and Wang [17]. In the research of Zhang and Wang, they selected indicators to evaluate the quality of urbanization from four aspects: the suitability of land urbanization, the economic benefits of urban land use, social benefits and ecological benefits. Using this research framework, we selected 25 indicators from four aspects of land urbanization quality, economic urbanization quality, social urbanization quality, and ecological urbanization quality to evaluate the quality of urbanization. Among them, land urbanization quality mainly reflects the changes of regional landscape and its impact on the quality of urbanization. Economic urbanization quality is an important factor to measure the quality of urbanization, mainly reflecting the transformation of the economic structure of the city. Social urbanization quality aims to reflect the social effects of urbanization quality and reflect the changes in residents’ lifestyles. Ecological urbanization quality is not only an important manifestation of the quality of life of residents, but also reflects the changes in the urban living environment.
We have selected 25 indicators from the above four urbanization quality factors to evaluate the urbanization quality (Table 1). For land urbanization quality, we mainly consider the indicators of urban infrastructure construction and urban land structure [38]. For economic urbanization quality, we mainly consider the urban employment, economic output and other indicators [39,40]. For social urbanization quality, we mainly consider the indicators of urban residents’ medical treatment and cultural life [38,39,40]. For ecological urbanization quality, we mainly consider the city’s ability to deal with pollution and waste, and indicators of environmental protection investment [39,40].
Multiple indexes are included in urbanization quality evaluation and the indexes vary in information amount. This affected the comprehensive evaluation of urbanization quality and the corresponding weights. In this paper, entropy method is adopted to determine the weight of urbanization quality index and calculate the comprehensive score of urbanization quality. Determining the weight by entropy method can not only overcome the randomness and presumption that are unavoidable in subjective weighting method, but also effectively solve the problem of overlapping information between multiple index variables.
Entropy method is a mathematical method used to judge the degree of dispersion of an index. The greater the degree of dispersion, the greater the impact of this indicator on the comprehensive evaluation. In information theory, entropy is a measure of uncertainty. The greater the amount of information, the smaller the uncertainty and the smaller the entropy. According to the characteristics of entropy, we can judge the randomness and disorder degree of an event by calculating the entropy value, and can also use the entropy value to judge the degree of dispersion of an index. The greater the degree of dispersion of the index, the better the index has for comprehensive evaluation, and the greater the impact.
The steps for entropy method are as follows:
(1) Standardize the data: The initial data needs to be standardized as the indexes vary in dimensions and magnitudes.
X i j = ( X i j m i n { X j } ) ( m a x { X j } m i n { X j } )
where X i j represents the initial value of the city number i and the index number j, X i j represents the value after standardization.
(2) Calculate the proportion (Yij) of the value of index number j of the city number i:
Y i j = X i j / i = 1 m X i j
(3) Calculate the entropy value (ej) of the index number j:
e j = k i = 1 m Y i j ln Y i j
where k = 1 / ln m , and m represents the number of index.
(4) Calculate the coefficient of variation (Dj) of index number j:
D j = 1 e j
(5) Calculate the weight (wj) of index number j:
w j = D j / j = 1 m D j
(6) Calculate the score of single index (Sij):
S i j = w j × X i j
(7) Comprehensive score (Si) of urbanization quality of the city number i:
S i = j n S i j

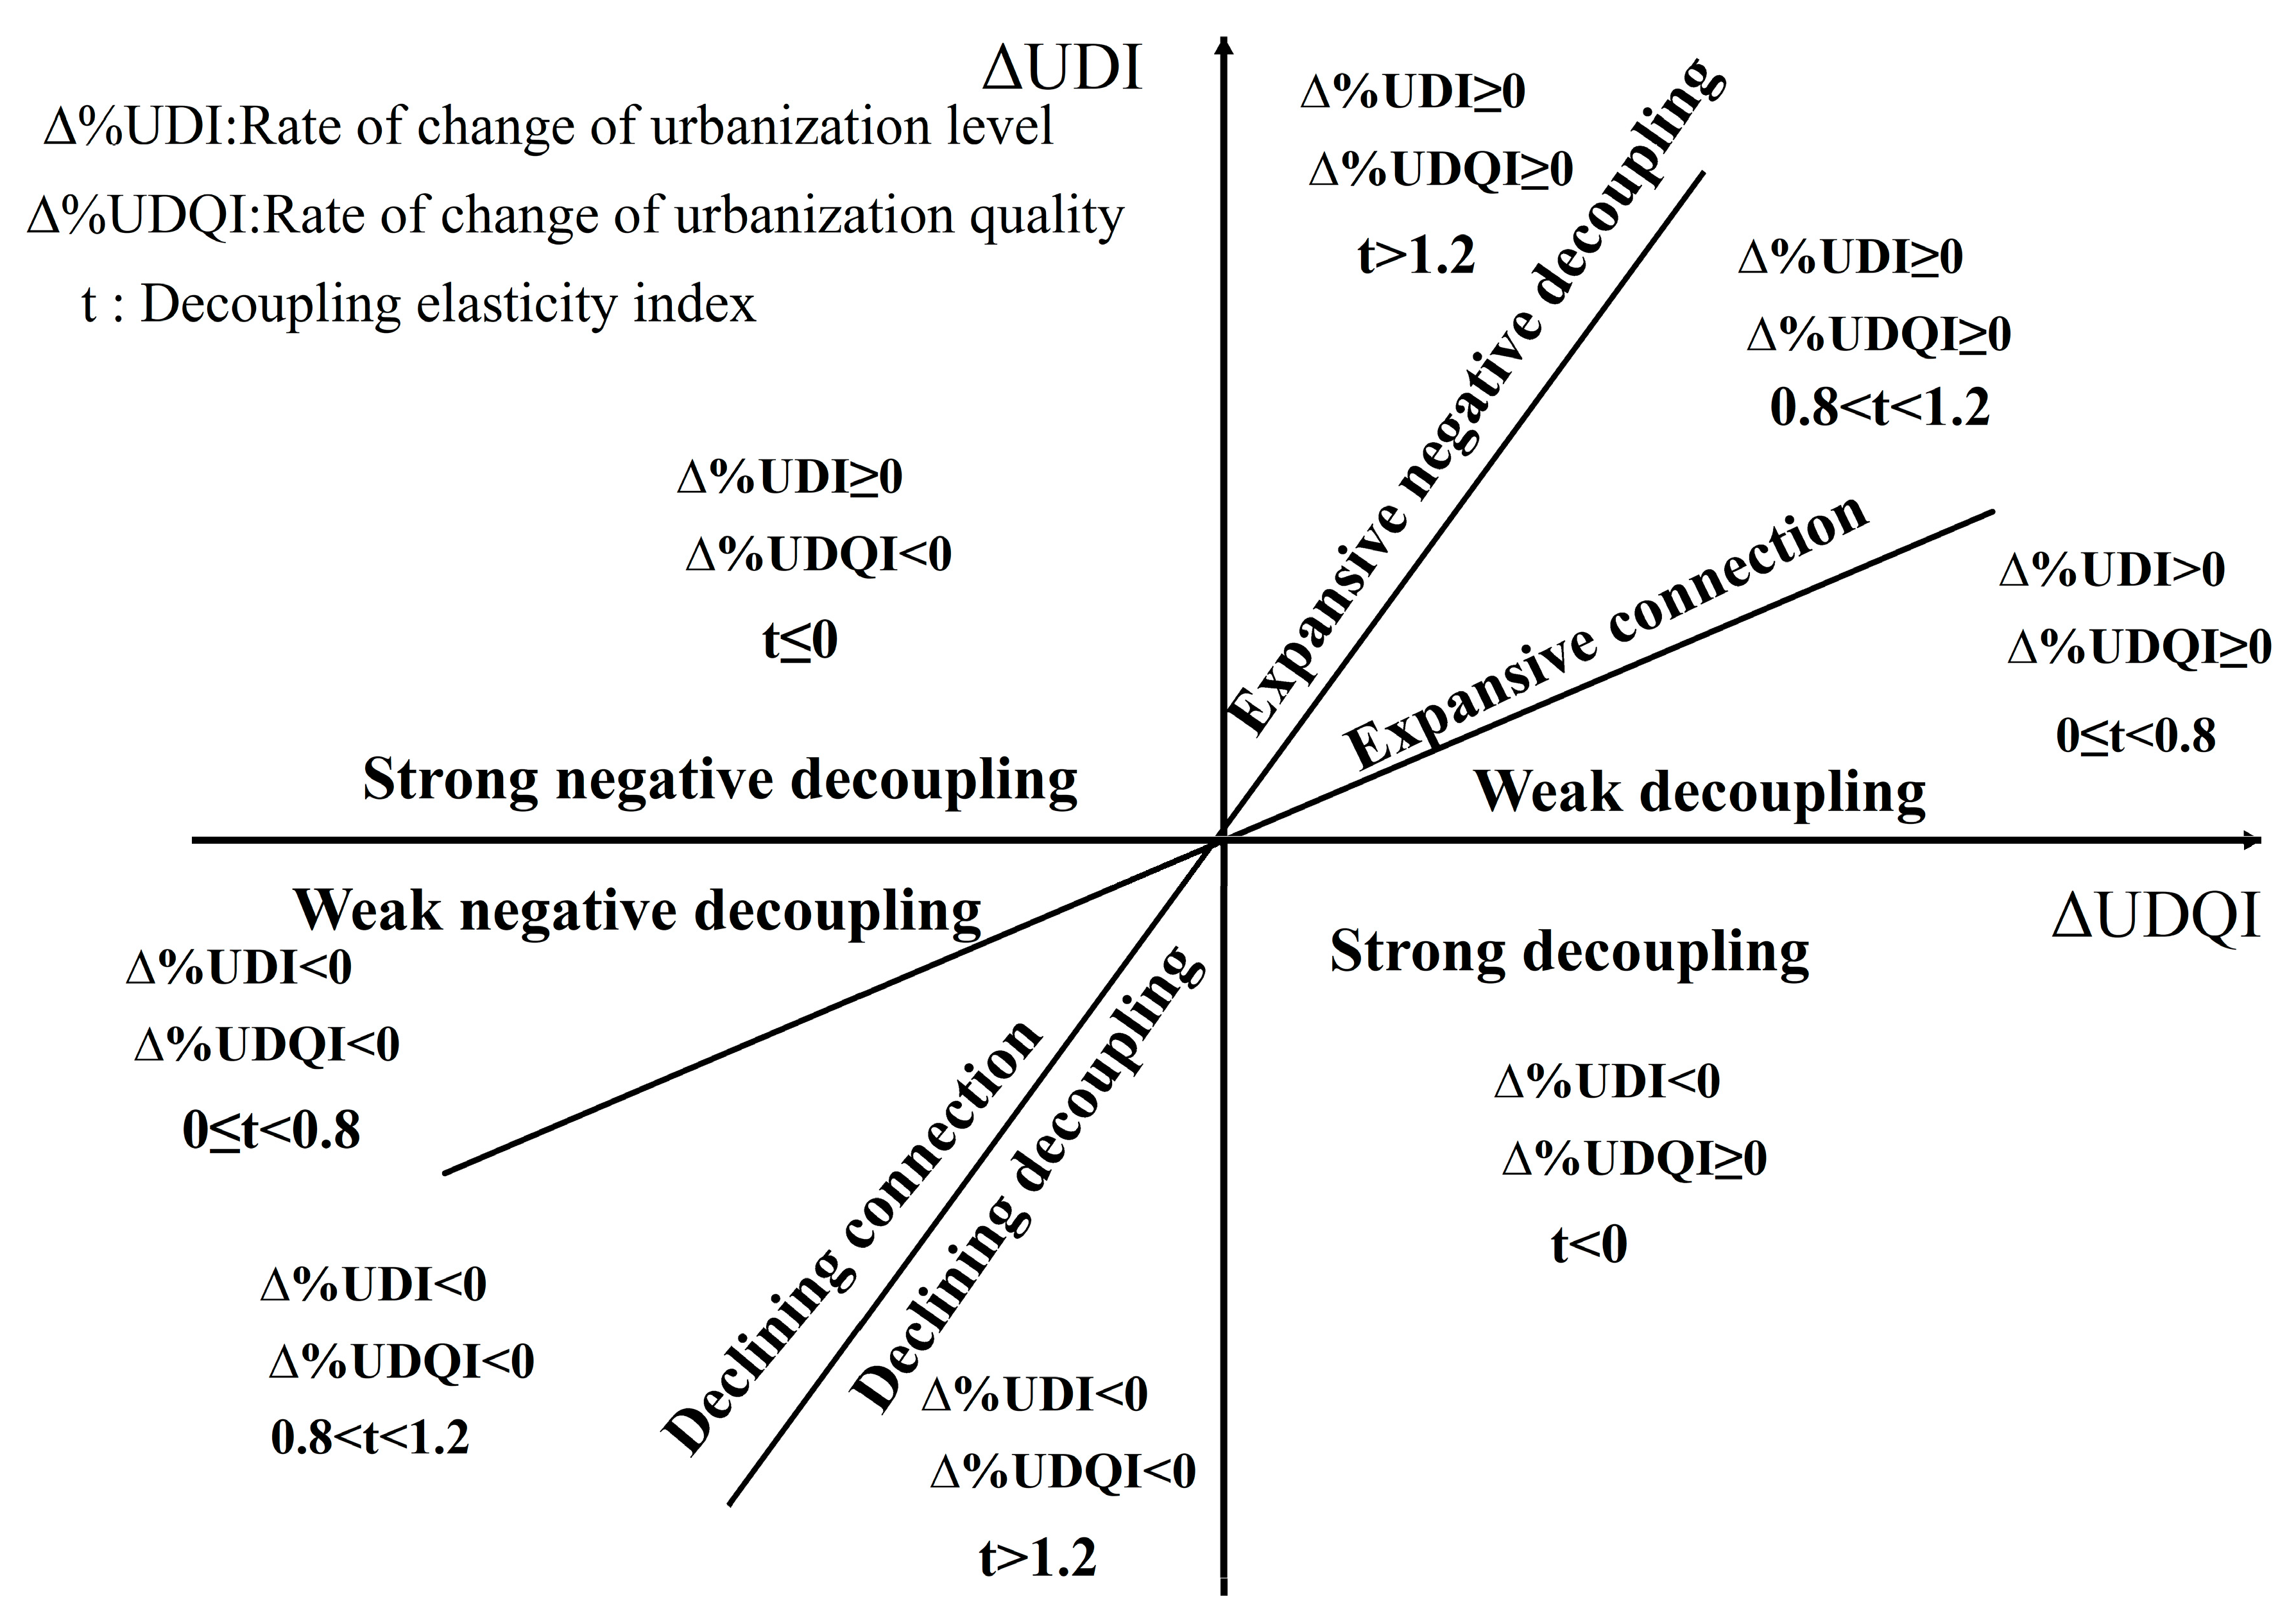
2.1.2. Decoupling Analysis

“Decoupling” originated in the field of physics. It originally referred to the phenomenon that the response relationship between two or more physical quantities no longer exists in physics. At present, it is widely used in the fields of resources and environment, economic development and environmental pressure and agricultural policy. With the further development of decoupling theory, Tapio improved the decoupling model, proposed eight decoupling types, and made an empirical study on urban traffic in Finland [51]. In this paper, the decoupling model developed by Tapio is applied to the analysis of urban level and urbanization quality. The formula for decoupling model of urbanization level and urbanization quality constructed is as follows:
t ( U D I , U D Q I ) = ( Δ % U D I / U D I ) / ( Δ % U D Q I / U D Q I )
where t (UDI,UDQI) represents the decoupling degree between the urbanization level and the urbanization quality, U D I represents the urbanization level, U D Q I represents the urbanization quality, Δ % U D I represents the change rate of the urbanization level, and Δ % U D Q I represents the change rate of the urbanization quality.
Based on the decoupling elasticity, the decoupling of urbanization level and urbanization quality can be further divided into eight types and, namely weak negative decoupling, strong negative decoupling, expansive negative decoupling, weak decoupling, strong decoupling, declining decoupling, declining connection and expansive connection (Table 2). Among them, weak decoupling means that both urbanization level and urbanization quality are rising in growth rate, and urbanization quality growth rate is higher than urbanization level (Figure 1); weak negative decoupling means that both urbanization level and urbanization quality are declining in growth rate, and the decline rate of urbanization quality is greater than urbanization level; expansive connection represents that both urbanization level and urbanization quality are rising in growth rate, and the rising rate is roughly the same; declining connection means the urbanization level and urbanization quality are declining in growth rate, and the decline rate is roughly the same; expansive negative decoupling means that both the urbanization level and the urbanization quality are rising in growth rate, but the urbanization level growth rate is greater than the urbanization quality; declining decoupling represents that both the urbanization level and urbanization quality are declining in growth rate, and the decline rate of urbanization level is greater than the quality of urbanization; strong negative decoupling means that the growth rate of urbanization level continues to rise, while the growth rate of urbanization quality is declining; strong decoupling means that the growth rate of urbanization quality continues to rise, while the growth rate of urbanization level is declining.
The eight decoupling types mentioned above are divided into three types: ideal state, close to ideal state and non-ideal state. Among which, expansive connection is ideal state; expansive negative decoupling and weak decoupling belong to close to ideal state; strong negative decoupling, strong decoupling, weak negative decoupling, declining decoupling and declining connection belong to non-ideal state.

2.2. Data Source

The data used in this research mainly come from China City Statistical Yearbook. The statistical yearbook of 285 prefecture-level cities and the bulletin of national economic and social development of prefecture-level cities were downloaded from the website of the National Bureau of Statistics of China [50,52]. By going through these resources, data of urbanization level and urbanization quality related to 285 prefecture-level and above cities are obtained. Part of the index data is obtained by processing and calculating the data obtained from the statistical yearbook.

3. Results

3.1. Changes of Urbanization Level in China

In nearly 30 years of development after reform and opening up, China’s urbanization level has been rapidly improved. The overall urbanization level in China reached 42.99% in 2005 and further increased to 54.77% in 2014, achieving an increase of 11.78%. Seen from regional distribution of urbanization level, it shows a gradual decline from east to central and then to west (Figure 2). In 2014, Shenzhen, a city in the eastern region, was the highest in urbanization level as it reached 100%; however, the city lowest in urbanization level was Longnan in the western region and rated 23.37%, less than a quarter of Shenzhen.
The urbanization rate from 0% to 100% are divided into nine sections to further analyze the characteristics of urbanization level of prefecture-level cities in China (Table 3). It can be found after analysis that: (1) The urbanization level in China is increasing in general, and urbanization level of most cities has been steadily improved year by year with a few exceptions. In 2005, the number of cities in the nine sections were 7, 47, 91, 63, 40, 15, 11, 9, and 3, respectively. In 2014, the numbers were 0, 4, 32, 92, 71, 49, 19, 15 and 6, respectively. In 2005, most cities fell into the urbanization rate section 30–40%, accounting for 31.8% of the total cities but decreased to 11.1% in 2014. In 2014, most cities fell into the urbanization rate section with 40–50%, accounting for 31.9% of the total cities, which was increased from 22% in 2005. (2) Fewer cities fell into relatively low or high urbanization rate sections; the proportion of cities in the range of 10–20% fell from 2.4% in 2005 to 0% in 2014; the proportion of cities in the range of 90–100% increased from 1% in 2005 to 2.1% in 2014. (3) The most obvious change in the number of cities is the range of 30–40%. The level of urbanization gradually shifts to 40–50% and 50–60%. In 2014, the city with urbanization level of 55% outnumbered that of 50% (Table 3).

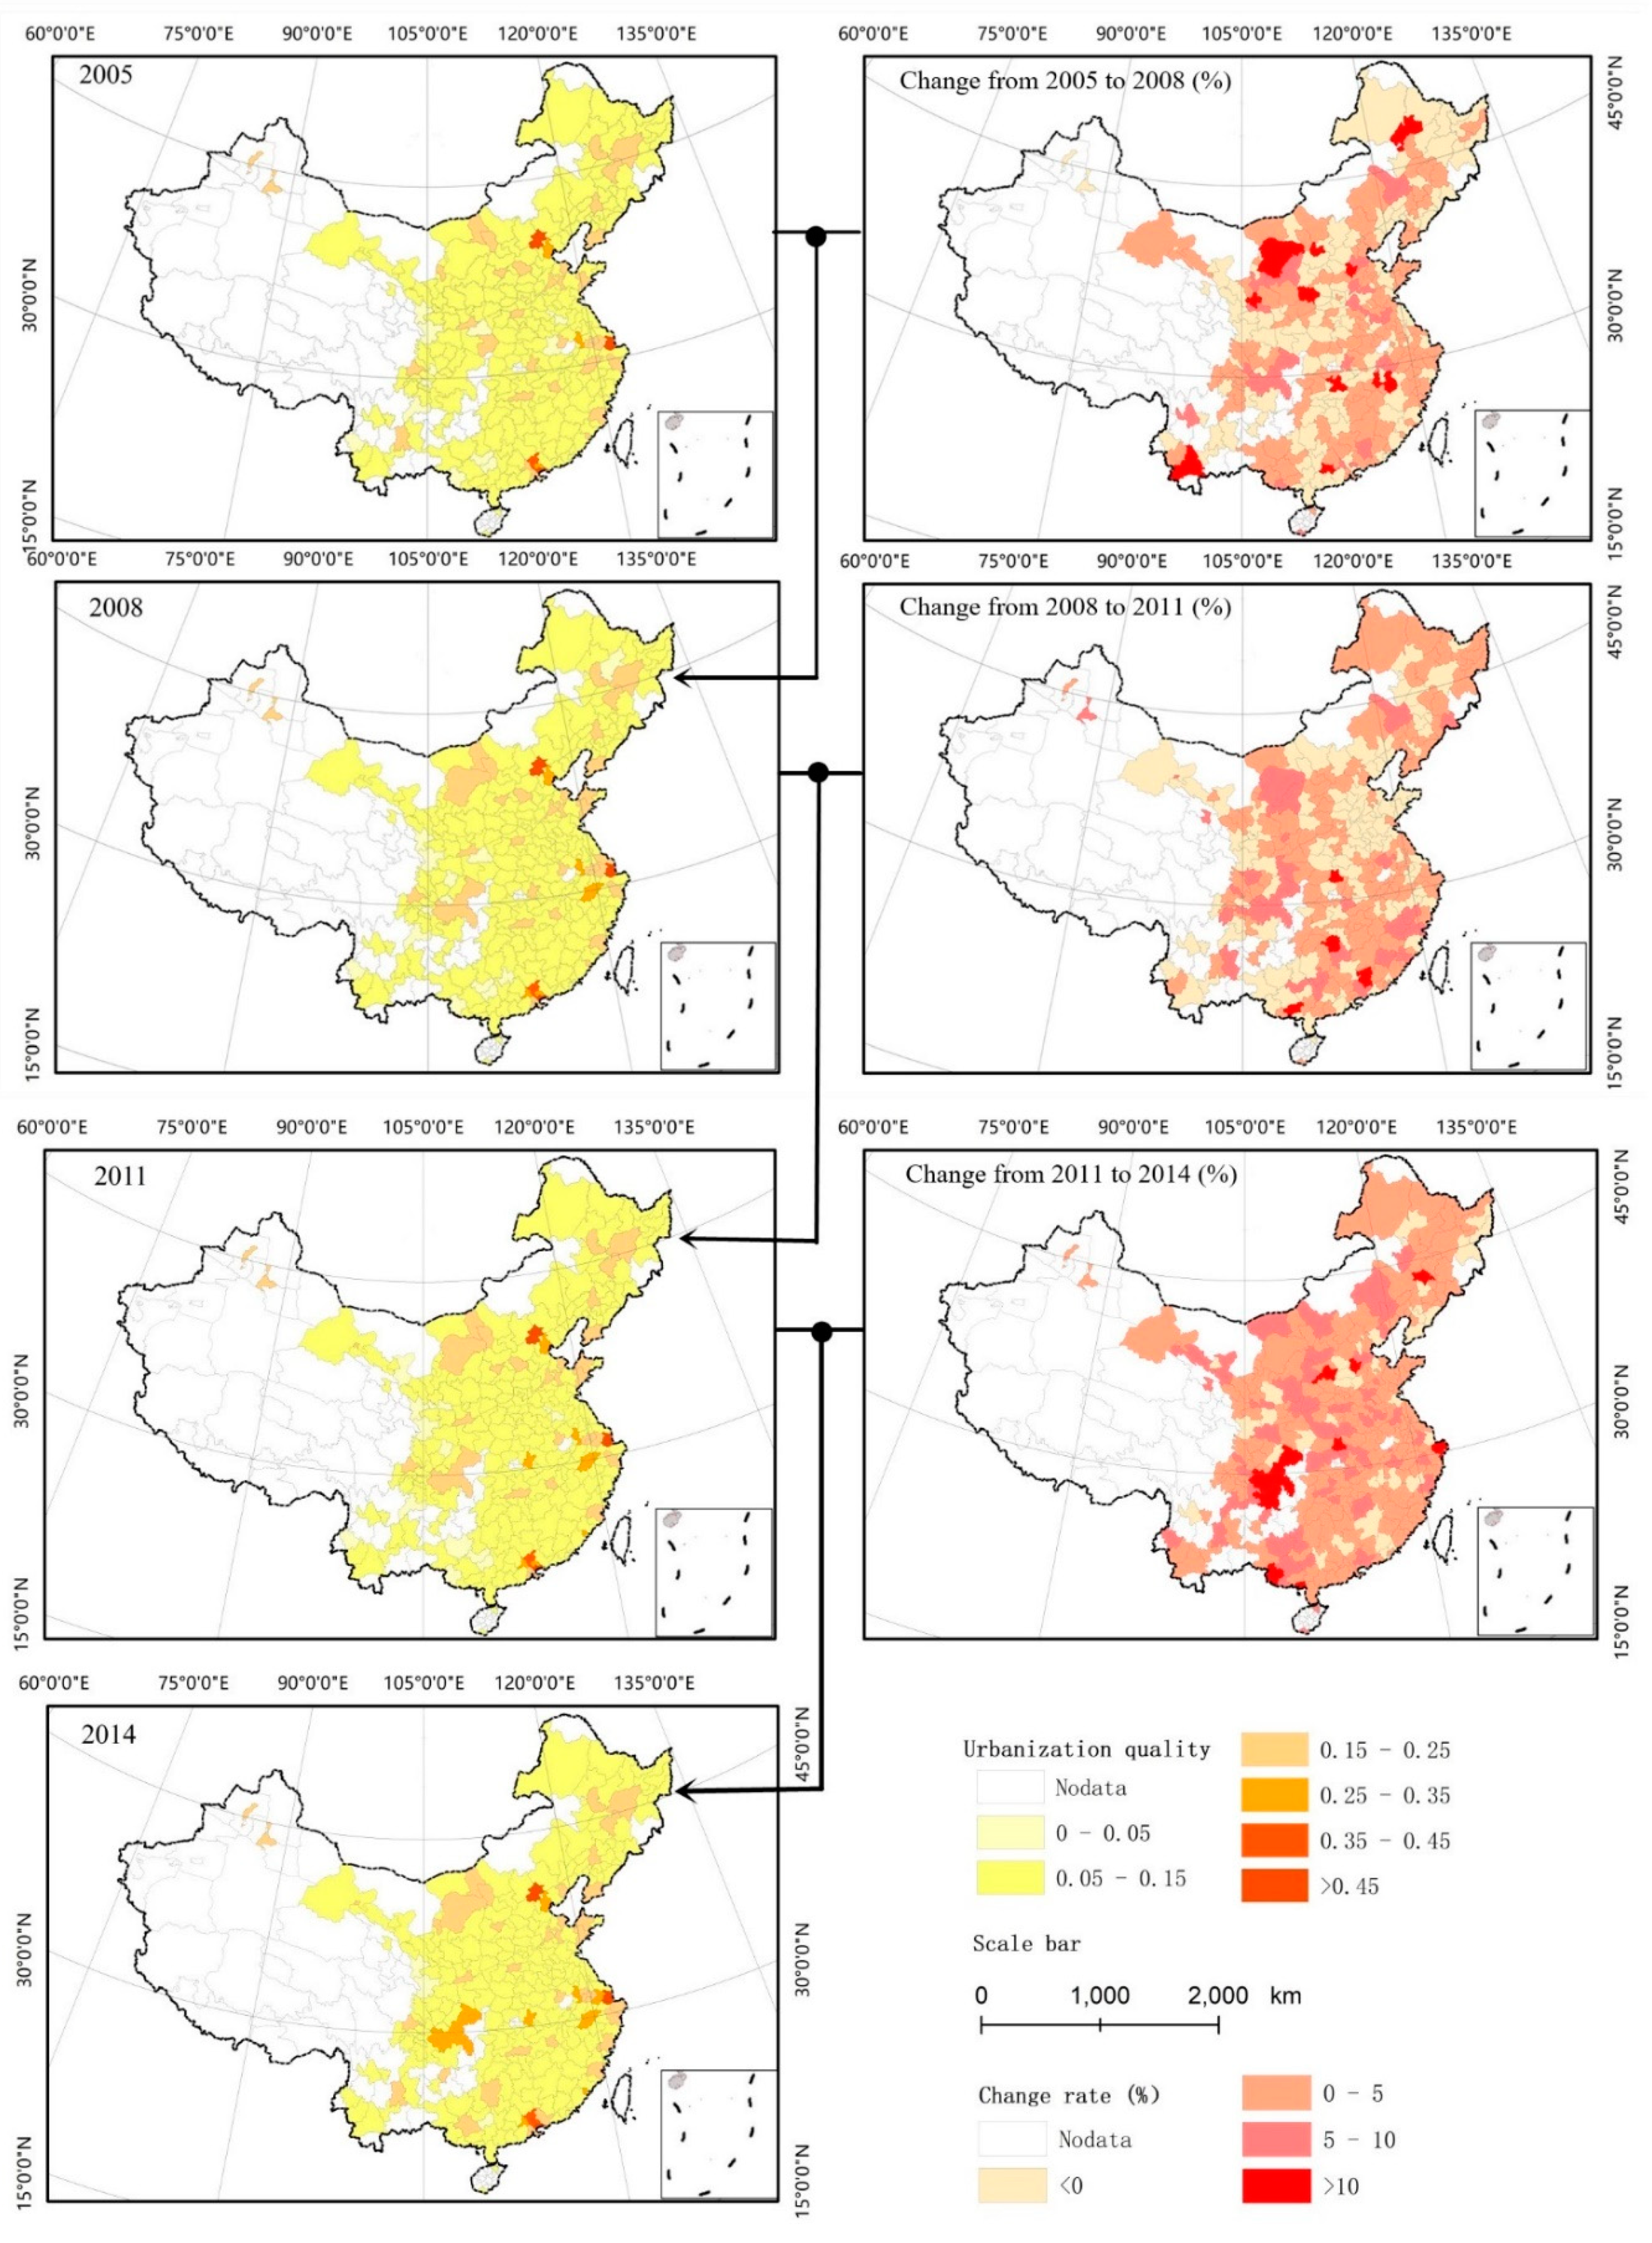
3.2. Change of Urbanization Quality

Generally speaking, the comprehensive score of urbanization quality in China shows an overall growth trend from 2005 to 2014. Except for a slight decrease in some cities in 2008–2010, the rest of the cities showed an upward trend in all years (Figure 3), and the national average score of urbanization quality increased from 0.107 in 2005 to 0.119 in 2014.
In 2005, twelve cities including Dingxi, Shangluo, Suining, Longnan, Guigang, Lu’an, Baoshan, Zhaotong, Suzhou (Anhui), Neijiang, Chongzuo and Laibin City, which are mainly distributed in the central and western regions (Figure 3), had a comprehensive score of urbanization quality below 0.050; and only Shenzhen, Shanghai, Beijing and Guangzhou had a comprehensive score of urbanization quality over 0.300. These cities showed a dotted and centralized distribution in the Beijing-Tianjin-Hebei, Yangtze River Delta and Pearl River Delta Urban Agglomerations.
The quality of urbanization improved in China in 2014. On the one hand, the number of cities with the comprehensive score of urbanization quality below 0.050 has dropped to 3, namely Dingxi, Guigang and Longnan; and on the other hand, the number of cities with the comprehensive score of urbanization quality above 0.30 has increased to 8, namely Shenzhen, Shanghai, Beijing, Guangzhou, Dongguan, Tianjin, Nanjing and Wuhan.
There are obvious regional differences in the quality of urbanization in China (Figure 3). Endowed with superior location and high economic level, coastal cities in the eastern region mark have higher urbanization quality scores. In the contrary, northwestern and southwestern cities with relatively backward economic development tend to have lower scores. In 2014, among the cities with comprehensive score of urbanization quality above 0.200, the eastern region accounted for 69.23%, the central region accounted for 19.23%, and the western region accounted for 11.54%. The central and western cities with the comprehensive score of urbanization quality below 0.200 accounted for more than 67.95%. It can be seen that the cities with higher urbanization quality are distributed in the eastern region, while the cities with lower urbanization quality are distributed in the central and western regions, and the basic patterns show no significant change.

3.3. Decoupling States

From 2006 to 2014, there are eight decoupling states in the relationship between urbanization level and urbanization quality of cities at prefecture-level and above in China, among which, the main decoupling states are strong negative decoupling and expansive negative decoupling, accounting for 38.32% and 33.49% of the total sample number in China (Table 4), respectively. This shows that both the level and quality of urbanization increase significantly, but on the whole, the growth rate of urbanization quality is lower than that of urbanization level. Based on the relationship between the growth rate of the level of urbanization and the quality of urbanization, the research period can be divided into two stages: 2006–2010 and 2011–2014.
Stage I (2006–2010): It mainly experienced the process of strong negative decoupling—expansive negative decoupling—strong negative decoupling—expansive negative decoupling—strong negative decoupling (Figure 4). Strong negative decoupling and expansive negative decoupling are the main decoupling types in this period. On average, there are more than 127 and 77 cities with strong negative decoupling and expansive negative decoupling each year, respectively, accounting for 71.93% in total. However, annually, on average, there are only 36 cities with strong decoupling and weak decoupling, accounting for 12.63%, far less than that of strong negative decoupling and expansive negative decoupling, and higher in fluctuation range. For example, in 2006, the cities of strong decoupling and weak decoupling numbered 2 and 8, respectively, but in 2009, they numbered 14 and 61, respectively. It shows that, while the level of urbanization in China continued to increase during this period, the quality of urbanization showed a fluctuating increase, and the increase rate of urbanization quality was lower than that of urbanization level.
Stage II (2011–2014): Strong negative decoupling and expansive negative decoupling are also the main decoupling types in this period (Figure 5). On average, there are more than 86 and 117 cities with strong negative decoupling and expansive negative decoupling each year, respectively. On the whole, compared with the previous stage, the number of cities with strong negative decoupling decreased by 41, while that of expansive negative decoupling increased by 40. The proportion of strong decoupling and weak decoupling increased from 12.63% in the previous stage to 17.45%. Among them, the number of weak decoupling reached 60 in 2014, and the number of expansive connections reached 27. This shows that both the urbanization level and urbanization quality improved in China during this period, dominated by the growth of urbanization level. However, compared with stage I, the growth rate of urbanization quality in this period is more significant. For example, the number of cities whose growth rate of urbanization quality is higher than the urbanization level in 2014 is 20.00% higher than that in 2006.
The decoupling degree of urbanization level and quality in China has gradually increased from east to west. In the west, the decoupling degree of urbanization level and quality is the highest, the mutual promotion of the two is weak, and the improvement of urbanization level cannot effectively drive the improvement of urbanization quality. The reason is that the level and quality of urbanization in the western region are low due to the limitations of its own location conditions, economic development level and resources, and environment carrying capacity. In the process of urbanization development, more attention has been paid to the improvement of urbanization level, and the construction of urbanization quality is ignored, so the decoupling degree is most obvious. On the contrary, compared with the western region, the eastern region has superior location conditions, higher economic development level, and its urbanization level has been in a higher stage. In the process of urban development, the level of urbanization is no longer the main goal, and more attention tends to be paid to the improvement of the quality of urbanization. The improvement of urbanization level can effectively promote the improvement of urbanization quality, so the degree of decoupling is relatively low. The level and quality of urbanization in the central region lies in the middle of the eastern and western regions; it is also the case for its decoupling degree of urbanization level and urbanization quality because it is weaker than that of the western region, but stronger than that of the eastern region.

4. Conclusions and Discussion

We analyzed the decoupling status between urbanization level and urbanization quality in China. The results show that the level and quality of urbanization have not been improved simultaneously in China, and the growth rate of urbanization level is higher than that of urbanization quality. The level of urbanization in China increased from 42.99% in 2005 to 57.35% in 2016, but the quality of urbanization improves at a slower rate. The comprehensive score of national urbanization quality only achieved an increase of 0.012 from 0.107 in 2005 to 0.119 in 2014. Moreover, the cities in ideal decoupling type—expansive connection state—are less than 12 each year on average, accounting for only 4.02%. The basic pattern of urbanization level and urbanization quality in the non-ideal state has not changed, which is extremely challenging. In particular, the development mode of paying more attention to urbanization level than urbanization quality has hindered the coordinated development of China’s urbanization, resulting in frequent occurrence of strong negative decoupling types. Therefore, in the process of urbanization construction, attention should be paid to the improvement of urbanization quality while improving the urbanization level, ensuring them in an ideal growth state.
In China, the urbanization developed is mainly based on the coexistence of continuous growth of urbanization level and fluctuating growth of urbanization quality. From 2006 to 2014, the relationship between urbanization level and urbanization quality in China showed a total of eight decoupling states, among which, the main ones are strong negative decoupling and expansive negative decoupling, accounting for 38.32% and 33.49%, respectively, of the total national sample, showing the simultaneous improvement of the urbanization quality and the urbanization level, and the growth rate of urbanization quality is lower than that of urbanization level. Based on the relationship between the growth rate of the level and the quality of urbanization, the research period can be divided into two stages: for the first stage from 2006 to 2010, with rapid and obvious improvement in urbanization level, and relatively slow improvement in urbanization quality, and the other stage from 2011 to 2014, with rapid and significant improvement in urbanization quality.
Spatially, the decoupling degree of urbanization level and urbanization quality in China is gradually weakened from west to east. Significant decoupling areas are concentrated in the western and other economically backward areas, and the decoupling rate in eastern region is lower. The different degree of decoupling indicates the unbalanced development of urbanization in eastern, central and western regions of China. For example, the urbanization level of Shenzhen in the eastern region has reached 100%, the quality of urbanization in the eastern region is relatively high, and the three cities of Shenzhen, Shanghai and Beijing that top the urbanization quality are all in the eastern region. In 2014, the cities with expansive negative decoupling, weak decoupling and expansive connection that represent increase in both the urbanization level and urbanization quality accounted for 67.72% of the eastern region, among which, 27 cities were in expansive connection state. However, in the western region, the cities with the lowest level of urbanization accounted for 23.37%, the cities with strong negative decoupling, strong decoupling, weak negative decoupling, declining decoupling and declining connection that represent decline in the urbanization level or urbanization quality accounted for 78.57%, among which, four cities were in expansive connection state. Moreover, generally, western cities rank low on the list of urbanization quality. The different degree of decoupling between urbanization level and urbanization quality in eastern, central and western China shows that when the urbanization level reaches a certain degree, eastern cities gradually attach importance to and mainly aim at improving the quality of urbanization. On the contrary, due to the low level of urbanization, the central and western cities attach more importance to and primarily aim at improving the level of urbanization, lagging behind eastern cities in urbanization quality and finally, make improvements in urbanization quality.
The decoupling analysis of urbanization level and urbanization quality can provide some new ideas for sustainable urbanization research. The level of urbanization can reflect the speed of urban development in a country or region, but it cannot effectively reveal the sustainability and rationality of urban development. Our research can provide two references for sustainable urbanization research. First, our research can provide some criterions for assessing the sustainability of urbanization. According to the decoupling analysis of urbanization level and urbanization quality, we can find the key areas of strong negative decoupling. In other words, these areas may have problems in sustainable urbanization, and the direction and strategy of urbanization of these areas need to be adjusted in time. Second, our research can reveal the shortcomings of the spatial layout of sustainable urbanization and provide references for the rational arrangement of urban patterns. The spatial analysis of the coordination between the level of urbanization and the quality of urbanization can help compare the differences in sustainable urbanization development between different regions, and provide support for further strengthening the coordinated development of sustainable urbanization.
Decoupling may not only exist between level of urbanization and the quality of urbanization but also occur between urbanization and energy consumption. Researches have shown that China’s urban energy consumption per capita is 1.8 times of the national average. In general, there will be large-scale infrastructure construction in the early stages of urbanization, leading to an increase in energy consumption. In the later period of urbanization, the urban economic structure changed and the urban income increased. Thus, the availability of commercial energy for urbanization could also increase. Therefore, the impact of urbanization on the total energy consumption is generally positive. Specifically, the researchers’ conclusions on relationship between urbanization and energy consumption are relatively consistent, that is, there is a long-term equilibrium co-integration relationship between urbanization and energy consumption. The increase in the level of urbanization will bring about an increase in energy consumption, but the elasticity index is not fixed. The development of science and technology and the improvement of energy efficiency may make the elasticity index smaller.

Author Contributions

Conceptualization, X.Z. and W.S.; methodology, X.Z., W.S., B.W. and D.Y.; software, J.W., B.W. and D.Y.; formal analysis, X.Z., W.S., J.W., B.W., D.Y., S.J. and Y.W.; investigation, X.Z.; resources, X.Z. and W.S.; writing—original draft preparation, X.Z., W.S., J.W., B.W., D.Y., S.J. and Y.W.; writing—review and editing, X.Z. and W.S.; supervision, W.S.; funding acquisition, X.Z. and W.S. All authors have read and agreed to the published version of the manuscript.

Funding

This research was funded by the National Natural Science Foundation of China (grant nos. 41501202, 41701100 and 41671177), Research Fund of Hebei University of Economics and Business (grant no. 2019ZD06), R&D Program of Hebei University of Economics and Business and the Program of the Humanities and Social Sciences Research of Ministry of Education of China (grant no. 17YJCZH192).

Conflicts of Interest

The authors declare no conflict of interest. The funders had no role in the design of the study; in the collection, analyses, or interpretation of data; in the writing of the manuscript; nor in the decision to publish the results.

References

  1. Duffin, E. Degree of Urbanization (Percentage of Urban Population in Total Population) by Continent in 2019. Available online: https://www.statista.com/statistics/270860/urbanization-by-continent/ (accessed on 26 April 2019).
  2. National Bureau of Statistics. China Statistical Yearbook; China Statistics Press: Beijing, China, 2017.
  3. Day, J.; Ellis, P. Urbanization for Everyone: Benefits of Urbanization in Indonesia’s Rural Regions. J. Urban Plan. Dev. 2014, 140, 04014006. [Google Scholar] [CrossRef]
  4. Lee, T. Southern Appalachia’s Nineteenth-Century Bright Tobacco Boom: Industrialization, Urbanization, and the Culture of Tobacco. Agric. Hist. 2014, 88, 175–206. [Google Scholar] [CrossRef]
  5. Wang, J.Z. Research on the Investigation of Current Situation of the Sports Culture of the Square under the Trend of Rural Urbanization in Shandong Province. Agro Food Ind. Hi-Tech 2017, 28, 2989–2993. [Google Scholar]
  6. Subbaraman, R.; Nolan, L.; Shitole, T.; Sawant, K.; Shitole, S.; Sood, K.; Nanarkar, M.; Ghannam, J.; Betancourt, T.S.; Bloom, D.E.; et al. The psychological toll of slum living in Mumbai, India: A mixed methods study. Soc. Sci. Med. 2014, 119, 155–169. [Google Scholar] [CrossRef] [Green Version]
  7. Heijnen, M.; Routray, P.; Torondel, B.; Clasen, T. Neighbour-shared versus communal latrines in urban slums: A cross-sectional study in Orissa, India exploring household demographics, accessibility, privacy, use and cleanliness. Trans. R. Soc. Trop. Med. Hyg. 2015, 109, 690–699. [Google Scholar] [CrossRef] [PubMed] [Green Version]
  8. Fu, P.; Weng, Q. A time series analysis of urbanization induced land use and land cover change and its impact on land surface temperature with Landsat imagery. Remote Sens. Environ. 2016, 175, 205–214. [Google Scholar] [CrossRef]
  9. Song, W.; Song, W.; Gu, H.-H.; Li, F. Progress in the Remote Sensing Monitoring of the Ecological Environment in Mining Areas. Int. J. Environ. Res. Public Health 2020, 17, 1846. [Google Scholar] [CrossRef] [PubMed] [Green Version]
  10. Van Vliet, J.; Eitelberg, D.A.; Verburg, P.H. A global analysis of land take in cropland areas and production displacement from urbanization. Glob. Environ. Chang. 2017, 43, 107–115. [Google Scholar] [CrossRef]
  11. Goel, P.; Saxena, A.; Singh, D.S.; Verma, D. Impact of Rapid Urbanization on Water Quality Index in Groundwater Fed Gomati River, Lucknow, India. Curr. Sci. 2018, 114, 650–654. [Google Scholar] [CrossRef]
  12. Han, L.; Zhou, W.; Li, W.; Li, L. Impact of urbanization level on urban air quality: A case of fine particles (PM 2.5) in Chinese cities. Environ. Pollut. 2014, 194, 163–170. [Google Scholar] [CrossRef]
  13. Aronson, M.F.J.; La Sorte, F.A.; Nilon, C.H.; Katti, M.; Goddard, M.A.; Lepczyk, C.A.; Warren, P.S.; Williams, N.S.G.; Cilliers, S.; Clarkson, B.; et al. A global analysis of the impacts of urbanization on bird and plant diversity reveals key anthropogenic drivers. Proc. R. Soc. B Biol. Sci. 2014, 281, 20133330. [Google Scholar] [CrossRef] [PubMed]
  14. Peng, J.; Tian, L.; Yanxu, L.; Zhao, M.; Hu, Y.; Wu, J. Ecosystem services response to urbanization in metropolitan areas: Thresholds identification. Sci. Total Environ. 2017, 607, 706–714. [Google Scholar] [CrossRef] [PubMed]
  15. Tilman, D.; Clark, M. Global diets link environmental sustainability and human health. Nature 2014, 515, 518–522. [Google Scholar] [CrossRef] [PubMed]
  16. Zhou, D.-L.; Xu, J.; Wang, L.; Lin, Z. Assessing urbanization quality using structure and function analyses: A case study of the urban agglomeration around Hangzhou Bay (UAHB), China. Habitat Int. 2015, 49, 165–176. [Google Scholar] [CrossRef]
  17. Zhang, W.; Wang, M.Y. Spatial-temporal characteristics and determinants of land urbanization quality in China: Evidence from 285 prefecture-level cities. Sustain. Cities Soc. 2018, 38, 70–79. [Google Scholar] [CrossRef]
  18. Berry, B.J.L. Urbanization. In Urban Ecology: An International Perspective on the Interaction Between Humans and Nature; Marzluff, J.M., Shulenberger, E., Endlicher, W., Alberti, M., Bradley, G., Ryan, C., Simon, U., ZumBrunnen, C., Eds.; Springer US: Boston, MA, USA, 2008; pp. 25–48. [Google Scholar]
  19. Davis, K. The Urbanization of the Human Population. Sci. Am. 1965, 213, 40–53. [Google Scholar] [CrossRef]
  20. Clark, D.; Kahn, J.R.; Ofek, H. City Size, Quality of Life, and the Urbanization Deflator of the GNP: 1910–1984. South. Econ. J. 1988, 54, 701. [Google Scholar] [CrossRef]
  21. Wang, J.; Wang, S.; Li, S.; Feng, K. Coupling analysis of urbanization and energy-environment efficiency: Evidence from Guangdong province. Appl. Energy 2019, 254, 113650. [Google Scholar] [CrossRef]
  22. Carnahan, D.; Gove, W.; Galle, O.R. Urbanization, Population Density, and Overcrowding: Trends in the Quality of Life in Urban America. Soc. Forces 1974, 53, 62–72. [Google Scholar] [CrossRef]
  23. Barles, S.; Lestel, L. The Nitrogen Question. J. Urban Hist. 2007, 33, 794–812. [Google Scholar] [CrossRef]
  24. Du, D. The causal relationship between land urbanization quality and economic growth: Evidence from capital cities in China. Qual. Quant. 2016, 51, 2707–2723. [Google Scholar] [CrossRef]
  25. Song, W.; Pijanowski, B.C. The effects of China’s cultivated land balance program on potential land productivity at a national scale. Appl. Geogr. 2014, 46, 158–170. [Google Scholar] [CrossRef]
  26. Song, W.; Pijanowski, B.C.; Tayyebi, A. Urban expansion and its consumption of high-quality farmland in Beijing, China. Ecol. Indic. 2015, 54, 60–70. [Google Scholar] [CrossRef]
  27. Zhang, Y.; Li, X.; Song, W. Determinants of cropland abandonment at the parcel, household and village levels in mountain areas of China: A multi-level analysis. Land Use Policy 2014, 41, 186–192. [Google Scholar] [CrossRef]
  28. Adams, S.; Klobodu, E.K.M. Urbanization, democracy, bureaucratic quality, and environmental degradation. J. Policy Model. 2017, 39, 1035–1051. [Google Scholar] [CrossRef]
  29. Guan, X.; Wei, H.; Lu, S.; Dai, Q.; Su, H. Assessment on the urbanization strategy in China: Achievements, challenges and reflections. Habitat Int. 2018, 71, 97–109. [Google Scholar] [CrossRef]
  30. Cloke, P.J. An index of rurality for England and Wales. Reg. Stud. 1977, 11, 31–46. [Google Scholar] [CrossRef]
  31. Cloke, P.; Edwards, G. Rurality in England and Wales 1981: A replication of the 1971 index. Reg. Stud. 1986, 20, 289–306. [Google Scholar] [CrossRef]
  32. Cloke, P.J. Changing patterns of urbanisation in rural areas of England and Wales, 1961–1971. Reg. Stud. 1978, 12, 603–617. [Google Scholar] [CrossRef]
  33. Galluzzo, N. An assessment of rurality in Italian farms using a quantitative approach. Bulg. J. Agric. Sci. 2019, 25, 433–438. [Google Scholar]
  34. United Nations Centre for Human Settlements. The State of the World’s Cities; UN-HABITAT: Nairobi, Kenya, 2001. [Google Scholar]
  35. Habitat, U.N. State of the World’s Cities 2012/2013: Prosperity of Cities; Routledge: London, UK, 2013. [Google Scholar]
  36. Michael, F.L.; Noor, Z.Z.; Figueroa, M.J. Review of urban sustainability indicators assessment—Case study between Asian countries. Habitat Int. 2014, 44, 491–500. [Google Scholar] [CrossRef]
  37. Huovila, A.; Bosch, P.; Airaksinen, M. Comparative analysis of standardized indicators for Smart sustainable cities: What indicators and standards to use and when? Cities 2019, 89, 141–153. [Google Scholar] [CrossRef]
  38. Yang, J.; Chen, W. Research on the evaluation model of the modernization level of urban construction in Jiangsu Province, China. Sci. China Ser. E Technol. Sci. 2010, 53, 2510–2514. [Google Scholar] [CrossRef]
  39. He, X.; Sheng, J. New evaluation system for the modernization level of a province or a city based on an improved entropy method. Environ. Monit. Assess. 2019, 192, 1. [Google Scholar] [CrossRef]
  40. Hongyu, L.; Peiyu, Y. In A Review on Leisure City Evaluation Index Systems and Model. In Proceedings of the 5th International Conference on Social Science and Higher Education (ICSSHE in Xiamen, China, on 23 August 2019); Atlantis Press: Paris, France, 2019. [Google Scholar]
  41. Zhao, J.; Wang, M. A novel assessment of urbanization quality and its applications. Phys. A Stat. Mech. Appl. 2018, 508, 141–154. [Google Scholar] [CrossRef]
  42. Chen, M.; Liu, W.; Lu, D.; Chen, H.; Ye, C. Progress of China’s new-type urbanization construction since 2014: A preliminary assessment. Cities 2018, 78, 180–193. [Google Scholar] [CrossRef]
  43. Shuang, S. Research on the Quality and Level of Urbanization in the Baoshan District, Shanghai. In Building Resilient Cities in China: The Nexus between Planning and Science; Springer: New York, NY, USA, 2015; pp. 245–252. [Google Scholar] [CrossRef]
  44. Hu, B. A Novel Coordination Model of Urbanization Speed and Quality based on Multidimensional Economic Data. Rev. Tec. Fac. Univ. Zulia 2016, 39, 342–351. [Google Scholar]
  45. OECD. Indicators to Measure Decoupling of Environmental Pressure from Economic Growth. Available online: http://www.olis.oecd.org/olis/2002doc.nsf/LinkTo/sg-sd2002 (accessed on 10 April 2020).
  46. Akizu-Gardoki, O.; Bueno, G.; Wiedmann, T.; Lopez-Guede, J.M.; Arto, I.; Hernandez, P.; Moran, D. Decoupling between human development and energy consumption within footprint accounts. J. Clean. Prod. 2018, 202, 1145–1157. [Google Scholar] [CrossRef]
  47. Wang, W.; Kuang, Y.; Huang, N.; Zhao, D. Empirical Research on Decoupling Relationship between Energy-Related Carbon Emission and Economic Growth in Guangdong Province Based on Extended Kaya Identity. Sci. World J. 2014, 2014, 1–11. [Google Scholar] [CrossRef] [Green Version]
  48. Wu, Y.; Zhu, Q.; Zhu, B. Decoupling analysis of world economic growth and CO2 emissions: A study comparing developed and developing countries. J. Clean. Prod. 2018, 190, 94–103. [Google Scholar] [CrossRef]
  49. Li, L.; Shan, Y.; Lei, Y.; Wu, S.; Yu, X.; Lin, X.; Chen, Y. Decoupling of economic growth and emissions in China’s cities: A case study of the Central Plains urban agglomeration. Appl. Energy 2019, 244, 36–45. [Google Scholar] [CrossRef] [Green Version]
  50. Zhang, Y.; Song, W.; Fu, S.; Yang, D. Decoupling of Land Use Intensity and Ecological Environment in Gansu Province, China. Sustainability 2020, 12, 2779. [Google Scholar] [CrossRef] [Green Version]
  51. Tapio, P. Towards a theory of decoupling: Degrees of decoupling in the EU and the case of road traffic in Finland between 1970 and2001. Transp. Policy 2005, 12, 137–151. [Google Scholar] [CrossRef] [Green Version]
  52. China National Bureau of Statistics. Available online: http://www.stats.gov.cn/ (accessed on 20 April 2020).
Figure 1. Decoupling state classification. Note: Adapted from Reference [51].
Sustainability 12 06835 g001
Figure 2. China’s urbanization space and changes from 2005 to 2014.
Sustainability 12 06835 g002
Figure 3. The spatial distribution and changes of urbanization quality in China from 2005 to 2014.
Sustainability 12 06835 g003
Figure 4. Decoupling states between urbanization level and urbanization quality of prefecture-level cities in China from 2006 to 2010.
Sustainability 12 06835 g004
Figure 5. Decoupling status between urbanization level and urbanization quality of prefecture-level cities in China from 2011 to 2014.
Sustainability 12 06835 g005
Table 1. Comprehensive evaluation index system of urbanization quality.
ClassificationIndexMeaning
Land urbanization qualityPer capita built-up area (m2/person)Total urban population/built-up area
GDP output value per unit area (10,000 yuan/km2)Urban GDP/urban built-up area
Per capita public green space area (m2/person)Urban public green space area/urban non-agricultural population
Urban road area per capita (m2) Area of urban roads/total urban population
Economic urbanization qualityEmployed population in secondary and tertiary industries (10,000 person)Population engaged in secondary and tertiary industries
Proportion of tertiary industry population (%)Population engaged in tertiary industry/total population
Proportion of secondary industry output value (%) Added value of secondary industry/GDP
Proportion of tertiary industry output value (%)Added value of tertiary industry/GDP
Total industrial output value (10,000 yuan)Revenue from principal business of the current period + cost price of goods in stock at the end of the period − cost price of goods in stock at the beginning of the period
GDP (10,000 yuan)Gross Domestic Product
Per capita GDP (yuan) Total output (total GDP, i.e., total output of social goods and services)/total population
GDP growth rate (%)The proportion of the increase within a certain period of time in the market value of all final products produced by the use of production factors over the previous period
Social urbanization qualityPublic financial revenue per capita (yuan)Total financial revenue/national population
Per capita public financial expenditure (yuan)Total financial expenditure/national population
Per capita deposit in RMB (yuan)Residents deposit in RMB in domestic banking financial institutions and the central bank/total population
Average wage of employees in service (yuan)The average amount of monetary wage per employee in a certain period of time
Number of public library books per 100 person (book/volume)Number of books in public library (volume)/urban population (100 person)
Number of college students per 10,000 person (person)College students (person)/urban population (10,000 person)
Number of buses owned per 10,000 person (unit)All kinds of buses in urban area (unit)/population in urban area (10,000 person)
Bed number owned per 10,000 person (beds)Total number of beds in urban area/population in urban area (10,000)
Number of doctors owned per 10,000 person (person)Number of urban doctors/urban population (10,000 person)
Ecological urbanization qualityGreen area of built-up area (%)Total green land area in urban built-up area/total land area in urban built-up area
Ratio of general industrial solid wastes utilized (%)Industrial solid waste comprehensive utilization/industrial solid waste production
Centralized treatment rate of sewage treatment plant (%)Removal amount of pollution factors in sewage/total amount of sewage
Harmless treatment rate of domestic waste (%)Quantity of waste handled by harmless treatment/total domestic waste
Table 2. Decoupling classification.
Decoupling StateGrowth Rate of Urbanization LevelGrowth Rate of Urbanization QualityElasticity T
Negative decouplingWeak negative decoupling<0<00 ≤ t < 0.8
Strong negative decoupling≥0<0t ≤ 0
Expansive negative decoupling≥0≥0t > 1.2
DecouplingDeclining decoupling<0<0t > 1.2
Strong decoupling<0≥0t < 0
Weak decoupling>0≥00 ≤ t < 0.8
ConnectionDeclining connection<0<00.8 < t < 1.2
Expansive connection≥0≥00.8 < t < 1.2
Table 3. Number of prefecture-level cities at different levels of urbanization from 2005 to 2014 in China.
Urbanization Rate Year
2005200620072008200920102011201220132014
10%~20%7333210000
20%~30%47423015142010854
30%~40%91959195886760503932
40%~50%63667577777493899192
50%~60%40353440444850626971
60%~70%15243032374543454749
70%~80%1166881613141619
80%~90%913121110911131415
90%~100%3255666666
Table 4. Decoupling number.
Decoupling
State
Weak Negative
Decoupling
Strong Negative
Decoupling
Expansive
Negative Decoupling
Declining
Decoupling
Strong
Decoupling
Weak
Decoupling
Declining
Connection
Expansive
Connection
20061418153242812
200797111421853117
20081216572198900
200994112941461027
20102917821465240
201188212510282309
2012117414510132606
2013111179451725115
20148741062760127

