Abstract
This study aimed to identify the interactional relationships between maturation (biological age (BA)) and lean mass on strength development in young athletes from different sports. Using a cross-sectional study design, a sample of 64 young athletes (rowers, swimmers, jiu-jitsu, volleyball, soccer and tennis players) of both sexes (13.6 ± 1.17 years) were recruited. Body composition was assessed using dual energy bone densitometry with X-ray source (DEXA). Strength of upper limbs (ULS), force hand grip (HG), vertical jump (VJ) and jump against movement (CMJ) were recorded. BA was estimated from anthropometrics. BA relationships were identified with upper limb strength in all athletes, and with the lower limb strength of tennis players, only (p < 0.05). An interaction effect between lean mass and BA was found (η2p = 0.753), as was a local effect within the regression models (ƒ2 ≥ 0.33). Athletes with a higher concentration of lean mass had superior upper and lower limb strength (p < 0.05). Lean mass showed a local effect (ƒ2) greater than that associated with BA. Although maturation is related to strength development, the strength of the relationship is mitigated by the accrual of lean mass. Specifically, the local effect of lean mass on muscle strength is broader than that of maturation, especially for lower limb strength.
1. Introduction
Numerous factors determine success in high-performance sport, including psychological conditions, motor skills and body composition [1]. Strength has been linked to performance levels and, in childhood, it has been used to identify talent in a variety of sports [2,3,4,5,6]. Previous reports have shown that selected young athletes, within chronological age (CA) bands, are stronger than those deselected [4,5]. In addition, those selected have been observed to be more advanced in their maturation (indexed by biological age (BA), i.e., more mature then their CA matched peers) [5].
There is great variation in the timing and tempo of maturation [5,6]. Within individual’s maturation stages can be classified as late, synchronized (average) or accelerated (early) in relation to chronological age [6]. Researchers have observed interaction effects between CA and BA in a variety of performance tasks such as: acceleration time, sprint speed, speed with change of direction and jumping height [7]. In addition, Charcharis et al. [8] demonstrated that when strength was normalized to body weight, there were still differences between average and early maturers and late maturers in strength outcomes.
The voluntary production of movements in the neuromuscular system activates the nervous and locomotor systems to perform tasks [9]. Movement occurs due to the interaction of muscle tissue with bone tissue, with measures of lean mass being the determining factor for the execution of body movement [10]. Increased volume of lean mass is also identified as a significant characteristic for physical health and sports performance [11,12]. The amount of lean mass has been shown to be a strong indicator of performance in young athletes including, but not limited to: muscle strength and aerobic and anaerobic capacity [4,13,14,15].
Individuals with a greater amount of lean mass have a greater number of sarcomeres (i.e., biological units where muscle tension occurs) which promotes the production of strength through muscle contraction [4,14,16]. In relation to sport, the particularities of each modality generally require a specific manifestation of muscle strength (endurance strength or muscle power), different from the unparticular movements normally used [8,17,18]. For example, Azimi et al. [4] identified that the muscular strength of young elite Iranian weight lifters was influenced by the accumulation of lean mass, however, the authors did not analyze the possible interaction of biological maturation, which could have confounded this interpretation. In addition, other studies have identified that BA, CA and sex all have independent significant relationships with the production of muscle strength in young athletes and non-athletes [19,20,21,22,23].
Thus, the type of stimuli received by the characteristics of sports can significantly influence the levels of strength in the upper and lower limbs. For example, volleyball and basketball athletes constantly perform jumps, which can favor increased strength in the lower limbs. Rowers, tennis players and javelin throwers perform movements with an emphasis on upper limb usage which can enhance the strength in these upper limbs [1,2,3,4,8,16,21].
Although the independent effects of biological maturation and lean mass on muscle strength are well known, there is scarce information about the interactive relationship of BA and lean mass accrual on muscular strength development in young athletes [6,24,25,26]. Thus, the objective of the present study was to study the independent and interactive relationships between biological age and lean mass on muscular strength development of the upper and lower limbs in young athletes.
We hypothesized that: (i) Muscular strength of the upper and lower limbs is different between sports when the confounders of sex, sport and size are controlled; (ii) maturation (BA) would significantly interact with levels of lean mass; (iii) young athletes with higher concentrations of lean mass, would have an older BA and better performance of upper and lower limb muscle strength; and (iv) lean mass would have a greater local effect on the muscular strength of upper and lower limbs in relation to biological maturation.
2. Methods
Participants
The sample consisted of 64 young athletes, between 12 and 16 years of age, from both sexes (73% male and 27% female), recruited from six different sports: rowing (17%, 9 male and 2 female), swimming (17%, 7 male and 4 female), volleyball (16%, 2 male and 8 female), soccer (17%, 11 male), tennis (17%, 9 male and 2 female) and jiu-jitsu (16%, 9 male and 1 female). The average age of the sample was 13.6 ± 1.17 years. According to the state federation of each sport, all athletes were ranked among the top 15 for their age group and had been nominated for the best athletes of the year for 2019 by the Brazilian confederation of their respective sports. Based on information from national confederations, the sample can be classified as national level athletes (high level sports), in accordance with Matsudo et al. [3].
The sample size was determined a priori, so we adopted an α < 0.05 and a β = 0.80, estimating an effective size = 0.80. Subsequently, we reached the number of 64 subjects for the sample. There was no sample loss. The participants were members of sports clubs in the city of Natal, Brazil. The inclusion criteria were: (1) aged between 12 and 16 years, (2) be registered with a federation of their respective sport and (3) have a weekly training frequency of more than three days. The exclusion criteria were: (1) use of exogenous substances that could influence the performance of muscle strength, (2) health problem that could interfere with the results and (3) not agreeing to participate in all stages of the research.
The research was approved by the Ethics and Research Committee of the Federal University of Rio Grande do Norte—Brazil (CAE: 15865619.7.0000.5537; Opinion: 3.552.010) according to Resolution 466/12 of the National Health Council, on 12 December 2012, strictly respecting the national and international ethical principles contained in the Declaration of Helsinki. It is worth mentioning that the study complied with all the international requirements and standards of the STROBE checklist for observational studies of incidence and prevalence [27].
3. Anthropometry
Anthropometric assessments were performed according to the International Society of the Advancement of Kinanthropometry protocols [28]. Body mass was measured using a digital scale with an accuracy of 0.1 kg (FILIZOLA®, São Paulo, Brazil). Height and sitting height (trunk length) were assessed using a stadiometer with an accuracy of 0.01 cm (SANNY®, São Paulo, Brazil). Leg length was calculated by subtracting trunk length from height [29]. The perimeter was measured using an anthropometric tape (SANNY®, São Paulo, Brazil), and the bone diameters were measured using a caliper (SANNY®, São Paulo, Brazil).
4. Maturation Analysis
Somatic maturation (years from attainment of peak height velocity (PHV); termed maturity offset) an assessment of maturity was estimated from anthropometric measures [29], using the following equations.
Maturity offset in males = −9.236 + [0.0002708 × (Leg length × Trunk Height)] + [−0.001663 × (Age × Leg length)] + [0.007216 × (Age × Trunk Height)] + [0.02292 × (Weight/height) × 100]
Maturity offset in females = −9.376 + [0.0001882 × (Leg length × Trunk Height)] + [0.0022 × (Age × Leg length)] + [0.005841 × (Age × Trunk Height)] − [0.002658 × (Age × Weight)] + [0.07693 × (Weight/height) × 100]
Age at PHV was calculated as age at measurement—maturity offset. Three maturity categories were identified: (1) Pre-PHV (Maturity offset < −1); (2) circum-PHV (Maturity offset ≥ −1 and Maturity offset ≤ +1); (3) post-PHV (Maturity offset > +1).
5. Body Composition
Body composition was assessed by a member of the research team with prior training through the use of dual energy bone densitometry with X-ray source (DEXA) (LUNAR®/GE PRODIGY—LNR 41,990, United States). This procedure is considered one of the most reliable standards for measuring body composition [30]. Through the use of appropriate algorithms for the pediatric population, DEXA analysis provided data on total fat and lean body mass (i.e., bone mineral density, bone mineral content and total lean mass).
6. Analysis of Muscular Performance of the Upper Limbs
The upper limbs strength (ULS) was assessed using the medicine ball test [31]. The subject was seated with his back against a wall and his knees extended. At the evaluator’s signal, a medicine ball (Ax Sports®, Tangará, Brazil) with a mass of 2 kg positioned at the height of the sternum was thrown horizontally with both hands. Trunk movement was not allowed. The test was performed three consecutive times interspersed with a passive recovery period of three minutes. The best attempt was retained for analysis. The test was performed following the protocol described by Mello et al. [31], where all the subjects launched a medicine ball of 2 kg in weight, normalizing the weight of the medicine ball (i.e., ideal tension) is not considered. The test follows the logic that if two subjects launch an object of the same mass, the one that launches the most distant object has the advantage of ULS [31]. The distance reached at launch was attributed to the evaluated ULS capacity. The handgrip (HG) test was used to assess the strength of the upper limbs using a hydraulic dynamometer (JAMAR®, Cambuci, Brazil; calibrated before each assessment). The subjects remained seated on a bench with adjustable height and the forearm flexed at an angle of 90° [32]. All participants performed three maximum voluntary contractions (3 s) with the left and right limbs, interspersed with recovery periods of 60 s, and the best performance was retained for statistical analysis [32].
7. Analysis of Muscle Performance of the Lower Limbs
The performance of the lower limbs was attained by tests of vertical jump (VJ) and jump against movement (CMJ), both jumps were analyzed using a force platform (CEFISE®, São Paulo, Brazil). The protocols established by Forza and Edmundson [33] were utilized. A familiarization session was held with the techniques of the movements of VJ and CMJ, seeking to reduce errors during the execution of the protocols. Then, starting from an orthostatic position, held for three seconds, with the knees flexed at approximately 90° and the hands fixed on the waist, the subjects were instructed to perform a vertical jump as high as possible. For CMJ analysis the same recommendations were adopted, however, the volunteers performed a squat followed by the jump. A 10-minute recovery interval was established between VJ and CMJ. For both tests, three attempts were made, interspersed with 60 s of passive recovery and the best attempt was retained for data analysis.
8. Statistics
The normality of the data was tested for using the Kolmogorov-Smirnov test and z-score of asymmetry and kurtosis (−1.96 to 1.96). For the correlations we used the Pearson test. For partial correlations, we controlled the power of the lean mass variable, with the following magnitudes identified: insignificant: r < 0.10; weak: r = 0.10–0.39; moderate: r = 0.40–0.69; strong: r = 0.70–0.89; very strong: r = 0.90–1.00 [34]. To group variables with similar patterns, we used an analysis based on the unsupervised machine learning technique with k-means cluster through a Hartigan-Wong algorithm [35]. The groups formed by these analyses were used in the regression models, the confounding factors sex (male and female) and chronological age (CA) present in the sample were controlled during the regressions, and backdoor arithmetic was used to inhibit the effect of confounding factors during statistical analysis [36,37]. The homogeneity of the regression models was tested by the Breush-Pegan test and the assumptions of normality, variance and independence of the data were not denied. The size of the effect in the regressions was measured by the “r2” coefficient. The explanatory power of the dependent variable was based on the independent variables. To test the multicollinearity of the regression models, the Durbin Watson test was used. Bonferroni’s correction was applied, and later comparisons were performed. An ANCOVA test was used to control the confounding factor of sex and chronological age.
Bonferroni’s post hoc test was used to find differences. The percentage of the variation coefficient (CV%) was calculated for the maturation variable using the formula: CV% = (standard deviation (SD)/mean) × 100. The partial Eta-square (η2p) was used to verify the size of the effect of the interaction between the variances of the variables: [maturation × lean mass]; [maturation × height]; [maturation × body weight]; [lean mass × HG]; [lean mass × ULS]; [lean mass × VJ]; [lean mass × CMJ]; [HG × maturation]; [maturation × ULS]; [maturation × VJ]; [maturation × CMJ]. The magnitude of η2p ranges from 0 to 1 and was interpreted as follows: Small η2p ≤ 0.10 to 0.23; Average η2p from 0.24 to 0.34; Large η2p from 0.35 to 0.44; Very large η2p ≥ 0.45 [38]. Through Cohen’s ƒ2, the local effect of the variables was verified in relation to: [lean mass × HG]; [lean mass × ULS]; [lean mass × VJ]; [lean mass × CMJ]; [HG × maturation]; [maturation × ULS]; [maturation × VJ]; [maturation × CMJ]; [maturation × lean mass]. The magnitude of ƒ2 ranges from 0 to 1 and was interpreted as follows: ƒ2 ≤ 0.02 to 0.14; medium: ƒ2 ≥ 0.15 to 0.34; large: ƒ2 ≥ 0.35 [39]. All analyses were performed using open source software R (version 4.0.1; R Foundation for Statistical Computing®, Vienna, Austria) considering p < 0.05.
9. Results
Table 1 shows the descriptive characterization of the sample. The average age of the subjects was were 13.6 ± 1.17 years with an average age of PHV of 13.5 ± 1.82 years (95% between 9.9 and 17.1 years). The average maturity offset was 0.14 ± 1.82 years from PHV. It should be noted that the calculated sample power was 0.88. The margin of error pointed out for the sample size was 4.87%, indicating that the sample used in the present study has statistical strength to address the research question.

Table 1.
Sample characterization.
Maturity offset was significantly and positively correlated with muscle strength of the upper limbs in all sports. Only in tennis players was a significant and positive relationship found between maturity offset and strength of the lower limbs. When controlling the effect of lean mass, maturity offset showed significant positive relationship with strength performance of the upper limbs only in jiu-jitsu, swimming, tennis and volleyball (Table 2).
Table 2.
Correlations with somatic maturation.
The analysis of the patterns of the variables by Clusters K-means, grouped by maturity offset, were developed for hand grip strength, upper limbs strength and lean mass. The regressions from this analysis are shown in Table 3 (model 1 considers the entire group of variables, whilst model 2 removes maturity offset). Comparison between models identifies the strength of the predictions between models.
Table 3.
Linear regression adjusted to predict the strength performance of upper and lower limbs in different sports.
Regarding the lower limb muscle strength performance variables, the clustering occurred only for tennis and volleyball, grouping the variables vertical jump, CMJ and lean mass. Thus, the regression models were organized based on the groupings of the variables. Models 1 and 2 were significant for all sports and model 3 only for tennis and volleyball. Please note maturity offset was used as an independent variable within regression models 1 and 4. In models 2 and 3 lean mass was used as an independent variable. No multicollinearities were found among the variables within the models used.
Table 4 shows different maturation stages (early, average and late) between the different sports groups (soccer and tennis before peak growth; swimming and jiu-jitsu during peak growth and rowing and volleyball after peak growth). Thus, in relation to maturation, the rowing and volleyball athletes did not point out differences between them, and both groups were the ones who indicated more advanced maturation stage in relation to the others. In addition, the rowers had a higher total lean mass than the other athletes (p = 0.01). In addition, rowing athletes showed superiority in body height in relation to the soccer and jiu-jitsu groups (p = 0.01). Furthermore, it was found that in the groups of rowing (ƒ2 = 0.54, large), soccer (ƒ2 = 0.89, large), swimming (ƒ2 = 3.03, large), jiu-jitsu (ƒ2 = 0.63, large), volleyball (ƒ2 = 0.49, large) and tennis (ƒ2 = 0.33, medium), maturation showed a large local effect in relation to lean mass. In addition, the effects of interaction of great magnitude of maturation with lean mass (η2p = 0.753, very large), body height (η2p = 0.523, very large) and body weight (η2p = 0.631, very large) were also verified in the analyses. The effect of the sex variable (male and female) within and between groups was not significant in the variables used in the comparisons performed by the ANCOVA test (F < 0.3; p > 0.1). Regarding maturation, the variation coefficient was 92% in rowing, 30.7% in swimming, 137% in soccer, 128% in tennis, 35.6% in jiu-jitsu and 192.8% in volley.
Table 4.
Comparisons between groups regarding maturation, lean mass, height and body weight.
When comparing muscle strength performance between groups (Figure 1), the rowers stood out in relation to upper and lower limbs strength (medicine ball: F (5.0) = 5.18; p = 0.01; hand grip: F(5.0) = 4.60; p < 0.0001; vertical jump: F(5.0) = 3.09; p < 0.0001). In addition, maturation pointed to a large interaction with the strength of the upper limbs (HG: η2p = 0.525, very large; ULS: η2p = 0.452, very large) and small interaction with the lower limbs (VJ: η2p = 0.140, small; CMJ: η2p = 0.162, small), while the lean mass showed great interaction with the strength of upper limbs (HG: η2p = 0.532, very large; ULS: η2p = 0.674, very large) and lower (VJ: η2p = 0.739, very large; CMJ: η2p = 0.735, very large). The effect of the sex was not significant in the comparisons by the ANCOVA test (F < 1.0; p > 0.3).
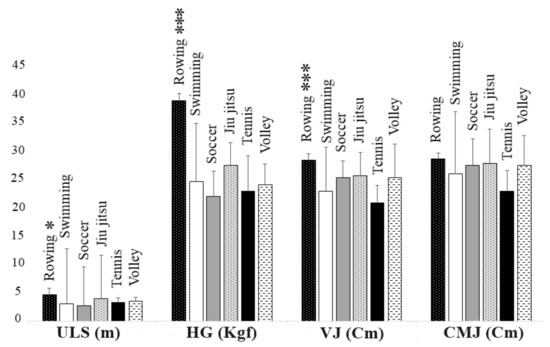
Figure 1.
Comparison of muscular performance between different sports. *** p < 0.0001. * p = 0.01. ULS = upper limb strength. HG = hand grip. VJ = vertical jump. CMJ = jump against movement.
Table 5 shows the local effect of lean mass and maturation on the variables of muscle strength in the upper and lower limbs. Thus, a large effect of lean mass in relation to upper and lower limb strength of the young athletes analyzed was exposed. A similar result was found in relation to biological maturation.
Table 5.
Local effect of lean mass and maturation in relation to muscle strength performance.
10. Discussion
The aim of this study was to analyze the independent and interaction relationships between biological maturation and lean mass on muscular strength development of the upper and lower limbs of young athletes practicing different sports. Our results showed: (i) a significant relationship between maturation and the performance of lower limbs of tennis players and upper limbs of rowers, tennis players, jiu-jitsu participants, volleyball players, swimmers and soccer players; (ii) when controlling for lean mass, a relationship between maturation and performance in the upper limbs of jiu-jitsu participants, swimmers, tennis and volleyball players was found; (iii) a relationship between lean mass and maturation, and performance of upper limbs in rowers, tennis players, jiu-jitsu participants, volleyball players, swimmers and soccer players; (iv) maturation significantly interacted with lean mass; (v) lean mass and maturation showed independent effects, in relation to the performance of upper and lower limbs; and (vi) athletes with higher concentrations of lean mass showed superior performance in the upper and lower limbs.
These findings suggest that athletes with superior lean mass present superior muscle strength in the upper and lower limbs when compared to athletes from other modalities who have less lean mass. Our results are in agreement with Azimi et al. [4] who evaluated the impact of lean mass as a predictor of strength performance in elite young Iranian weightlifting athletes. These researchers reported that lean mass showed significant relationships with specific performance and that athletes with superior lean mass were able to lift loads with higher weight compared to the others (p ≤ 0.001).
The present study also showed that lean mass is related to muscle strength. Furthermore, in young athletes of different modalities there is a significant effect size (ES) between lean mass and ULS, HG, VJ and CMJ. Raymond-Pope et al. [14] in researching university athletes using DEXA and isokinetic dynamometry found that the lean mass of the lower limbs was related to the neuromuscular performance of jumps. The authors determined that the sum of the amount of lean mass in both legs showed strong correlations with the production of muscle strength in the lower limbs (r = 0.83–0.94; p < 0.05).
Another important finding in the present study was that there was a significant ES of maturation in relation to lean mass. Rowers with superior lean mass were also superior in relation to biological maturation. These results are in accord with Malina et al. [6] who showed advanced biological maturation favors the production of muscle strength, which in turn is influenced by the total volume of lean body mass. However, the results of this research also showed that the ES of maturation with the performance of muscle strength in rowers was of a lower magnitude than the ES found in other sports (see Table 5). Our results differ from previous studies, which found relationships between lean mass and advanced maturation regardless of the analyzed sport [19,20,21,22,40,41].
Moreover, it is highlighted that the specific stimuli of sports modalities can also contribute to the process of acquiring muscle strength [2,13]. Thus, according to Giroux et al. [13], rowing is a sport that requires constant traction against water resistance. In this sense, the chronic effect of the practice of specific movements to generate the drag force that promotes the displacement of the vessels may contribute to morphological adaptations in the musculoskeletal tissue, providing the mechanism for gaining lean mass [13,22].
We are in agreement with Pion et al. [26] who argued that body composition is in fact an important component for the motor skills of sports talents. In addition, we would argue that our results support the contention that sports have different ways of stimulating motor skills (i.e., training intensity, recruitment of glycolytic fibers, execution of specific movements against pre-established resistance, etc.). Concomitant with this statement, the findings of the present research indicate that lean mass has a significant ES (See Figure 1) with upper limb strength performance and that maturation has an ES with young lean rowers, soccer, tennis, volleyball and jiu-jitsu players, and swimmers.
Thus, the regression analyses carried out by the present study shows that maturation and lean mass (Table 3; model 1 and 2), combined with upper limb strength tests have the potential to predict the performance of upper limbs of rowers, swimmers, tennis, volleyball, soccer and jiu-jitsu players. For the performance of lower limb strength, the model based on lean mass and lower limb muscle strength tests indicated the ability to predict performance only in volleyball and tennis players (Table 3; model 3).
The findings of this study may help in a sustainable manner, as the experiments are not costly and advanced technology is not required for the quantitative testing, the identification of youth talent in sports programs. They should also assist in the longitudinal monitoring of young athletes and the selection of young athletes into teams and level of competition. It is important to emphasize that the results of the present study can be used for the analysis of the maturation stage, associating it with body morphology as predictors of upper and lower limb muscle strength. In addition, contributing to the direction of complementary sports training, the results suggest that the provision of stimuli that use external resistance may be useful for the acquisition of lean mass, and may contribute to the performance of muscular strength of upper and lower limbs.
However, despite the relevance of the results, the present study has some limitations: (i) The research methodology is an observational approach, which does not allow for a stabilization of cause and effect. (ii) The peculiarity of the sample is composed only of young athletes, which can make it difficult to stagger the results for young non-athletes. (iii) The control of the nutritional history of the analyzed subjects was not carried out, which makes it difficult to attribute the results related to lean mass to training stimuli or the nutritional quality of the subjects.
11. Conclusions
It is concluded that biological maturation shows a significant relationship with muscle strength, especially the upper limbs. Additionally, there is an important interaction of maturity with lean mass in this process. Regarding the local effect, the magnitude of the effect of lean mass on muscle strength is broader in relation to that of maturation, especially for the strength of lower limbs. In addition, young athletes with higher levels of lean mass have advanced maturation and superior muscle strength in the upper and lower limbs.
Author Contributions
Conceptualization, P.F.d.A.-N. and B.G.d.A.T.C.; methodology, P.F.d.A.-N., B.G.d.A.T.C., G.R.B. and P.M.S.D.; software, P.F.d.A.-N. and D.G.d.M.; validation, M.D., F.J.A., D.G.d.M. and V.C.M.P.; formal analysis, P.F.d.A.-N., M.D. and P.M.S.D.; investigation, P.F.d.A.-N., M.D., V.C.M.P., G.R.B. and B.G.d.A.T.C.; resources, V.C.M.P., F.J.A. and P.M.S.D.; data curation, P.F.d.A.-N., D.G.d.M. and F.J.A.; writing—original draft preparation, P.F.d.A.-N., D.G.d.M., A.D.G.B.-J. and B.G.d.A.T.C.; writing—review and editing, D.G.d.M., A.D.G.B.-J., G.R.B. and B.G.d.A.T.C.; visualization, P.F.d.A.-N. and B.G.d.A.T.C.; supervision, V.C.M.P. and P.M.S.D.; project administration, B.G.d.A.T.C.; funding acquisition, V.C.M.P. and B.G.d.A.T.C. All authors have read and agreed to the published version of the manuscript.
Funding
This research received no external funding.
Acknowledgments
For your support and encouragement for the development of this academic article, we thank the Federal University of Rio Grande do Norte (UFRN), the Physical Activity and Health (AFISA) research base, the Child and Adolescent Maturation Research Group (GEPMAC). The National Council for Scientific Development (CNPQ) and the Higher Education Personnel Improvement Coordination (CAPES).
Conflicts of Interest
The authors declare no conflicts of interest.
References
- Stachon, A.; Pietraszewska, J.; Pietraszewski, B.; Andrzejewska, J.; Burdukiewicz, A. Anthropometric characteristics and lower limb power of professional female volleyball players. S. Afr. J. Res. Sport Phys. Educ. Recreat. 2015, 37, 99–112. [Google Scholar]
- Suchomel, T.J.; Nimphius, S.; Stone, M.H. The importance of muscular strength in athletic performance. Sports Med. 2016, 46, 1419–1449. [Google Scholar] [CrossRef]
- Matsudo, V.K.; Rivet, R.E.; Pereira, M.H. Standard score assessment on physique and performance of Brazilian athletes in a six tiered competitive sports model. J. Sports Sci. 1987, 5, 49–53. [Google Scholar] [CrossRef]
- Azimi, F.; Siahkouhian, M.; Hedayatnejad, M. Lean body mass as a predictor of performance of young Iranian elite weightlifters. S. Afr. J. Res. Sport Phys. Educ. Recreat. 2016, 38, 179–186. [Google Scholar]
- Torres-Unda, J.; Zarrazquin, I.; Gil, J.; Ruiz, F.; Irazusta, A.; Kortajarena, M.; Irazusta, J. Anthropometric, physiological and maturational characteristics in selected elite and non-elite male adolescent basketball players. J. Sports Sci. 2013, 31, 196–203. [Google Scholar] [CrossRef]
- Malina, R.M.; Rogol, A.D.; Cumming, S.P.; Silva, M.J.C.; Figueiredo, A.J. Biological maturation of youth athletes: Assessment and implications. Br. J. Sports Med. 2015, 49, 852–859. [Google Scholar] [CrossRef]
- Rommers, N.; Mostaert, M.; Goossens, L.; Vaeyens, R.; Witvrouw, E.; Lenoir, M.; D’Hondt, E. Age and maturity related differences in motor coordination among male elite youth soccer players. J. Sports Sci. 2019, 37, 196–203. [Google Scholar] [CrossRef] [PubMed]
- Charcharis, G.; Mersmann, F.; Bohm, S.; Arampatzis, A. Morphological and Mechanical Properties of the Quadriceps Femoris Muscle-Tendon Unit from Adolescence to Adulthood: Effects of Age and Athletic Training. Front. Physiol. 2019, 10, 1082. [Google Scholar] [CrossRef] [PubMed]
- Hunter, S.K.; Pereira, H.M.; Keenan, K.G. The aging neuromuscular system and motor performance. J. Appl. Phys. 2016, 121, 982–995. [Google Scholar] [CrossRef] [PubMed]
- Kuhman, D.J.; Hurt, C.P. Lower extremity joints and muscle groups in the human locomotor system alter mechanical functions to meet task demand. J. Exp. Biol. 2019, 222, jeb206383. [Google Scholar] [CrossRef] [PubMed]
- Yang, J.; Christophi, C.A.; Farioli, A.; Baur, D.M.; Moffatt, S.; Kales, S.N. Association between push-up exercise capacity and future cardiovascular events among active adult men. JAMA Netw. Open 2019, 2, e188341. [Google Scholar] [CrossRef] [PubMed]
- Liu, J.; Yan, Y.; Xi, B.; Huang, G.; Mi, J. China Child and Adolescent Cardiovascular Health (CCACH) Study Group. Skeletal muscle reference for Chinese children and adolescents. J. Cachexia Sarcopenia Muscle 2019, 10, 155–164. [Google Scholar] [CrossRef] [PubMed]
- Giroux, C.; Maciejewski, H.; Ben-Abdessamie, A.; Chorin, F.; Ratel, S.; Rahmani, A. Relationship between force-velocity profiles and 1.500-m ergometer performance in young rowers. Int. J. Sports Med. 2017, 38, 992–1000. [Google Scholar] [CrossRef] [PubMed]
- Raymond-Pope, C.J.; Dengel, D.R.; Fitzgerald, J.S.; Bosch, T.A. Association of compartmental leg lean mass measured by dual X-ray absorptiometry with force production. J. Strength Cond. Res. 2018. [Google Scholar] [CrossRef] [PubMed]
- Durkalec-Michalski, K.; Nowaczyk, P.M.; Podgórski, T.; Kusy, K.; Osiński, W.; Jeszka, J. Relationship between body composition and the level of aerobic and anaerobic capacity in highly trained male rowers. J. Sports Med. Phys. Fit. 2019, 59, 1526–1535. [Google Scholar] [CrossRef]
- Thomas, M.H.; Burns, S.P. Increasing lean mass and strength: A comparison of high frequency strength training to lower frequency strength training. Int. J. Exerc. Sci. 2016, 9, 159. [Google Scholar]
- O’Brien, T.D.; Reeves, N.D.; Baltzopoulos, V.; Jones, D.A.; Maganaris, C.N. In vivo measurements of muscle specific tension in adults and children. Exp. Physiol. 2009, 95, 202–210. [Google Scholar] [CrossRef]
- Cunha, G.D.S.; Vaz, M.A.; Herzog, W.; Geremia, J.M.; Leites, G.T.; Reischak-Oliveira, Á. Maturity status effects on torque and muscle architecture of young soccer players. J. Sports Sci. 2019, 1–10. [Google Scholar] [CrossRef]
- Pinto, V.C.M.; dos Santos, P.G.M.D.; Dantas, M.P.; Araújo, J.P.D.F.; Cabral, S.D.A.T.; Cabral, B.G.D.A.T. Relationship between skeletal age, hormonal markers and physical capacity in adolescents. J. Hum. Growth Dev. 2017, 27, 77–83. [Google Scholar] [CrossRef]
- Gantois, P.; Pinto, V.; Castro, K.R.D.; João, P.V.; Dantas, P.; Cabral, B.G. Skeletal age and explosive strength in young volleyball players. Rev. Bras. Cineantropom. Desempenho Hum. 2017, 19, 331–342. [Google Scholar] [CrossRef][Green Version]
- Dantas, M.P.; Silva, L.F.; Gantois, P.; Silva, L.M.; Dantas, R.N.; Cabral, B.T. Relationship between maturation and explosive strength in young rowers. Motricidade 2018, 14, 112–121. [Google Scholar]
- Hammami, M.; Hermassi, S.; Gaamouri, N.; Aloui, G.; Comfort, P.; Shephard, R.J.; Chelly, M.S. Field tests of performance and their relationship to age and anthropometric parameters in adolescent handball players. Front. Physiol. 2019, 10, 1124. [Google Scholar] [CrossRef] [PubMed]
- De Almeida-Neto, P.F.; Silva Dantas, P.M.; Pinto, V.C.M.; Cesário, T.D.M.; Ribeiro Campos, N.M.; Santana, E.E.; Matos, D.G.; Aidar, F.J.; Cabral, B.G.D.A.T. BiologicalMaturationand Hormonal Markers, Relationshipto Neuromotor Performance in FemaleChildren. Int. J. Environ. Res. Public Health 2020, 17, 3277. [Google Scholar] [CrossRef]
- Mujika, I.; Rønnestad, B.R.; Martin, D.T. Effects of increased muscle strength and muscle mass on endurance-cycling performance. Int. J. Sports Phys. Perf. 2016, 11, 283–289. [Google Scholar] [CrossRef]
- Prieske, O.; Muehlbauer, T.; Granacher, U. The role of trunk muscle strength for physical fitness and athletic performance in trained individuals: A systematic review and meta-analysis. Sports Med. 2016, 46, 401–419. [Google Scholar] [CrossRef]
- Pion, J.; Hohmann, A.; Liu, T.; Lenoir, M.; Segers, V. Predictive models reduce talent development costs in female gymnastics. J. Sports Sci. 2017, 35, 806–811. [Google Scholar] [CrossRef]
- STROBE Checklist Strengthening the Reporting of Observational Studies in Epidemiology. Available online: https://www.strobe-statement.org/index.php?id=strobe-home (accessed on 15 June 2020).
- Karupaiah, T. Limited (ISAK) profiling the International Society for the Advancement of Kinanthropometry (ISAK). J. Ren. Nutr. Metab. 2018, 3, 11. [Google Scholar] [CrossRef]
- Mirwald, R.L.; Baxter-Jones, A.D.; Bailey, D.A.; Beunen, G.P. An assessment of maturity from anthropometric measurements. Med. Sci. Sports Exerc. 2002, 34, 689–694. [Google Scholar]
- Khadilkar, A.; Chiplonkar, S.; Sanwalka, N.; Khadilkar, V.; Mandlik, R.; Ekbote, V. A Cross-Calibration Study of GE Lunar iDEXA and GE Lunar DPX Pro for Body Composition Measurements in Children and Adults. J. Clin. Densitom. 2019. [Google Scholar] [CrossRef]
- Mello, J.B.; Nagorny, G.A.K.; Haiachi, M.D.C.; Gaya, A.R.; Gaya, A.C.A. ProjetoEsporteBrasil: Physical fitness profile related to sport performance of children and adolescents. Rev. Bras. Cineantropom. Desempenho Hum. 2016, 18, 658–666. [Google Scholar] [CrossRef]
- Reijnierse, E.M.; de Jong, N.; Trappenburg, M.C.; Blauw, G.J.; Butler-Browne, G.; Gapeyeva, H.; Stenroth, L. Assessment of maximal handgrip strength: How many attempts are needed? J. Cachexia Sarcopenia Muscle 2017, 8, 466–474. [Google Scholar] [CrossRef] [PubMed]
- Forza, J.; Edmundson, C.J. Comparison between Gyko inertial sensor and Chrono jump contact mat for the assessment of Squat Jump, Countermovement Jump and Abalakov Jump in amateur male volleyball players, amateur male rugby players and in high school students. J. Multidiscip. Eng. Sci. Technol. 2019, 6, 9982–9988. [Google Scholar]
- Schober, P.; Boer, C.; Schwarte, L.A. Correlation coefficients: Appropriate use and interpretation. Anesth. Anal. 2018, 126, 1763–1768. [Google Scholar] [CrossRef] [PubMed]
- Hartigan, J.A.; Wong, M.A. Algorithm AS 136: A k-means clustering algorithm. J. R. Stat. Soc. Ser. C (Appl. Stat.) 1979, 28, 100–108. [Google Scholar] [CrossRef]
- Pearl, J. Causality; Cambridge University Press: Cambridge, UK, 2009; ISBN 978-0521895606. [Google Scholar]
- Lee, P.H. Should we adjust for a confounder if empirical and theoretical criteria yield contradictory results? A simulation study. Sci. Rep. 2014, 4, 6085–6099. [Google Scholar] [CrossRef]
- Landau, S.; Everitt, B.S. A Handbook of Statistical Analyses Using SPSS; Chapman—Hall/CRC: Washington, DC, USA, 2004; ISBN 1-58488-369-3. [Google Scholar]
- Cohen, J. Statistical Power Analysis for the Behavioral Sciences, 2nd ed.; Lawrence Erlbaum Associates: Hillsdale, NJ, USA, 1988. [Google Scholar]
- Scheffler, C.; Hermanussen, M. Growth in childhood and adolescence. Int. Encycl. Biol. Anthropol. 2018. [Google Scholar] [CrossRef]
- Almeida-Neto, P.F.; Matos, D.G.; Pinto, V.C.M.; Dantas, P.M.S.; Cesário, T.M.; da Silva, L.F.; Bulhões-Correia, A.; Aidar, J.F.; Cabral, B.G.A.T. Can the Neuromuscular Performance of Young Athletes Be Influenced by Hormone Levels and Different Stages of Puberty? Int. J. Environ. Res. Public Health 2020, 17, 5637. [Google Scholar] [CrossRef]
© 2020 by the authors. Licensee MDPI, Basel, Switzerland. This article is an open access article distributed under the terms and conditions of the Creative Commons Attribution (CC BY) license (http://creativecommons.org/licenses/by/4.0/).