Urban School Area Road Safety Improvement and Assessment with a 3D Piano-Keyboard-Styled Pedestrian Crossing Approach: A Case Study of Chiang Mai University Demonstration School

 ,
,  ,
, 
Abstract
1. Introduction
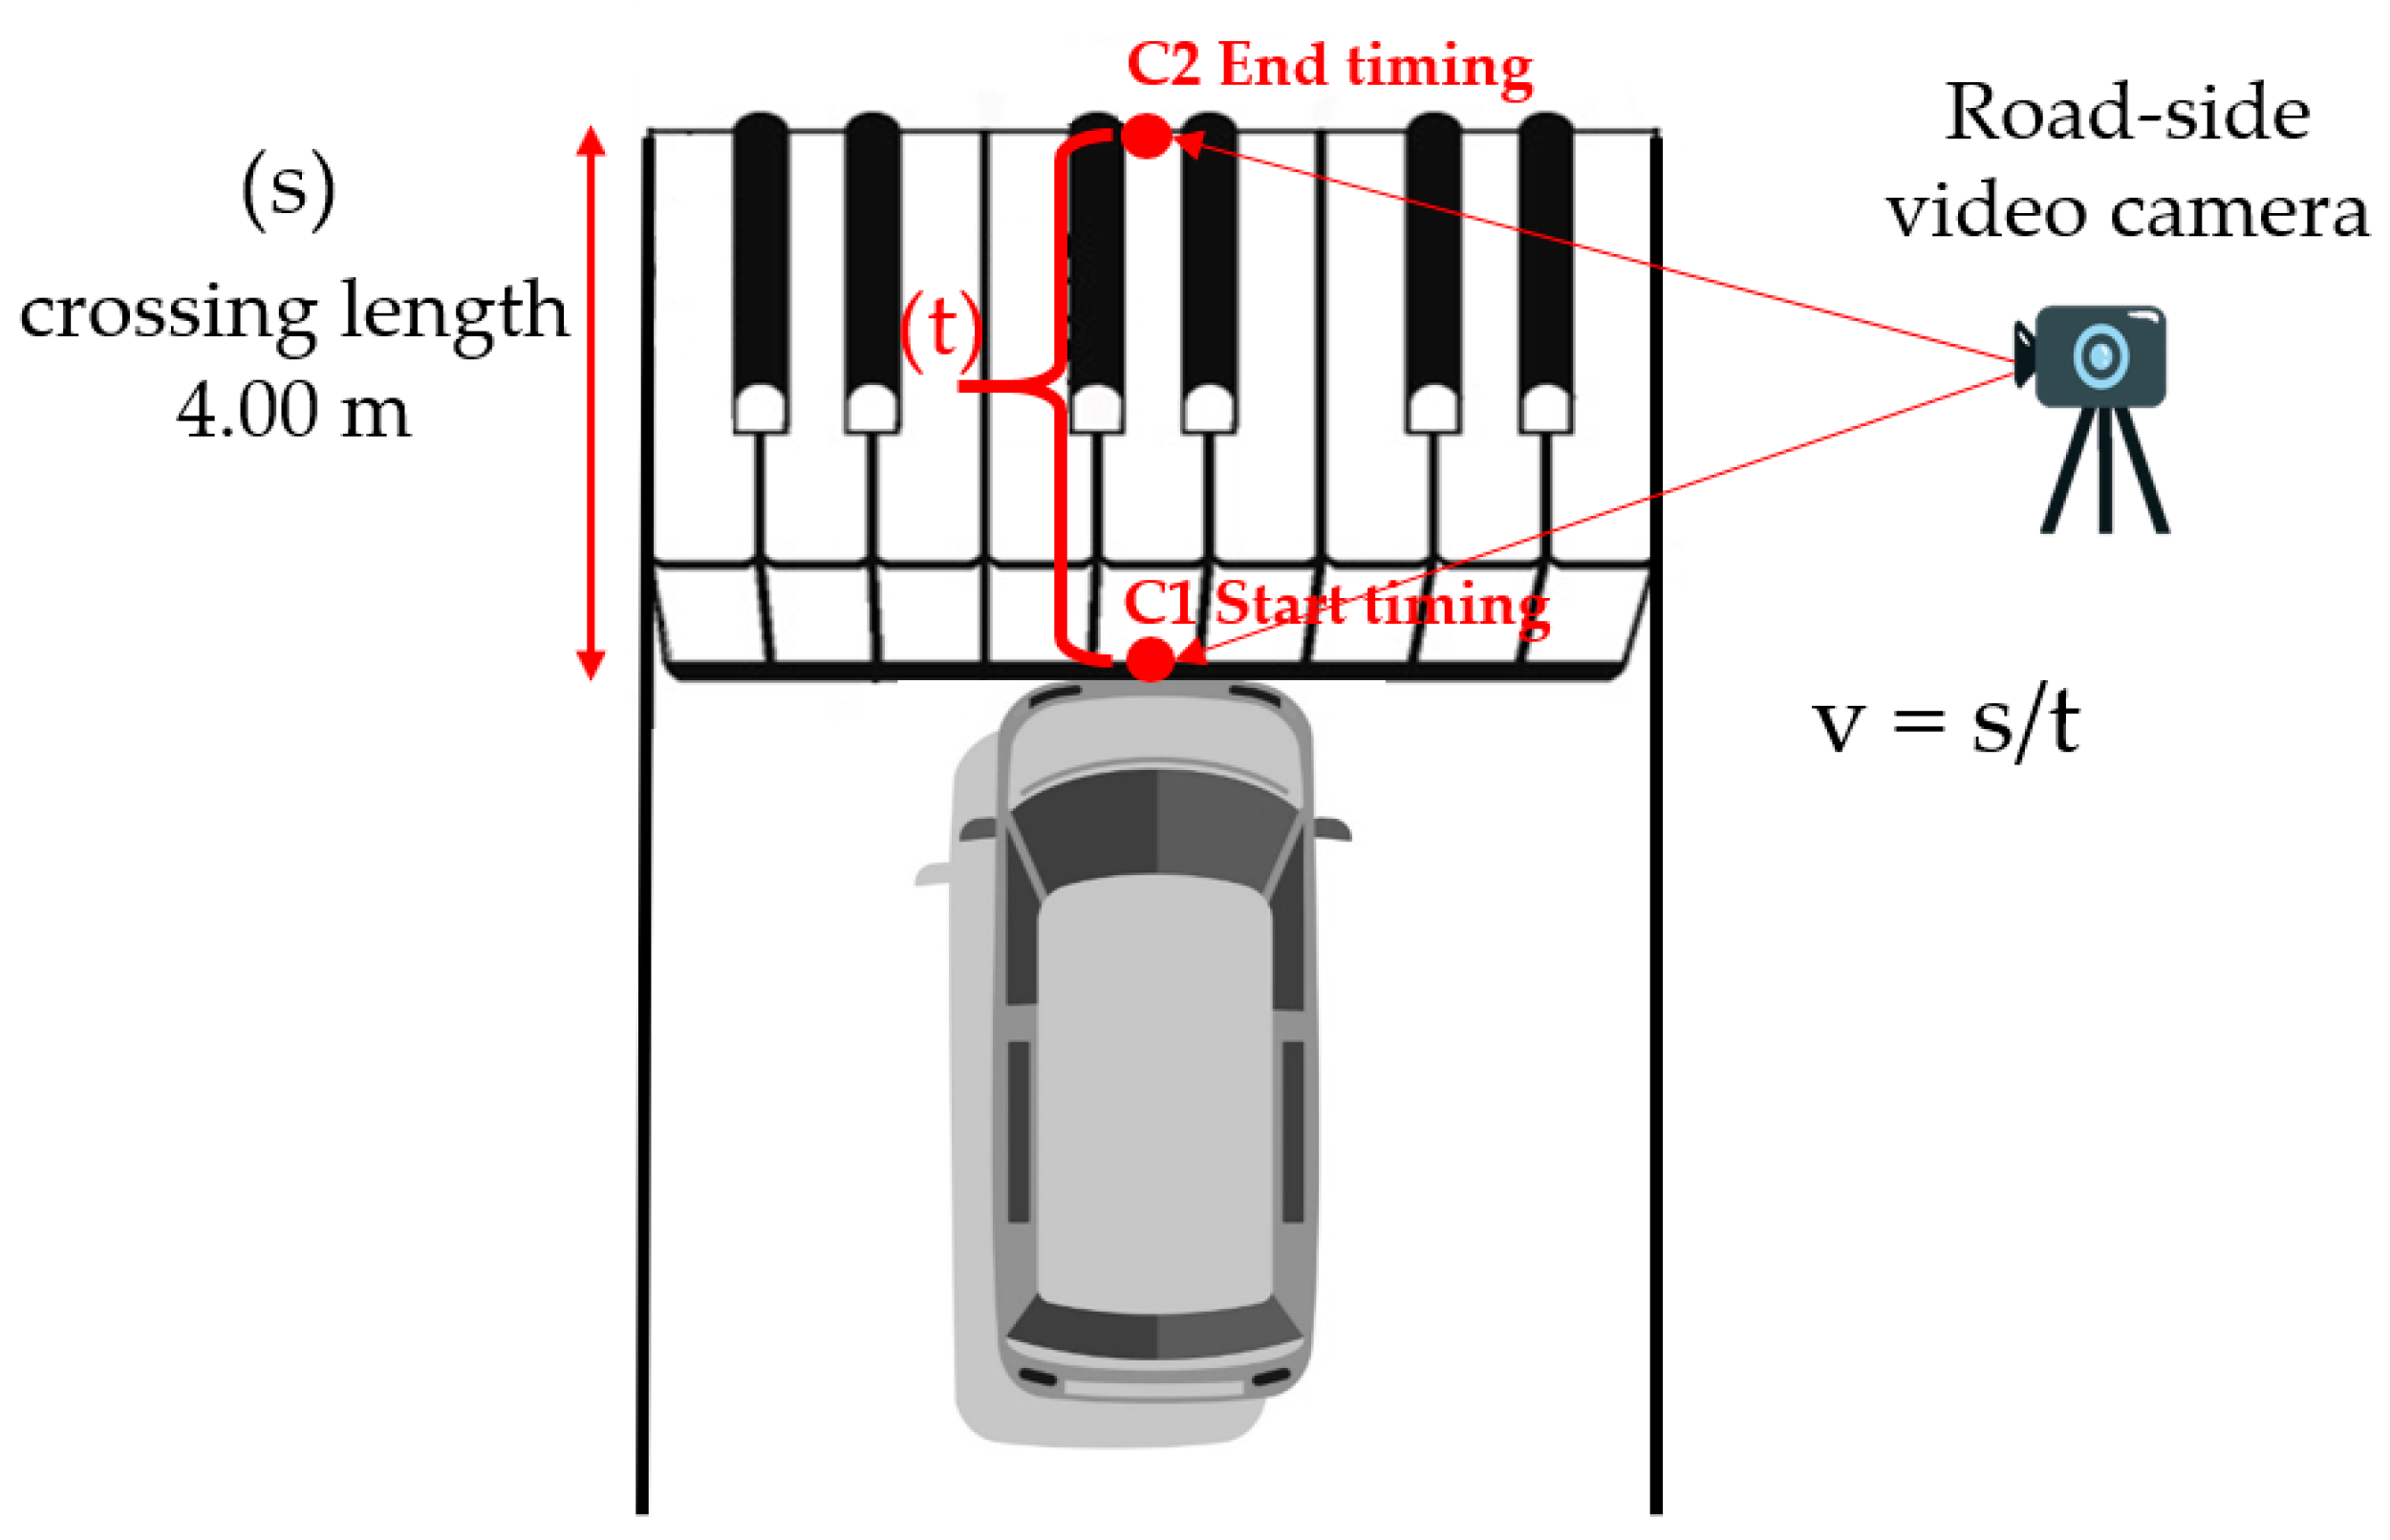
2. Methodology
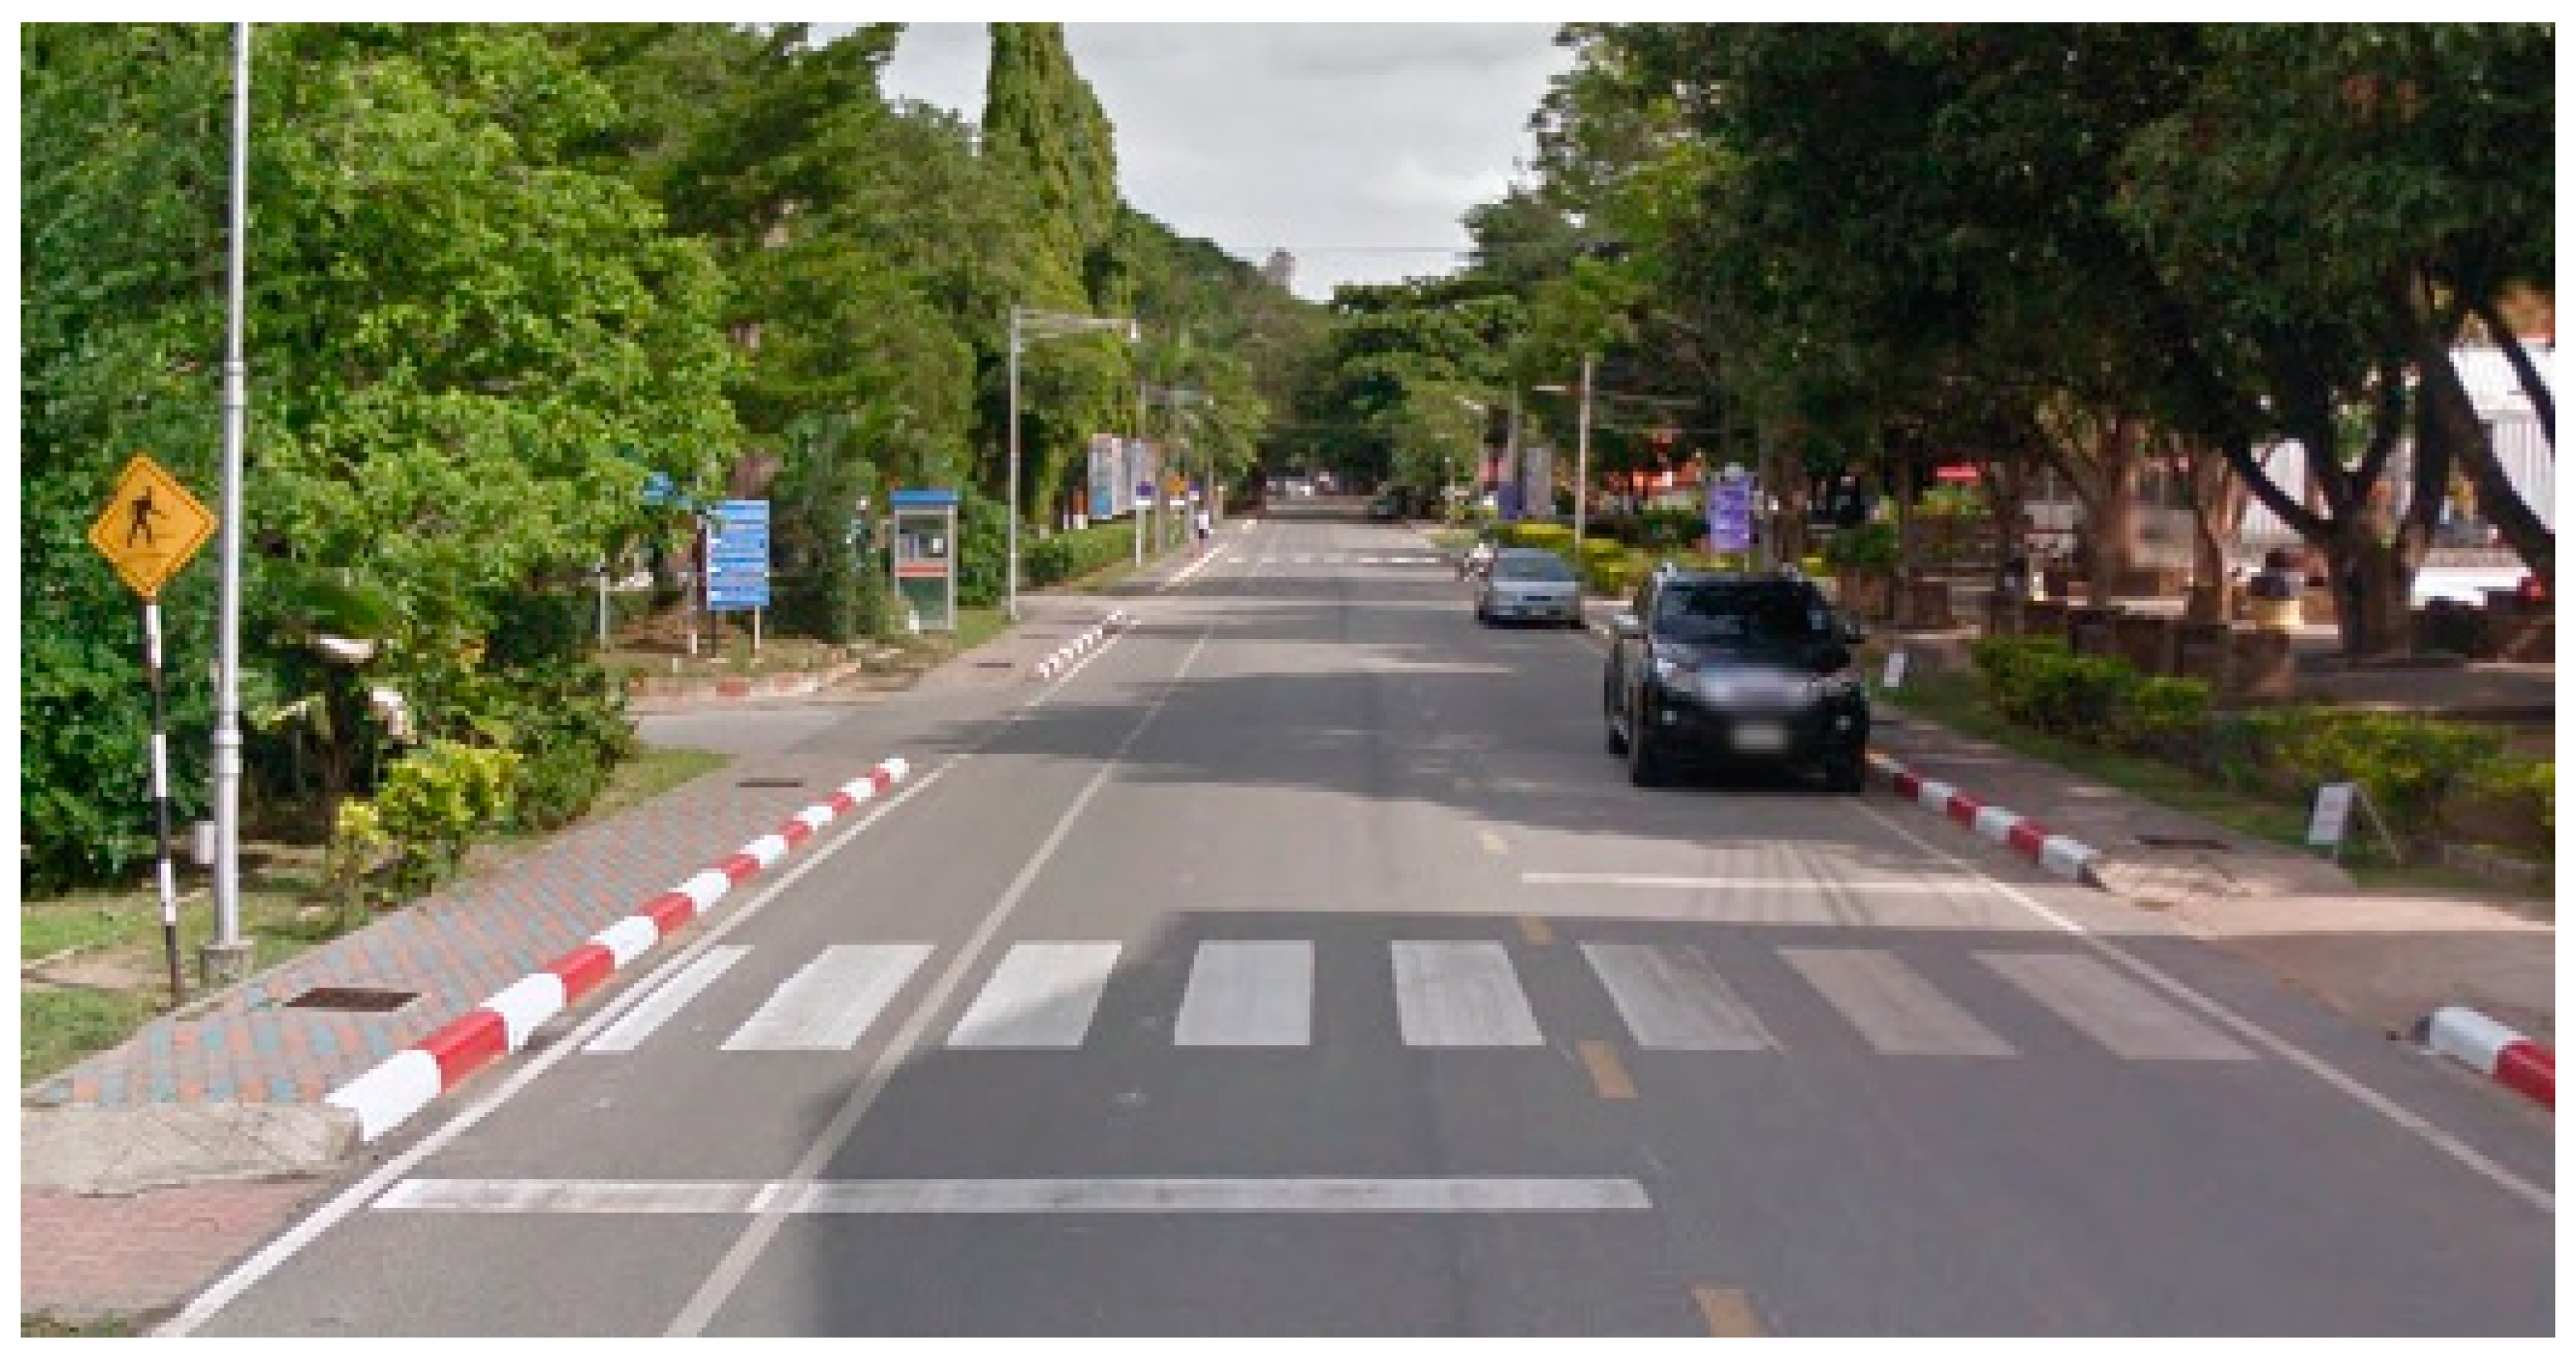
3. Existing Pedestrian Crossing
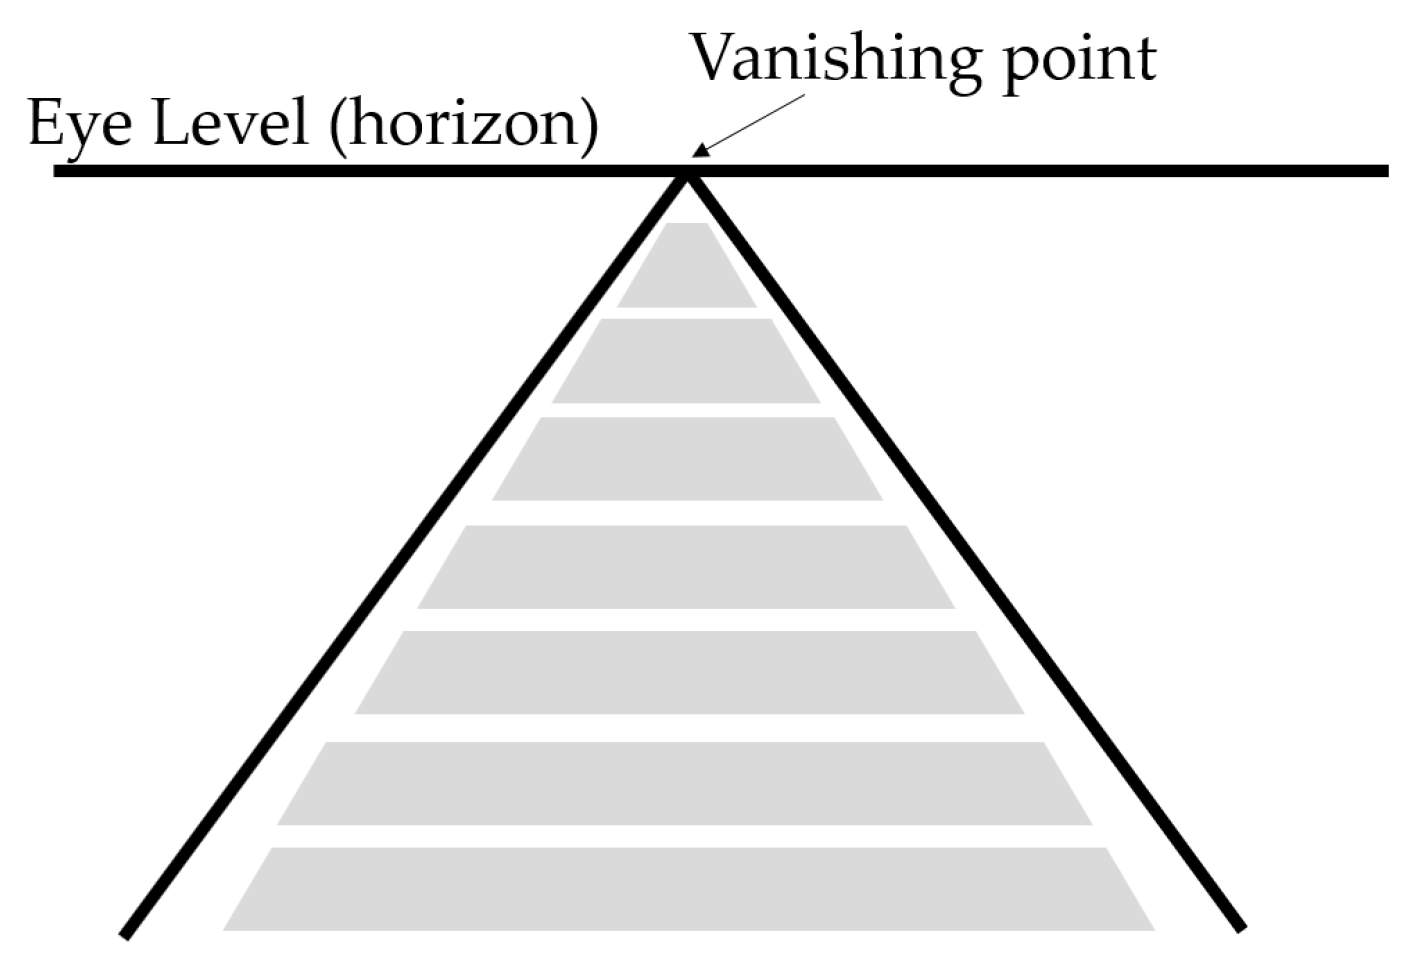
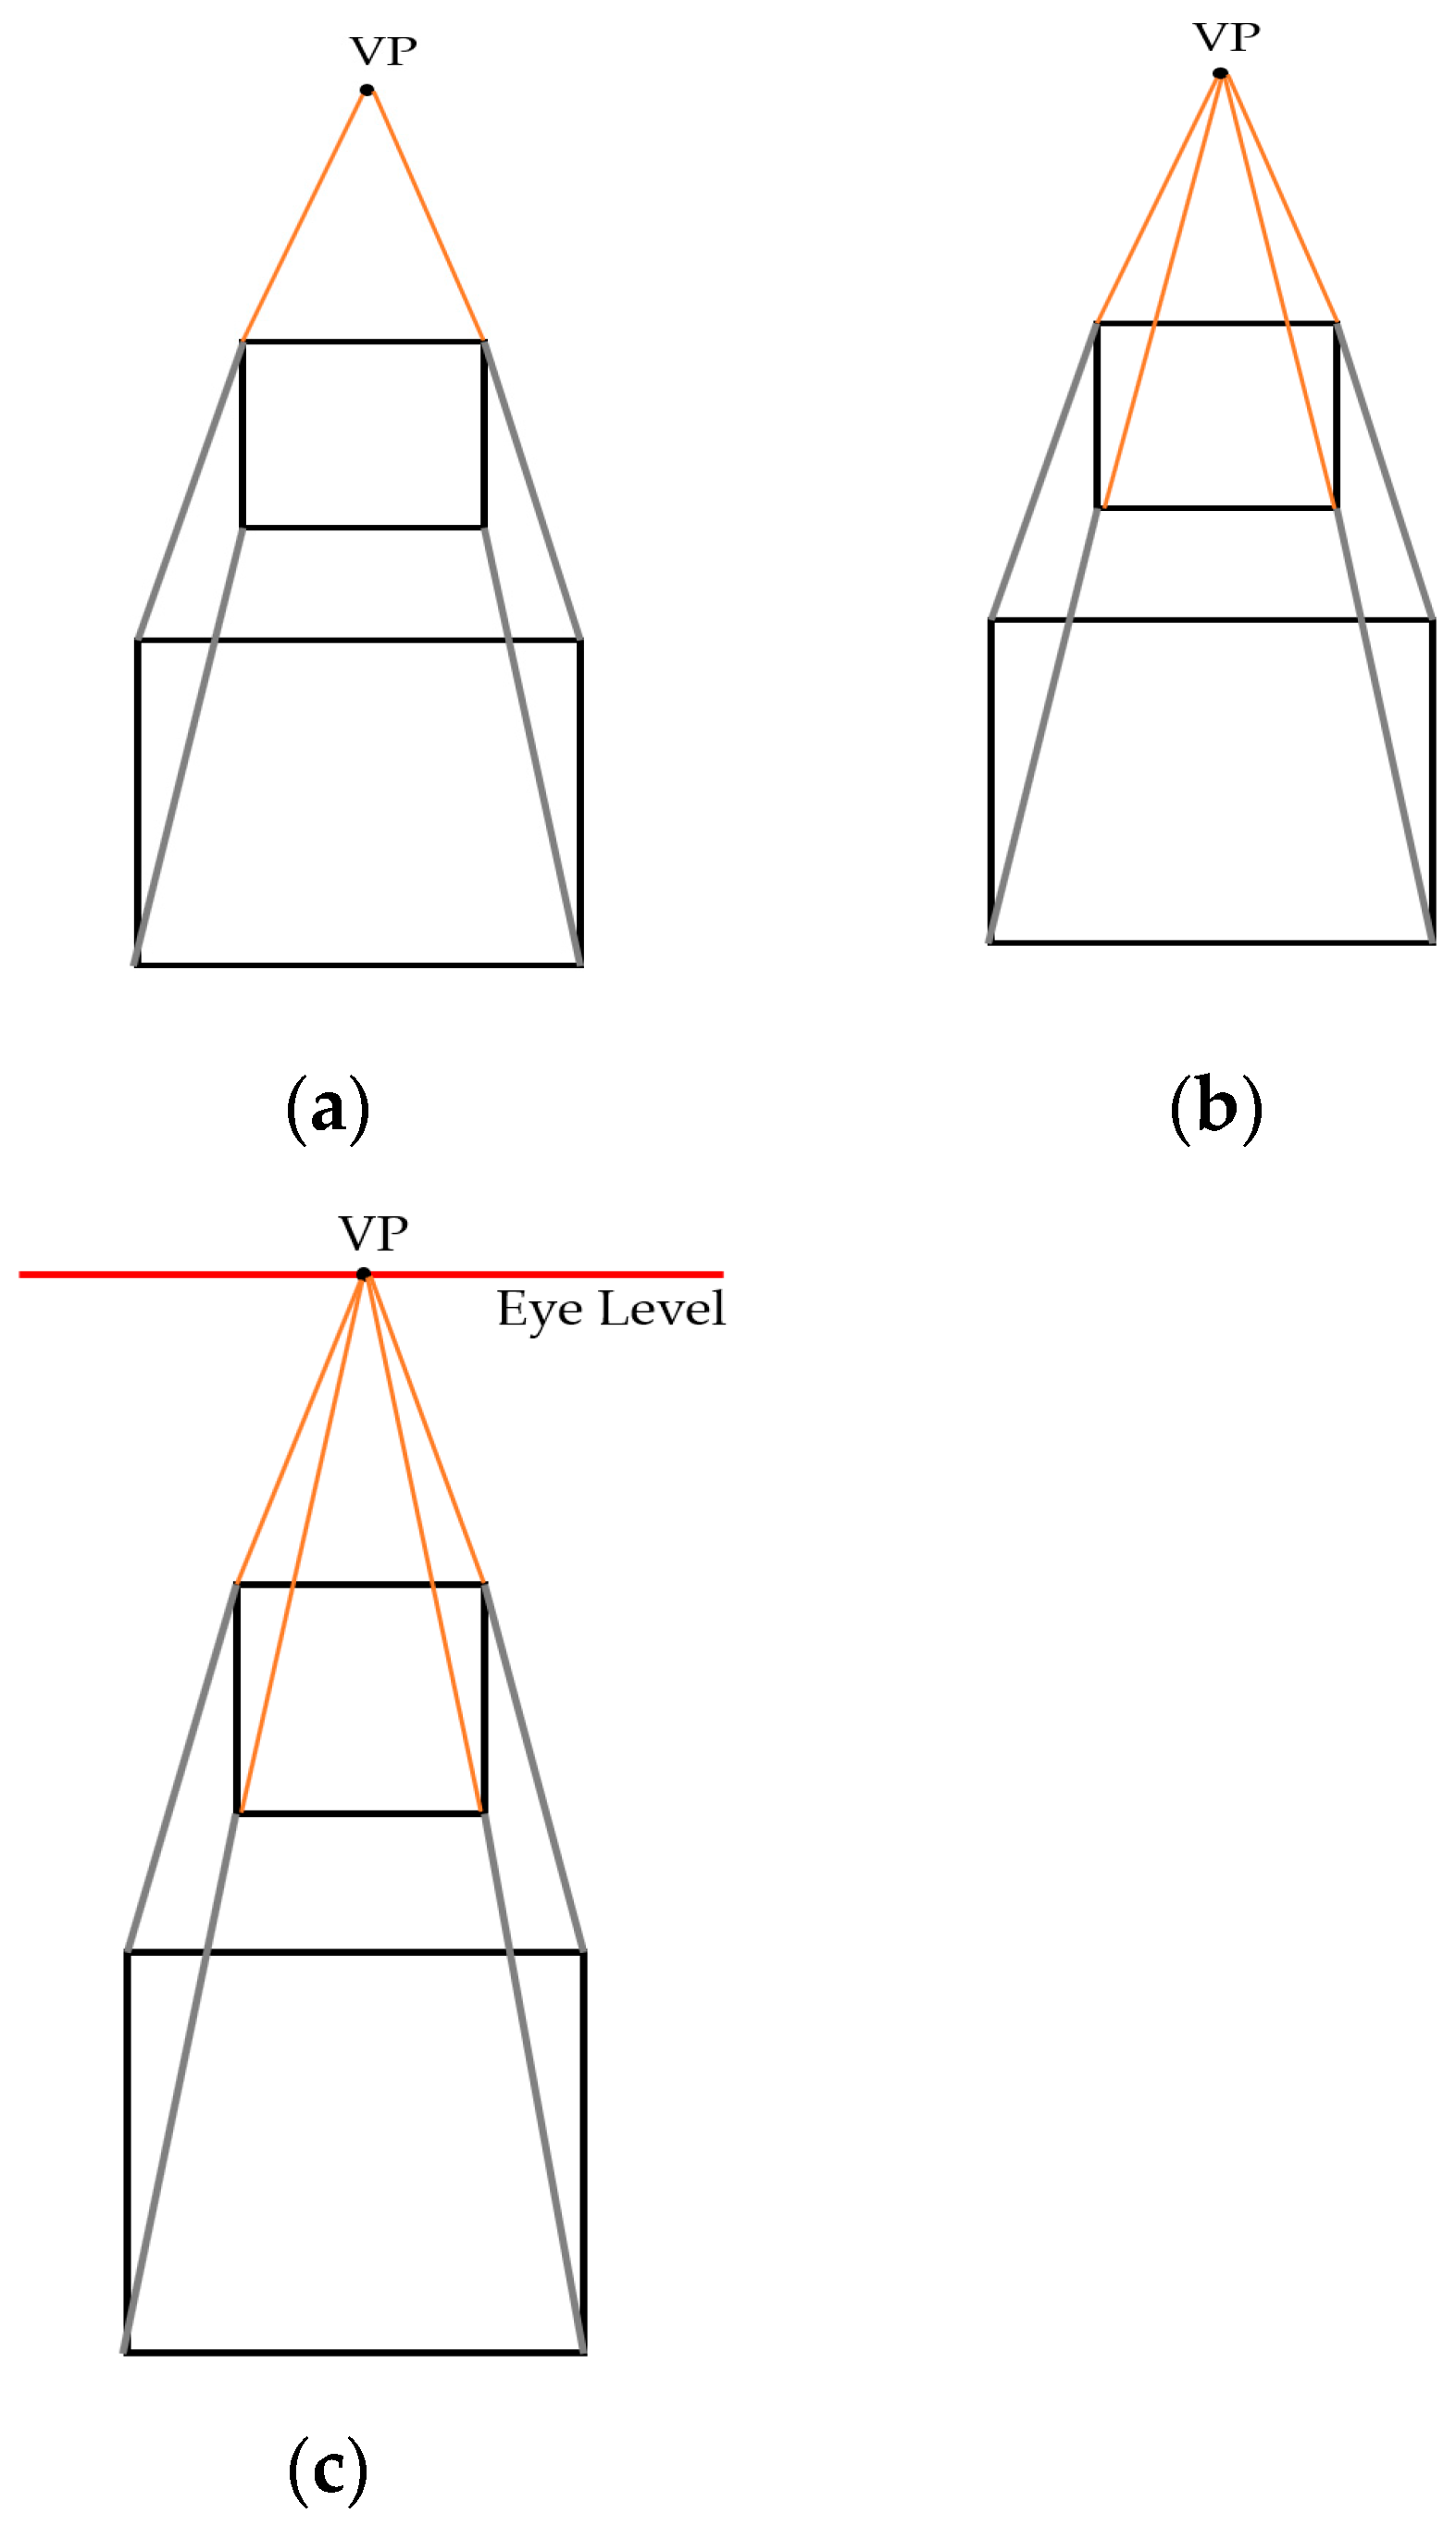
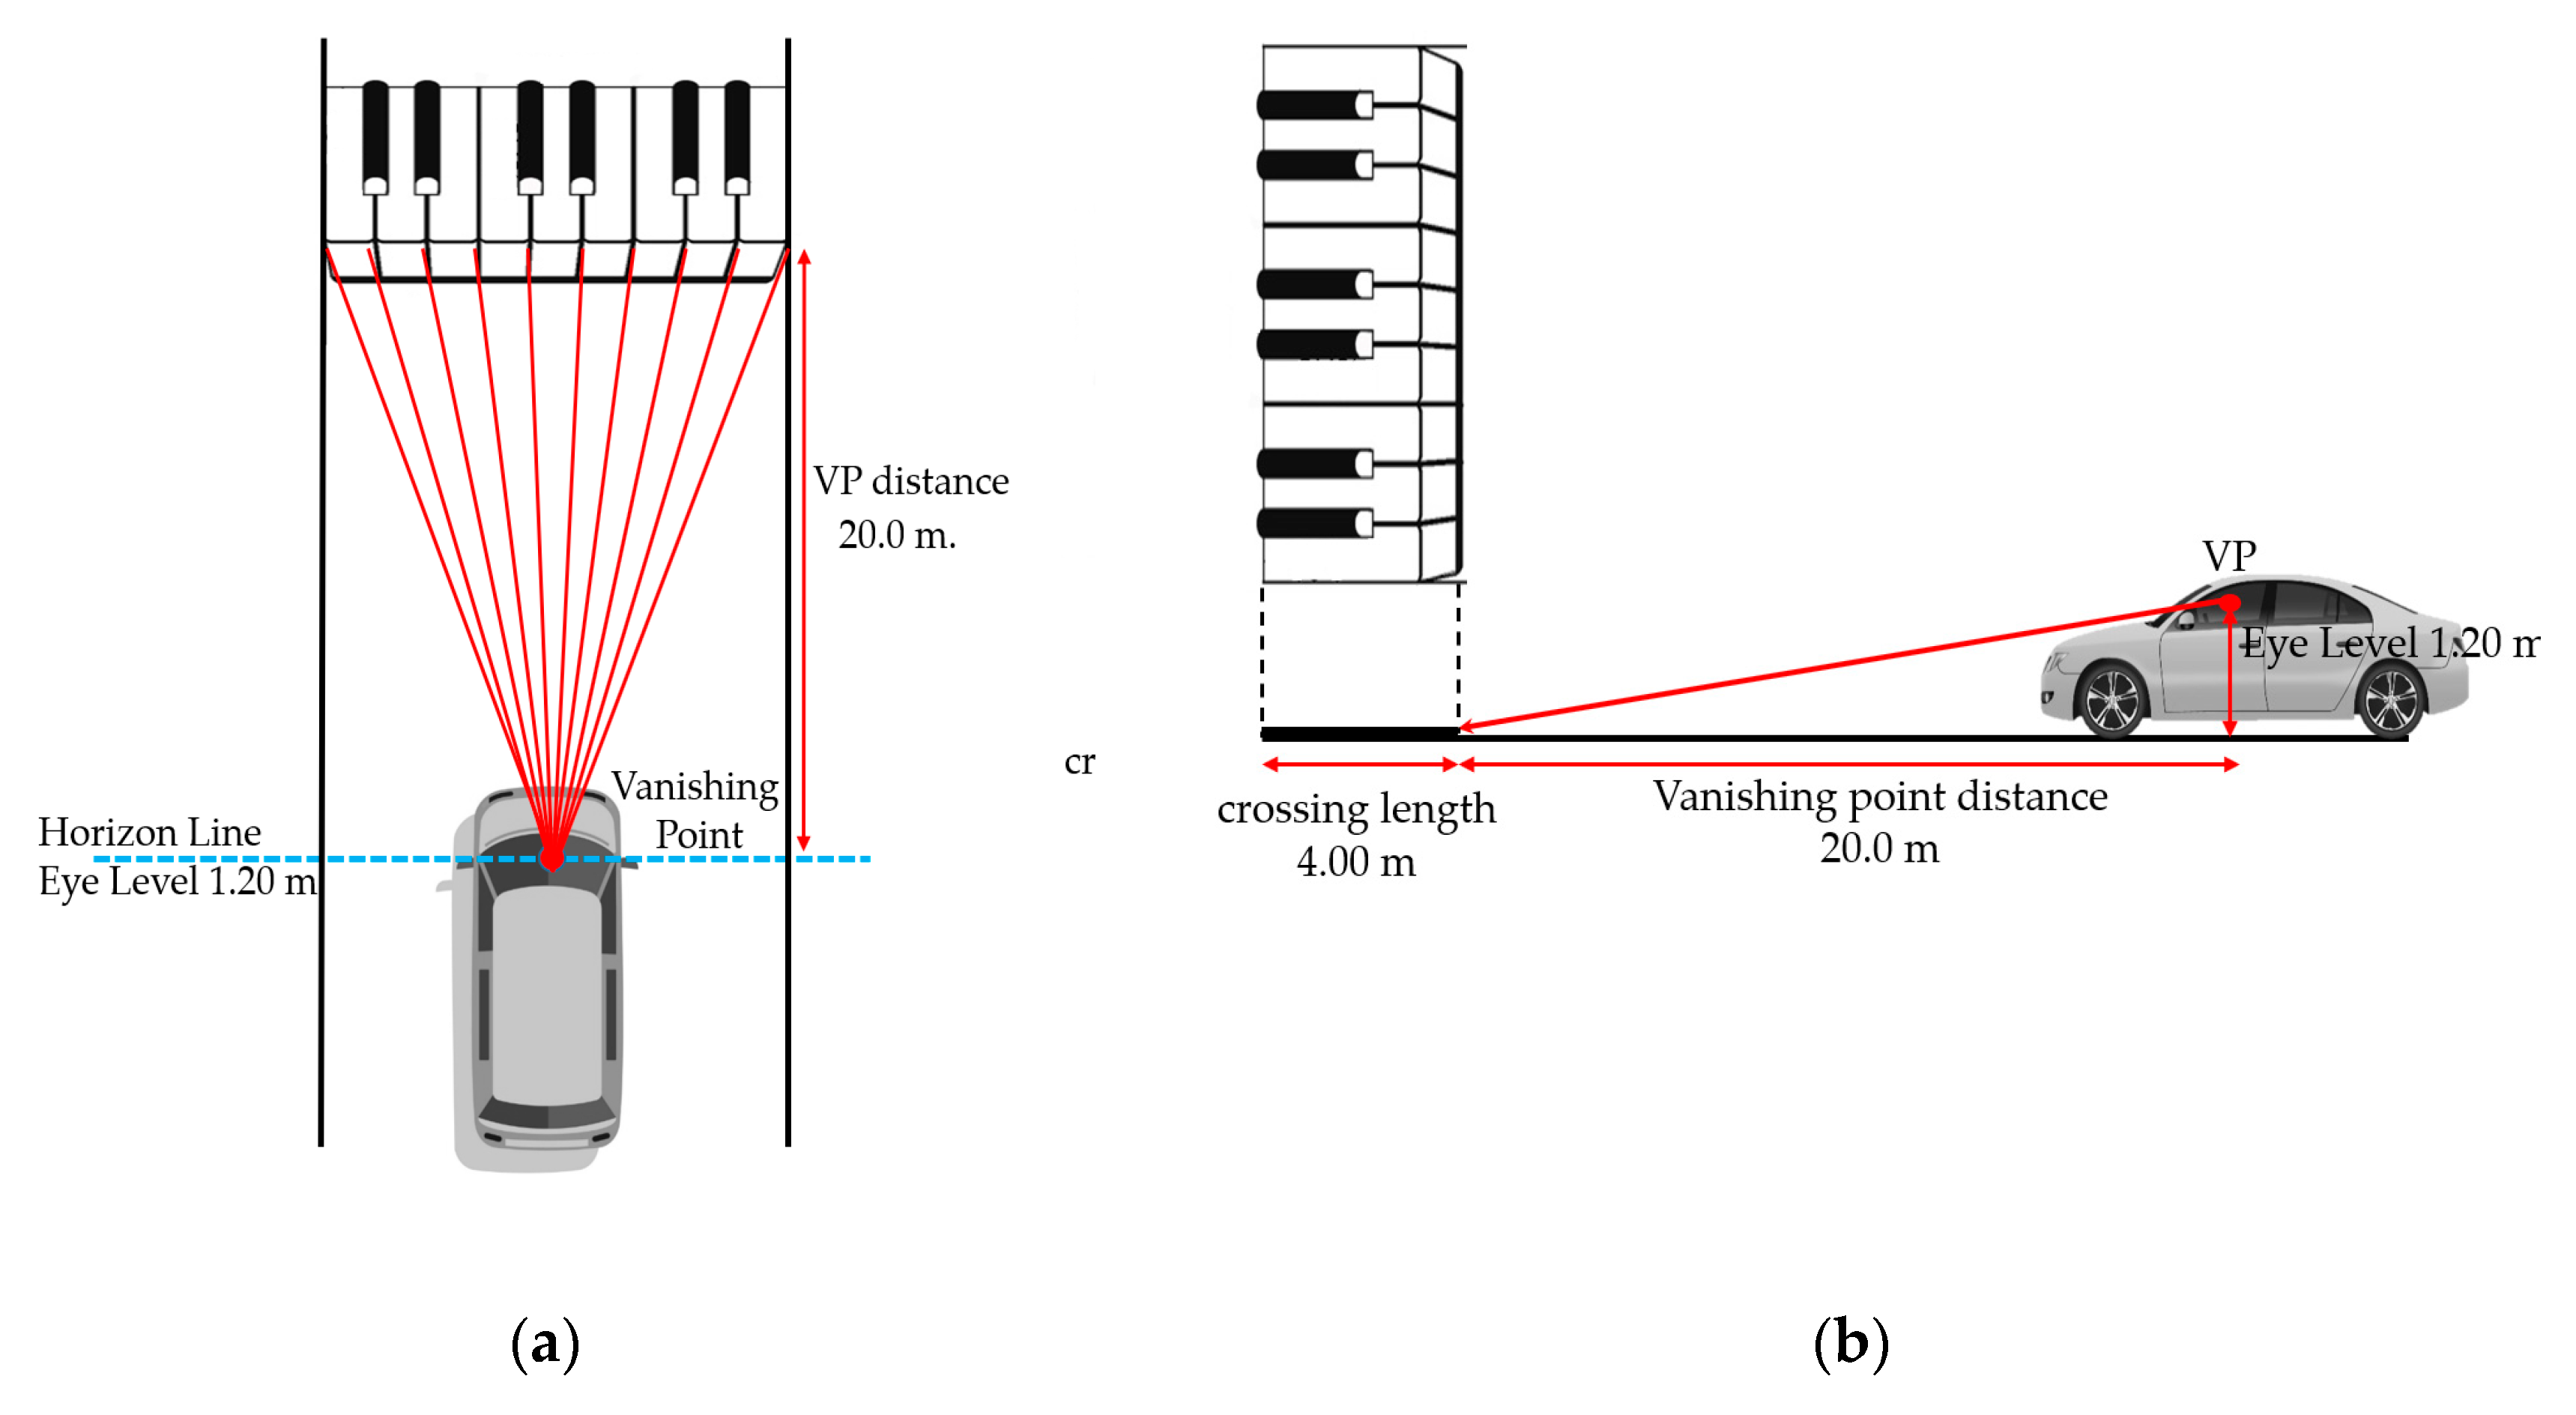
4. Drawing Perspective Technique
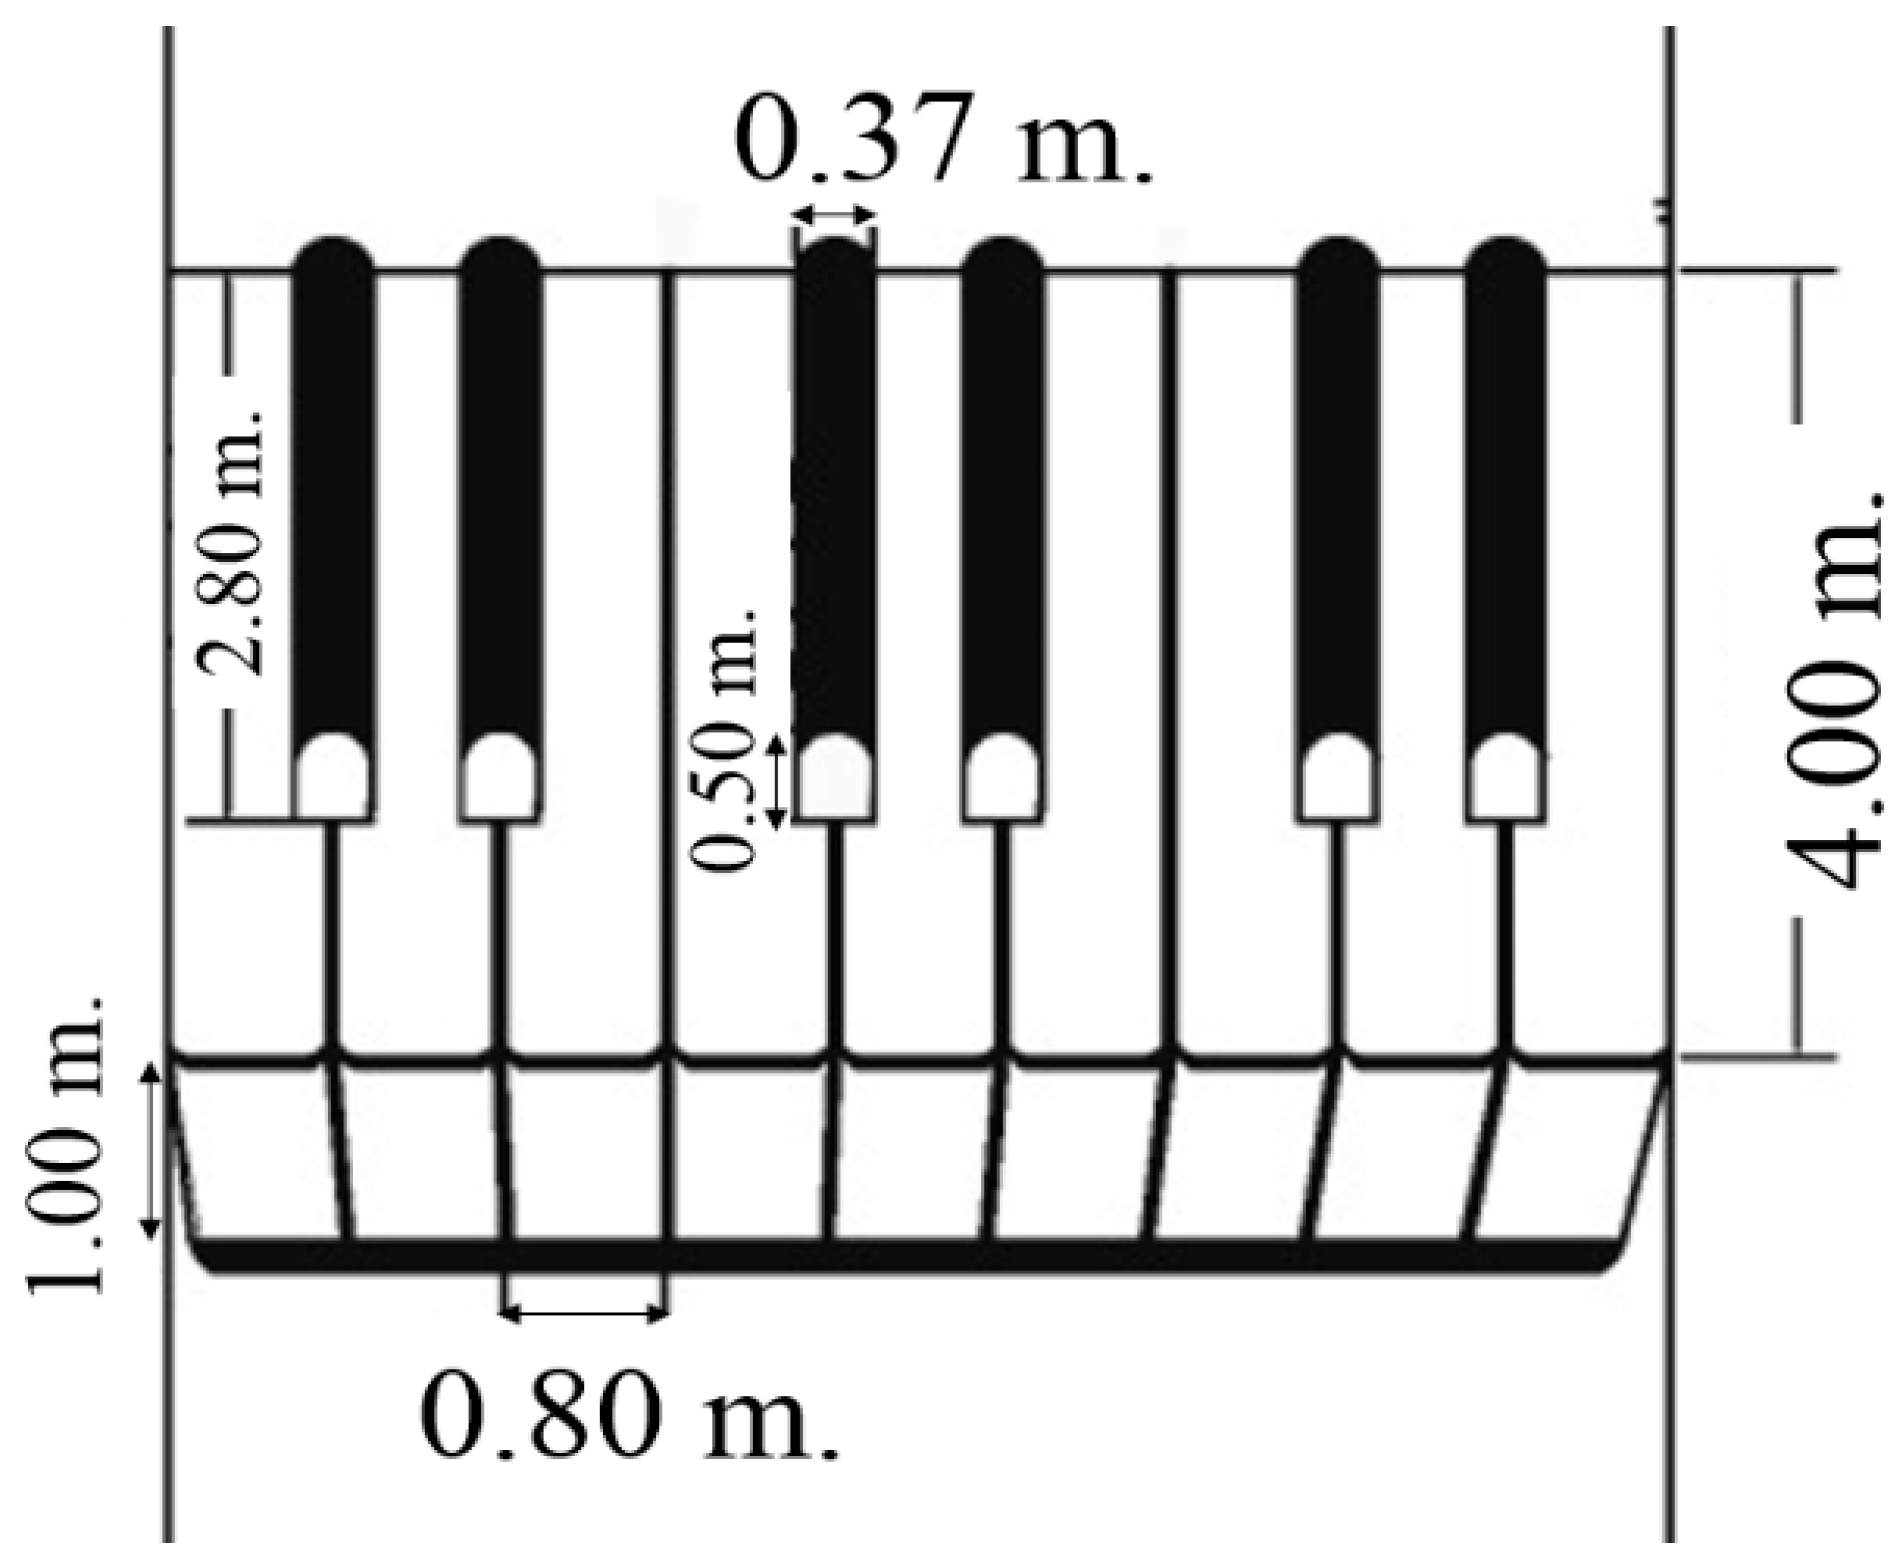
5. Three-Dimensional Piano-Keyboard-Styled Pedestrian Crossing
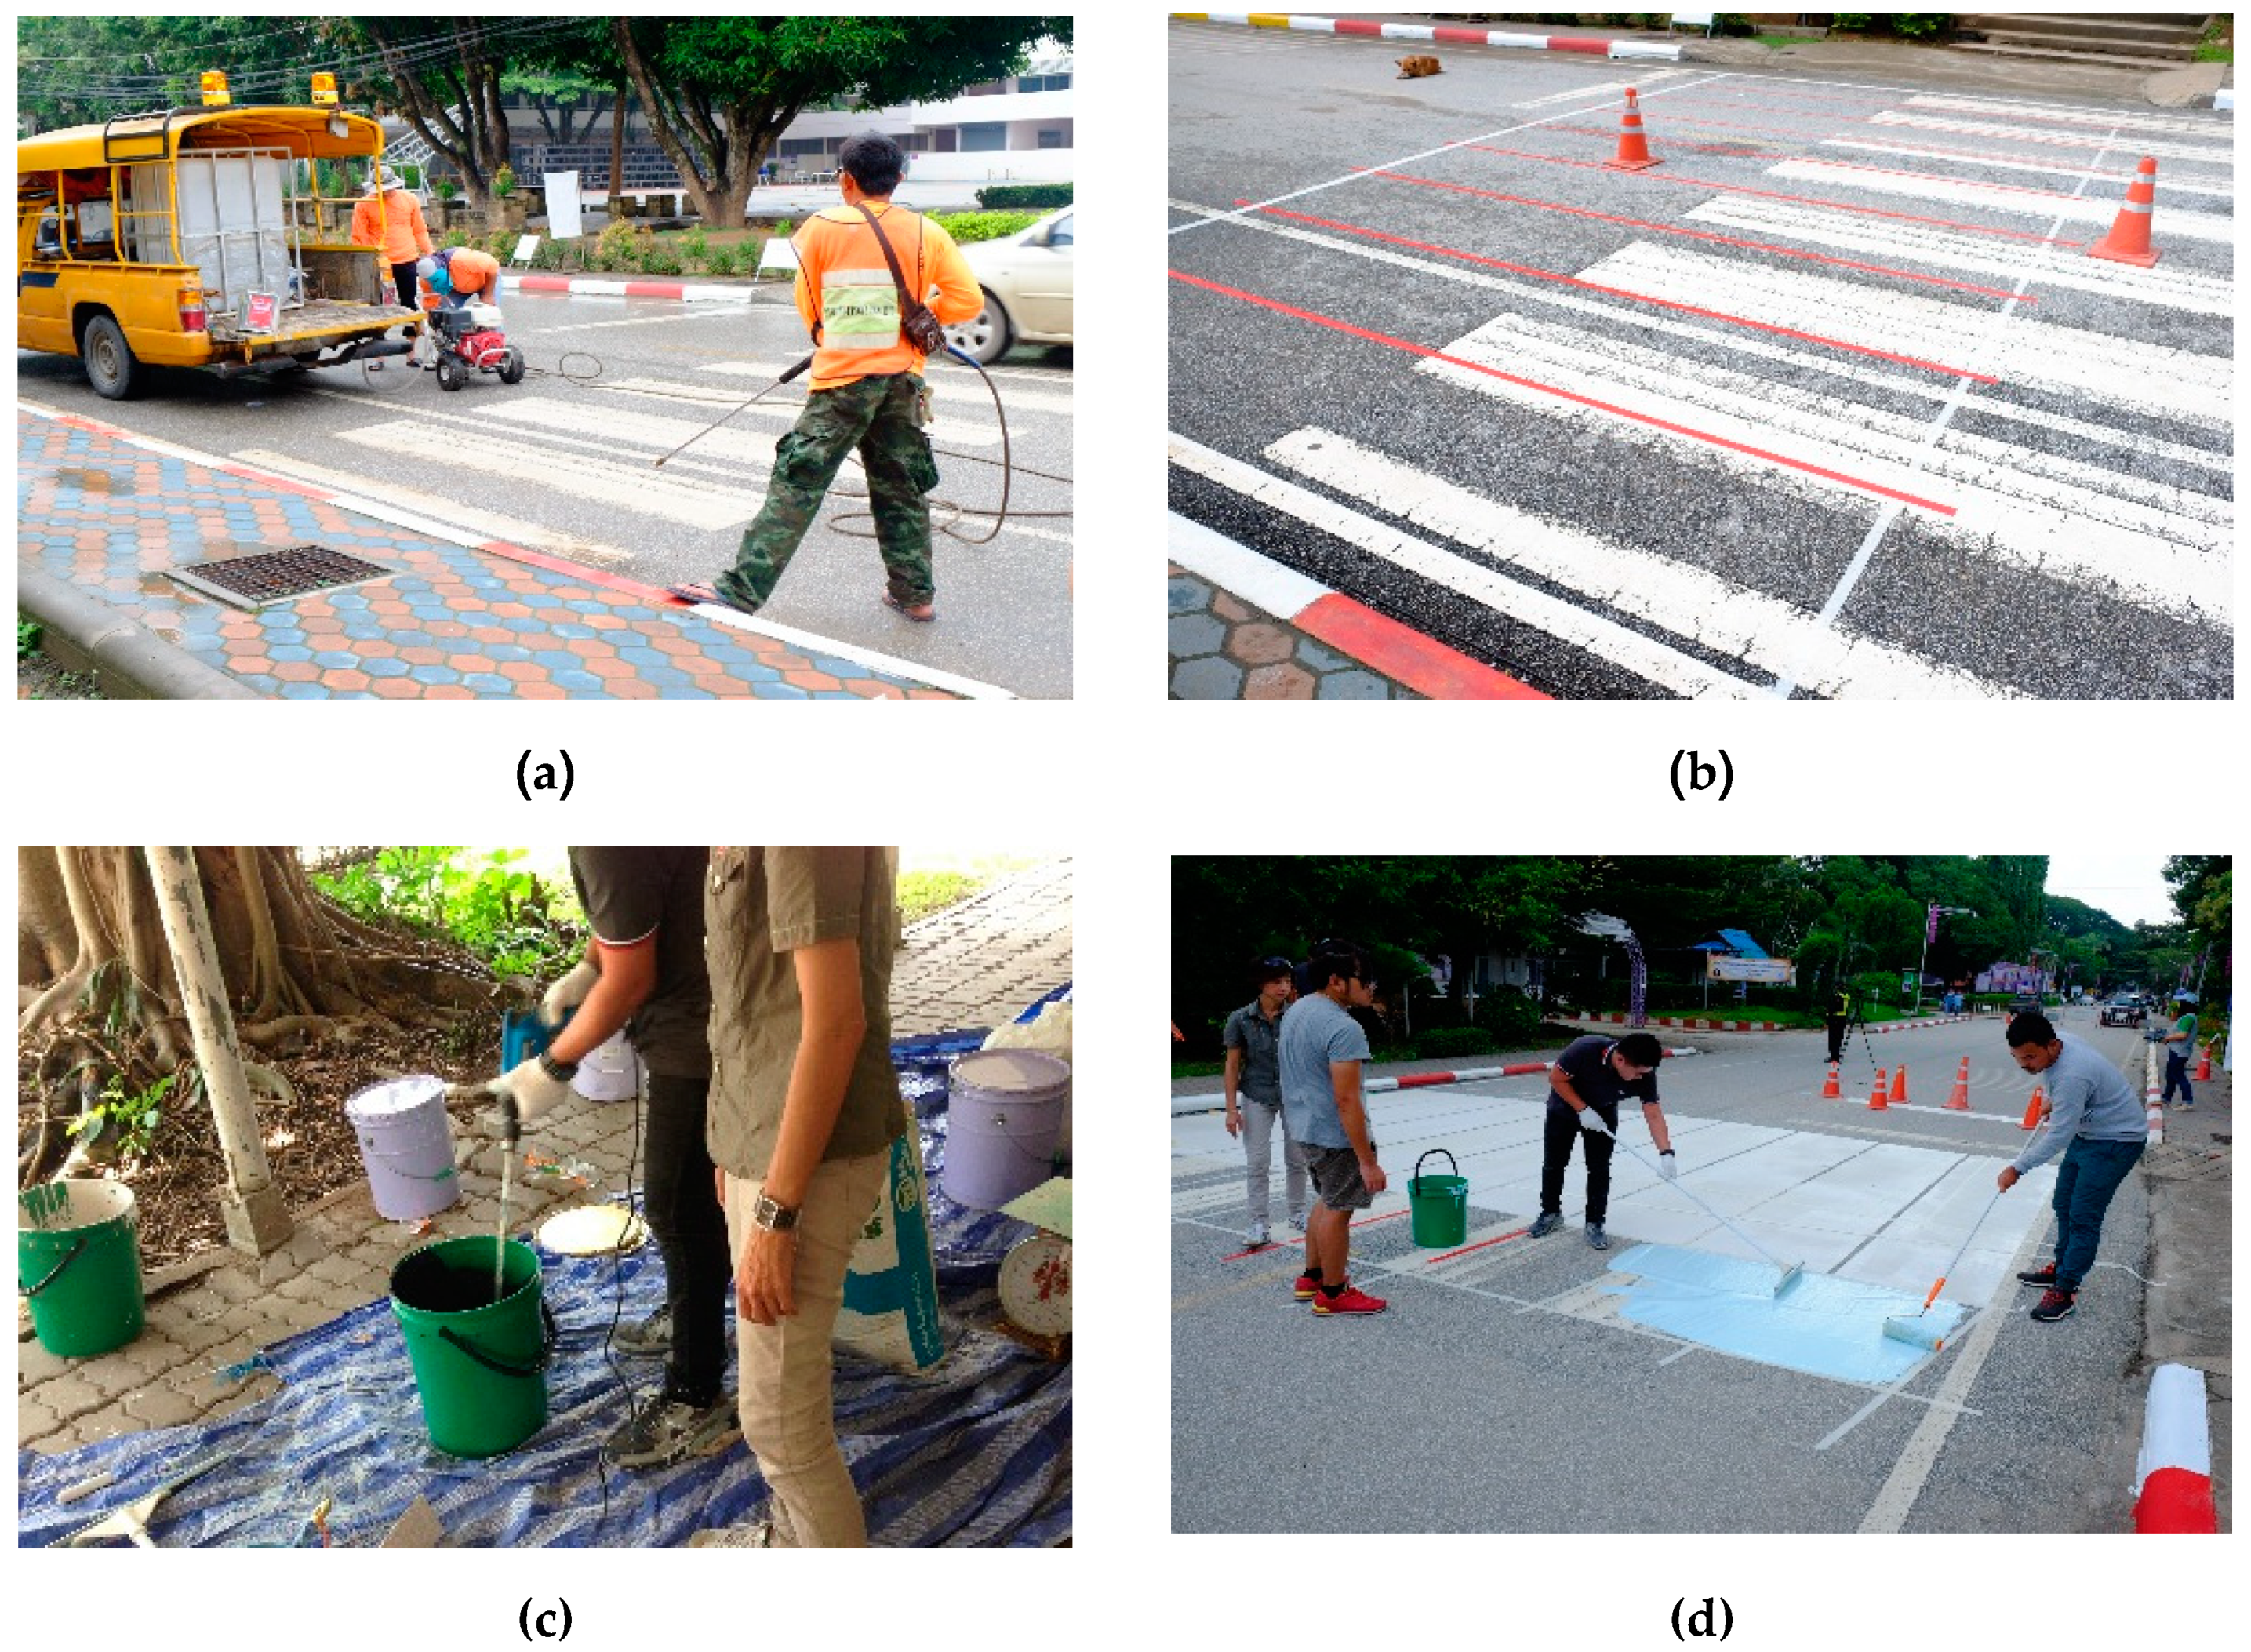
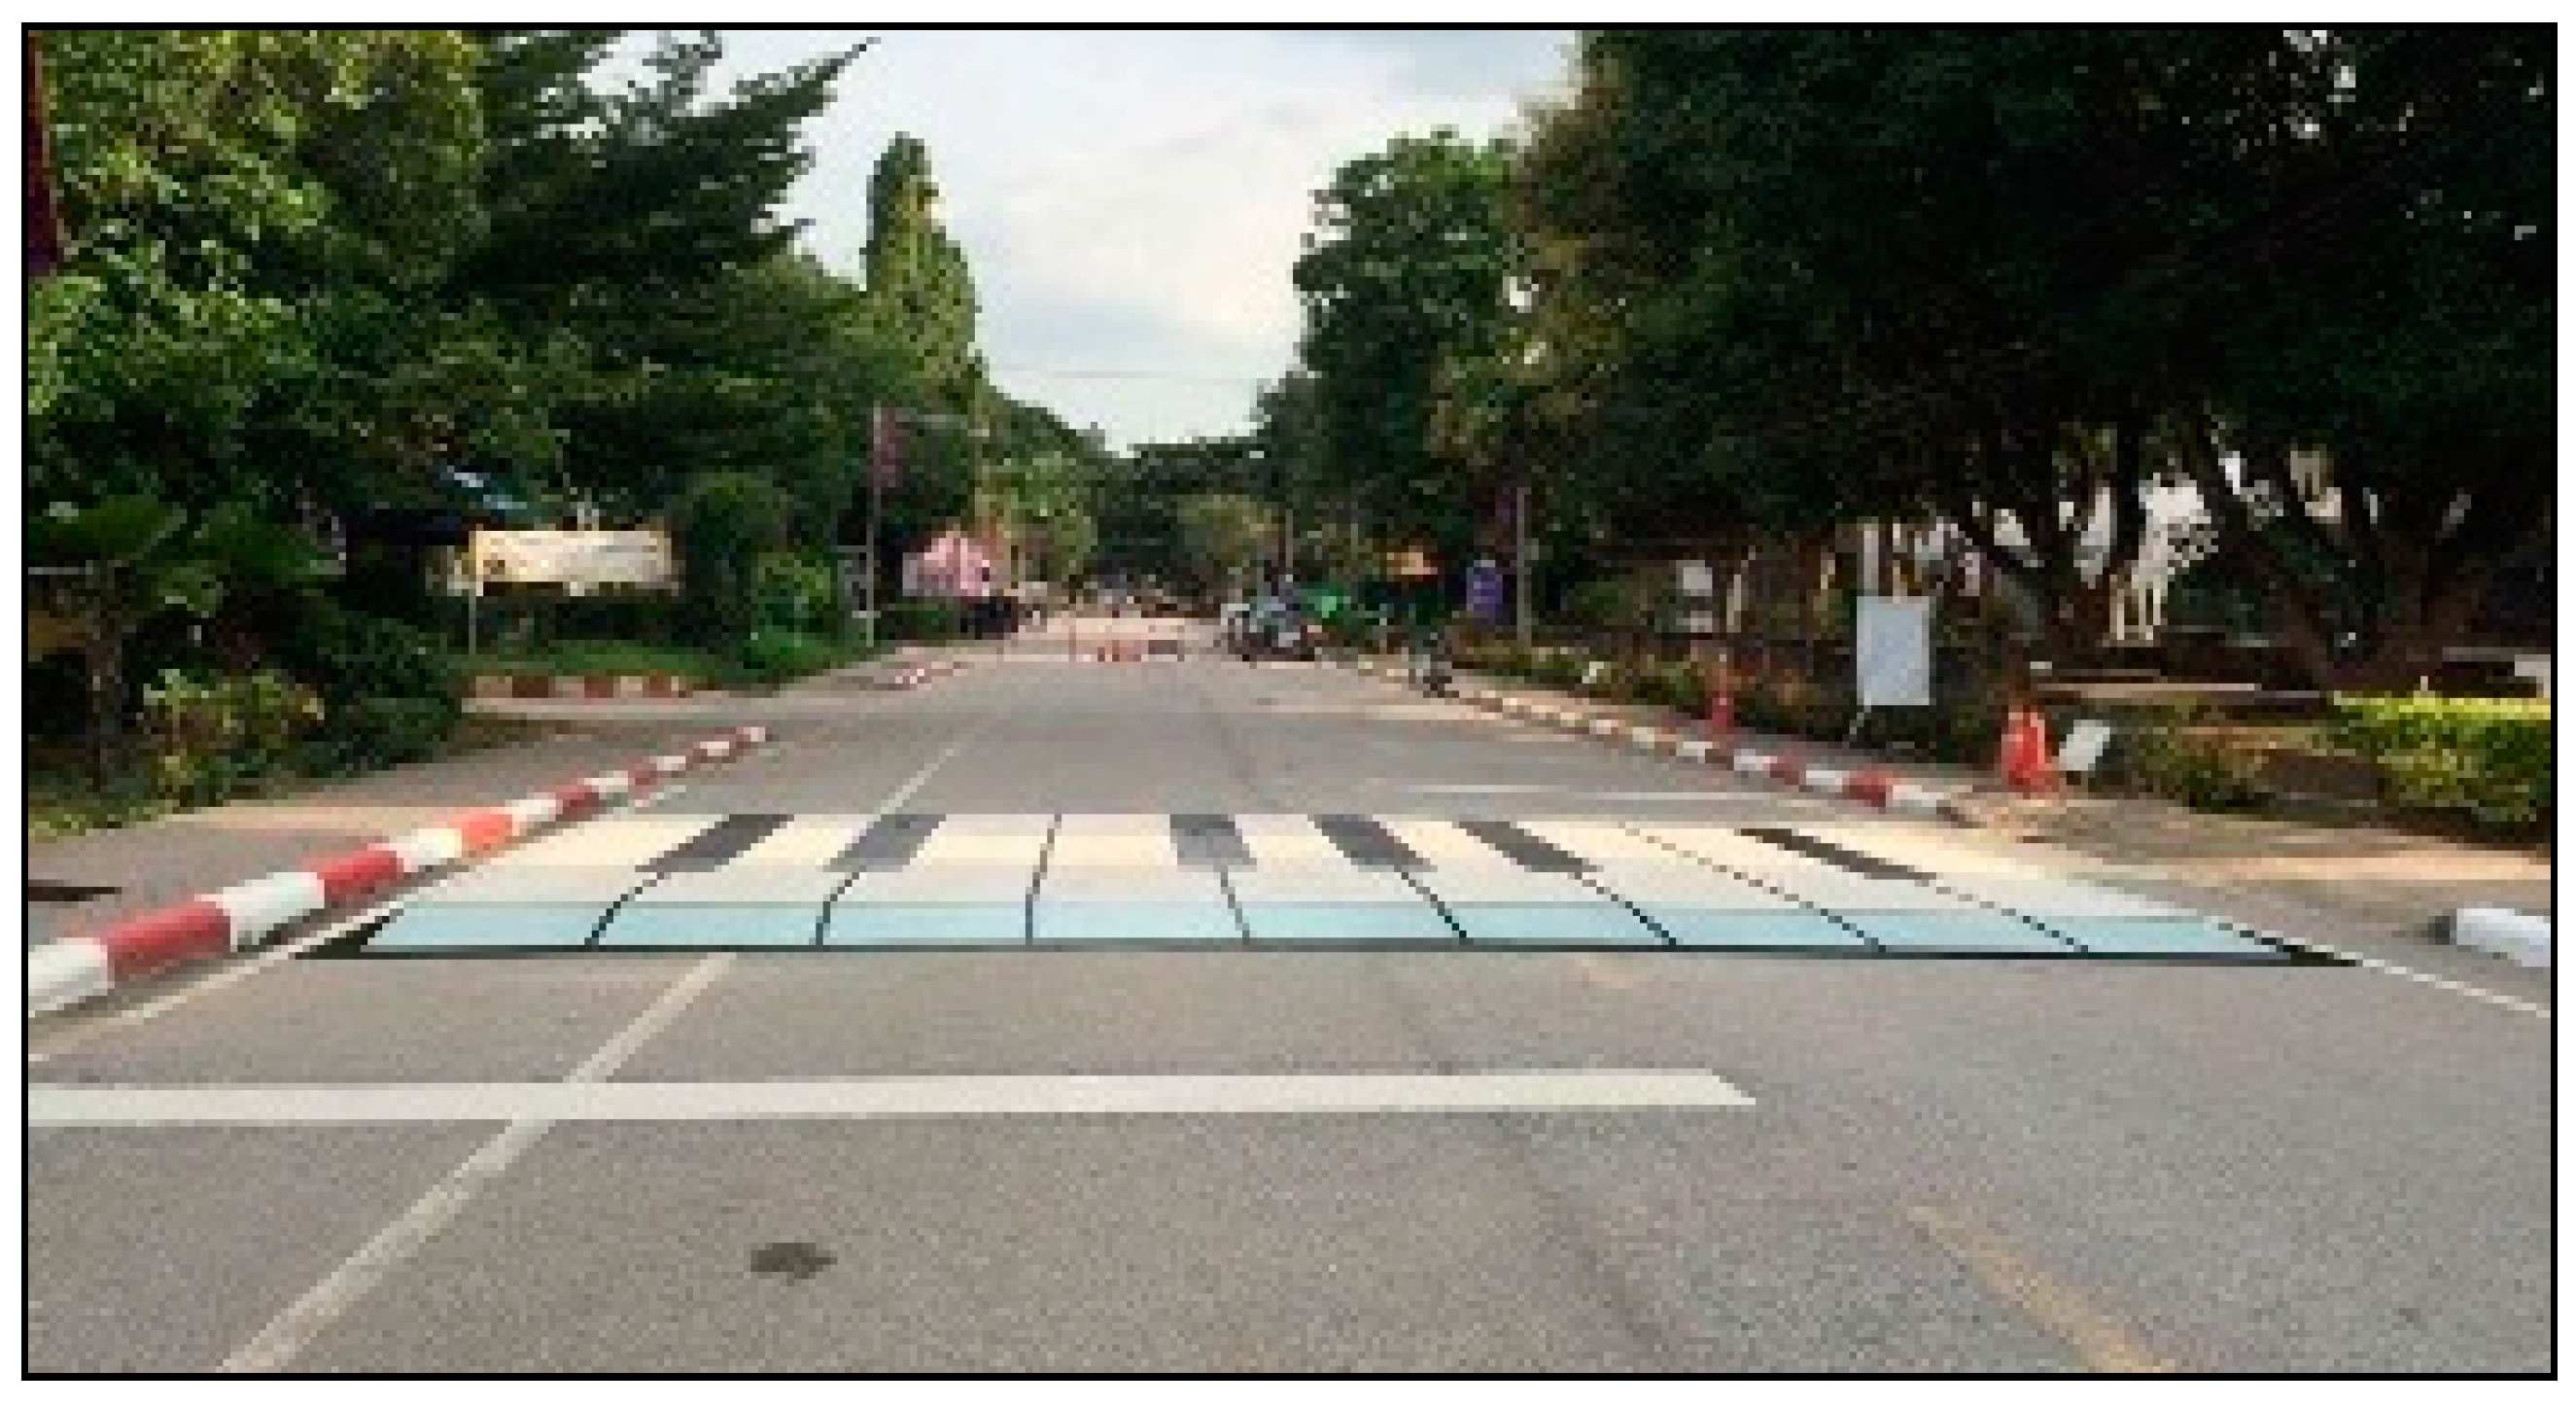
6. Installation of 3DPK Crossing
7. Results and Discussions
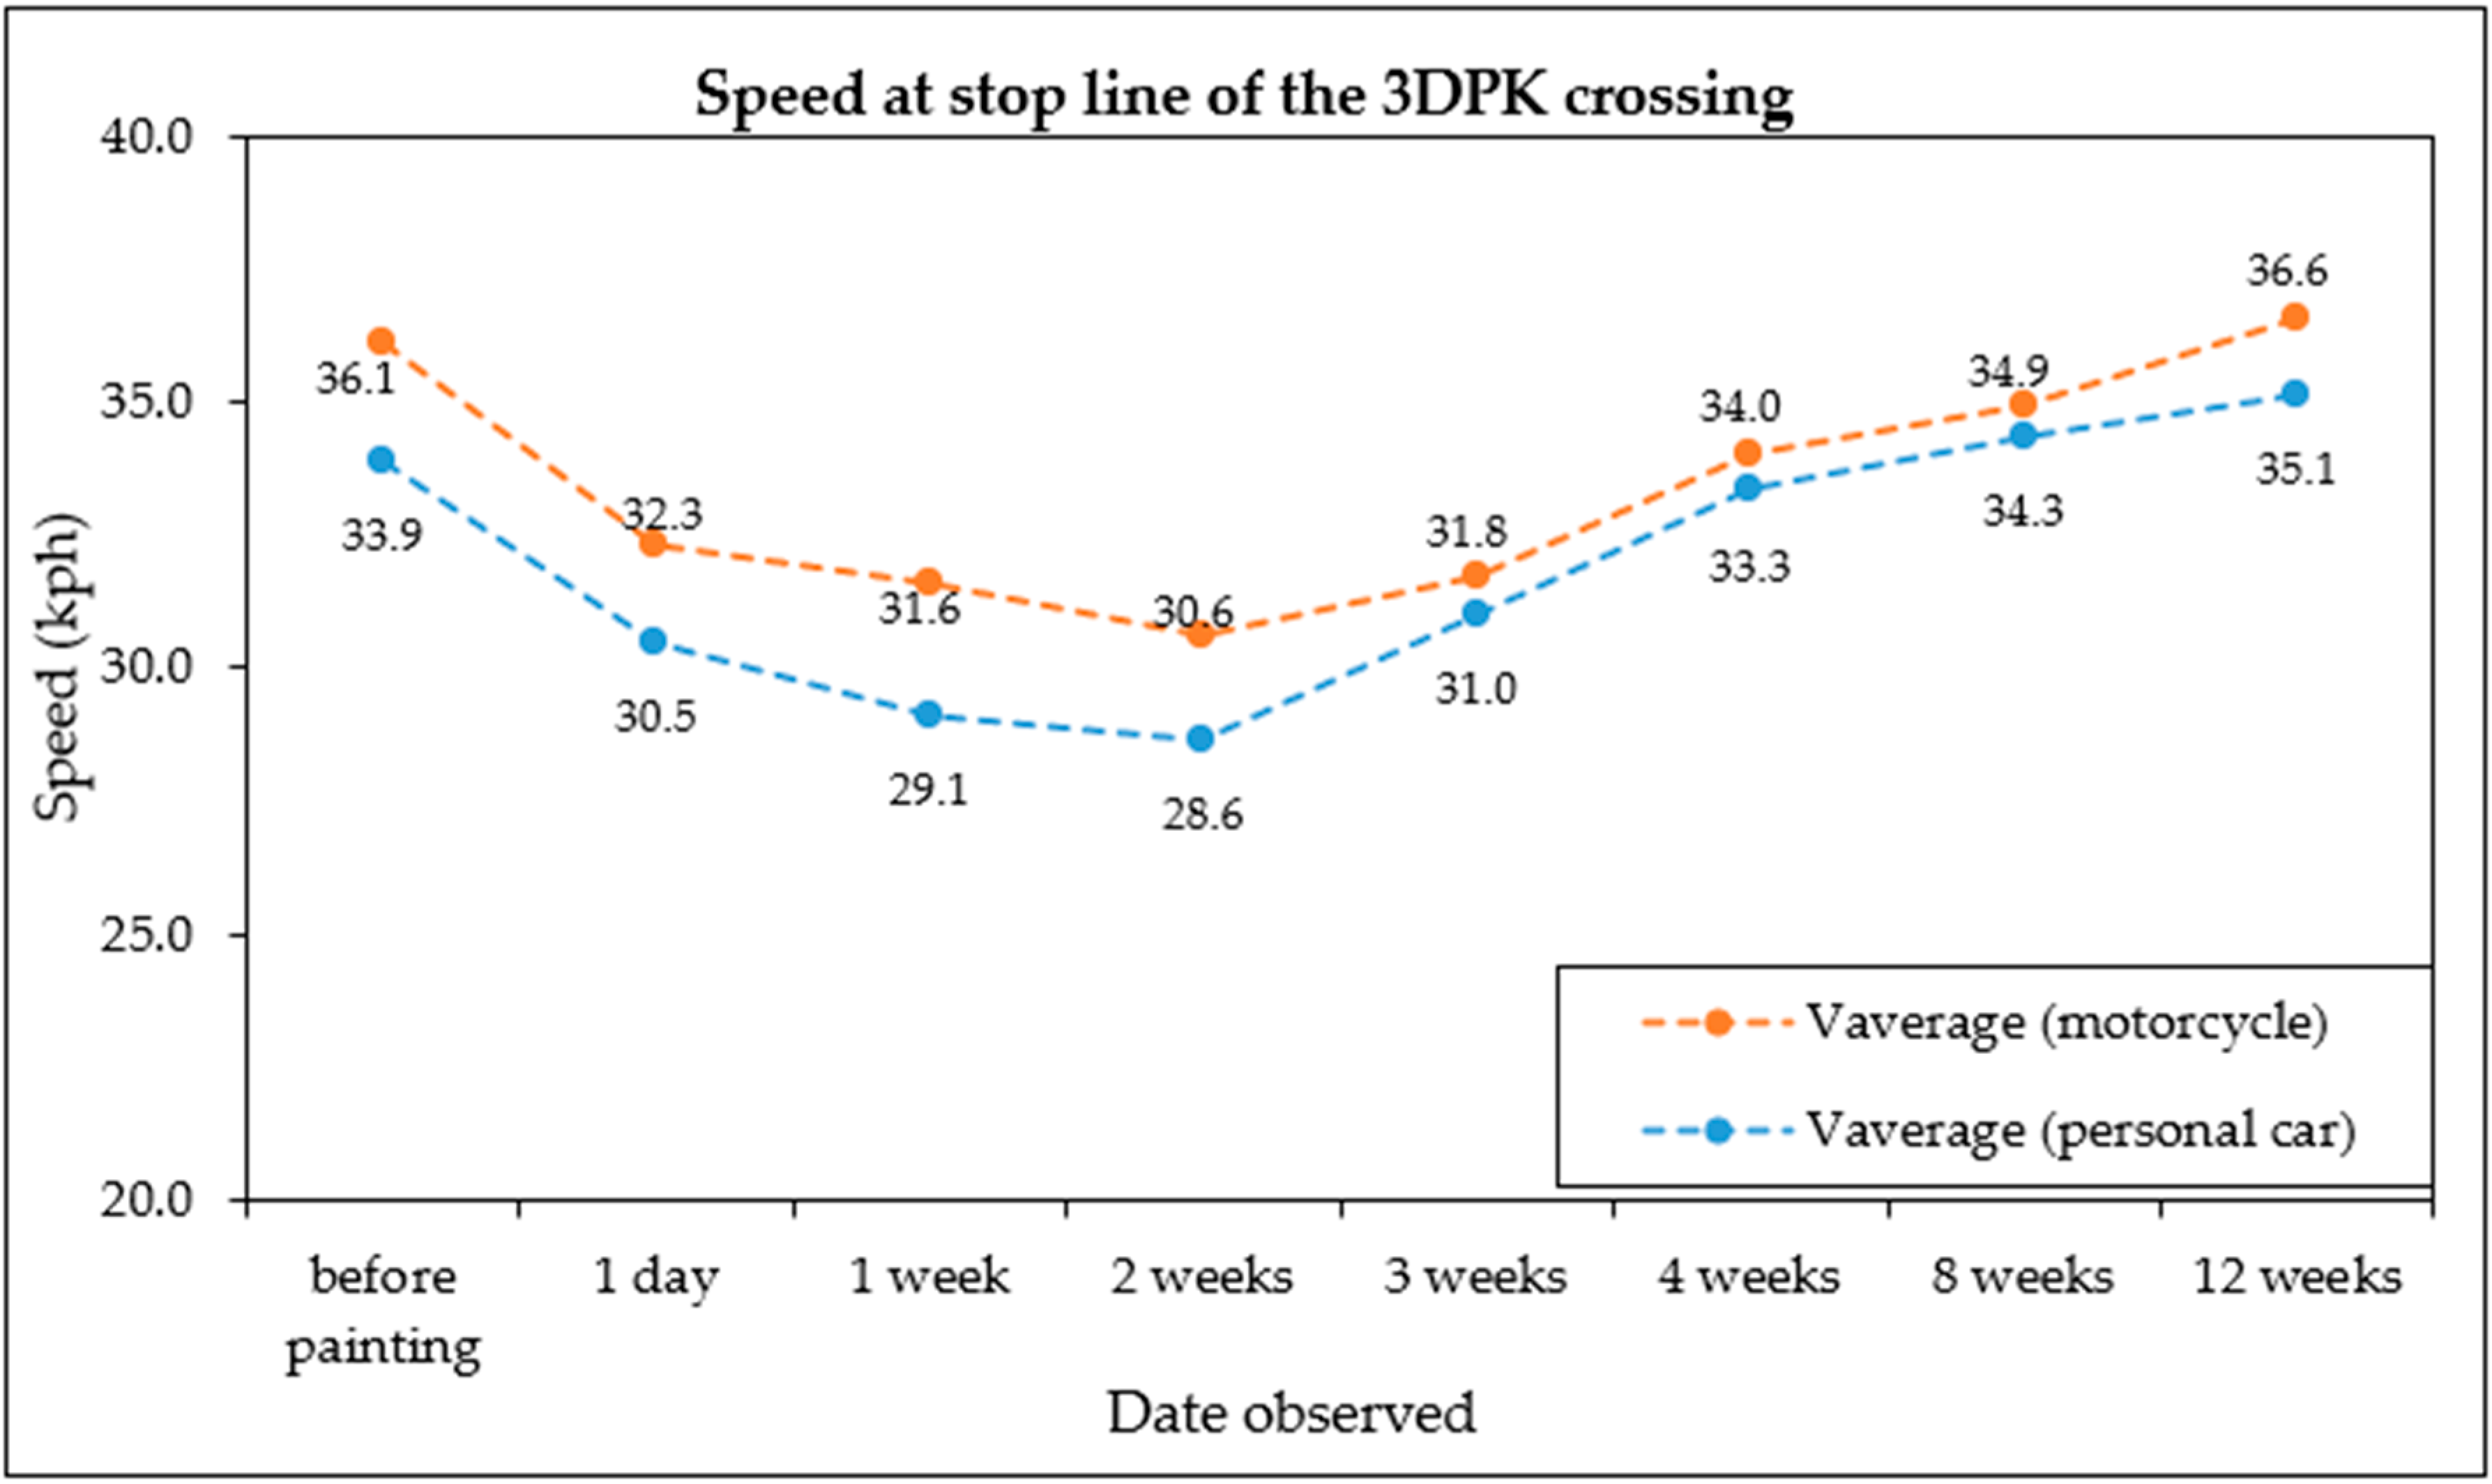
7.1. Pre- and Post-Installation Vehicle Speeds
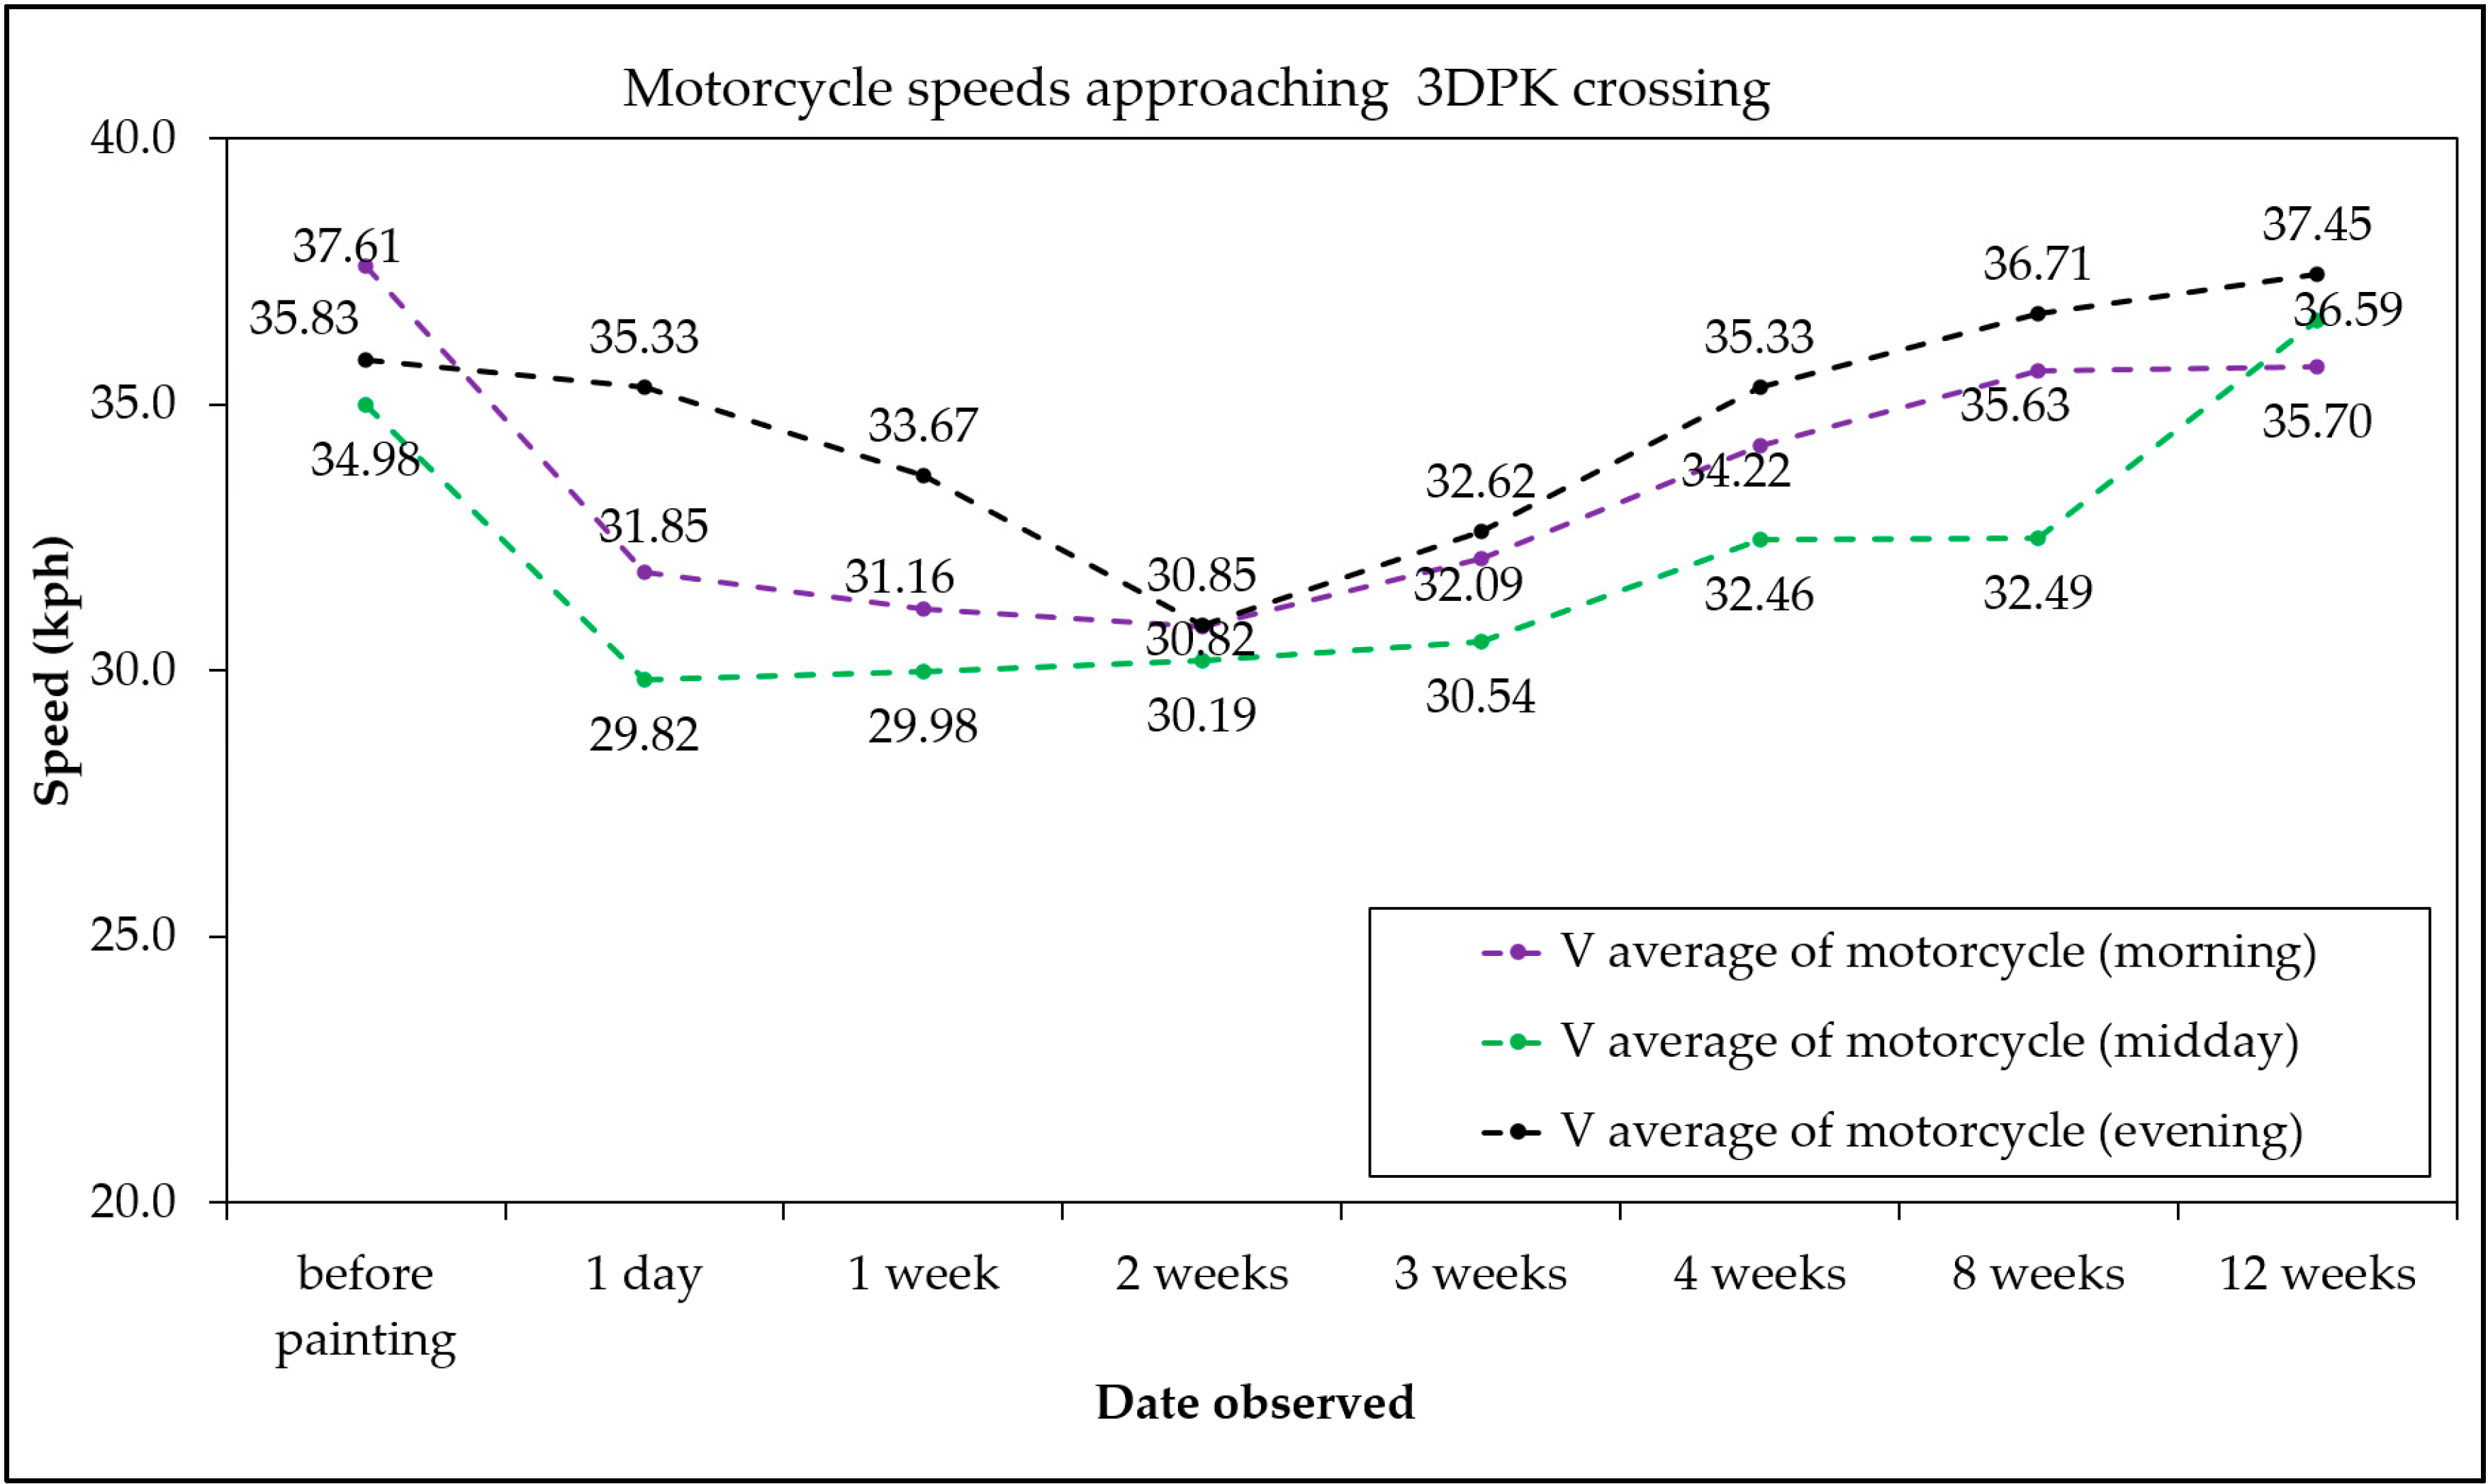
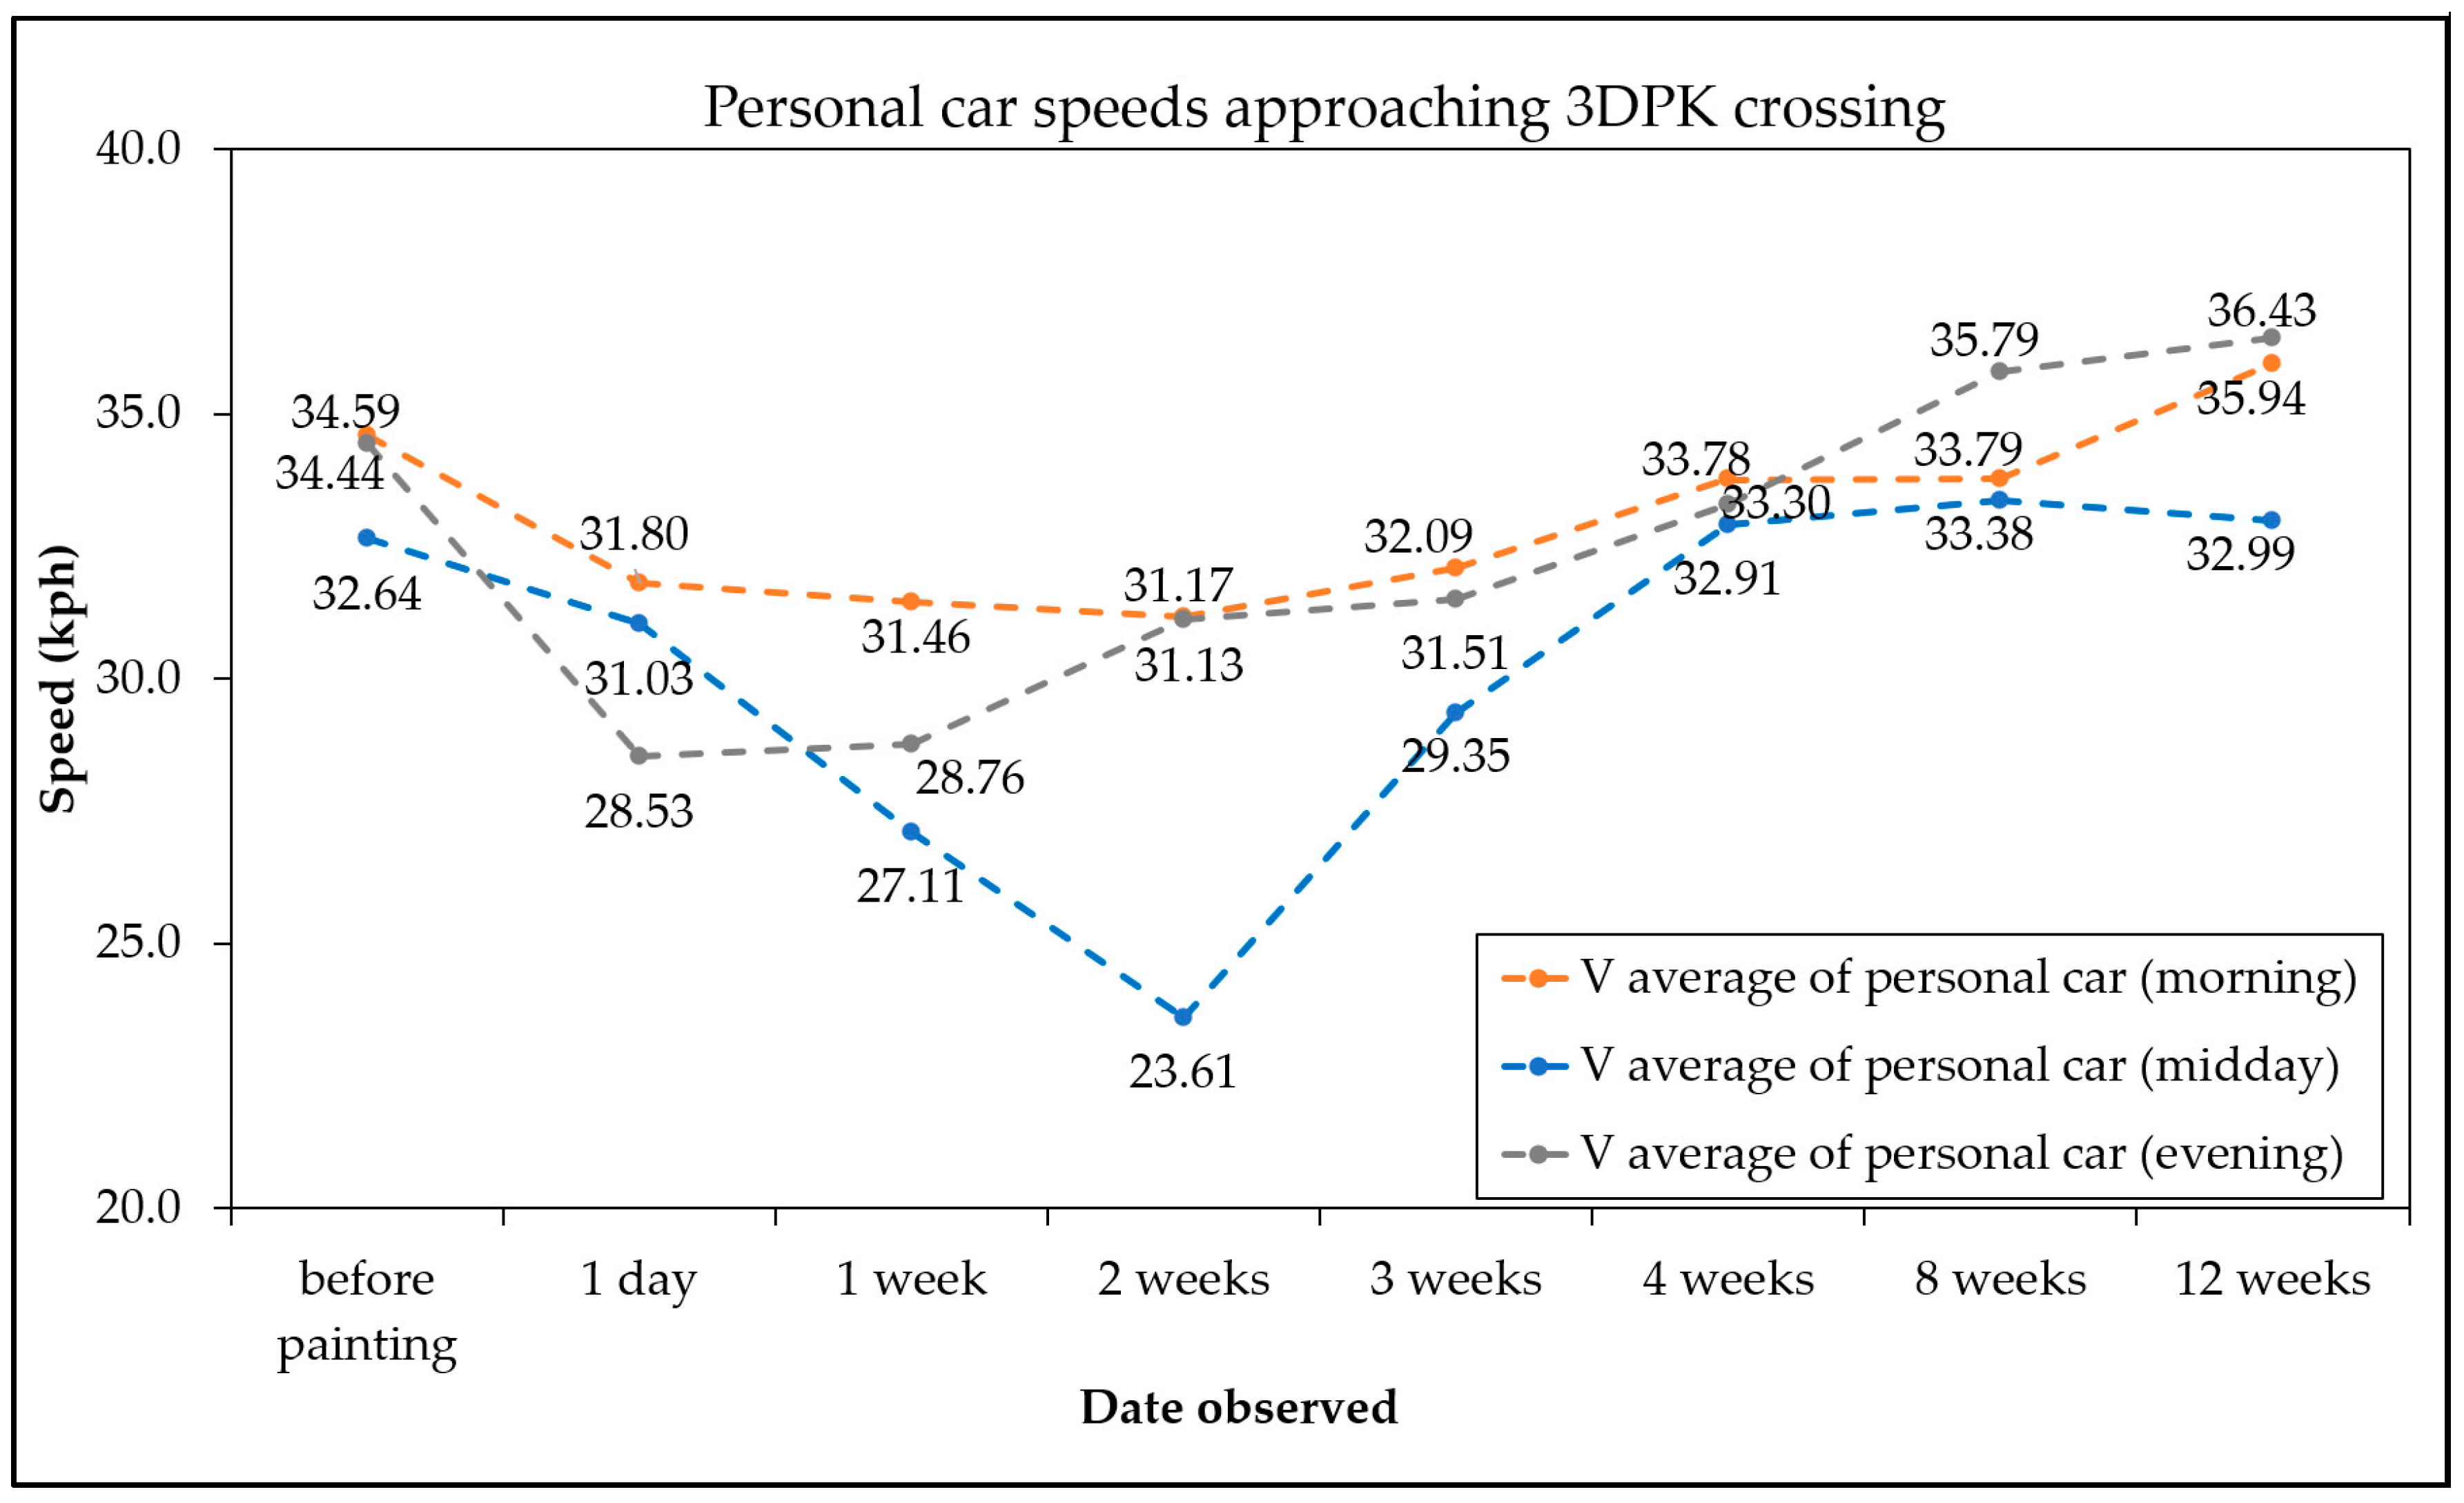
7.2. Vehicle Speed by the Time of Day
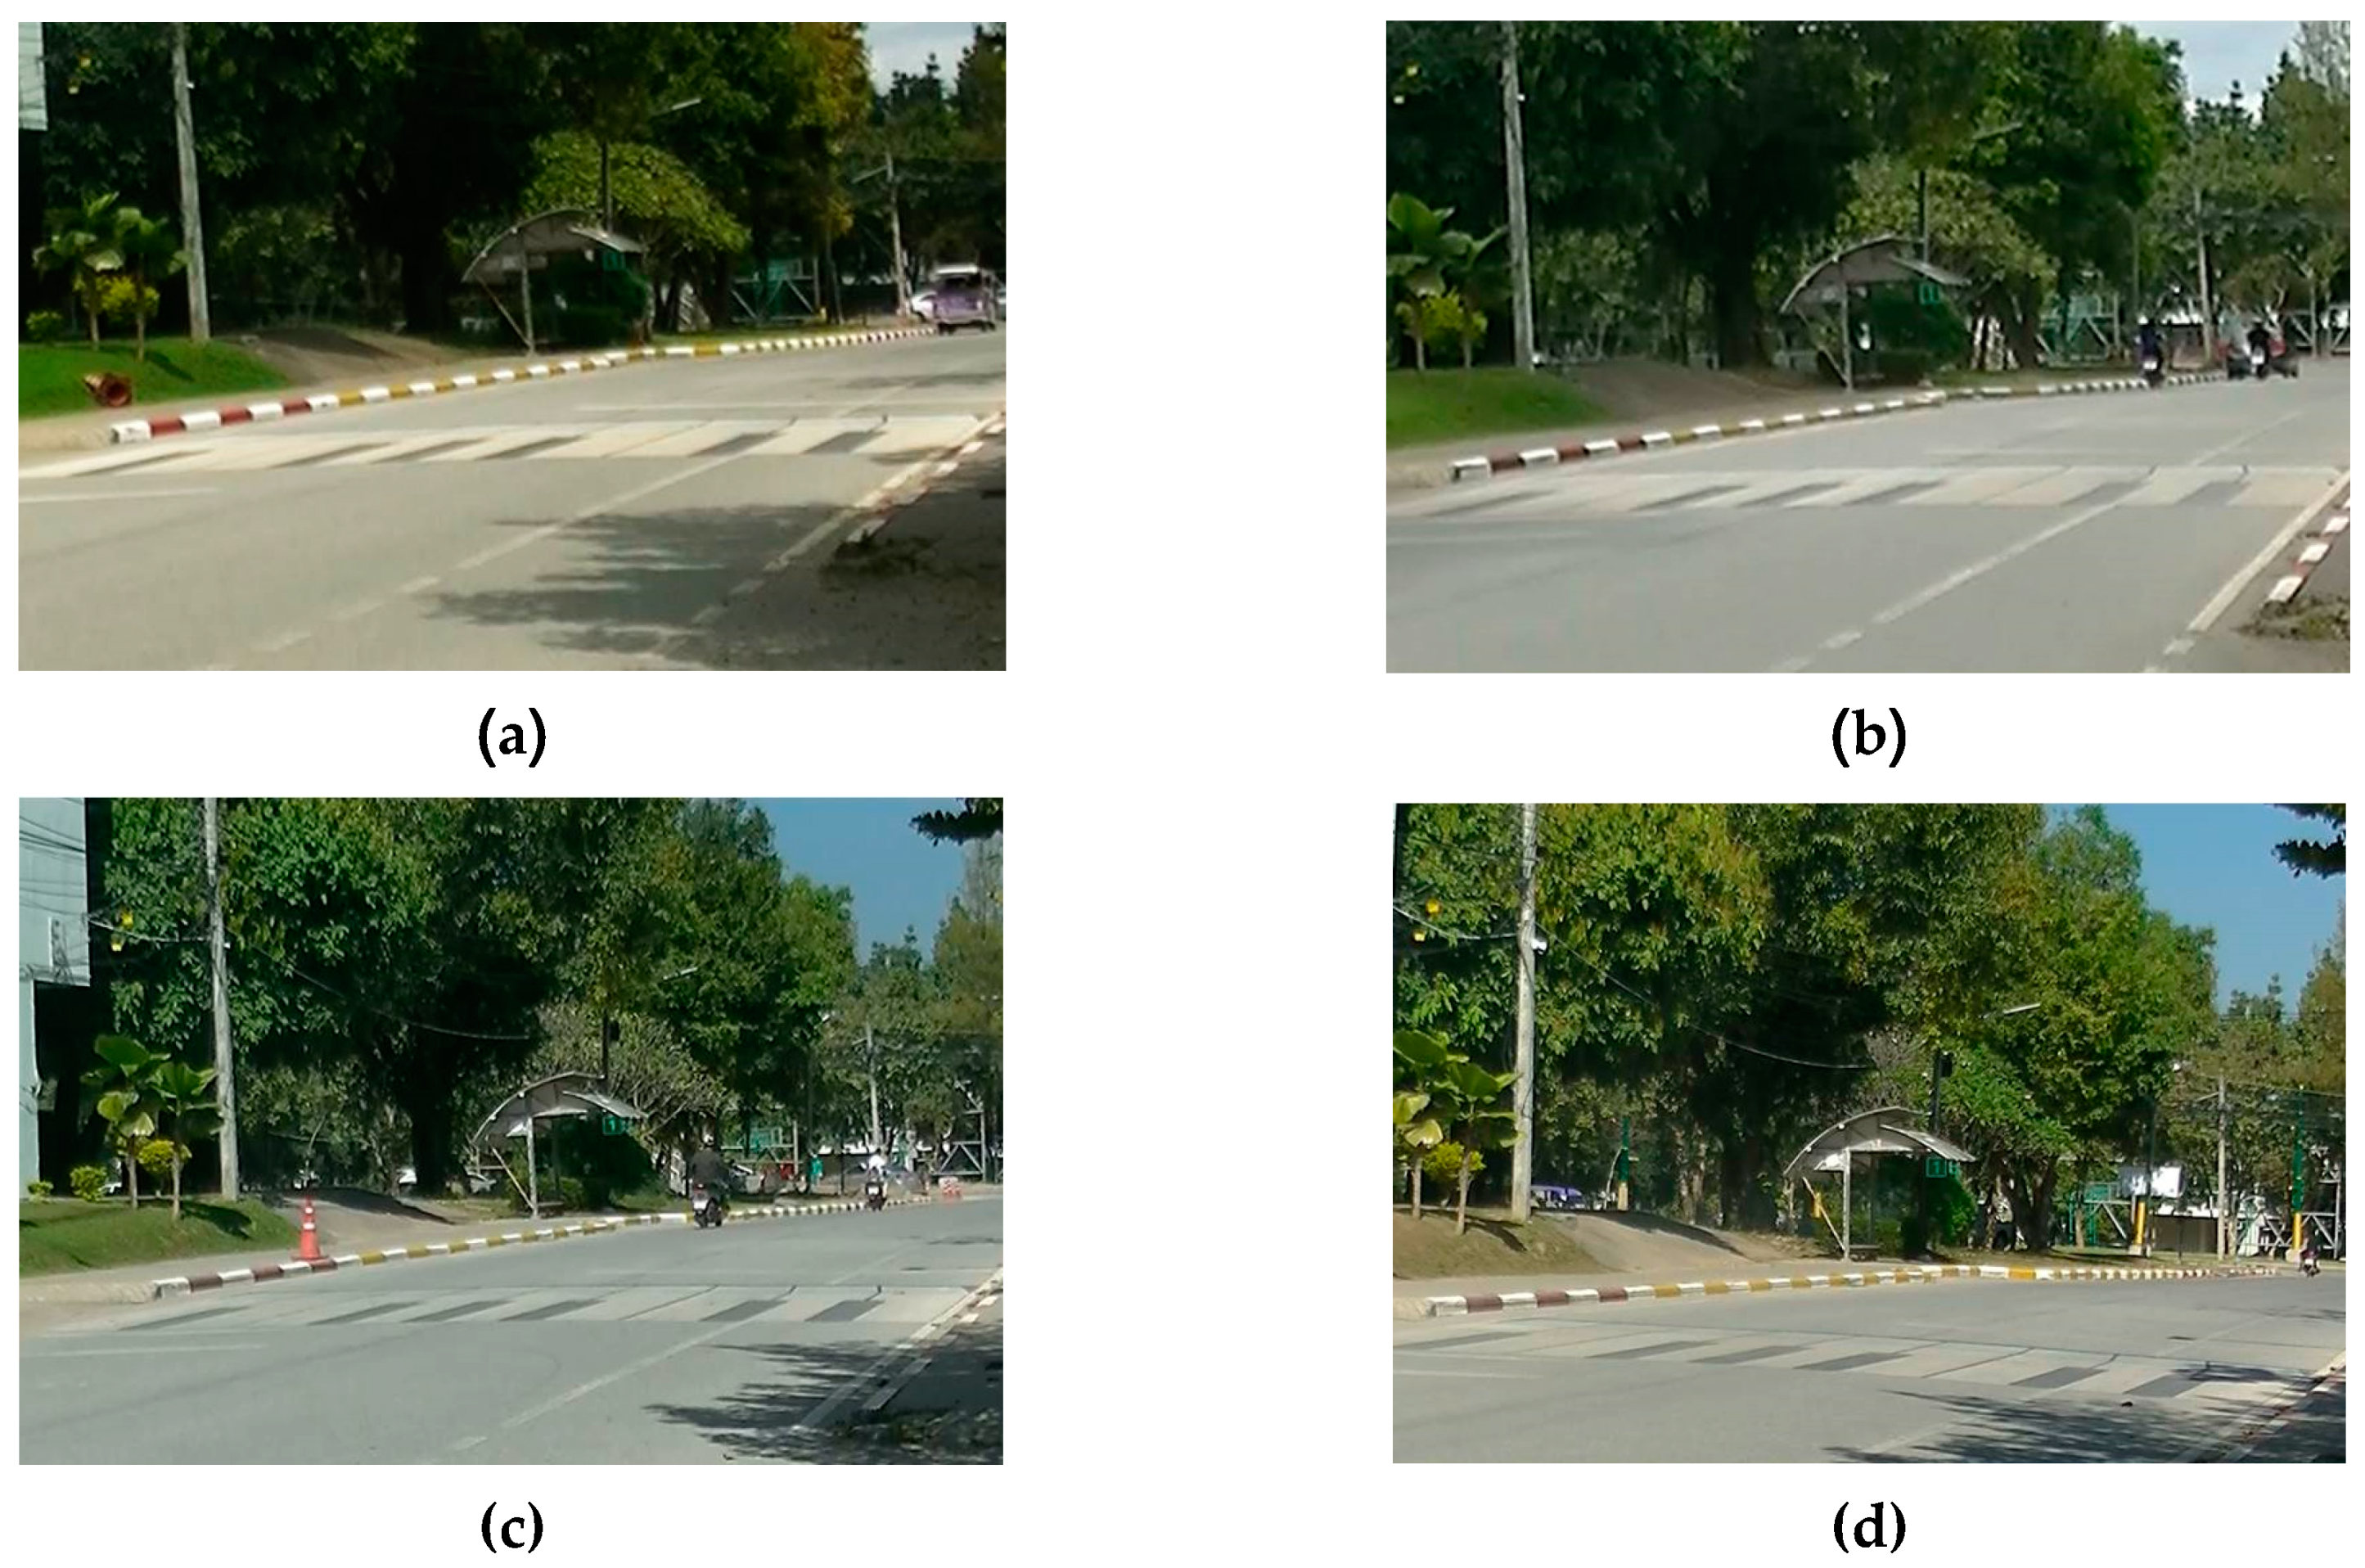
7.3. Perception of 3DPK Crossing after Faded Paint
8. Conclusions
Author Contributions
Funding
Acknowledgments
Conflicts of Interest
References
- Global Status Report on Road Safety. Available online: https://www.who.int/violence_injury_prevention/road_safety_status/2018/en/ (accessed on 10 August 2020).
- Mako, E.; Szakonyi, P. Evaluation of human behaviour at pedestrian crossings. Transp. Res. Procedia 2016, 14, 2121–2128. [Google Scholar] [CrossRef]
- Bella, F.; Silvestri, M. Effects of safety measures on driver’s speed behavior at pedestrian crossings. Accid. Anal. Prev. 2015, 83, 111–124. [Google Scholar] [CrossRef]
- Hart, J. Driver Behavior on Campus; Robert Morris University: Pittsburgh, PA, USA, 2009. [Google Scholar]
- Bureau of Highway Safety, Department of Highways, Thailand. Traffic Accident on National Highways in 2018. Available online: http://bhs.doh.go.th/download/accident (accessed on 11 August 2020). (In Thai).
- Sołowczuk, A.; Gardas, P. Effect of the Parking Lane Configuration on Vehicle Speeds in Home Zones in Poland. Sustainability 2020, 12, 588. [Google Scholar] [CrossRef]
- Zhang, X.; Xu, J.; Liang, Q.; Ma, F. Modeling Impacts of Speed Reduction on Traffic Efficiency on Expressway Uphill Sections. Sustainability 2020, 12, 587. [Google Scholar] [CrossRef]
- Jägerbrand, A.K.; Johansson, M.; Laike, T. Speed Responses to Speed Humps as Affected by Time of Day and Light Conditions on a Residential Road with Light-Emitting Diode (LED) Road Lighting. Safety 2018, 4, 10. [Google Scholar] [CrossRef]
- Patella, S.M.; Sportiello, S.; Carrese, S.; Bella, F.; Asdrubali, F. The Effect of a LED Lighting Crosswalk on Pedestrian Safety: Some Experimental Results. Safety 2020, 6, 20. [Google Scholar] [CrossRef]
- Noh, B.; No, W.; Lee, J.; Lee, D. Vision-Based Potential Pedestrian Risk Analysis on Unsignalized Crosswalk Using Data Mining Techniques. Appl. Sci. 2020, 10, 1057. [Google Scholar] [CrossRef]
- Amado, H.; Ferreira, S.; Tavares, J.P.; Ribeiro, P.; Freitas, E. Pedestrian—Vehicle Interaction at Unsignalized Crosswalks: A Systematic Review. Sustainability 2020, 12, 2805. [Google Scholar] [CrossRef]
- Niu, S.F.; Liu, Y.J.; Wang, L.; Li, H.Q. Effects of Different Intervention Methods on Novice Drivers’ Speeding. Sustainability 2019, 11, 1168. [Google Scholar] [CrossRef]
- Li, L.; Zhang, D. Merging Vehicles and Lane Speed-Flow Relationship in a Work Zone. Sustainability 2018, 10, 2210. [Google Scholar] [CrossRef]
- Yan, X.; Wang, J.; Wu, J. Effect of In-Vehicle Audio Warning System on Driver’s Speed Control Performance in Transition Zones from Rural Areas to Urban Areas. Int. J. Environ. Res. Public Health 2016, 13, 634. [Google Scholar] [CrossRef] [PubMed]
- Clark, S.; Coughenour, C.; Bumgarner, K.; de la Fuente-Mella, H.; Reynolds, C.; Abelar, J. The Impact of Pedestrian Crossing Flags on Driver Yielding Behavior in Las Vegas, NV. Sustainability 2019, 11, 4741. [Google Scholar] [CrossRef]
- Artists Network, Understanding Linear Perspective Drawing. Available online: https://www.artistsnetwork.com/how-to-draw-perspective/ (accessed on 30 October 2016).
- Hasson, P.; Struve, B.; Chen, C.; Brewer, J.; Doctor, M.; Harrison, K.; Maifield, D.; Matzke, M.; Merritt, G.; Mooney, R. Evolving Geometric Design Decision-Making in the United States. In Proceedings of the U.S. Country Report for the 5th International Symposium on Geometric Design, Vancouver, BC, Canada, 22–24 June 2015. [Google Scholar]
- Rebelo, F.; Cerqueira, D.; Freixinho, I.; Noriega, P. Evaluation of 3d crosswalks design. Adv. Intell. Syst. Comput. 2019, 777, 89–96. [Google Scholar]
- Burlov, V.; Gomazov, F. Method of mathematical justification for using 3D zebra crossing. Transp. Res. Procedia 2018, 36, 95–102. [Google Scholar] [CrossRef]
- Trifunović, A.V.; Čicević, S.J.; Lazarević, D.M.; Dragović, M.S.; Vidović, N.D.; Mošić, M.R.; Otat, O.V. Perception of 3D virtual road markings—Based on estimation of vehicle speed. FME Trans. 2019, 47, 360–369. [Google Scholar] [CrossRef]
- Rahman, M.L.; Moore, A.; Smith, M.; Lieswyn, J.; Mandic, S. A Conceptual Framework for Modelling Safe Walking and Cycling Routes to High Schools. Int. J. Environ. Res. Public Health 2020, 17, 3318. [Google Scholar] [CrossRef] [PubMed]
- Department of Rural Roads. Standard Drawing for Department of Local Administration; Department of Rural Roads: Bangkok, Thailand, 2016; ISBN 978-974-9848-75-3. (In Thai) [Google Scholar]
- Pedpradab, P.; Rudjanakanoknad, J. Eye Height and Reaction Time for Thai Drivers. In Proceedings of the 19th National Convention on Civil Engineering, Khon Kaen, Thailand, 14–16 May 2014. (In Thai). [Google Scholar]
- Department of Highways. Manual of Application for Traffic Control Devices at Crossing in Urban Community and Schools Area; Department of Highways: Bangkok, Thailand, 2011. (In Thai) [Google Scholar]
- Elvik, R. The importance of confounding in observational before-and-after studies of road safety measures. Accid. Anal. Prev. 2002, 34, 631–635. [Google Scholar] [CrossRef]
- Olejnik, K.; Łopuszyński, M.; Nowacki, G.; Zakrzewski, B. Testing of the drivers ability to assess the distance on the road while driving. In International Conference on Reliability and Statistics in Transportation and Communication; Springer: Cham, Switzerland, 2018; pp. 489–499. [Google Scholar]


| Date Observed | Average Speed (kph) (Mean) | S.D. | Z | p-Value |
|---|---|---|---|---|
| before painting | 36.14 | 5.75 | - | - |
| 1 day | 32.33 | 6.14 | 6.606 | 0 |
| 1 week | 31.60 | 6.32 | 5.596 | 0 |
| 2 weeks | 30.62 | 6.00 | 7.654 | 0 |
| 3 weeks | 31.75 | 5.22 | 4.977 | 0 |
| 4 weeks | 34.00 | 5.75 | 1.224 | 0.111 |
| 8 weeks | 34.94 | 8.09 | 0.825 | 0.205 |
| 12 weeks | 36.58 | 8.03 | −0.259 | 0.398 |
| Date Observed | Average Speed (kph) (Mean) | S.D. | Z | p-Value |
|---|---|---|---|---|
| before painting | 33.89 | 4.16 | - | - |
| 1 day | 30.45 | 6.14 | 6.027 | 0 |
| 1 week | 29.11 | 6.32 | 4.882 | 0 |
| 2 weeks | 28.64 | 7.08 | 5.940 | 0 |
| 3 weeks | 30.98 | 7.45 | 2.406 | 0.008 |
| 4 weeks | 33.33 | 4.93 | 1.402 | 0.080 |
| 8 weeks | 34.32 | 7.60 | 0.286 | 0.387 |
| 12 weeks | 35.12 | 9.61 | −0.422 | 0.336 |
| Date Observed | Time | Mean or Average Speed (kph) | S.D. | Z | p-Value |
|---|---|---|---|---|---|
| before painting | morning | 37.61 | 4.10 | ||
| midday | 34.98 | 5.96 | |||
| evening | 35.83 | 3.83 | |||
| 1 day | morning | 31.85 | 4.61 | 5.601 | 0.000 |
| midday | 29.82 | 6.75 | 3.434 | 0.000 | |
| evening | 35.33 | 7.39 | 4.235 | 0.000 | |
| 1 week | morning | 31.16 | 6.37 | 5.114 | 0.000 |
| midday | 29.98 | 6.99 | 3.061 | 0.001 | |
| evening | 33.67 | 4.56 | 2.146 | 0.015 | |
| 2 weeks | morning | 30.82 | 6.13 | 5.527 | 0.000 |
| midday | 30.19 | 7.68 | 2.951 | 0.001 | |
| evening | 30.85 | 5.70 | 4.325 | 0.000 | |
| 3 weeks | morning | 32.09 | 5.15 | 5.034 | 0.000 |
| midday | 30.54 | 4.92 | 3.441 | 0.000 | |
| evening | 32.62 | 6.08 | 2.734 | 0.003 | |
| 4 weeks | morning | 36.22 | 5.65 | 1.194 | 0.116 |
| midday | 34.46 | 3.84 | 0.438 | 0.330 | |
| evening | 35.33 | 6.27 | 1.311 | 0.094 | |
| 8 weeks | morning | 35.63 | 7.23 | 1.428 | 0.076 |
| midday | 32.49 | 8.73 | 1.443 | 0.074 | |
| evening | 36.71 | 7.24 | −0.652 | 0.256 | |
| 12 weeks | morning | 35.70 | 7.90 | 1.289 | 0.098 |
| midday | 36.59 | 7.36 | −1.021 | 0.153 | |
| evening | 34.45 | 7.30 | 0.993 | 0.160 |
| Date Observed | Time | Mean or Average Speed (kph) | S.D. | Z | p-Value |
|---|---|---|---|---|---|
| before painting | morning | 34.59 | 3.73 | ||
| midday | 32.64 | 2.61 | |||
| evening | 34.44 | 4.89 | |||
| 1 day | morning | 31.80 | 6.20 | 2.318 | 0.010 |
| midday | 31.03 | 5.01 | 2.367 | 0.008 | |
| evening | 28.53 | 6.93 | 5.191 | 0.000 | |
| 1 week | morning | 31.46 | 7.40 | 2.270 | 0.011 |
| midday | 27.11 | 4.32 | 7.070 | 0.000 | |
| evening | 28.76 | 5.47 | 5.365 | 0.000 | |
| 2 weeks | morning | 23.61 | 8.03 | 7.443 | 0.000 |
| midday | 31.17 | 5.62 | 1.953 | 0.025 | |
| evening | 31.13 | 5.20 | 2.723 | 0.003 | |
| 3 weeks | morning | 32.09 | 5.59 | 2.233 | 0.012 |
| midday | 29.35 | 5.22 | 4.082 | 0.000 | |
| evening | 41.51 | 7.99 | −3.308 | 0.000 | |
| 4 weeks | morning | 33.78 | 5.39 | 0.746 | 0.227 |
| midday | 32.91 | 5.59 | 0.130 | 0.448 | |
| evening | 33.30 | 5.25 | 1.447 | 0.173 | |
| 8 weeks | morning | 33.79 | 7.61 | 0.567 | 0.258 |
| midday | 33.38 | 8.37 | 0.543 | 0.293 | |
| evening | 35.79 | 5.15 | −0.627 | 0.265 | |
| 12 weeks | morning | 35.94 | 10.70 | −0.714 | 0.237 |
| midday | 32.99 | 8.15 | 0.843 | 0.199 | |
| evening | 36.43 | 7.95 | −0.595 | 0.275 |
© 2020 by the authors. Licensee MDPI, Basel, Switzerland. This article is an open access article distributed under the terms and conditions of the Creative Commons Attribution (CC BY) license (http://creativecommons.org/licenses/by/4.0/).
Share and Cite
Pichayapan, P.; Kaewmoracharoen, M.; Peansara, T.; Nanthavisit, P. Urban School Area Road Safety Improvement and Assessment with a 3D Piano-Keyboard-Styled Pedestrian Crossing Approach: A Case Study of Chiang Mai University Demonstration School. Sustainability 2020, 12, 6464. https://doi.org/10.3390/su12166464
Pichayapan P, Kaewmoracharoen M, Peansara T, Nanthavisit P. Urban School Area Road Safety Improvement and Assessment with a 3D Piano-Keyboard-Styled Pedestrian Crossing Approach: A Case Study of Chiang Mai University Demonstration School. Sustainability. 2020; 12(16):6464. https://doi.org/10.3390/su12166464
Chicago/Turabian StylePichayapan, Preda, Manop Kaewmoracharoen, Thanatchaporn Peansara, and Patcharapan Nanthavisit. 2020. "Urban School Area Road Safety Improvement and Assessment with a 3D Piano-Keyboard-Styled Pedestrian Crossing Approach: A Case Study of Chiang Mai University Demonstration School" Sustainability 12, no. 16: 6464. https://doi.org/10.3390/su12166464
APA StylePichayapan, P., Kaewmoracharoen, M., Peansara, T., & Nanthavisit, P. (2020). Urban School Area Road Safety Improvement and Assessment with a 3D Piano-Keyboard-Styled Pedestrian Crossing Approach: A Case Study of Chiang Mai University Demonstration School. Sustainability, 12(16), 6464. https://doi.org/10.3390/su12166464