Article

Exploring the Relationship between Urbanization and Ecological Environment Using Remote Sensing Images and Statistical Data: A Case Study in the Yangtze River Delta, China

1
State Key Laboratory of Information Engineering in Surveying, Mapping and Remote Sensing, Wuhan University, Wuhan 430079, China
2
School of Remote Sensing and Information Engineering, Wuhan University, Wuhan 430079, China
3
Department of Geomatics, Istanbul Technical University, 36626 Istanbul, Turkey
*
Author to whom correspondence should be addressed.
These authors contributed equally to this work.
Sustainability 2020, 12(14), 5620; https://doi.org/10.3390/su12145620
Submission received: 7 June 2020 / Revised: 4 July 2020 / Accepted: 9 July 2020 / Published: 13 July 2020
(This article belongs to the Section Sustainable Urban and Rural Development)

Abstract

:
With the rapid urban development in China, urbanization has brought more and more pressure on the ecological environment. As one of the most dynamic, open, and innovative regions in China, the eco-environmental issues in the Yangtze River Delta have attracted much attention. This paper takes the central region of the Yangtze River Delta as the research object, through building the index system of urbanization and ecological environment based on statistical data and two new indicators (fraction of vegetation coverage and surface urban heat island intensity) extracted from remote sensing images, uses the Entropy-TOPSIS method to complete the comprehensive assessment, and then analyzes the coupling coordination degree between the urbanization and ecological environment and main obstacle factors. The results showed that the coupling coordination degree in the study region generally shows an upward trend from 0.604 in 2008 to 0.753 in 2017, generally changing from an imbalanced state towards a basically balanced state. However, regional imbalance of urbanization and ecological environment always exists, which is mainly affected by social urbanization, economic urbanization, landscape urbanization, pollution loading and resource consumption. Finally, on the basis of the obstacle factor analysis, some specific suggestions for promoting the coordinated development of the Yangtze River Delta are put forward.

1. Introduction

In the 21st century, the world is in a period of rapid urbanization. The rapid development of urbanization has profoundly affected various countries and regions, especially developing countries [1]. In the past forty years of reform and opening up, China has experienced a process of large-scale rapid urbanization and made remarkable achievements. The urbanization rate in China has increased from 17.9% in 1978 to 60.6% in 2019, with an average annual growth rate of 1.04% [2]. However, rapid urbanization has caused many serious problems, especially eco-environmental problems such as air pollution [3,4], water resource utilization [5], energy consumption [6], land use/land cover change [7], carbon emissions [8] and other prominent problems, which in turn restrict the development of urbanization [9,10,11].
Remote sensing technology can quickly, repeatedly, and dynamically obtain various information in large areas, thereby providing technical support and an accuracy guarantee for large-scale, dynamic, and periodic ecological environment monitoring. Nowadays, satellite remote sensing technology is developing in the direction of high precision, multi-spectral and high resolution. The application of remote sensing has transitioned from single data to multi-temporal and multi-source fusion and from static analysis to dynamic monitoring, which just meets the requirements of monitoring of ecological environment. In recent decades, a lot of research and application work has been carried out, providing important support for eco-environmental protection, mainly including natural disasters monitoring [12], water environment monitoring [13], urban expansion [14], urban green space survey [15] and urban heat island effect [16].
The Yangtze River Delta is one of the regions with the most rapid urban development in China, which has outstanding regional advantages, excellent natural endowment, and strong comprehensive economic strength. However, with the rapid urban development, the ecological environment of the Yangtze River Delta is seriously threatened. There are still large differences in economic and social conditions, natural resources, and climatic conditions among provinces and cities, which are with different abilities and levels of pollution prevention and control. The outline of the integrated regional development of the Yangtze River Delta issued in 2019 clarifies the requirements for the joint protection of the ecological environment. Relevant provinces and cities have formulated operable implementation plans, and taken eco-environmental protection as one of the key contents, providing reliable support for the overall coordination and ecological environmental protection in the Yangtze River Delta region. Nowadays, the Yangtze River Delta has become a hot spot for studying urbanization and ecological environment [17,18,19]. Many scholars have carried out relevant research about coordinated development in the region, but most of them are based on statistical data. However, large-scale multi-temporal ecological environment monitoring based on remote sensing technology, can provide more abundant information support for related studies.
The relationship between urbanization and ecological environment is a complex coupling and forced relation. Coupling was originally a physics concept, which refers to the phenomenon that two or more systems interact with each other through a variety of interactions and even combination [20,21]. Various methods are applied to study the coupling relationship between urbanization and ecological environment, such as Grey relation analysis [22,23], Environmental Kuznets Curve [24,25], Environmental Computable General Equilibrium [26], Ordinary Least Squares [27], Geographically Weighted Regression [28], Spatial analysis [29] and Coupling Coordination Degree (CCD) [30,31,32,33]. The coupling analysis of urbanization and the ecological environment in many years can provide a more comprehensive understanding of the composite systems of urbanization and eco-environment [33]. Quantitative analysis of the coupling coordination degree between urbanization and ecological environment is of great significance for urban sustainable development.
This paper aims to explore the relationship between urbanization and ecological environment in the central region of the Yangtze River Delta from 2008 to 2017. In this paper, a comprehensive index system is established. Based on the Google Earth Engine cloud platform, the relevant indicators are extracted from remote sensing images, and then evaluation for two subsystems of urbanization and ecological environment are completed by using the Entropy-TOPSIS method. The coupling coordination degree model and obstacle degree model are used to discuss and analyze the relationship between urbanization and ecological environment.
The rest of this article is organized as follows. The second part describes the study area and data. The third part focuses on the overall workflow. The fourth part introduces the indicators calculation based on remote sensing images through Google Earth Engine cloud platform. The fifth part introduces the construction of an index system. The sixth part explains the methods. The seventh part presents the results. The eighth part provides the discussion. The last part contains the conclusions and suggestions.

2. Study Area and Data

2.1. Study Area

According to the outline of the integrated regional development of the Yangtze River Delta in 2019, the scope includes the whole areas of Shanghai, Jiangsu Province, Zhejiang Province and Anhui Province [34]. As of the end of 2019, the Yangtze River Delta covers a total area of 358,000 km2, with a total GDP of 23.73 trillion Yuan and a population of 227 million, accounting for 3.72%, 16.21% and 23.95% of those of the country respectively [35,36,37,38]. As one of China’s most economically active, open and innovative regions, the Yangtze River Delta boasts strategic significance in the nation’s modernization and further opening-up. This region will develop in tandem with the Belt and Road, the Beijing-Tianjin-Hebei region, the Yangtze River Economic Belt and the Guangdong-Hong Kong-Macao Greater Bay Area, which will improve the overall layout of China’s reform and opening-up.
The study area in this article is the central region of the Yangtze River Delta (the yellow area in Figure 1), which is the core area of the Yangtze River Delta, and extends from 27°8′36″ to 34°28′4″ N in latitude, and from 115°45′21″ to 122°50′4″ E in longitude, with a total area of 225,000 km2. It contains 27 cities, namely Shanghai, Nanjing, Wuxi, Changzhou, Suzhou, Nantong, Yangzhou, Zhenjiang, Yancheng, Taizhou(js) (belongs to Jiangsu Province), Hangzhou, Ningbo, Wenzhou, Huzhou, Jiaxing, Shaoxing, Jinhua, Zhoushan, Taizhou(zj) (belongs to Zhejiang Province), Hefei, Wuhu, Maanshan, Tongling, Anqing, Chuzhou, Chizhou and Xuancheng [34].

2.2. Study Data

The study data mainly includes remote sensing images, statistical data and vector data (seen in Table 1). A variety of remote sensing data is free and open access on Google Earth Engine cloud platform (https://earthengine.google.com). This paper uses Landsat data in the summer of 2008–2017 (https://www.usgs.gov/land-resources/nli/landsat). In order to ensure the validity and comparability of the extraction results of Landsat data, the processes of data filtering, atmospheric calibration, cloud masking and image mosaic have been carried out on the cloud platform. The statistical data comes from the statistical yearbooks from 2008 to 2017. The vector data includes administrative division data and urban built-up area data [39], which is used for data analysis and result display.

3. Overall Workflow

In order to explore the relationship between urbanization and ecological environment in the central region of the Yangtze River Delta, we collected relevant data from 2008 to 2017. The research framework of this paper has been determined, as shown in Figure 2. The workflow includes five main steps:
Step 1
Build two subsystems for urbanization and ecological environment. The corresponding indicators are selected from four aspects respectively, to ensure the scientificity, effectiveness and operability of the index system.
Step 2
Indicator calculation based on remote sensing images. This part is mainly based on Google Earth Engine cloud platform. Using Landsat images in the summer of 2008–2017, after data filtering, cloud masking, radiometric calibration, image mosaic and then calculation for normalized difference vegetation index (NDVI) and land surface temperature (LST), the results of two indicators (fraction of vegetation coverage and surface urban heat island intensity) are obtained based on spatial statistics using vector data.
Step 3
According to the selected indicators, collect other relevant data from statistical yearbooks.
Step 4
In order to avoid the influence caused by the inconsistency of the units and magnitudes of the original data, data rearrangement and normalization are necessary for the next operations, and then the evaluation for urbanization and eco-environment are performed based on the Entropy-TOPSIS method.
Step 5
Compute the coupling coordination degree and obstacle degree, explore the relationship and change trend between urbanization and ecological environment, analyze the main hindering factors of the two subsystems in the central region of the Yangtze River Delta, and then give several suggestions.

4. Indicator Calculation Based on Remote Sensing Images

4.1. Fraction of Vegetation Coverage

Fraction of vegetation coverage (FVC) is an important indicator for measuring the status of vegetation cover, an important basic datum for describing the ecosystems, and an important symbol of regional environmental changes, which is of great significance to studying hydrology, ecology, and regional environment [40].
The empirical model, the vegetation index and the pixel unmixing method are common methods of remote sensing estimation for FVC [41]. The dimidiate pixel model is one of the widely used models of the pixel unmixing method, which assumes that each pixel can be divided into two parts: pure vegetation and pure soil. The spectral information obtained in this way can be regarded as the sum of the contribution information of vegetation and soil. The formula of FVC is as follows:
NDVI = ρ N I R ρ R E D ρ N I R + ρ R E D
F V C = N D V I N D V I s o i l N D V I v e g N D V I s o i l
where, ρ N I R and ρ R E D represent the reflectivity of the corresponding bands. N D V I s o i l is the NDVI value of the bare soil or no vegetation coverage, and N D V I v e g represents the NDVI value of the pixel completely covered by the vegetation.
According to the cumulative percentages, 5–95% is selected as the confidence interval; the region with the cumulative percentage less than 5% is approximately without vegetation coverage, and the region with more than 95% is approximately covered with pure vegetation. The NDVI values corresponding to the two percentages are taken as the NDVI values of the pixels of pure non-vegetation coverage and pure vegetation coverage. Due to the cumulative percentages of NDVI values in the central region of the Yangtze River Delta from 2008 to 2017, the average values of N D V I s o i l and N D V I v e g are determined to be −0.0512 and 0.8249 respectively.

4.2. Surface Urban Heat Island Intensity

A significant phenomenon in urban climate is that the temperature is different between the city and the surrounding area, which is called urban heat island effect, directly caused by rapid urbanization [42]. The land surface temperature is a key factor in surface physics processes at regional and global scales, and also an important parameter for studying the exchange of materials and energy between the surface and the atmosphere. Many applications, such as urban heat island effect, drought, forest fire, and regional climate models, require obtaining the land surface temperature. The surface urban heat island intensity (SUHI) refers to urban–suburban land surface temperature difference, which can be used to describe the heat island effect based on LST using remote sensing techniques [16].
The formula of SUHI is as follows:
S U H I = L S T u r b a n L S T r u r a l
Due to the requirement of LST retrieval based on different kinds of Landsat images, it is more suitable to choose a universal single-channel method. This method was proposed by Jiménez-Muñoz and Sobrino in 2003 and improved in 2009 [43]. For the case of only one thermal band, the specific formula of LST retrieval is as follows:
L S T = γ [ 1 ε ( ψ 1 L s e n o r + ψ 2 ) + ψ 3 ] + δ
where, L s e n is the sensor’s spectral radiance; ε is the land surface emissivity; ψ 1 , ψ 2 and ψ 3 are atmospheric function parameters; γ and δ are parameters of Planck’s law.
The NDVI-based emissivity method [44] is selected to estimate LSE ( ε ):
ε = { ε s ε s + ( ε v ε s ) P V           ε v N D V I < N D V I s o i l N D V I s o i l N D V I N D V I v e g N D V I > N D V I v e g
where, the formula of P V is as follows [45]:
P V = ( N D V I N D V I s o i l N D V I v e g N D V I s o i l ) 2
When the pixel is bare land, 0 ≤ NDVI ≤ 0.2, ε s = 0.97; when the pixel is pure vegetation, NDVI ≥ 0.6, ε v = 0.985.
Atmospheric functional parameters describe the state of the atmosphere with regards to transmissivity, upwelling, and downwelling radiation, and are approximated using a quadratic polynomial fit and atmospheric water vapor content (ω):
[ ψ 1 ψ 2 ψ 3 ] = [ c 11 c 12 c 13 c 21 c 22 c 23 c 31 c 32 c 33 ] [ ω 2 ω 1 ]
where, c i j is the atmospheric function coefficient of the sensor.
γ = T s e n o r 2 b γ L s e n o r
δ = T s e n o r T s e n o r 2 b γ
where, b γ is a sensor-specific constant taking a value of 1256 K, 1277 K, or 1324 K for TM, ETM+ and TIRS respectively. The brightness temperature T s e n o r corresponding to the radiance on the star is approximately calculated according to Planck’s law as follows:
T s e n o r = K 2 ln ( K 1 L s e n o r + 1 )
where, K1 and K2 are the Planck constants, and the formula of the radiance value L s e n o r received by the altitude sensor of satellite is as follows:
L s e n o r = G a i n × D N + O f f s e t
where, DN is the gray value of the image pixel.

5. Establishment of Index System

According to the principles of scientificity, systematization, representativeness and operability, the index system for the urbanization and the eco-environment have been established. The selection of indicators comes from the following aspects:
(i)
The 2030 Agenda for Sustainable Development adopted by General Assembly of the United Nations in 2015 is a global, development-oriented agenda, which points out the direction and blueprint for the development of countries and international development cooperation in the next 15 years. A set of index systems for sustainable development in the 2030 Agenda has also been established, which clarifies the path for countries to achieve the goals of sustainable development [46]. The 2030 agenda for sustainable development mainly focuses on the sustainable development of three major systems of economy, society and environment, including four major areas of economic governance, social governance, environmental governance and global governance. The 2030 Agenda for Sustainable Development includes 17 goals and 169 specific goals. Specifically, the main goals of economic governance include the goals 8, 9 and 12; the major goals of social governance involve the goals 1–5, 10, 11 and 16; the chief goals of environmental governance contain the goals 6, 7, 13, 14 and 15; and the principal goals of global governance consist of the goal 17.
In this paper, the 18 selected indicators are directly related to the 11 goals of the 2030 Agenda for Sustainable Development. With regard to economic governance, U6 reflects the nation’s macroeconomic operation, U2 and U7 reveal the development of the tertiary industry, which are associated with goal 8; U4 reveals the situation of urban infrastructure, which is related to goal 9; and E5, E6, and E9 reveal pollutant discharge in industrial production activities and reuse of industrial solid waste, which are associated with goal 12.
With respect to social governance, U9 and U10 are chosen to reflect the people’s consumption level and quality of life, which are related to goal 1; U11 is an important content of medical resources, and reflects the distribution of local beds and the accessibility of medical and health services, which is connected with goal 3; U9 reflects the people’s income level which is associated with goal 10; and U4, E2, E10 and E11 describe the basic situation of urban infrastructure, greening and the environment, which are related to goal 11.
As regards to environmental governance, E4, E7 and E10 reflect the water consumption, production and the treatment of urban sewage in the city, which are related to goal 6; E5, E6 and E8 reveal industrial pollutant emissions and energy consumption, which have similar relations to goal 7; E3 is a key factor in surface physics processes at regional and global scales, and also an important parameter for studying the exchange of materials and energy between the surface and the atmosphere, which is related with goal 13; and E1 is an important indicator for measuring the status of vegetation cover, an important basic datum for describing ecosystems, and one of the important symbols of environmental changes in regional ecosystems, which is associated with goal 15.
(ii)
“Technical Criterion for Ecosystem Status Evaluation” promulgated in 2015 by the former Ministry of Environmental Protection of the People’s Republic of China [47], which stipulates the index systems for evaluation on the ecological environment and calculation methods of the indicators, such as E1, E2, E3, E5, E6, E10 and E11.
(iii)
On the basis of literature review and analysis [4,5,6,20,23,25,29,31,32,33], indicators adopted by high frequency are selected, such as U1, U3, U4, U5, U6, U7, U10, E8 and E9.
(iv)
The aspects are related to national economy and people’s livelihood [2,35,36,37,38], such as U6, U7, U8, U9 and U10.
(v)
Related contents can be retrieved by remote sensing technology [16,40,42], such as E1 and E3.
Therefore, 11 representative indicators of urbanization and 11 typical indicators of ecological environment are selected to build the two subsystems. The index systems for urbanization and ecological environment are shown in Table 2.

6. Methods

6.1. Data Preprocessing

Due to the three-dimensional time-series data used in this article, eleven indicators of 27 cities in 10 years in each subsystem cannot be used directly to determine the weights through the entropy weighting method. Therefore, the process of data rearrangement converted from the three-dimensional data to the two-dimensional panel data is necessary.
The formula of data rearrangement is as follows:
X ( k , j ) = x i , j , t
where, x i , j , t denotes the original value of the indicator j of city i in year t, t ∈ [2008, 2017], k = 27 × ( 2017 t ) + i .
Due to differences in units and years, the process of data normalization is also required. The Min-Max normalization method (MMN) will be used to deal with the rearranged data. In order to be able to make an effective comparison of the indicators from different years in multiple cities, based on the traditional MMN method and comparison of all values of indicators of each city in all years, the maximum value and minimum value are calculated for data normalization. The specific steps of data normalization are as follows:
When X k , j is a positive indicator,
y k , j = X k , j min { X j } m a x { X j } min { X j }
When X k , j is a negative indicator,
y k , j = m a x { X j } X k , j m a x { X j } min { X j }
X k , j represents the value of the rearranged data, and max { X j }, min { X j } represent the maximum and minimum values of the indicator j of all cities for all years.

6.2. Entropy-TOPSIS Evaluation Model

The Entropy-TOPSIS evaluation model uses the information entropy to gain the weights of each indicator, and then uses the TOPSIS model (Technique for Order Preference by Similarity to an Ideal Solution) to obtain the evaluation value [6,48]. The basic principle of TOPSIS is to find out the optimal solution and the worst solution after data normalization, calculate the distance A between the evaluation object and the optimal solution and the distance B between the evaluation object and the worst solution, and then get the result according to the comparison of the two distances. If the distance A is the maximum and the distance B is the minimum, the result is optimal, otherwise it is not ideal.
The specific steps are as follows:
(1)
Establish weighted assessment matrix V = ( v k , j ) m × n :
v k , j = y k , j w i     ( k = 1 , 2 , , m ; j = 1 , 2 , , n )
(2)
The entropy weighting method is a kind of objective weighting method, which can make full use of the information carried by the original data and make sure the evaluation result objective. The weight of the indicator j is:
w j = 1 + q k = 1 m ( p k , j l n p k , j ) j = 1 n [ 1 + q k = 1 m ( p k , j l n p k , j ) ]
where, q = 1 l n m , p k , j = y k , j k = 1 m y k , j
(3)
The best solution V + and the worst solution V for the indicator j are:
V + = { V 1 + , V 2 + , , V n + } = { ( m a x V k , j |   j J ) ,   k = 1 , 2 , , m }
V = { V 1 , V 2 , , V n } = { ( m i n V k , j |   j J ) ,   k = 1 , 2 , , m }
(4)
Calculate the distance between the evaluation value of object k and the best and worst solutions.
D k + = j = 1 n ( V k , j V j + ) 2     ( k = 1 , 2 , , m )
D k = j = 1 n ( V k , j V j ) 2     ( k = 1 , 2 , , m )
(5)
Calculate the evaluation result of object k.
C k = D k D k + + D k ( k = 1 , 2 , , m )

6.3. Coupling Coordination Degree Model

The application of coupling theory to explore the relationship between urbanization and ecological environment has two meanings: Urbanization has a coercive or promoting effect on the ecological environment through population growth, economic development, energy consumption, technological progress and expansion of construction land; and the ecological environment has a restrictive or bearing effect on urban development through resource carrying, environmental capacity, ecosystem services, environmental equity and policy interventions (Figure 3).
The coupling degree of two subsystems generally adopts the following model:
C = U × E [ ( U + E ) / 2 ] 2
As the coupling degree is more used to reflect the similarity of systems, it cannot well describe the development level and coordination between urbanization and ecological environment [30,31,32,33,48]. Therefore, the coupling coordination degree D is constructed as follows:
D = C × T
T = α U + β E
where, U and E represent the level of urbanization and eco-environment respectively. As the two subsystems are equally important, the weights are taken as α = β = 0.5.
Combined with previous research [30,31,32,33,48], the coupling coordination degree is classified into three classes, four stages and twelve different types based on the comparative relationship between urbanization and the eco-environment (Table 3).

6.4. Obstacle Degree Model

Based on the evaluation results of the level of urbanization and ecological environment in the study area from 2008 to 2017, the obstacle degree model is used to diagnose and identify the influence of every indicator on the urbanization and ecological environment, and to find out and analyze main obstacle factors [49]. The obstacle degree is calculated by the deviation degree and contribution degrees of the indicator. The deviation degree indicates the difference between the standardized value and the expected value of each indicator. The contribution degree indicates the contribution of a single indicator to the overall goal. The obstacle degree model is expressed as follows:
O k j = ( 1 y k j ) × w j k = 1 m ( ( 1 y k j ) × w j )
where, 1 y k j denotes the deviation degree of the indicator, which represents the difference between the actual value and the optimal target value. w j represents the weight of the indicator.

7. Results

7.1. The Results of Indicators Based on Remote Sensing Images

7.1.1. The Results of FVC

The distribution of fraction of vegetation coverage extracted from the central region of the Yangtze River Delta based on the Google Earth Engine cloud platform is shown in Figure 4. It can be seen from the figures that the regions with low vegetation coverage are mostly concentrated in urban built-up areas and surrounding areas, and beachside areas. In these regions, human disturbance activities are strong, and the ecological environment is fragile. The regions with medium-low vegetation coverage are mostly distributed in the north of the Yangtze River Delta, while the regions with medium-high vegetation coverage are mainly concentrated in the southern regions of Anhui Province and Zhejiang Province, showing an expanding trend year by year.
It can be found from Table 4 that the central region of the Yangtze River Delta is dominated by medium-high and high coverage of vegetation. Judging from the inter-annual changes from 2008 to 2017, the changes of high-coverage vegetation are relatively drastic, showing a steadily increasing trend. There is no obvious variation in the proportions of low-coverage and medium-low coverage vegetation, which denotes that the change trend is stable. However, the vegetation of middle coverage changed greatly and decreased year by year.

7.1.2. The Results of SUHI

The rapid development of urbanization has caused urban heat island effects. The urban heat island intensity extracted based on remote sensing images, can reflect the impact of urbanization to a certain extent. The results of SUHI in the central region of the Yangtze River Delta from 2008 to 2017 are shown in Figure 5 and Figure 6. Shanghai and Jiangsu Province, with the values of SUHI lower than 5 °C, are the lower two, suggesting that the urban heat island effects in these areas are relatively weak. Zhejiang Province has the strongest urban heat island effects, with the SUHI greater than 6 °C, and the values of SUHI in Anhui Province are higher than 5 °C, showing strong urban heat island effects.
The mean values of SUHI in all the 27 cities from 2008 to 2017 are positive, varying from 3.68 °C (Zhenjiang) to 8.92 °C (Hangzhou). The urban heat island effect in Hangzhou is the most significant, followed by Wenzhou and Ningbo, and the average values of SUHI in those cities are higher than 7 °C. Zhenjiang and Changzhou have relatively low urban heat island effects, and the values of SUHI are lower than 4 °C. In terms of the change trend, the urban heat island effects in Nantong, Changzhou, and Hefei have increased significantly, greater than 3 °C from 2008 to 2017, while Tongling, Chuzhou, Taizhou(js) and Wuhu have hardly changed. The urban heat island effects in Jiaxing, Suzhou and Yancheng have been significantly alleviated.

7.2. The Performance of the Urbanization Subsystem

The evaluation results of urbanization in the central region of the Yangtze River Delta from 2008 to 2017 are shown in Figure 7 and Figure 8. On the whole, the urbanization level of the region has steadily increased, with an increase by 80% from 2008 to 2017. In terms of provincial scale (Figure 7), Shanghai, as a municipality directly under the central government, ranks first in the urbanization level, which is significantly higher than other provinces. Jiangsu Province and Zhejiang Province are the second and third respectively, with a fast growth rate of urbanization, and the level of Zhejiang Province is always close to the regional average. The level of urban development in Anhui Province is relatively poor, lower than the average level of the region.
As far as an individual city (Figure 8), as the leader of the Yangtze River Delta, Shanghai’s urbanization level has always ranked first in the region and maintained a high level for a long time. Nanjing, Hangzhou, and Hefei, as the capital cities, are the development core of each province and also at the stage of high-level urban development. The development quality of Wuxi, Suzhou and Changzhou is also relatively high. In addition, the urbanization level of Maanshan, Tongling, Wuhu, Ningbo, Nantong and Shaoxing is also above the average level. Jinhua, Chizhou, Xuancheng, Anqing, Chuzhou are ranked last, with a low level of urban development.
The spatiotemporal distribution of the urbanization level from 2008 to 2017 is shown in Figure 9. The urbanization level of the municipality and provincial capitals was prominent in the early stage and at the forefront of urban development in the central region of the Yangtze River Delta, which in turn led to the development of its surrounding cities. Cities along the Yangtze River and coastal cities have become the second echelon of urban development afterwards, where urbanization level has increased rapidly. In 2014, the level of urban development in the region was further increased. The cities with high urbanization level have a wider range of influence, and the urbanization level of the cities affiliated to the same urban agglomeration is getting closer and closer, which drives the development of more cities.
From the statistical results in Table 5, the change trend of urban development in the central region of the Yangtze River Delta can be divided into three stages. The first stage is from 2008 to 2011. Most cities are on the first and second level, and the level of urbanization is relatively poor. The second stage is from 2012 to 2014. The level of urbanization has gradually increased. All the cities are above level 2 and more and more cities are on level 4. The third stage is 2015–2017. The urbanization level of most of the cities is above level 3, and the overall level has increased significantly. The number of the cities with the best level of urbanization is increasing from one to four.

7.3. The Performance of the Eco-Environment Subsystem

The ecological environment, which is an important carrying factor for urban development, supports the economic and social development of the cities in the Yangtze River Delta. The assessment results of ecological environment in the region from 2008 to 2017 are shown in Figure 10 and Figure 11. On the whole, the quality of ecological environment has increased year by year, rising from 0.512 to 0.646. Jiangsu Province and Zhejiang Province are at the forefront, and Anhui Province slightly lagged. However, Zhejiang Province was surpassed by Anhui Province in 2013. Shanghai’s ecological environment is relatively poor, significantly lower than the other three provinces.
From the results of the eco-environment level of cities from 2008 to 2017 shown in Figure 11, the cities’ ecological environment changes in twists and turns, but the general trend is gradually becoming better. Yangzhou, Zhenjiang, and Chizhou are located in the first three places with average values higher than 0.65. As provincial capital cities, Hangzhou, Hefei, and Nanjing also have relatively good ecological and environmental conditions. Huzhou, Nantong, Zhoushan, Shaoxing, and Tongling are above the regional average. The ecological environment of Wenzhou, Taizhou(js), Ningbo and Shanghai is relatively poor.
It can be found from Figure 12 that cities with poor ecological environment were mainly concentrated in coastal areas and along the Yangtze River in 2008, which destroyed the ecological environment during rapid urban development (comparing with Figure 9). From the distribution maps of the eco-environment level in 2014 and 2017, it can be seen that the total number of cities ranking on level 1–2 is very small, and the ecological and environmental conditions in coastal areas and along the Yangtze River have been significantly improved.
From the statistical results in Table 6, the change trend of the ecological environment in the central region of the Yangtze River Delta can be also divided into three stages. The first stage is from 2008 to 2010, and the eco-environment level of most cities is in the lower ranges. The second phase is from 2011 to 2013. The level of ecological environment has been improved, and only a few cities are on level 1–2. The third stage is 2014–2017. All cities are on level 2 and above, where the ecological environment is getting better and better, and the number of cities on level 5 continues to increase.

7.4. Coupling Coordination State

Figure 13 and Figure 14 show the trend of coupling coordination degree between urbanization and ecological environment in the central region of the Yangtze River Delta. In general, the coupling coordination degree in the region has shown an overall rising tendency from 0.604 in 2008 to 0.753 in 2017. All cities are in the stages of unbalanced or transitional development before 2014. After 2015, two or three cities begin to enter a period of balanced development. In terms of specific values, the 10-year average change rate ranges from 14.74% (Shanghai) to 37.39% (Chuzhou), and the 10-year average growth rate of the study region is 24.51%. The cities with the growth rate over 30% are Chuzhou (ranked 27th for coupling coordination degree in 2008), Xuancheng (ranked 26th for coupling coordination degree in 2008), and Zhenjiang (ranked 16th for coupling coordination degree in 2008).
From the perspective of the provincial level in Figure 14, three provinces and one city are generally in the period of transitional development. Shanghai and Jiangsu Province are ranking the first two places with the values of coupling coordination degree higher than 0.62, which are in the stage of transitional development. At the same time of rapid development, Jiangsu Province, paying more attention to ecological and environmental issues, successfully surpassed Shanghai in 2014 and became the province with the highest value of coupling coordination degree in the region. Zhejiang Province is always at the regional average level, while Anhui Province, with relatively poor coupling coordination degree, has become better, and then successfully enters into the stage of transitional development from the stage of slightly unbalanced development.

8. Discussion

8.1. Analysis of the Obstacle Factors

According to Formula (25), the hindering factors and obstacle degree of urbanization and ecological environment are obtained. It can be seen in Table 7 that social urbanization, economic urbanization and landscape urbanization are the main hindering indices of urbanization. Specifically, the obstacle degrees of SUI (social urbanization index) are the biggest, EUI (economic urbanization index) and LUI (landscape urbanization index) follow, with those of DUI (demographic urbanization index) being the smallest. From 2008–2017, the hindering influence of SUI and EUI is getting smaller and smaller, and the blocking force of LUI and DUI is becoming bigger and bigger. In 2017, the hindering force of SUI, LUI and EUI is almost equivalent.
From the perspective of indicators, the main obstacle factors of the urbanization subsystem can be found in Table 8. The five main hindering factors of the urbanization subsystem from 2008 to 2010 are U9 (Per capita disposable income of urban residents), U8 (Total fixed asset investment), U6 (GDP per capita), U10 (Total retail sales of social consumer goods per capita), and U11 (Number of beds per 10,000 people), which indicates that, to some extent, these five indicators have an important effect on urban development. After 2011, U5 (Proportion of construction land in municipal districts), which takes the place of U10, becomes one of the top five hindering factors. During these ten years, U9 and U11 rank first and fifth respectively, without the orders changing. U8 and U6 are shifted back one position correspondingly. The ranking of U5 is getting higher and higher from the sixth to the third and to the second. The two factors with the least obstacles to urbanization are U3 and U1. From the trend of change, the obstacles of U1, U2, U3, U4, U5 and U7 are increasing. The obstacles of U6, U8, U9, U10 and U11 are getting smaller and smaller. U3 and U1 are always the two factors with the least influence, whose obstacle degrees are less than 5%.
In the eco-environment system, pollution loading and resource consumption are the main hindering indices. According to Table 9, PLI (pollution loading index) is definitely the principal hindering index, whose average obstacle degree is greater than 59% in ten years. The values of obstacle degree of PLI show a decreasing trend from 2008 to 2017. RCI (resource consumption index) is in the second place with the obstacle degree increasing from 18.35% in 2008 to 32.15% in 2017. The obstacle degree of RCI has increased significantly, which means that the negative impact on the ecological environment is increasing. The EQI (environmental quality index) and EGI (ecological governance index) are ranked in the last two, and the obstacles are getting smaller and smaller.
It can be seen from Table 10 that the top five indicators that hinder the eco-environment in 2008–2013 and 2015 are E5 (Industrial sulfur dioxide emissions per 100 million Yuan output value), E6 (Industrial soot emissions per 100 million Yuan output value), E8 (Electricity consumption of per 10,000 Yuan output value), E4 (Industrial wastewater discharge per 100 million Yuan output value) and E1 (Fraction of vegetation coverage); E3 (Surface urban heat island intensity) comes to be one of the top five hindering factors in 2014, in which there are actually a small gap of obstacle degrees between E3 and E1; E9 (Ratio of industrial solid wastes comprehensively utilized) achieves a surpass into the top five blocking factors and gradually widens the gap with the behind from 2016–2017. The order of the top four main obstacle factors has not changed during the ten years. E11 (Disposal rate of living garbage) and E2 (Park green area per capita in urban area) are always the two factors with the least obstacle degrees. The blocking effect of E8 increases significantly, while those of E9 and E7 have also become larger. However, the obstacle degrees of E5, E6 and E3 fluctuate, and the hindering force becomes slightly smaller.

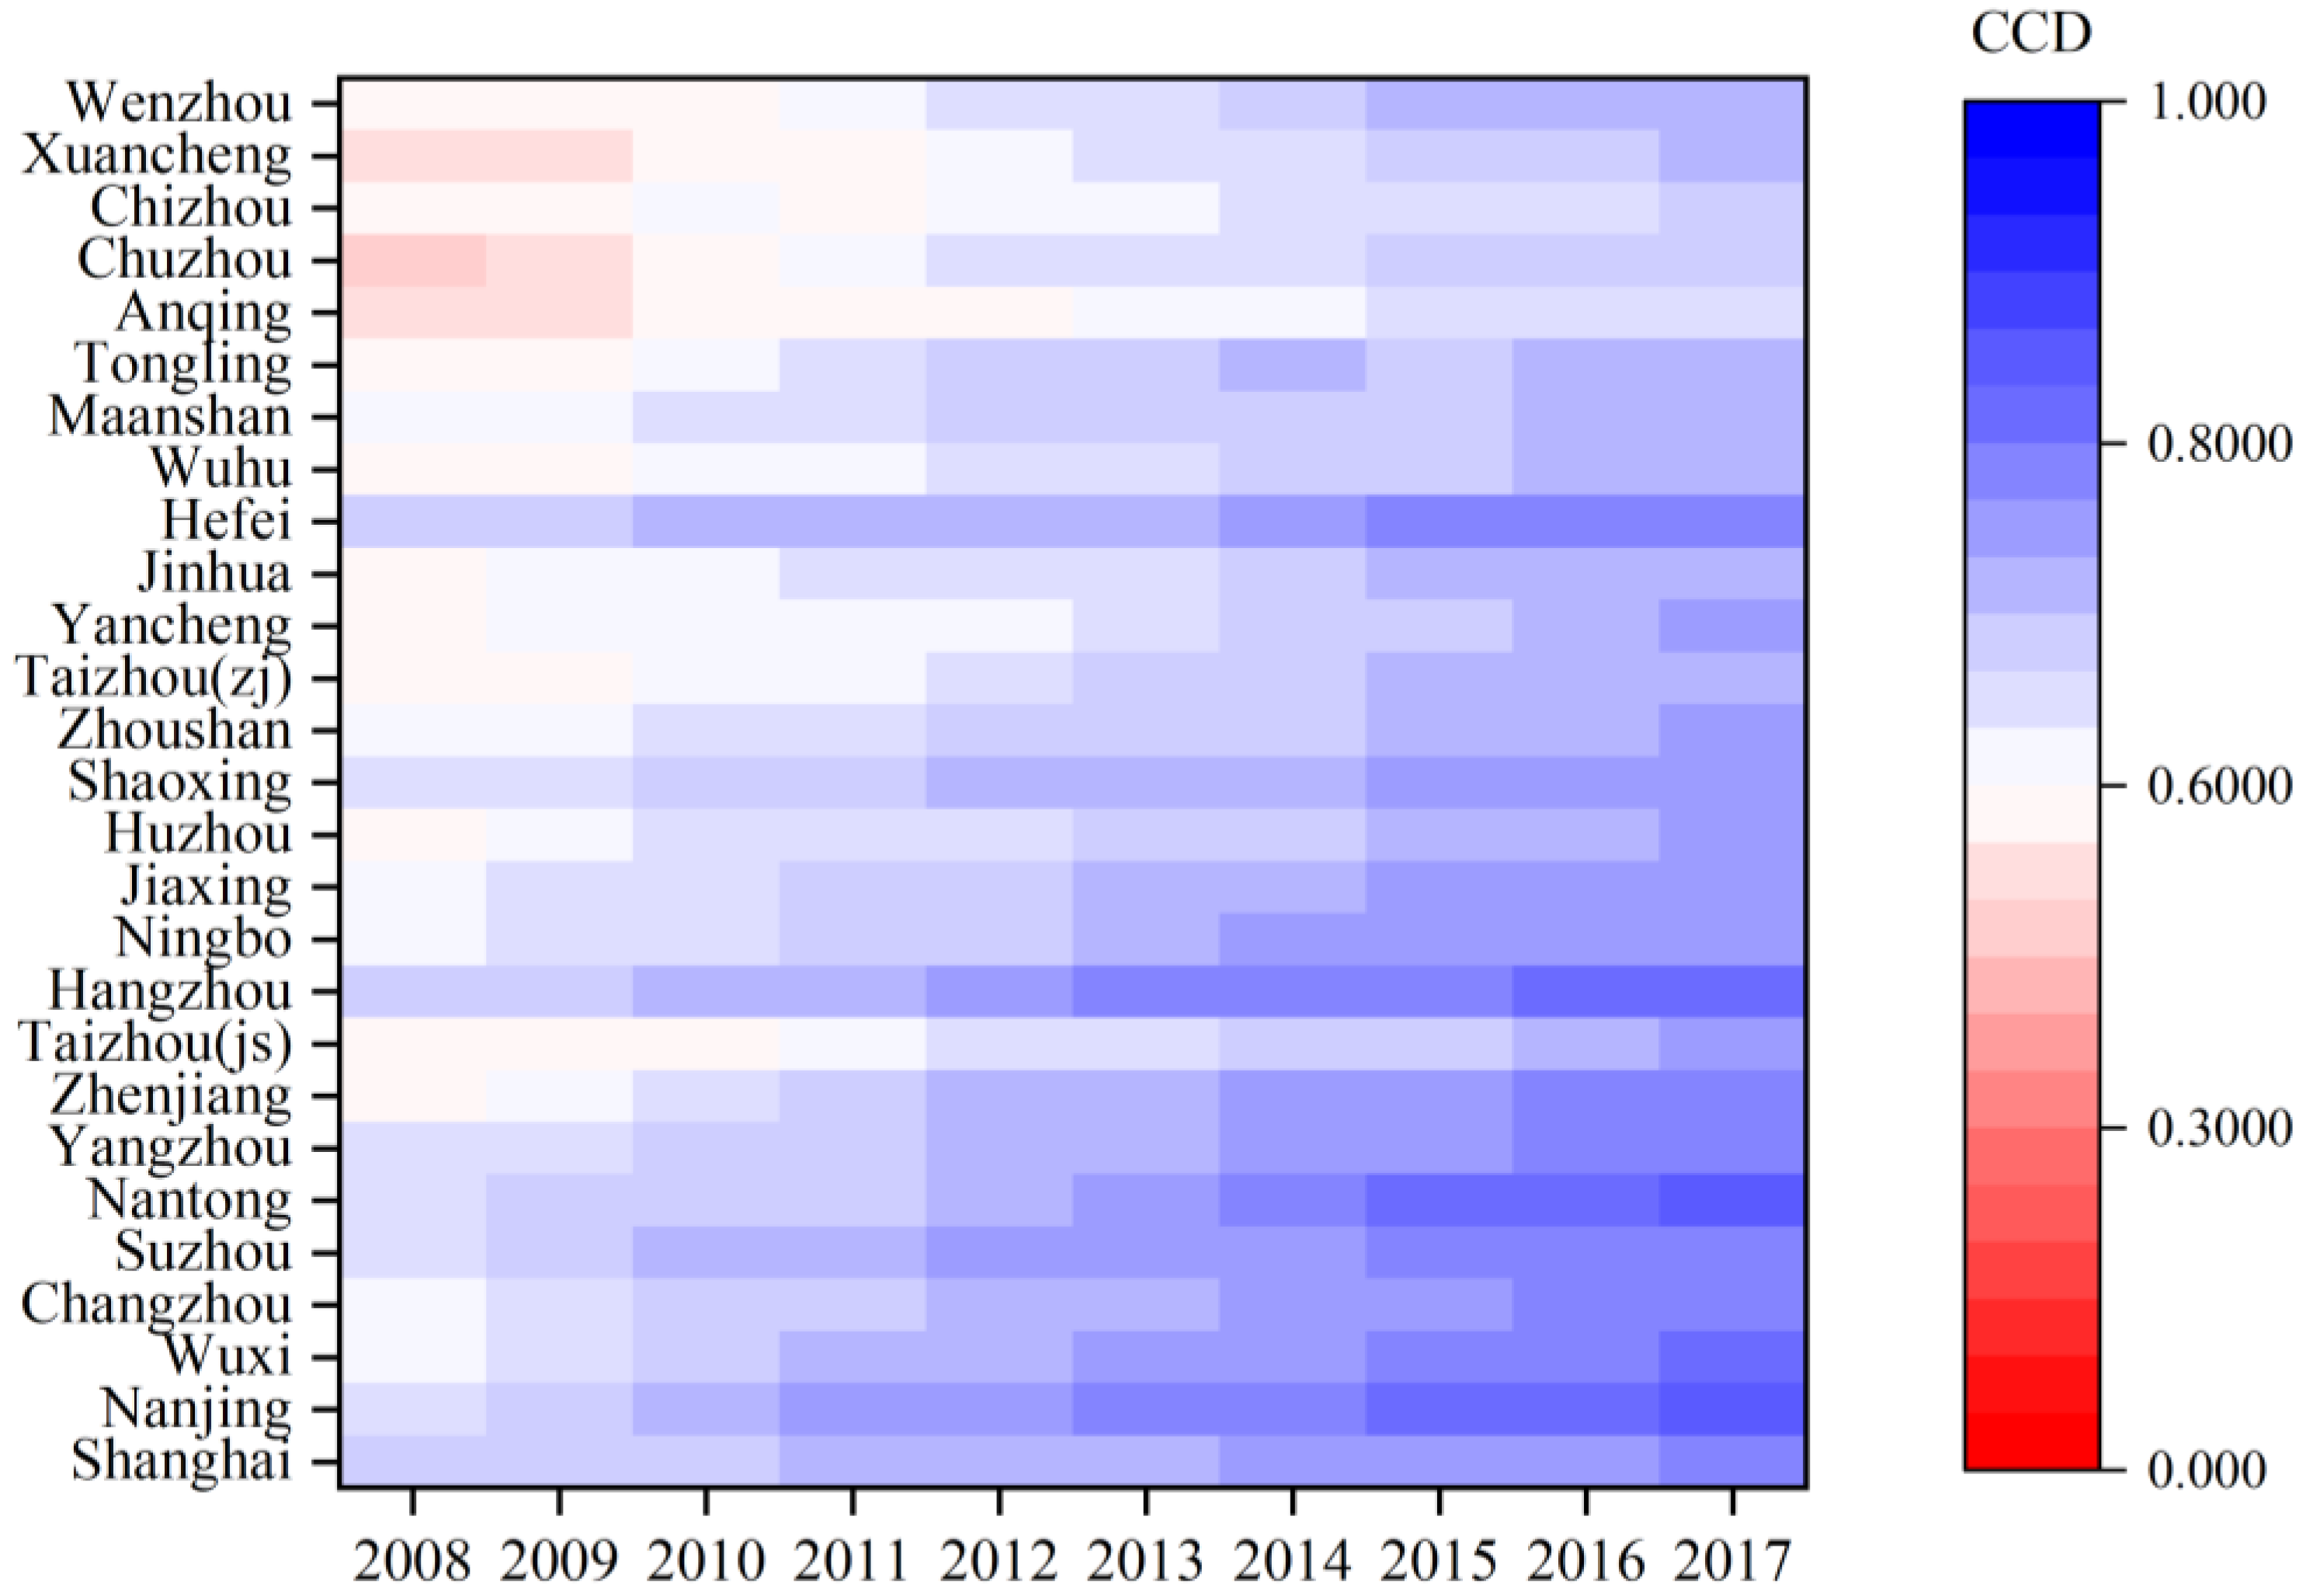
8.2. Analysis of Coupling Coordination State

A high coordination degree does not necessarily mean a high-level coordinated development. Only when both the urbanization and the ecological environment reach the high level and high quality simultaneously, is it a truly high-level coordinated development. Therefore, further discussion on the differences between the level of urbanization and eco-environment is required.
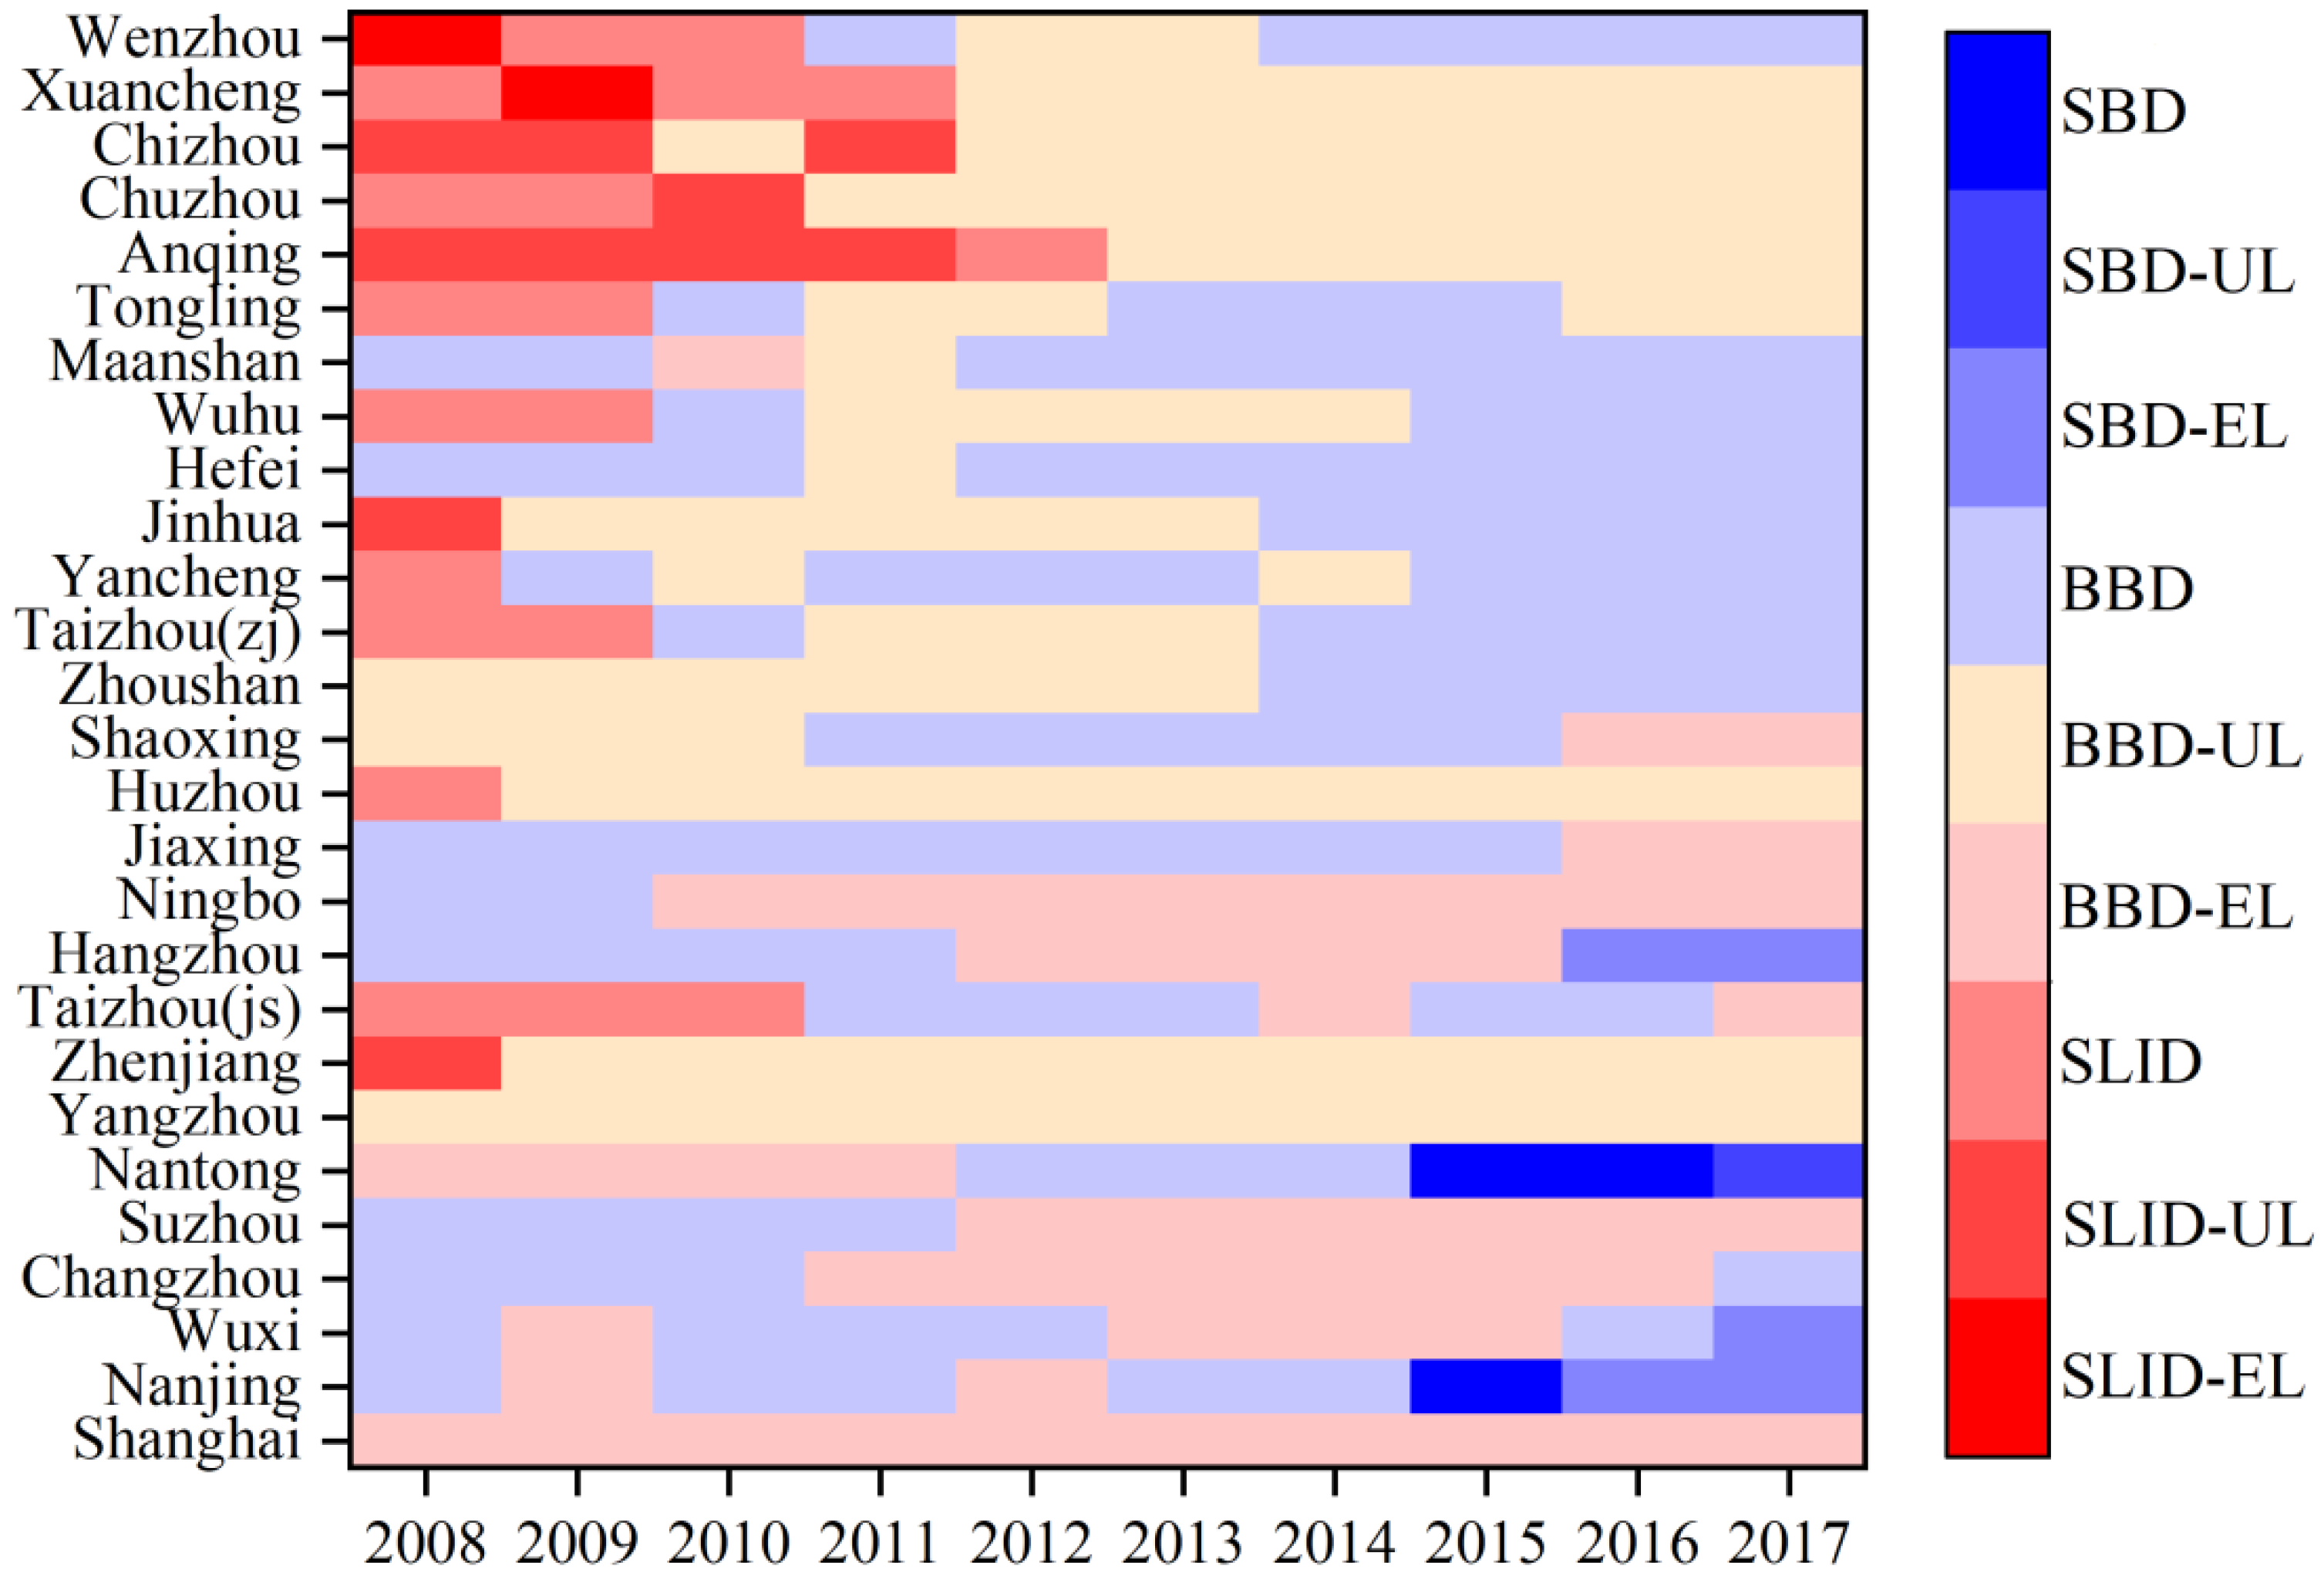
Through comparison of the level of urbanization and ecological environment (classified in Table 5 and Table 6), nine different types of coupling coordination between urbanization and the eco-environment are shown in Figure 15. Although the coordinated development of most cities has improved significantly, regional imbalances are evident and the contradiction between ecological environment and urbanization still exists.
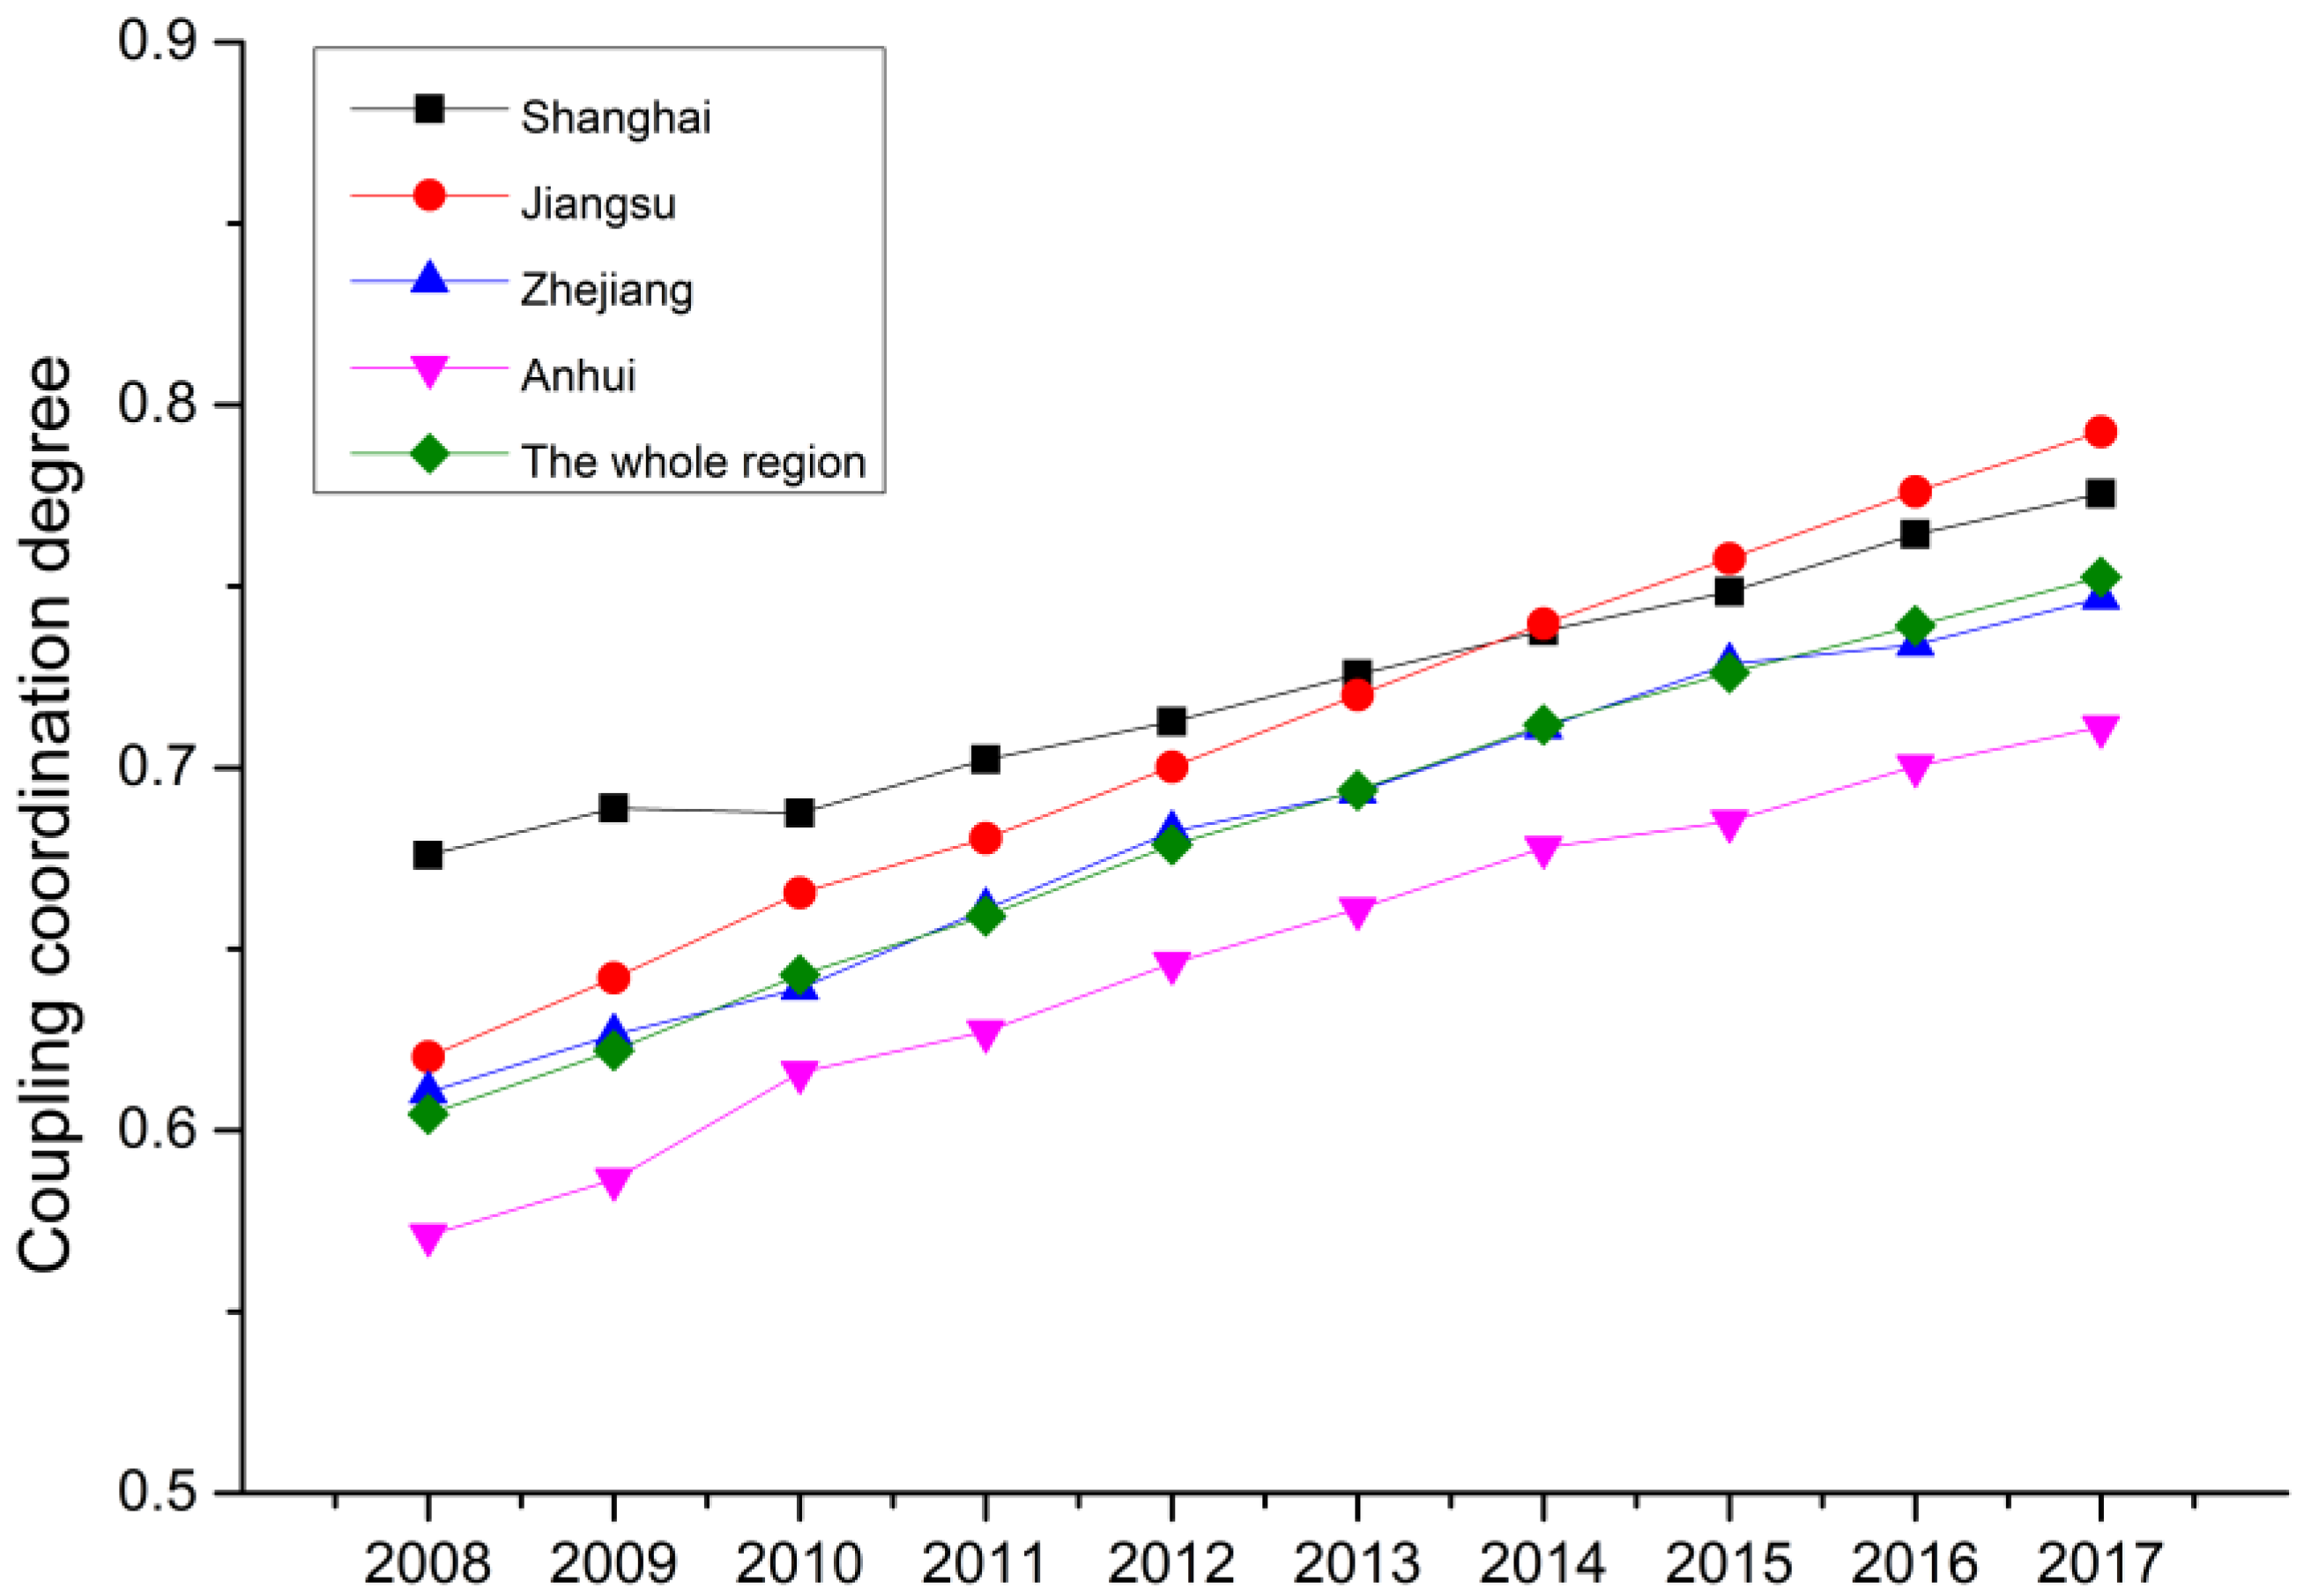
The dynamic evolution of coupling coordination can be divided into the following three stages (2008–2011, 2012–2014, and 2015–2017). The first stage is from 2008 to 2011. There are 13 cities with the coupling coordination degree between 0.3 and 0.6 in 2008, which is in the imbalanced development stage. Relying on its own advantages of location and policy, with the help of urban expansion and population agglomeration, the Yangtze River Delta has achieved a rapid increase in the level of urban development, which has brought tremendous pressure on the ecological environment, and the degree of coupling coordination between urbanization and ecological environment is at low level. In particular, Anhui Province has not joined in the urban agglomerations of the Yangtze River Delta, and the urban development is relatively backward. The second phase is from 2012 to 2014. The coupling coordination degrees of most cities in the study area are between 0.6 and 0.8, which is in the phase of transitional development. The coupling coordination degree between ecological and ecological environment maintains an upward trend. However, only a few cities are in the type of basically balanced development of urbanization and environment (BBD), which means that there are still prominent contradictions between urbanization and ecological environment in most cities. The third stage is 2015–2017. A few cities take the lead in entering the stage of superiorly balanced development with the coupling coordination degree greater than 0.8. At the same time, all other cities in the region move into the stage of transitional development. However, the gap between cities has not decreased significantly. Seven cities are still in the type of basically balanced development with eco-environment lagged, in which ecological environment protection does not keep up with the pace of urban development.
The Yangtze River Delta region is not only one of the most economically developed areas in China, but also a typical area for environmental pollution control. The green and healthy development of a city is closely related to many factors of the city, such as public policy, technological innovation, social change and lifestyle, which have profoundly affected the development of the coupling between urbanization and the ecological environment.
From 2008 to 2016, the “Guiding opinions on further promoting reform and opening-up and economic and social development in the Yangtze River Delta region” [34], “Regional planning of the Yangtze River Delta region” [50] and “Development plan of the Yangtze River Delta urban agglomerations” [51] were successively issued, which promoted the integration process of the Yangtze River Delta at the national level. Meanwhile, the important policies in the Yangtze River Delta pilot include trade, finance, technological innovation and other important aspects, such as Shanghai Free Trade Zone and Free Port policies, Southern Jiangsu modernization demonstration zone policy, and Zhejiang financial reform policy. The region took the lead in exploring the high-quality development path and promoted rapid economic and social development. However, with the continuous development of the economy and society, the regional characteristics of environmental pollution were becoming more and more obvious, and collaborative environmental protection governance was particularly important. By the end of 2017, more than 40 agreements and contracts for environmental protection have been signed in the Yangtze River Delta, covering various aspects such as water pollution control, air pollution control and marine governance. A lot of active explorations in regional air pollution joint prevention and control, comprehensive prevention and control of water pollution, cross-region pollution emergency treatment, and regional hazardous waste environmental management have been made. A set of good consultation mechanisms for ecological environment protection have been established, laying a solid foundation for regional environmental co-governance, co-construction, and sharing. In 2008, “Cooperation agreement on environmental protection in the Yangtze River Delta region” [52] was signed, which meant that the Yangtze River Delta, as a whole, entered the implementation phase of environmental cooperation governance. In 2013, “Declaration on urban environmental cooperation (Hefei) in the Yangtze River Delta” [53] clearly stated that the regional environmental protection systems and standards would be jointly built and the cooperation in environmental protection and ecological planning had been actively carried out. The Yangtze River Delta urban agglomerations have initially entered the stage of deep cooperation in environmental cooperative governance, and the effectiveness of environmental protection measures has begun to emerge. In 2014, the mechanism of pollution prevention was expanded to three provinces and one city. The working meetings of prevention and control cooperation mechanisms on air pollution and water pollution in the Yangtze River Delta were held successively. The integrated environmental governance has been advanced from “collaborative air pollution control” to “joint water pollution control”. The implementation of these policies has greatly promoted the high-quality development of integration in the Yangtze River Delta, which has effectively improved the ecological environment while developing at a high speed.
Technological innovation injects powerful driving force into the high-quality development of the regional economy, which is also the basic power to fight the battle of pollution prevention and control and build ecological civilization. From 2008 to 2017, the total number of patent applications in the Yangtze River Delta region was 5,820,300, accounting for about 35% of the national total, which is an important source of the country’s regional technology innovation. At the same time, the investment from the governments and enterprises in scientific research has grown rapidly. The resources of science and technology innovation of China’s first-class colleges and universities have gathered together, playing a leading and driving role in radiation regions. The inter-provincial cooperation in scientific and technological innovation has entered an accelerated period, and the scale of innovation cooperation in the Yangtze River Delta was getting bigger. In addition, the Yangtze River Delta urban agglomeration has taken the lead in accelerating the technological innovation driving economic transformation and upgrading. The proportion of the tertiary industry is increasing. The Yangtze River Delta region began to enter the post-industrial period. The proportion of secondary industries has gradually declined, effectively alleviating industrial pollution emissions. Scientific and technological innovation can make full use of the resource endowment and industrial characteristics of one city and three provinces, promoting the innovation of management operation mechanisms, accelerating the transformation of innovation achievements in key fields into industries, and further enhancing the overall development and collaborative innovation capabilities of the region. For example, the construction of a smart city integrates urban resources, realizes fine and intelligent management of the city, so as to reduce resource consumption, reduces environmental pollution, alleviates traffic congestion and improves the quality of life of residents to a certain extent. Technological innovation is also reflected in environmental science and technology innovation and environmental policy management innovation. The scientific and technological research on joint prevention and control of air pollution, and the synergy between environmental technology innovation and environmental policy management innovation in the Yangtze River Delta, can effectively support the tough battle of ecological environmental protection and pollution prevention.
At present, people’s lifestyles have changed, advocating “green consumption, low-carbon travel”. The greening of travel modes includes public transportation and shared bicycles. As an innovation in transportation, shared bicycles have changed people’s travel modes, enhanced urban mobility, and reduced the use of motor vehicles. By the end of 2017, the metro transportation has been opened in seven cities in the Yangtze River Delta, with the operation mileage from 52 km to 666 km respectively, which not only brings great convenience to life, but also reduces resource consumption and pollution emissions. Garbage classification is also a revolution in our lifestyle. Many cities in the Yangtze River Delta have promulgated management methods for the classification of domestic waste, conducted pilot work on waste classification, and promoted waste classification. It is a scientific management method for the effective disposal of waste, realizing the use of waste resources, reducing the amount of waste disposal, and improving ecological environment status.
In general, these aspects mentioned above are closely related, and their collective effect has an impact on the ecological environment and the process of urbanization. There are both positive and negative aspects. We should correctly use positive effects while avoiding negative effects along with promoting green, healthy and sustainable urban development.

9. Conclusions and Suggestions

The implementation of the integrated development strategy of the Yangtze River Delta is one of the major strategic measures to lead the nation’s high-quality development, expand the spatial layout of China’s reform and opening-up, and create a strong and active growth pole. This article has taken 27 cities in the central region of the Yangtze River Delta as the research objects, used the Entropy-TOPSIS method to evaluate the level of urbanization and eco-environment by constructing the index system based on remote sensing images and statistical data from 2008 to 2017, and analyzed the coupling coordination degree between the urbanization and eco-environment as well as the main obstacle factors.
During the past ten years, the coupling coordination degree in the study region generally showed an upward trend from 0.604 in 2008 to 0.753 in 2017, generally changing from an imbalanced state towards a basically balanced state. The urbanization level in the study region has steadily increased by 80% from 2008 to 2017, while the level of ecological environment has increased from 0.512 to 0.646. Although both the two subsystems have achieved a certain increase on the whole, regional imbalances still existed. The ecological environment situation remains severe, in which social urbanization, economic urbanization, landscape urbanization, pollution loading and resource consumption are the main hindering indices.
The Yangtze River Delta region is geographically connected, and economically and environmentally integrated, which has a common cultural background and is closely linked in many aspects. The urban green development and the conservation of the ecological environment require the joint efforts of all cities in the region, while all cities must not fall behind. Therefore, according to our research, the following suggestions are provided.
Firstly, in terms of social urbanization, the governments need to formulate measures to reduce the income gap between urban and rural residents, improve the level of medical security, and then improve people’s living standards and quality. With regard to economic urbanization, the investment in fixed assets needs to be strengthened to promote social development to provide a material and technical foundation. In terms of the ecological environment, the effective measures should be taken to strengthen the scientific management of pollution, promote the cooperation mechanisms for pollution prevention and control in the Yangtze River Delta region. While exerting the potential of saving energy and emission reduction as well as environmental protection of surrounding cities, pollution transfer must be strictly prevented. In addition, the promotion of clean energy substitution is required to reduce the dependence on traditional energy consumption.
Secondly, the governments should promote the integration of urbanization and the ecological environment in the Yangtze River Delta. From the dual perspectives of economic development and environmental protection, regional integrated green development policies need to be formulated and implemented to pay attention to the balance between “quality” and “speed” in development. Environmental governance and information sharing need to be further strengthened, and a unified environmental governance standard should be established in the Yangtze River Delta. We must accelerate the construction of a regional environmental monitoring platform to promote the sharing and exchange of environmental information, and formulate uniform emission standards as well as environmental protection regulations.
Finally, the governments should promote public participation and more investment in science and technology. On the one hand, some measures should be used to increase publicity on environmental protection, improve public awareness of environmental protection, encourage the public to participate extensively in environmental governance actions, improve the disclosure of corporate environmental behavior information, and ensure the timeliness and effectiveness of public environmental participation. On the other hand, the investment of relevant scientific research needs to be increased to make full use of the technical advantages of satellite remote sensing, big data, cloud computing to improve the timeliness and accuracy of the acquisition of ecological environment monitoring information, build ecological environment big data, improve the overall supervision efficiency, and provide reliable support and services for ecological environment monitoring.
However, there are still some limitations in this research. The urbanization and ecological environment are complex and huge systems which are difficult to be described through simple index systems. Due to the measurability of indicators, this paper only selects several representative indicators. At the same time, the application of remote sensing technology in urbanization and ecological environment monitoring has a broad prospect. At present, this paper only involves vegetation cover and land surface temperature. In the next step, more relevant dynamic information from remote sensing images will be extracted to build a more comprehensive evaluation system, such as land use and land cover, water environment and air pollution monitoring.

Author Contributions

Conceptualization, Z.S., D.L. and O.A.; methodology, L.D.; software, L.D.; validation, L.D.; formal analysis, L.D.; investigation, L.D.; resources, L.D.; data curation, C.L.; writing-original draft preparation, L.D.; writing-review and editing, O.A. and M.E.H.; visualization, L.D.; supervision, Z.S.; funding acquisition, Z.S. All authors have read and agreed to the published version of the manuscript.

Funding

This research was funded by the National Key R&D plan on strategic international scientific and technological innovation cooperation special project under grant 2016YFE0202300, the National Natural Science Foundation of China under grants 41771452, 41771454 and 41890820, the Natural Science Fund of Hubei Province in China under grant 2018CFA007, and the Research Project from the Ministry of Natural Resources of China under grant 4201-240100123.

Acknowledgments

The authors are sincerely grateful to the editors as well as the anonymous reviewers for their valuable suggestions and comments that helped us improve this paper significantly.

Conflicts of Interest

The authors declare no conflict of interest.

References

  1. Yang, X.J. China’s Rapid Urbanization. Science 2013, 342, 310. [Google Scholar] [CrossRef] [PubMed]
  2. National Bureau of Statistics of the People’s Republic of China. China Statistical Yearbook; China Statistics Press: Beijing, China, 2019.
  3. Wang, Q.; Yuan, X.; Zhang, J.; Mu, R.; Yang, H.; Ma, C. Key evaluation framework for the impacts of urbanization on air environment—A case study. Ecol. Indic. 2013, 24, 266–272. [Google Scholar] [CrossRef]
  4. Ding, L.; Zhao, W.; Huang, Y.; Cheng, S.; Liu, C. Research on the Coupling Coordination Relationship between Urbanization and the Air Environment: A Case Study of the Area of Wuhan. Atmosphere 2015, 6, 1539–1558. [Google Scholar] [CrossRef] [Green Version]
  5. Ma, H.; Chou, N.-T.; Wang, L. Dynamic Coupling Analysis of Urbanization and Water Resource Utilization Systems in China. Sustainability 2016, 8, 1176. [Google Scholar] [CrossRef] [Green Version]
  6. Ding, L.; Shao, Z.F.; Zhang, H.C.; Xu, C.; Wu, D.W. A Comprehensive Evaluation of Urban Sustainable Development in China Based on the TOPSIS-Entropy Method. Sustainability 2016, 8, 746. [Google Scholar] [CrossRef] [Green Version]
  7. Du, X.; Huang, Z. Ecological and environmental effects of land use change in rapid urbanization: The case of hangzhou, China. Ecol. Indic. 2017, 81, 243–251. [Google Scholar] [CrossRef]
  8. Sun, J.; Shi, J.; Shen, B.; Li, S.; Wang, Y. Nexus among Energy Consumption, Economic Growth, Urbanization and Carbon Emissions: Heterogeneous Panel Evidence Considering China’s Regional Differences. Sustainability 2018, 10, 2383. [Google Scholar] [CrossRef] [Green Version]
  9. Li, C.; Li, J.; Wu, J. Quantifying the speed, growth modes, and landscape pattern changes of urbanization: A hierarchical patch dynamics approach. Landsc. Ecol. 2013, 28, 1875–1888. [Google Scholar] [CrossRef]
  10. Li, B.; Chen, D.; Wu, S.; Zhou, S.; Wang, T.; Chen, H. Spatio-temporal assessment of urbanization impacts on ecosystem services: Case study of Nanjing City, China. Ecol. Indic. 2016, 71, 416–427. [Google Scholar] [CrossRef]
  11. Tan, Y.; Xu, H.; Zhang, X. Sustainable urbanization in China: A comprehensive literature review. Cities 2016, 55, 82–93. [Google Scholar] [CrossRef]
  12. Psomiadis, E.; Soulis, K.X.; Zoka, M.; Dercas, N. Synergistic approach of remote sensing and gis techniques for flash-flood monitoring and damage assessment in Thessaly plain area, Greece. Water 2019, 11, 448. [Google Scholar] [CrossRef] [Green Version]
  13. Shao, Z.F.; Fu, H.Y.; Li, D.R.; Altan, O.; Cheng, T. Remote sensing monitoring of multi-scale watersheds impermeability for urban hydrological evaluation. Remote Sens. Environ. 2019, 232, 111338. [Google Scholar] [CrossRef]
  14. Zhong, Q.; Ma, J.; Zhao, B.; Wang, X.; Zong, J.; Xiao, X. Assessing spatial-temporal dynamics of urban expansion, vegetation greenness and photosynthesis in megacity Shanghai, China during 2000–2016. Remote Sens. Environ. 2019, 233, 111374. [Google Scholar] [CrossRef]
  15. Liu, X.P.; Huang, Y.H.; Xu, X.C.; Li, X.C.; Li, X.; Ciais, P.; Lin, P.R.; Gong, K.; Ziegler, A.; Chen, A.P.; et al. High-spatiotemporal-resolution mapping of global urban change from 1985 to 2015. Nat. Sustain. 2020, 1–7. [Google Scholar] [CrossRef]
  16. Zhou, D.; Zhao, S.; Liu, S.; Zhang, L.; Zhu, C. Surface urban heat island in China’s 32 major cities: Spatial patterns and drivers. Remote Sens. Environ. 2014, 152, 51–61. [Google Scholar] [CrossRef]
  17. She, Q.; Peng, X.; Xu, Q.; Long, L.; Wei, N.; Liu, M.; Jia, W.; Zhou, T.; Han, J.; Xiang, W. Air quality and its response to satellite-derived urban form in the Yangtze River Delta, China. Ecol. Indic. 2017, 75, 297–306. [Google Scholar] [CrossRef]
  18. Gao, J.; Yu, Z.; Wang, L.; Vejre, H. Suitability of regional development based on ecosystem service benefits and losses: A case study of the Yangtze River Delta urban agglomeration, China. Ecol. Indic. 2019, 107, 105579. [Google Scholar] [CrossRef]
  19. Lin, M.; Lin, T.; Sun, C.; Jones, L.; Sui, J.; Zhao, Y.; Liu, J.; Xing, L.; Ye, H.; Zhang, G.; et al. Using the Eco-Erosion Index to assess regional ecological stress due to urbanization—A case study in the Yangtze River Delta urban agglomeration. Ecol. Indic. 2020, 111, 106028. [Google Scholar] [CrossRef]
  20. Li, Y.; Li, Y.; Zhou, Y.; Shi, Y.; Zhu, X. Investigation of a coupling model of coordination between urbanization and the environment. J. Environ. Manag. 2012, 98, 127–133. [Google Scholar] [CrossRef]
  21. Fang, C.; Wang, J. A theoretical analysis of interactive coercing effects between urbanization and eco-environment. Chin. Geogr. Sci. 2013, 23, 147–162. [Google Scholar] [CrossRef]
  22. Xiang, W.; Wang, Y.; Li, N.; Zhu, Q. Grey-relation analysis of traffic system and urbanization in Jilin Province of China. Chin. Geogr. Sci. 2007, 17, 216–221. [Google Scholar] [CrossRef]
  23. Yu, Y.; Tong, Y.; Tang, W.; Yuan, Y.; Chen, Y. Identifying Spatiotemporal Interactions between Urbanization and Eco-Environment in the Urban Agglomeration in the Middle Reaches of the Yangtze River, China. Sustainability 2018, 10, 290. [Google Scholar] [CrossRef] [Green Version]
  24. Fujii, H.; Managi, S. Economic development and multiple air pollutant emissions from the industrial sector. Environ. Sci. Pollut. Res. 2016, 23, 2802–2812. [Google Scholar] [CrossRef]
  25. Zhao, Y.; Wang, S.; Ge, Y.; Liu, Q.; Liu, X. The spatial differentiation of the coupling relationship between urbanization and the eco-environment in countries globally: A comprehensive assessment. Ecol. Model. 2017, 360, 313–327. [Google Scholar] [CrossRef]
  26. Xu, X.; Xu, X.; Chen, Q.; Che, Y. The impact on regional “resource curse” by coal resource tax reform in China—A dynamic CGE appraisal. Resour. Policy 2015, 45, 277–289. [Google Scholar] [CrossRef]
  27. Fang, C.; Liu, H.; Li, G.; Sun, D.; Miao, Z. Estimating the Impact of Urbanization on Air Quality in China Using Spatial Regression Models. Sustainability 2015, 7, 15570–15592. [Google Scholar] [CrossRef] [Green Version]
  28. Su, S.; Xiao, R.; Zhang, Y. Multi-scale analysis of spatially varying relationships between agricultural landscape patterns and urbanization using geographically weighted regression. Appl. Geogr. 2012, 32, 360–375. [Google Scholar] [CrossRef]
  29. Liu, N.; Liu, C.; Xia, Y.; Da, B. Examining the coordination between urbanization and eco-environment using coupling and spatial analyses: A case study in China. Ecol. Indic. 2018, 93, 1163–1175. [Google Scholar] [CrossRef]
  30. Haseeb, M.; Hassan, S.; Azam, M. Rural-urban transformation, energy consumption, economic growth, and CO2 emissions using STRIPAT model for BRICS countries. Environ. Prog. Sustain. Energy 2017, 36, 523–531. [Google Scholar] [CrossRef]
  31. Cui, X.; Fang, C.; Liu, H.; Liu, X. Assessing sustainability of urbanization by a coordinated development index for an Urbanization-Resources-Environment complex system: A case study of Jing-Jin-Ji region, China. Ecol. Indic. 2019, 96, 383–391. [Google Scholar] [CrossRef]
  32. Huang, Y.; Qiu, Q.; Sheng, Y.; Min, X.; Cao, Y. Exploring the Relationship between Urbanization and the Eco-Environment: A Case Study of Beijing. Sustainability 2019, 11, 6298. [Google Scholar] [CrossRef] [Green Version]
  33. He, J.; Wang, S.; Liu, Y.; Ma, H.; Liu, Q. Examining the relationship between urbanization and the eco-environment using a coupling analysis: Case study of Shanghai, China. Ecol. Indic. 2017, 77, 185–193. [Google Scholar] [CrossRef]
  34. The Outline of the Integrated Regional Development of the Yangtze River Delta. The CPC Central Committee and the State Council, 2019. Available online: http://www.gov.cn/zhengce/2019-12/01/content_5457442.htm (accessed on 28 January 2020).
  35. Shanghai Municipal Statistics Bureau. National Economic and Social Development Statistics Bulletin of Shanghai. 2019. Available online: http://tjj.sh.gov.cn/tjgb/20200329/05f0f4abb2d448a69e4517f6a6448819.html (accessed on 20 March 2020).
  36. Statistical Bureau of Jiangsu Province. National Economic and Social Development Statistics Bulletin of Jiangsu Province. 2019. Available online: http://tj.jiangsu.gov.cn/art/2020/3/3/art_4031_8993801.html (accessed on 20 March 2020).
  37. Statistical Bureau of Zhejiang Province. National Economic and Social Development Statistics Bulletin of Zhejiang Province. 2019. Available online: http://tjj.zj.gov.cn/art/2020/3/5/art_1525568_42098616.html (accessed on 20 March 2020).
  38. Statistical Bureau of Anhui Province. National Economic and Social Development Statistics Bulletin of Anhui Province. 2019. Available online: http://tjj.ah.gov.cn/ssah/qwfbjd/tjgb/sjtjgb/115405421.html (accessed on 20 March 2020).
  39. Wang, L.; Li, C.; Ying, Q.; Cheng, X.; Wang, X.; Li, X.; Hu, L.; Liang, L.; Yu, L.; Huang, H.; et al. China’s urban expansion from 1990 to 2010 determined with satellite remote sensing. Chin. Sci. Bull. 2012, 57, 2802–2812. [Google Scholar] [CrossRef] [Green Version]
  40. Lu, H. Decomposition of vegetation cover into woody and herbaceous components using AVHRR NDVI time series. Remote Sens. Environ. 2003, 86, 1–18. [Google Scholar] [CrossRef]
  41. Jiapaer, G.; Chen, X.; Bao, A. A comparison of methods for estimating fractional vegetation cover in arid regions. Agric. For. Meteorol. 2011, 151, 1698–1710. [Google Scholar] [CrossRef]
  42. Chen, M.; Liu, W.; Lu, D. Challenges and the way forward in China’s new-type urbanization. Land Use Pol. 2016, 55, 334–339. [Google Scholar] [CrossRef]
  43. Jimenez-Munoz, J.C.; Sobrino, J.A. A Single-Channel Algorithm for Land-Surface Temperature Retrieval From ASTER Data. IEEE Geosci. Remote Sens. Lett. 2010, 7, 176–179. [Google Scholar] [CrossRef]
  44. Momeni, M.; Saradjian, M. Evaluating NDVI-based emissivities of MODIS bands 31 and 32 using emissivities derived by Day/Night LST algorithm. Remote Sens. Environ. 2007, 106, 190–198. [Google Scholar] [CrossRef]
  45. Carlson, T.N.; Ripley, D.A. On the relation between NDVI, fractional vegetation cover, and leaf area index. Remote Sens. Environ. 1997, 62, 241–252. [Google Scholar] [CrossRef]
  46. United Nations. Transforming Our World: The 2030 Agenda for Sustainable Development. 2015. Available online: https://sustainabledevelopment.un.org (accessed on 15 June 2020).
  47. The Former Ministry of Environmental Protection of the People’s Republic of China. Technical Criterion for Ecosystem Status Evaluation. 2015. Available online: http://www.mee.gov.cn/ywgz/fgbz/bz/bzwb/stzl/201503/t20150324_298011.shtml (accessed on 12 March 2020).
  48. Wang, M.; Zhao, X.; Gong, Q.; Ji, Z. Measurement of regional green economy sustainable development ability based on entropy weight-topsis-coupling coordination degree-A case study in Shandong Province, China. Sustainability 2019, 11, 280. [Google Scholar] [CrossRef] [Green Version]
  49. Zhang, K.; Shen, J.; He, R.; Fan, B.; Han, H. Dynamic analysis of the coupling coordination relationship between urbanization and water resource security and its obstacle factor. Int. J. Environ. Res. Public Health 2019, 16, 4765. [Google Scholar] [CrossRef] [PubMed] [Green Version]
  50. Regional Planning of the Yangtze River Delta Region. National Development and Reform Commission, 2011. Available online: http://www.gov.cn/zwgk/2010-06/22/content_1633868.htm (accessed on 16 March 2020).
  51. Development Plan of the Yangtze River Delta Urban Agglomerations. National Development and Reform Commission and Ministry of Housing and Urban-Rural Development, 2016. Available online: https://www.ndrc.gov.cn/xxgk/zcfb/ghwb/201606/t20160603_962187.html (accessed on 16 March 2020).
  52. Cooperation Agreement on Environmental Protection in the Yangtze River Delta Region. Environmental Protection Department of Shanghai, Zhejiang, Jiangsu and Anhui, 2008. Available online: http://www.gov.cn/gzdt/2008-12/16/content_1179119.htm (accessed on 16 March 2020).
  53. Declaration on Urban Environmental Cooperation (Hefei) in in the Yangtze River Delta. The Governments of Member Cities, 2013. Available online: http://www.anhuinews.com/zhuyeguanli/system/2013/04/22/005603527.shtml (accessed on 16 March 2020).
Figure 1. Study area.
Sustainability 12 05620 g001
Figure 2. Overview of the research framework.
Sustainability 12 05620 g002
Figure 3. Relationship of coupling coordination between urbanization and ecological environment.
Sustainability 12 05620 g003
Figure 4. The spatiotemporal distribution of FVC (fraction vegetation coverage) in the central region of the Yangtze River Delta from 2008 to 2017 ((aj) are the distribution maps from 2008 to 2017).
Sustainability 12 05620 g004aSustainability 12 05620 g004b
Figure 5. The overall performance of SUHI (surface urban heat island intensity) from 2008 to 2017.
Sustainability 12 05620 g005
Figure 6. The SUHI of cities from 2008 to 2017.
Sustainability 12 05620 g006
Figure 7. The overall performance of the urbanization level from 2008 to 2017.
Sustainability 12 05620 g007
Figure 8. The urbanization level of cities from 2008 to 2017.
Sustainability 12 05620 g008
Figure 9. The spatiotemporal distribution of the urbanization level from 2008 to 2017.
Sustainability 12 05620 g009
Figure 10. The overall performance of the eco-environment level from 2008 to 2017.
Sustainability 12 05620 g010
Figure 11. The eco-environment level of cities from 2008 to 2017.
Sustainability 12 05620 g011
Figure 12. The spatiotemporal distribution of the eco-environment level from 2008 to 2017.
Sustainability 12 05620 g012
Figure 13. Trend for coupling coordination degree of the cities from 2008 to 2017.
Sustainability 12 05620 g013
Figure 14. The overall performance of coupling coordination degree from 2008 to 2017.
Sustainability 12 05620 g014
Figure 15. Graduated map of coupling coordination degree between urbanization and eco-environment of the cities from 2008 to 2017.
Sustainability 12 05620 g015
Table 1. Data summary.
CategoryDataTimeFormat
Remote sensing imagesLandsat 5 TM2008–2012 (Summer)Raster
Landsat 7 ETM+2008–2017 (Summer)Raster
Landsat 8 OIL/TIRS2013–2017 (Summer)Raster
Statistical dataChina Urban Construction Statistical Yearbook2008–2017Text
China City Statistical Yearbook2008–2017Text
Shanghai Statistical Yearbook2008–2017Text
Jiangsu Statistical Yearbook2008–2017Text
Zhejiang Statistical Yearbook2008–2017Text
Anhui Statistical Yearbook2008–2017Text
National economic and social development statistical bulletin of each city2008–2017Text
Geographic ancillary dataAdministrative boundary data2017Vector
Urban built-up area data2010Vector
Table 2. Index system for urbanization and the ecological environment.
SubsystemIndexIndicatorReference
UrbanizationDemographic urbanization index (DUI)Urban population density (Person/km2) (U1) *[4,5,6,20,25,32,33]
Percentage of employed population in the tertiary industries (%) (U2)[4,5,23,46]
Landscape urbanization index (LUI)Urbanization rate (%) (U3)[23,25,29,33]
Urban road area per capita (m2) (U4)[4,23,29,31,46]
Proportion of construction land in municipal districts (%) (U5)[23,31]
Economic urbanization index (EUI)GDP per capita (Yuan) (U6)[4,5,6,20,23,25,29,31,32,33,46]
Proportion of GDP contributed by the tertiary industries (%) (U7)[20,23,29,31,46]
Total fixed asset investment (10,000 Yuan) (U8)[23,29]
Social urbanization index (SUI)Per capita disposable income of urban residents (Yuan) (U9)[4,5,32,46]
Total retail sales of social consumer goods per capita (Yuan) (U10)[4,23,29,32,46]
Number of beds per 10,000 people (Bed) (U11)[6,23,46]
Ecological environmentEnvironmental quality index (EQI)Fraction of vegetation coverage (%) (E1)[46,47]
Park green area per capita in urban area (m2) (E2)[4,31,46,47]
Surface urban heat island intensity (°C) (E3) *[46,47]
Pollution loading index (PLI)Industrial wastewater discharge per 100 million Yuan output value (Ton) (E4) *[5,31,33,46]
Industrial sulfur dioxide emissions per 100 million Yuan output value (10,000 Tons) (E5) *[20,31,33,46,47]
Industrial soot emissions per 100 million Yuan output value(Ton) (E6) *[46,47]
Resource consumption index (RCI)Per capita annual water consumption of urban residents (Ton) (E7) *[5,29,31,46]
Electricity consumption of per 10,000 Yuan output value (kW·h) (E8) *[4,6,25,31,46]
Ecological governance index (EGI)Ratio of industrial solid wastes comprehensively utilized (%) (E9)[5,20,23,29,33,46]
Ratio of urban sewage centralized treated (%) (E10)[6,23,33,46,47]
Disposal rate of living garbage (%) (E11)[6,29,33,46,47]
* represents a negative indicator.
Table 3. The stages of coupling between urbanization and eco-environment.
Primary DivisionRangeSecondary DivisionTertiary Division
Balanced development0.8–1Superiorly balanced developmentSuperiorly balanced development of urbanization and environment (SBD)
With urbanization lagged (SBD-UL)
With eco-environment lagged (SBD-EL)
Transitional development0.6–0.8Basically balanced developmentBasically balanced development of urbanization and environment (BBD)
With urbanization lagged (BBD-UL)
With eco-environment lagged (BBD-EL)
Imbalanced development0.3–0.6Slightly imbalanced developmentSlightly imbalanced development of urbanization and environment (SLID)
With urbanization lagged (SLID-UL)
With eco-environment lagged (SLID-EL)
0–0.3Seriously imbalanced developmentSeriously imbalanced development of urbanization and environment (SID)
With urbanization lagged (SID-UL)
With eco-environment lagged (SID-EL)
Table 4. Graduated results of FVC.
GradeRange (%)Percentage (%)
2008200920102011201220132014201520162017
Low0–12.51.652.061.461.401.201.131.661.151.401.27
Low-middle12.5–25.03.033.462.822.522.672.622.452.362.352.61
25.0–37.55.655.155.055.054.934.885.024.934.624.72
Middle37.5–50.09.066.846.336.596.346.366.947.186.356.14
50.0–62.516.7118.3310.489.709.439.2810.3011.298.027.85
Middle-high62.5–75.022.2219.5321.8618.8818.9818.5217.3816.9811.8212.49
High75.0–87.520.6921.9426.7028.3626.4023.7324.2519.6219.2721.49
87.5–10020.9922.6925.3127.5030.0633.4832.0036.5046.1543.43
Table 5. Statistical results of the urbanization level.
RankRangeNumbers of Cities
2008200920102011201220132014201520162017
Level 10–0.204332000000
Level 20.20–0.351917141415127543
Level 30.35–0.50469108912131210
Level 40.50–0.6501114688710
Level 50.65–10000000144
Table 6. Statistical results of the eco-environment level.
RankRangeNumber of Cities
2008200920102011201220132014201520162017
Level 10–0.454311110000
Level 20.45–0.551514128642111
Level 30.55–0.65781013141818191615
Level 40.65–0.751245636688
Level 50.75–10000011123
Table 7. Obstacle degree of indices in the urbanization system (%).
IndexYear
2008200920102011201220132014201520162017
DUI8.649.059.088.869.6210.0410.5210.6511.2011.71
LUI20.5720.4020.6521.2821.9722.7123.6925.5126.8629.00
EUI31.9732.0231.8631.6931.5431.2630.6229.8328.9427.66
SUI38.8238.5338.4238.1736.8636.0035.1834.0133.0031.63
Table 8. The obstacle indicators of the urbanization system (%).
YearOrder
1234567891011
2008U9U8U6U10U11U5U2U7U4U3U1
18.0714.6311.1510.4710.2710.186.286.196.024.372.36
2009U9U8U6U10U11U5U2U7U4U3U1
17.9114.5911.2010.3810.2410.006.376.246.044.352.68
2010U9U8U6U11U10U5U7U2U4U3U1
17.7414.5710.7710.4510.2310.126.526.336.114.422.75
2011U9U8U5U6U11U10U7U2U4U3U1
18.0114.3810.6510.5710.489.686.746.386.154.482.47
2012U9U8U5U6U11U10U7U2U4U3U1
17.4814.2411.0810.4310.169.226.876.786.384.512.84
2013U9U8U5U6U11U10U2U7U4U3U1
17.2014.0511.5310.269.948.857.066.946.624.562.98
2014U9U8U5U6U11U10U2U4U7U3U1
16.7113.6612.1710.129.868.607.276.916.844.613.25
2015U9U5U8U6U11U10U2U4U7U3U1
16.1713.5313.2310.079.877.977.397.176.524.823.27
2016U9U5U8U6U11U4U2U10U7U3U1
16.0614.3512.739.809.617.637.477.326.414.883.73
2017U9U5U8U11U6U4U2U7U10U3U1
16.1815.7512.089.078.978.267.686.626.384.994.03
Table 9. Obstacle degree of indices in the eco-environment system (%).
IndexYear
2008200920102011201220132014201520162017
EQI11.9011.7710.4810.068.768.329.318.575.844.48
PLI61.5959.8559.5758.7759.3859.4958.5759.2857.5557.21
RCI18.3520.1822.7722.5924.7526.3625.5726.2929.6632.15
EGI8.168.207.188.587.115.836.545.866.956.15
Table 10. The obstacle indicators of the eco-environment system (%).
YearOrder
1234567891011
2008E5E6E8E4E1E10E9E3E7E11E2
30.5321.4815.609.597.814.042.842.822.751.281.27
2009E5E6E8E4E1E10E9E7E3E11E2
29.3120.7517.449.798.043.433.382.752.591.401.13
2010E5E6E8E4E1E7E9E10E3E11E2
29.8920.3519.849.337.172.932.912.802.391.470.92
2011E5E6E8E4E1E9E3E7E10E11E2
29.8220.1619.858.795.495.163.732.742.391.030.83
2012E5E8E6E4E1E9E3E7E10E11E2
30.4621.9320.288.644.963.513.042.822.161.440.76
2013E5E8E6E4E1E9E7E3E10E2E11
30.9623.4819.638.904.753.422.892.862.030.700.38
2014E5E8E6E4E3E1E9E7E10E11E2
30.2322.6619.978.374.354.303.902.911.900.740.66
2015E5E8E6E4E1E3E9E7E10E11E2
30.7323.1020.338.224.213.733.363.191.800.700.63
2016E5E8E6E4E9E1E7E3E10E11E2
30.1126.4619.088.364.813.253.202.301.540.610.29
2017E5E8E6E4E9E7E1E3E10E11E2
28.9928.7920.238.004.533.362.481.801.270.350.20

