Article

Sustainable Urban Planning Technique of Fire Disaster Prevention for Subway

1
Fire Disaster Prevention Research Center, National Incheon University, Incheon 22012, Korea
2
Department of Mechanical & Automotive Eng., Shinhan University, Uijeongbu 11644, Korea
*
Author to whom correspondence should be addressed.
Sustainability 2020, 12(1), 372; https://doi.org/10.3390/su12010372
Submission received: 3 December 2019 / Revised: 20 December 2019 / Accepted: 29 December 2019 / Published: 2 January 2020
(This article belongs to the Special Issue Sustainable Urban Planning Techniques)

Abstract

:
Subway infrastructure is a representative urban infrastructure for sustainable urban development as part of its policy to harmonize with economic growth. As the transportation infrastructure of large cities develops with high speed and intelligence, more attention will be paid to its safety. The main cause of death in subway fires is asphyxiation, due to the closed specificity of the underground space. Therefore, smoke exhaust facilities should be capable of minimizing the effects of smoke to ensure the safe evacuation of passengers in the event of fire. In this study, three kinds of fire locations are adopted to analyze the distribution of platform temperature, CO, and visibility in connection with the smoke exhaust system operation method. We evaluate the performance of the applicable smoke exhaust system from ASET-based untenable area analysis. Fatality evaluation by escape analysis according to the smoke exhaust system estimates the fatality based on the tenability performance evaluation. Moreover, the FED method was used to evaluate tenability performance. Therefore, the result of this study suggests a solution for sustainable subway Disaster response from the performance evaluation of the subway platform smoke exhaust system for safe evacuation of passengers, which is essential for subway construction or remodeling.

1. Introduction

To improve livability, subways are spotlighted as an alternative to solve traffic problems and environmental pollution problems of big cities in terms of mass transportation, low pollution, and low energy transportation. Therefore, transportation systems should be designed and operated in a way that protects the health (physical, mental, and social well-being) and safety of all people and enhances the quality of life in communities [1,2,3]. However, due to the nature of underground spaces, subways have limited smoke exhaust in the event of fire, so fire effluents and high-temperature environments threaten human survival. Accordingly, various disaster prevention facilities are mandatory by law in preparation for fire in the subway platform and tunnel sections [4]. Subway arson terrorism is one of the social disasters that targets an unspecified majority and has become a serious social problem nowadays [5]. Therefore, in order to secure passenger safety in subway fires, various kinds of studies have been carried out to maintain the platform as a safe evacuation environment. The related research mainly focused on fire characteristics such as temperature distribution, smoke concentration and radiant heat, according to heat release rate from fire, and disaster prevention in the field of life safety due to evacuation efficiency. Rie et al. [6] carried out an experimental study that clarified the fire smoke flow of the subway platform, for which the small-scale model of platform was used to identify characteristics of the ventilation fan and smoke exhaust by using particle image velocimetry. Giachetti et al. [7] used the small-scale model of the subway in Paris to examine the relationship between the compulsive ventilation and resulting flow pattern upon the occurrence of fire. Giachetti et al. [8] carried out a study on the Froude number that considered thermal buoyancy force and similarity to the small-scale model of the subway to trace the relationship between smoke exhaust and temperature. Authors applied a small-scale model to examine the flow phenomena of the smoke generated from the fire experimentally. Li et al. [9] verified the performance of the smoke exhaust of the fire safety equipment by using the FDS of performance-based design in the ocean currents and fishery industry. Jun et al. [10] examined the problems of code-based design to identify ways of enhancing the fire risk assessment of high-rise buildings and emphasized the importance of scenarios for each cluster as a means of minimizing human casualties. Al et al. [11] established the referral information base to reduce fatalities and the risk of fire and to develop instructive guidelines for the application of performance-based firefighting design with the sustainable building design. Authors emphasized that the equilibrium between fire safety and sustainability is necessary for the application of the performance-based design. Till et al. [12] studied the operation of a desirable system as a study of means for finding and evaluating design solutions for subway fire scenarios. The current problems, disregarded by the standards of the subway and the incapability of fulfilling objectives set by the fire scenario, were identified in this study, and the importance of the system design pertinent to secure fire safety of the subway was emphasized. Xu et al. [13] conducted the preliminary study on future disaster management and emergency rescue in the urban underground space. The fire, occurring in the tunnel, seriously affects visibility as well as particulate matter, carbon monoxide and nitrogen oxides. Thus, the importance of the control of air-quality in the disaster prevention system of the large urban underground space was emphasized. Li et al. [14] suggested the Petrinet-based approach for the modeling and analysis of the time required for the emergency reaction process for fire occurrences in the subways and resource problems thereof. For the minimization of damages from fire in the subways, the definition and methodology of the reactive processes against fire in the subways were verified to identify resource conflict detection in minimizing time required for reaction and to prioritize pertinent processes. Wu et al. [15] applied the comprehensive model based on the Bayesian network (BN) and the Delphi method to raise the accuracy of the fire extinguishing process and results against fires in subways, and quantified the factors impacting consequences of fires, of causes of fires, and of preventive measures against fires to propose methods for emergency decision-making. Ying et al. [16] studied the need for emergency response training for fires in subways. The study assessed the confidence of subway users in public traffic safety and reported the lack of response by subway users and operating organizations to health, emergency, disaster, and risk management for urban public transport safety. Panagiotis et al. [17] suggested the Stochastic-based SIREN as a quantitative assessment of risk in the underground space. The assessment used the probabilistic approach to appraise aerial current in tunnel of underground space and trapped-users evacuation, wherein the applied trapped-users loss was determined by conducting traditional Monte Carlo Simulation.
The previous studies can be divided into (1) fire disaster prevention design and (2) fire disaster prevention response. However, the research for the actual fire risk of the subway must be verified and improved from the quantitative risk assessment by the concept of user-centered space safety assessment linked to the design performance of the operating equipment.
However, the smoke exhaust system, which is an essential part of the subway platform, can cause disasters such as the 2003 Daegu subway fire disaster if it is not properly designed and operated in terms of fire preparedness and response. A typical hazard factor of subway fires is the characteristics of the smoke flow pattern, and the main cause of death, asphyxiation, is due to the coincidence of the smoke flow direction and evacuation direction from the smoke’s chimney effect [18,19,20]. The most important factor in the case of subway fires is to ensure the safety of evacuees as well as to create a safe evacuation environment in the event of a fire from the construction of an optimized design of the smoke control system and the associated disaster preparedness training [21,22]. Therefore, the response in case of fire at subway platforms should be built to ensure safety of the evacuee by combining the exhaust/air supply of ventilation facilities installed in platforms, tracks, and tunnels [23,24,25,26]. In general, subway platforms are equipped with an air supply/exhaust system for air conditioning, a track exhaust system for handling train heat, and a tunnel exhaust system that is installed for ventilation and emergency smoke exhaust at both ends of the station, and in the case of fire occurring, it is possible to use these systems as a smoke control/smoke exhaust system [27,28]. Therefore, the selection and application of the operating mode of the optimized smoke exhaust system is essential for efficient fire effluent exhaust and requires careful design, with the aim of minimizing human injury [29]. Nevertheless, in the case where a platform screen door (PSD) is installed for the purpose of cooling the subway platform and preventing passengers falling on the track, there is a problem in that it is operated independently without integration with the existing smoke exhaust system [30,31]. The solution to this problem has been made possible by the development of high-performance computers that are capable of processing large amounts of data. In addition, the accuracy of three-dimensional platform real-time fire analysis is increased by the development of computer fire dynamics that are capable of numerical analysis. In general, the optimization of the smoke exhaust system is verified by the smoke exhaust in the fire space, so accurate reflection of the characteristics of the fire and structure is a prerequisite for the validation of a smoke exhaust system that is effective for evacuation [32,33,34]. In the case of Seoul capital and Gyeonggi province, which is the capital region, it is necessary to more actively plan and construct subways using deep underground space, in order to prepare for problems, such as the supply and demand of land resources and the depletion of urban resources due to increasing population and urban overcrowding, as well as secure alternative spaces for the efficient use and development of urban spaces [35].
In Korea, the GTX subway line in the Seoul metropolitan area is one of the main methods, and Figure 1 shows the line map.
This study focuses on the fire disaster prevention of the Great Train eXpress (GTX) metropolitan express train, which is a part of the high-speed regional railway network, which is planned to utilize deep underground space [36,37]. The total length of the GTX line-A will be 76.9 km. Train speed will operate at an average speed of 116 km/h—three-to-four times faster than the standard metro—and will significantly reduce travel time within the Seoul Capital Area [38]. Since the GTX line has an average distance of 10–20 km between stations and average depth of 40 m underground, which is twice the average depth of Seoul subway, it requires a higher level of safety in the case of an emergency. With this background, the scenario applied in this study that reflects the trend of construction of semi-high-speed subways with increasing distances between subway tunnel sections was applied to the condition that a train fire occurred while driving in the tunnel section, and evacuation started after arriving at the platform. Evacuation safety assessments are made in a combinable smoke exhaust operational mode of platform and aim to present the safest operational mode from the estimates of possible fatalities.

2. Analytical Operational Model

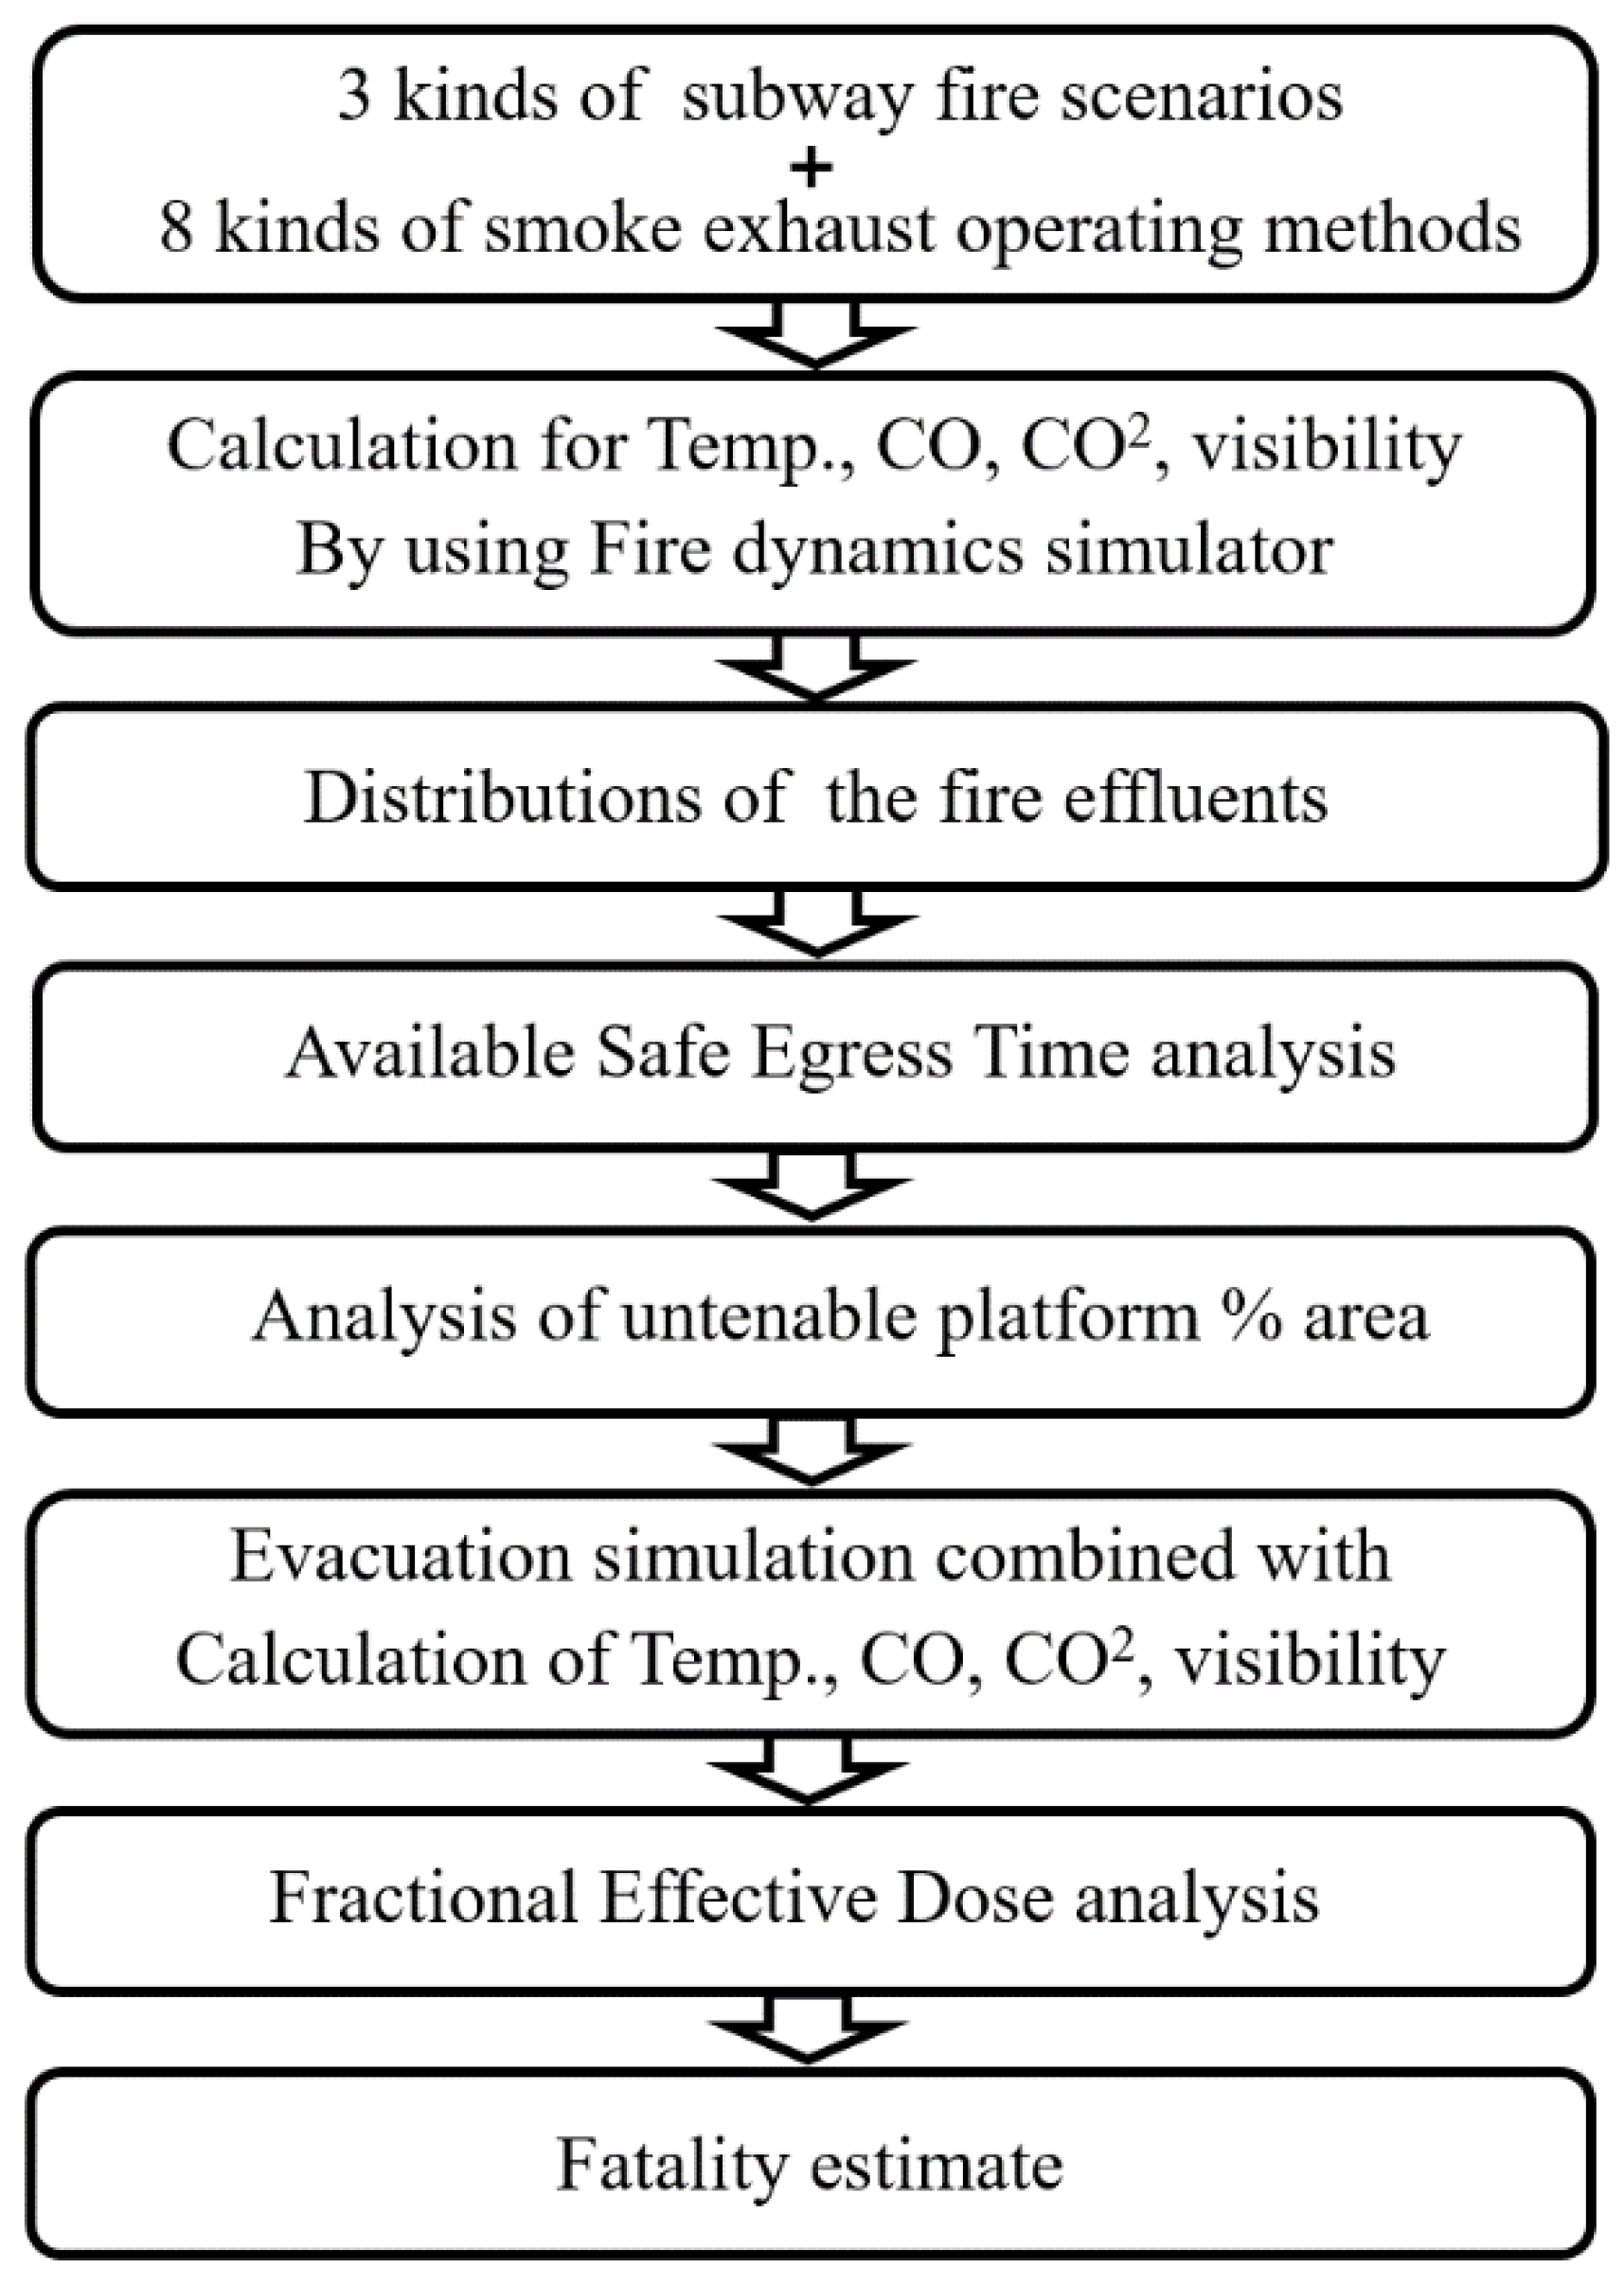
2.1. Fire Analysis Condition

The fire analysis tool used in this research is Fire Dynamics Simulator (FDS) Ver.6 of NIST, which at present is the most commonly used tool for fire analysis [39]. The heat release rate of the fire train was based on the fire growth curve provided by the Korea Railroad Research Institute. The yield of smoke and yield of CO for fire simulation were adopted as (0.133 and 0.168) g/gfuel, respectively [40]. The fire growth curve applied in this study reflects the heat release characteristics of the interior materials of trains made by applying flame retardant materials after the Daegu subway fire disaster in 2003. It has the characteristics of the heat release rate growing rapidly from 785 s after ignition, reaching a maximum heat release rate of 15 MW after about 1 min, and being rapidly extinguished after 1100 s.
Figure 2 compares the heat release rates of the general interior materials applied in previous studies (a) and the flame-retardant interior materials applied in this study (b) [40]. It can be seen that there is a big difference in heat release rate between flame retardant interior materials and general interior materials.
The fire locations of the train were selected to be representative of three kinds of platform stop position of the train, as 1st, 3rd, and between 4th and 5th passenger trains. The 4th–5th train fire means that the simultaneous fire condition for half of the 4th and half of the 5th passenger cars. This fire scenario means that train fire occurs in the center of the platform. The HRR in Figure 2b was applied as the fire design value of the FDS and obtained at every 30 s of the fire effluents database of the temperature; radiative intensity; CO, CO2, and O2 concentrations; and visibility that exists at the height 1.8 m above the platform. The evaluation of the smoke exhaust system pursued in this study was carried out using self-developed evacuation analysis software, which increased accuracy by quantifying the individual risk by the FED by synchronizing the value of fire effluents at the same location as the evacuee’s real-time location [41,42,43].
Figure 3 shows a flow chart of the analysis applied in this study.

2.2. Evacuation Analysis and Estimation of Fatality

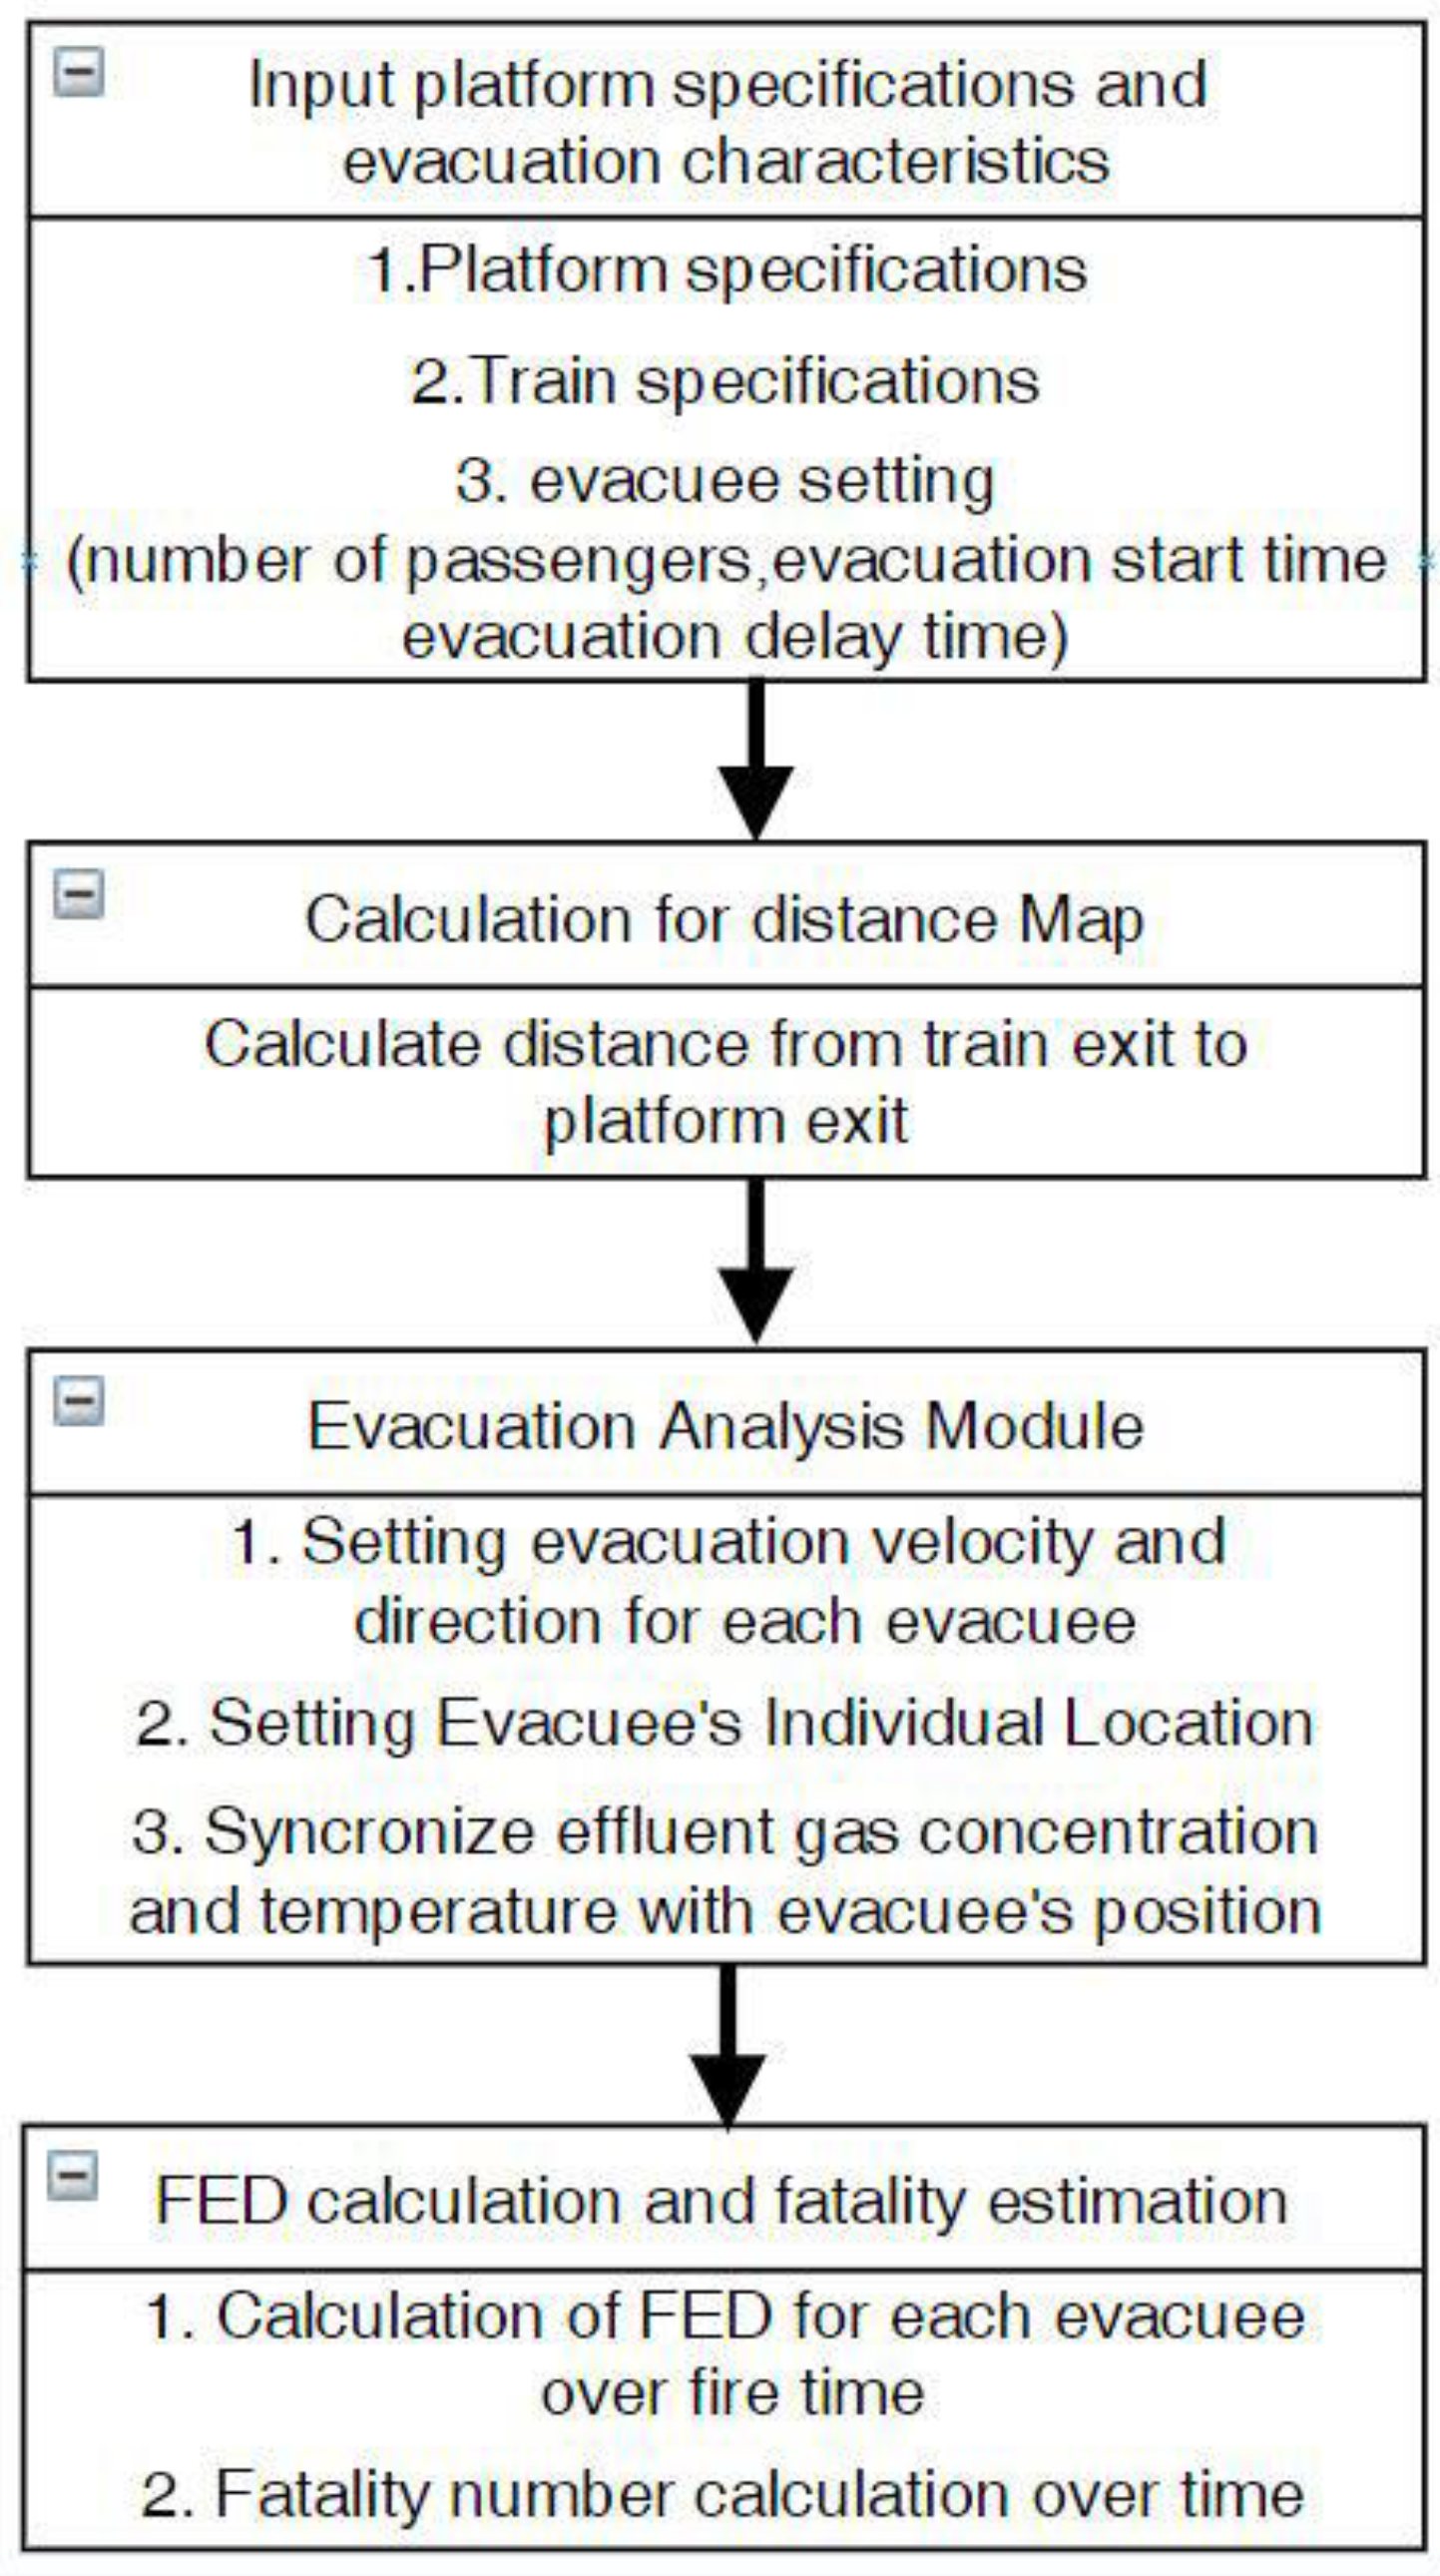
2.2.1. Evacuation Analysis Method

The possible location classification of subway fires can be divided into platform, and tunnel section. The evacuation method for passenger according to the fire that occurs while driving in the tunnel section takes into consideration the emergency stopping by using trackway escape, and the other method is using the platform by moving the fire subway to the platform. The former is only possible if the distance between the stations is short or if there is a rescue station installed.
In addition, the tunnel fire has the characteristic of a narrow tunnel space, so there have been many problems in solving a safe evacuation environment by effectively controlling the generated fire effluent [44,45,46,47,48]. In this study, as the worst scenario, the evacuation was carried out using a subway station platform with active fire protection facilities by moving fire trains to nearby stations. Therefore, the travel time required to move to the platform is the evacuation delay time, which is proportional to the length of the tunnel. In the event of a fire while the train is driving in a tunnel section, inevitably, it is impossible to reasonably assume the evacuation delay time.
Therefore, this study assumed 120, 240, 360, 480, 600, 660, 720, 785, 845, and 905 s as the evacuation start time, focusing on the platform arrival time of the fire train. Therefore, this time when the fire train stops on the platform from the fire occurrence has the same meaning as the evacuation delay time. In this analysis, the evacuation route is from the train to the entrance of the stairs leading from the platform to the upstairs. Figure 4 shows a flow chart of the analysis program that evacuates through the platform from the arrival fire train:
The evacuation program applied to this analysis has the following characteristics:
  • Evacuation start temperature is 40 °C.
  • The evacuee moves to the nearest path computed by the distance map for 24 directions at a 15-degree angle of radial distance from their position.
  • The walking speed of the evacuee is calculated as a function of the distance to the evacuee in the direction of movement, the evacuee density according to the direction of movement, and the visibility of smoke concentration.

2.2.2. Estimate of Fatalities
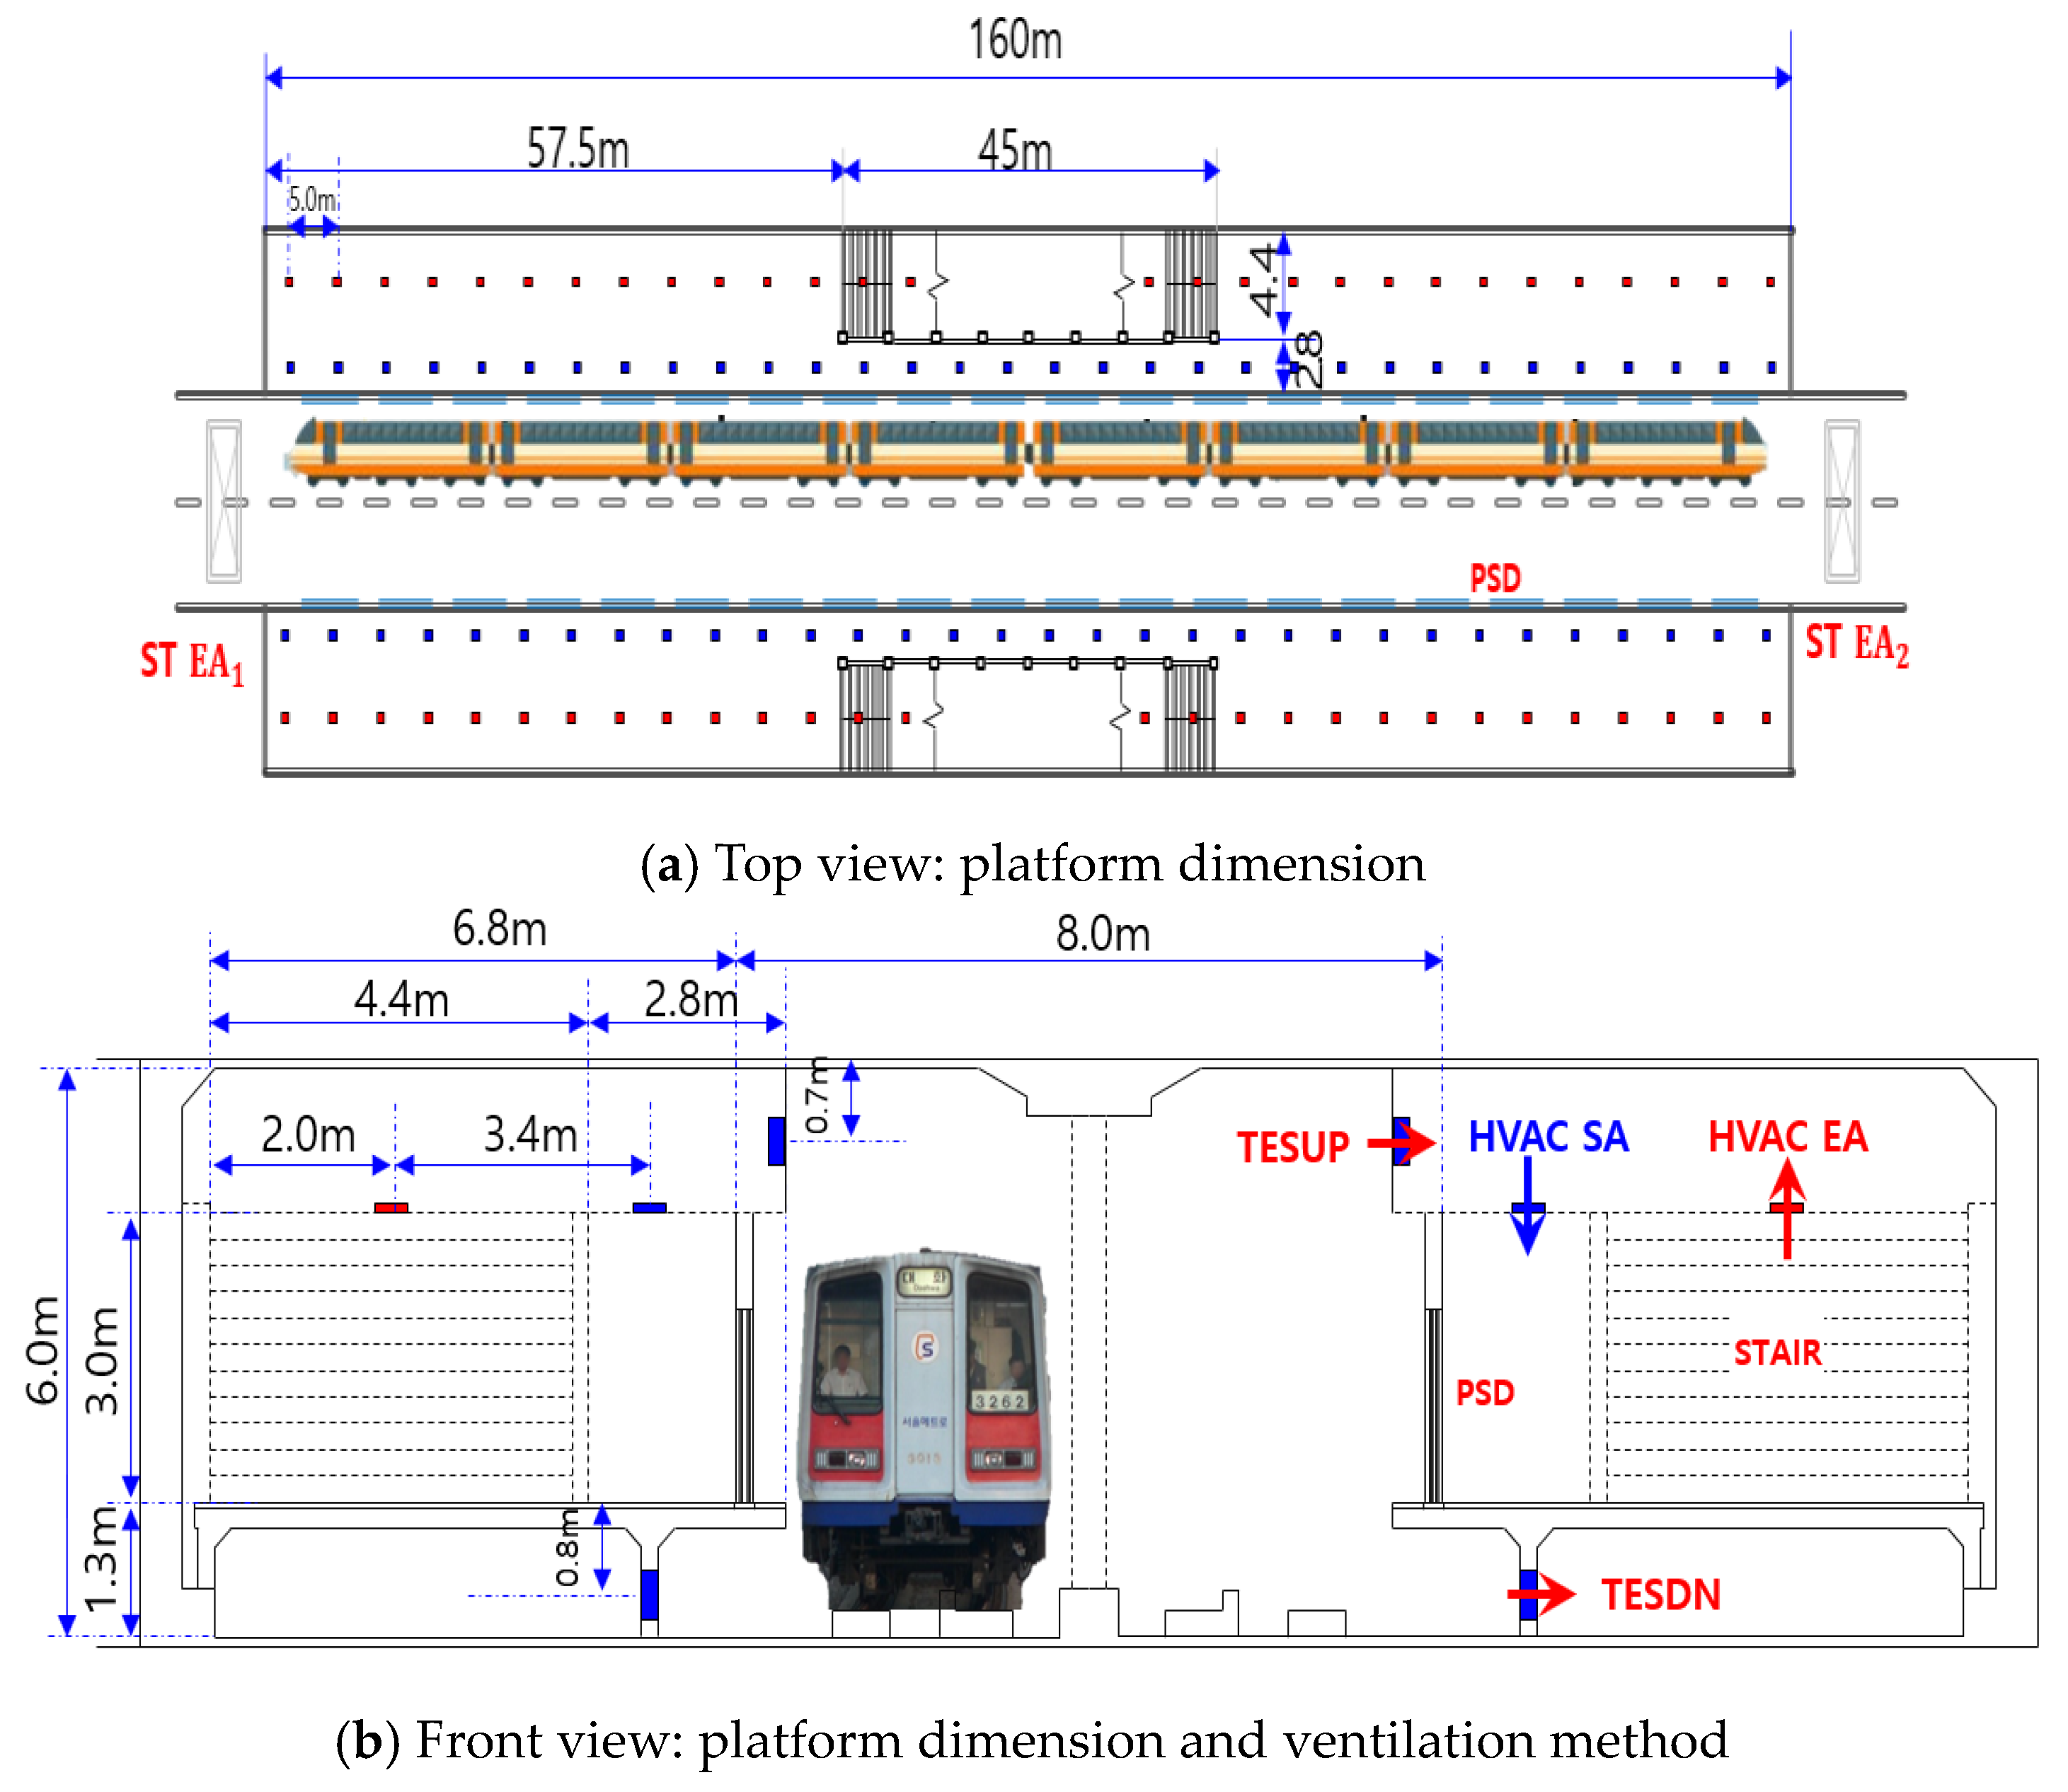
The basic concept of evacuation safety assessment is to assess whether evacuees can safely escape from the platform before being affected by fire risk effluents. The classical evaluation method of evacuation safety is regarded as a safe evacuation if the condition of ASET > RSET is satisfied from the comparison of ASET obtained from the fire analysis result and RSET obtained from the evacuation analysis [49,50]. However, since ASET > RSET is used as a judgment on the safe evacuation environment, it is impossible to quantitatively determine whether a fire effluent affects evacuee and causes death during the time taken along the evacuee evacuation route [51,52,53]. In addition, this evaluation method is likely to be overestimated, as it is considered a risk if there is any limit value for evacuation risk in space, regardless of the size of the danger zone. As a way to compensate this shortcoming, we applied fractional effective doses modeling to provide a powerful tool for estimating egress ability, incapacitation time, and the effects of lethal exposure on human exposure to fire [54,55]. The FED has the advantage of being able to quantitatively calculate the exposure effect from toxic fire effluent during the evacuee egress time through the subway platform [56,57,58,59,60]. FED is defined as the ratio of the cumulative dose (ppm · t) exposed to t (min) time, and the cumulative dose that leads to incapacitation or loss of consciousness. In this study, fractional effective dose for incapacitation due to asphyxiants was calculated using FED Equation (1), which is a mixture of Purser’s toxic gas exposure operational model and the US Federal Aviation Administration (FAA)’s temperature and radiative forcing operational model [61,62].
FED = ( F ICO + F IHCN )   × V CO 2 + F IO + F IHEAT + F IRAD
where FICO = fraction of an incapacitating dose of CO; FIHCN = fraction of an incapacitating dose of HCN; VCO2 = multiplication factor for CO2; FIO = Fractional effective dose for incapacitation by low-oxygen hypoxia; FIHEAT = fraction of an incapacitating dose of temperature; FIRAD = fraction of an incapacitating dose of radiation.
Therefore, the estimation of fatality of the evacuee can be quantitatively evaluated by applying FED equation as the concept of the individual evacuee’s passenger fire risk. The FED value of 1.0 means incapacitation of people who have average susceptibility to escape under the fire effluents environmental condition. However, threshold criteria of 0.3 can be used instead of the general population, by taking into account a more sensitive and vulnerable group to toxicity. In this analysis, it was set conservatively so that the fatality occurs when the accumulated FED sum exceeds 0.3 [63,64].

2.3. Platform Model

2.3.1. Specification of Platform

The subway platform applied in this study is the side type, where the platform is located on both sides of the track and has enough size to stop 8 subway cars (1 passenger train dimension: length 19.5 m, connecting part 1 m, width 3.2 m). The side type platform has 7.2 m width and 160 m length, with steps of 4.4 m width at positions of 57.5 and 102.5 m. The height and width of the subway track are 6.8 and 10.4 m, respectively.
Figure 5 shows the platform dimension and Figure 5a shows the platform modeling. Figure 5b shows the dimensions of the platform, and the applied ventilation method and installation position can be confirmed.
The entire ventilation system installed on the platform consists of three types of detailed systems:
(1)
Platform heating, ventilating, and air conditioning (HVAC) system.
(2)
Track Exhaust System (TES) to exhaust the track.
(3)
Station Exhaust System (SES) performing train wind mitigation and tunnel ventilation.
Table 1 shows the Platform supply and exhaust air flow rate for each smoke exhaust operational mode that is adopted in this simulation.

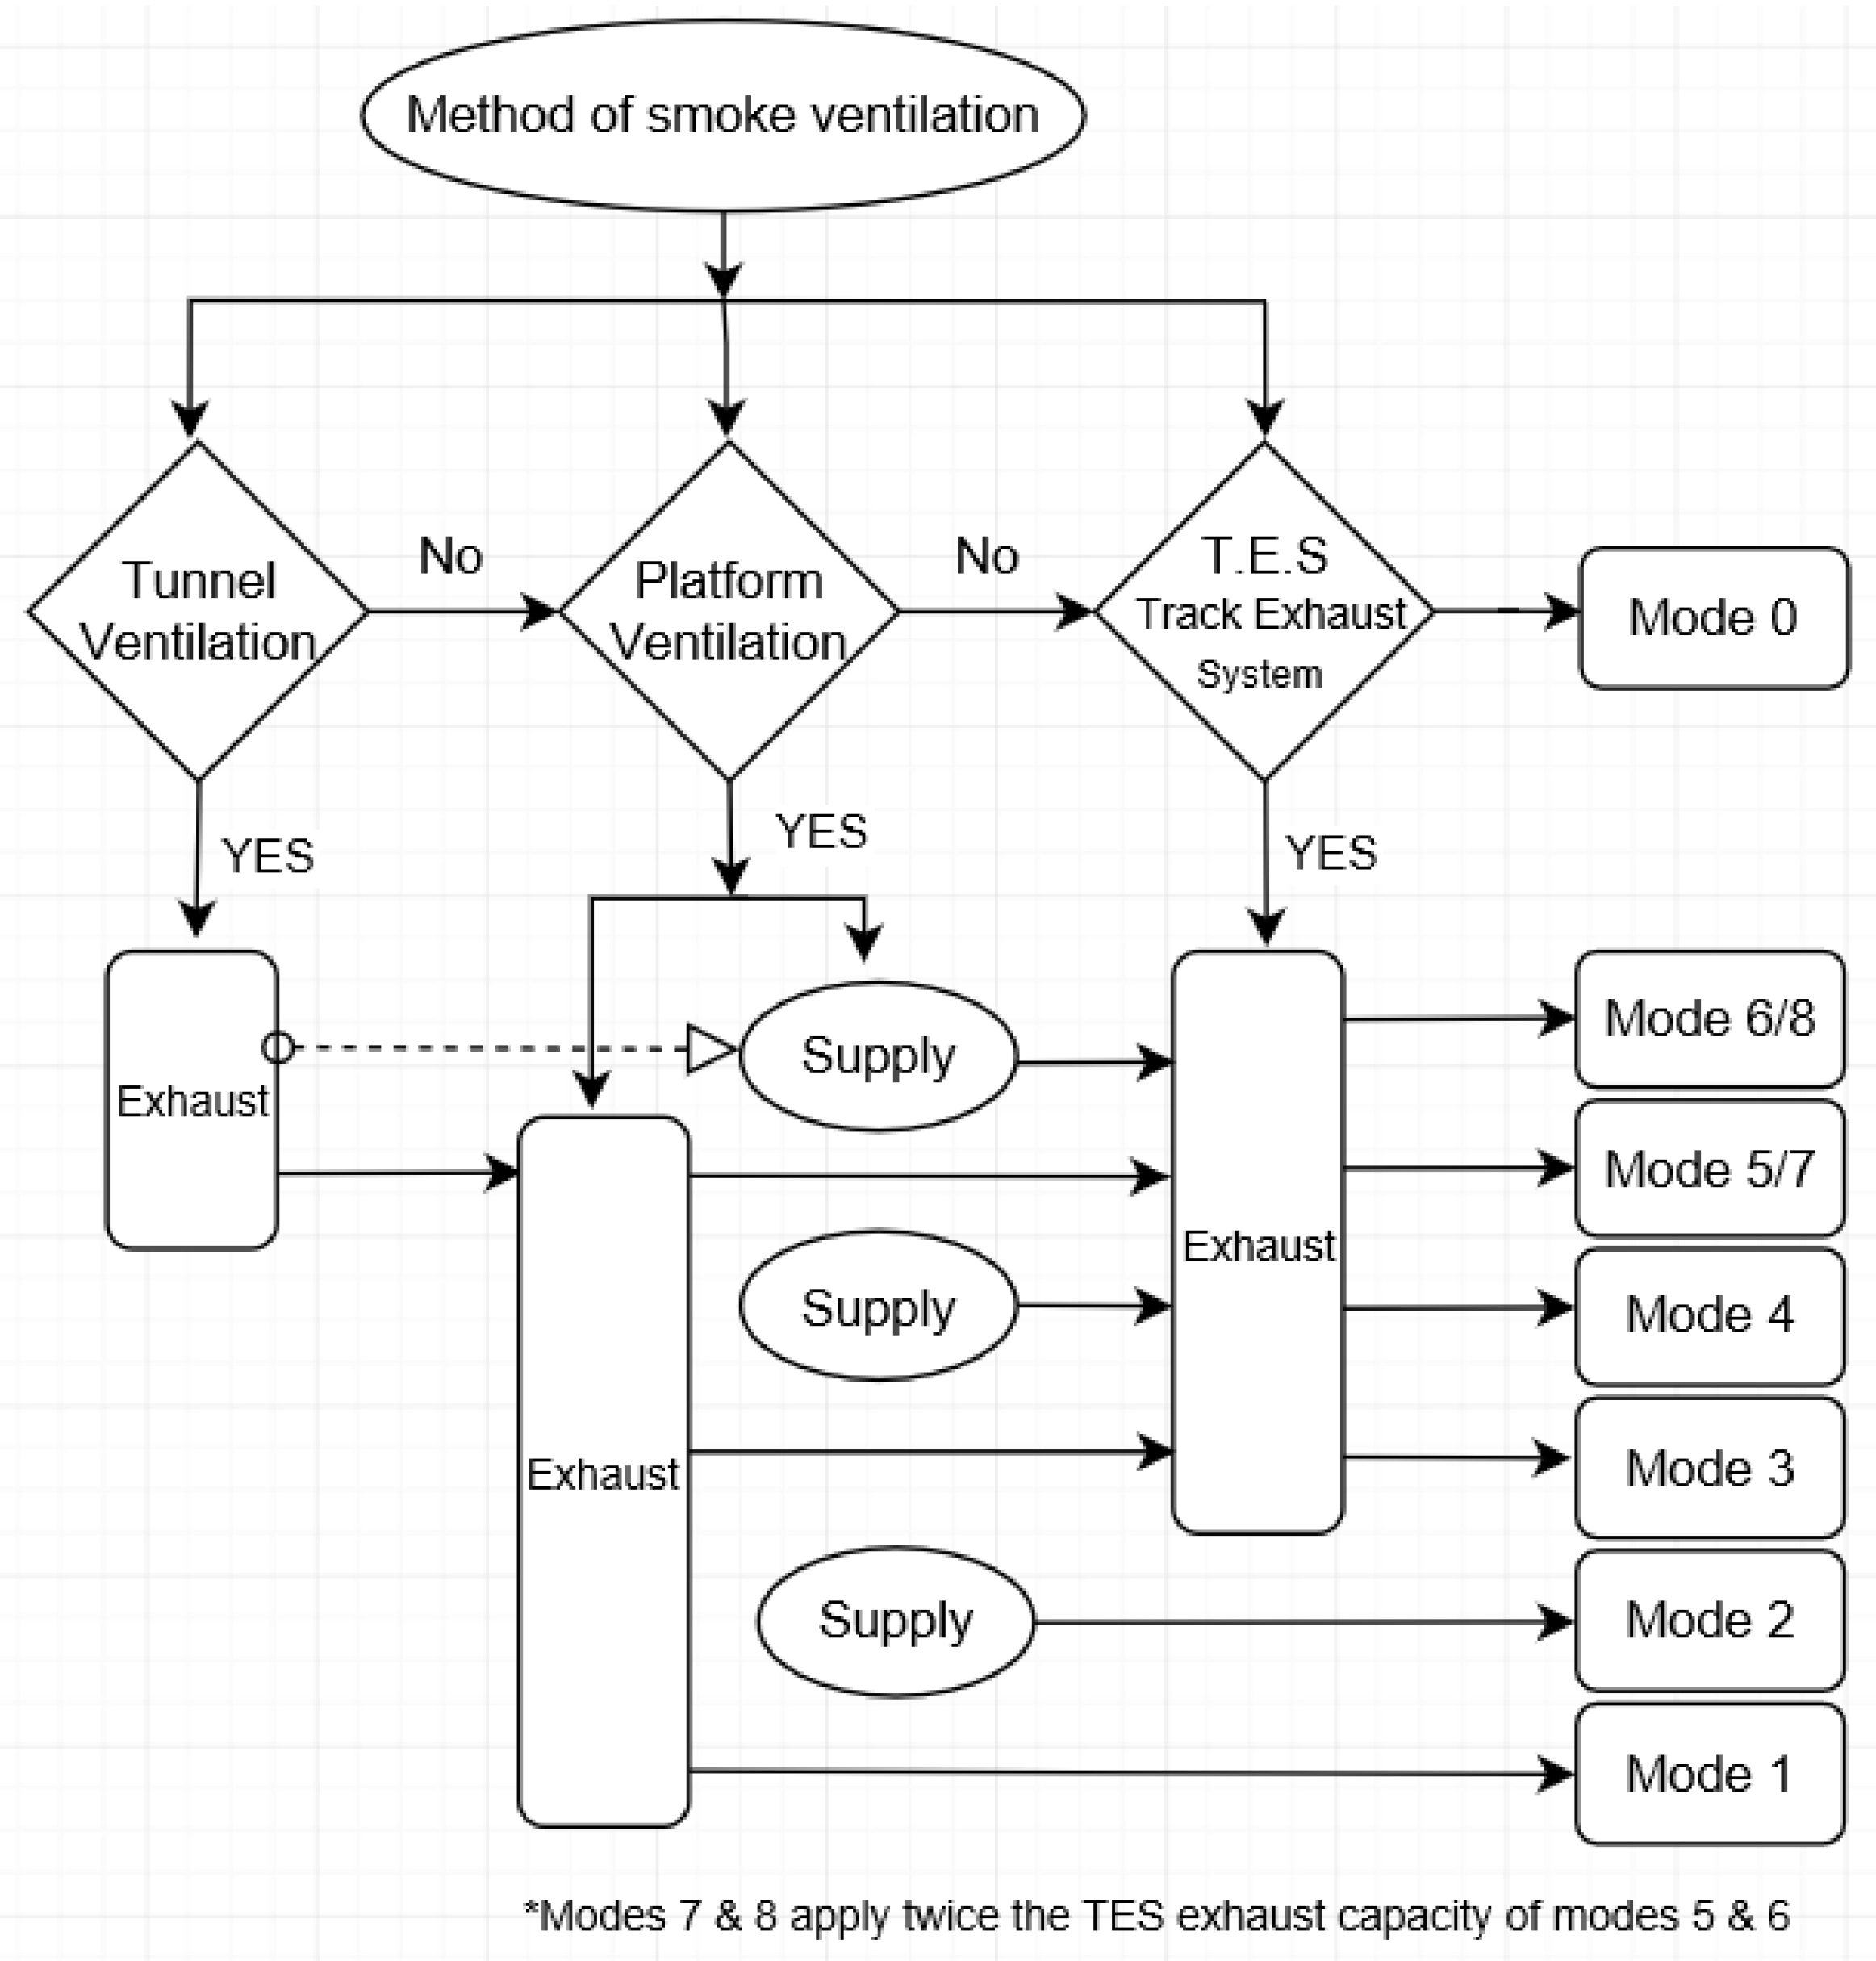
2.3.2. Smoke Exhaust Operational Modes

In an emergency, the smoke exhaust operational mode can be applied in a variety of ways, depending on the combined operation of the three ventilation systems applied to the platform.
In this study, eight smoke exhaust operational modes were considered, including the operational mode in which the entire system was not operated, as the worst-case condition, such as the interruption of the power supply to electrical equipment. Figure 6 shows the flow chart of the smoke exhaust operational modes. Each operation method is as follows:
  • Mode 1: operating the platform HVAC system only with air exhaust.
  • Mode 2: operating the platform HVAC system only by air supply.
  • Mode 3: Mode 1 + TES
  • Mode 4: Mode 2 + TES
  • Mode 5: Mode 1 + TES + SES
  • Mode 6: Mode 2 + TES + SES
  • Modes 7: Same as modes 5, but with 2 times the airflow amount of HVAC and TES of mode 5
  • Modes 8: Same as modes 6, but with 2 times the airflow amount of HVAC and TES of mode 6.
Modes 5 and 7 include all smoke exhaust systems applicable to the platform. The air volume of each mode 6 and 8 has been adopted as twice as each mode 5 and 7 in order to clarify the fire effluent’s effect to the evacuee by the increasing designed air volume.

3. Discussion

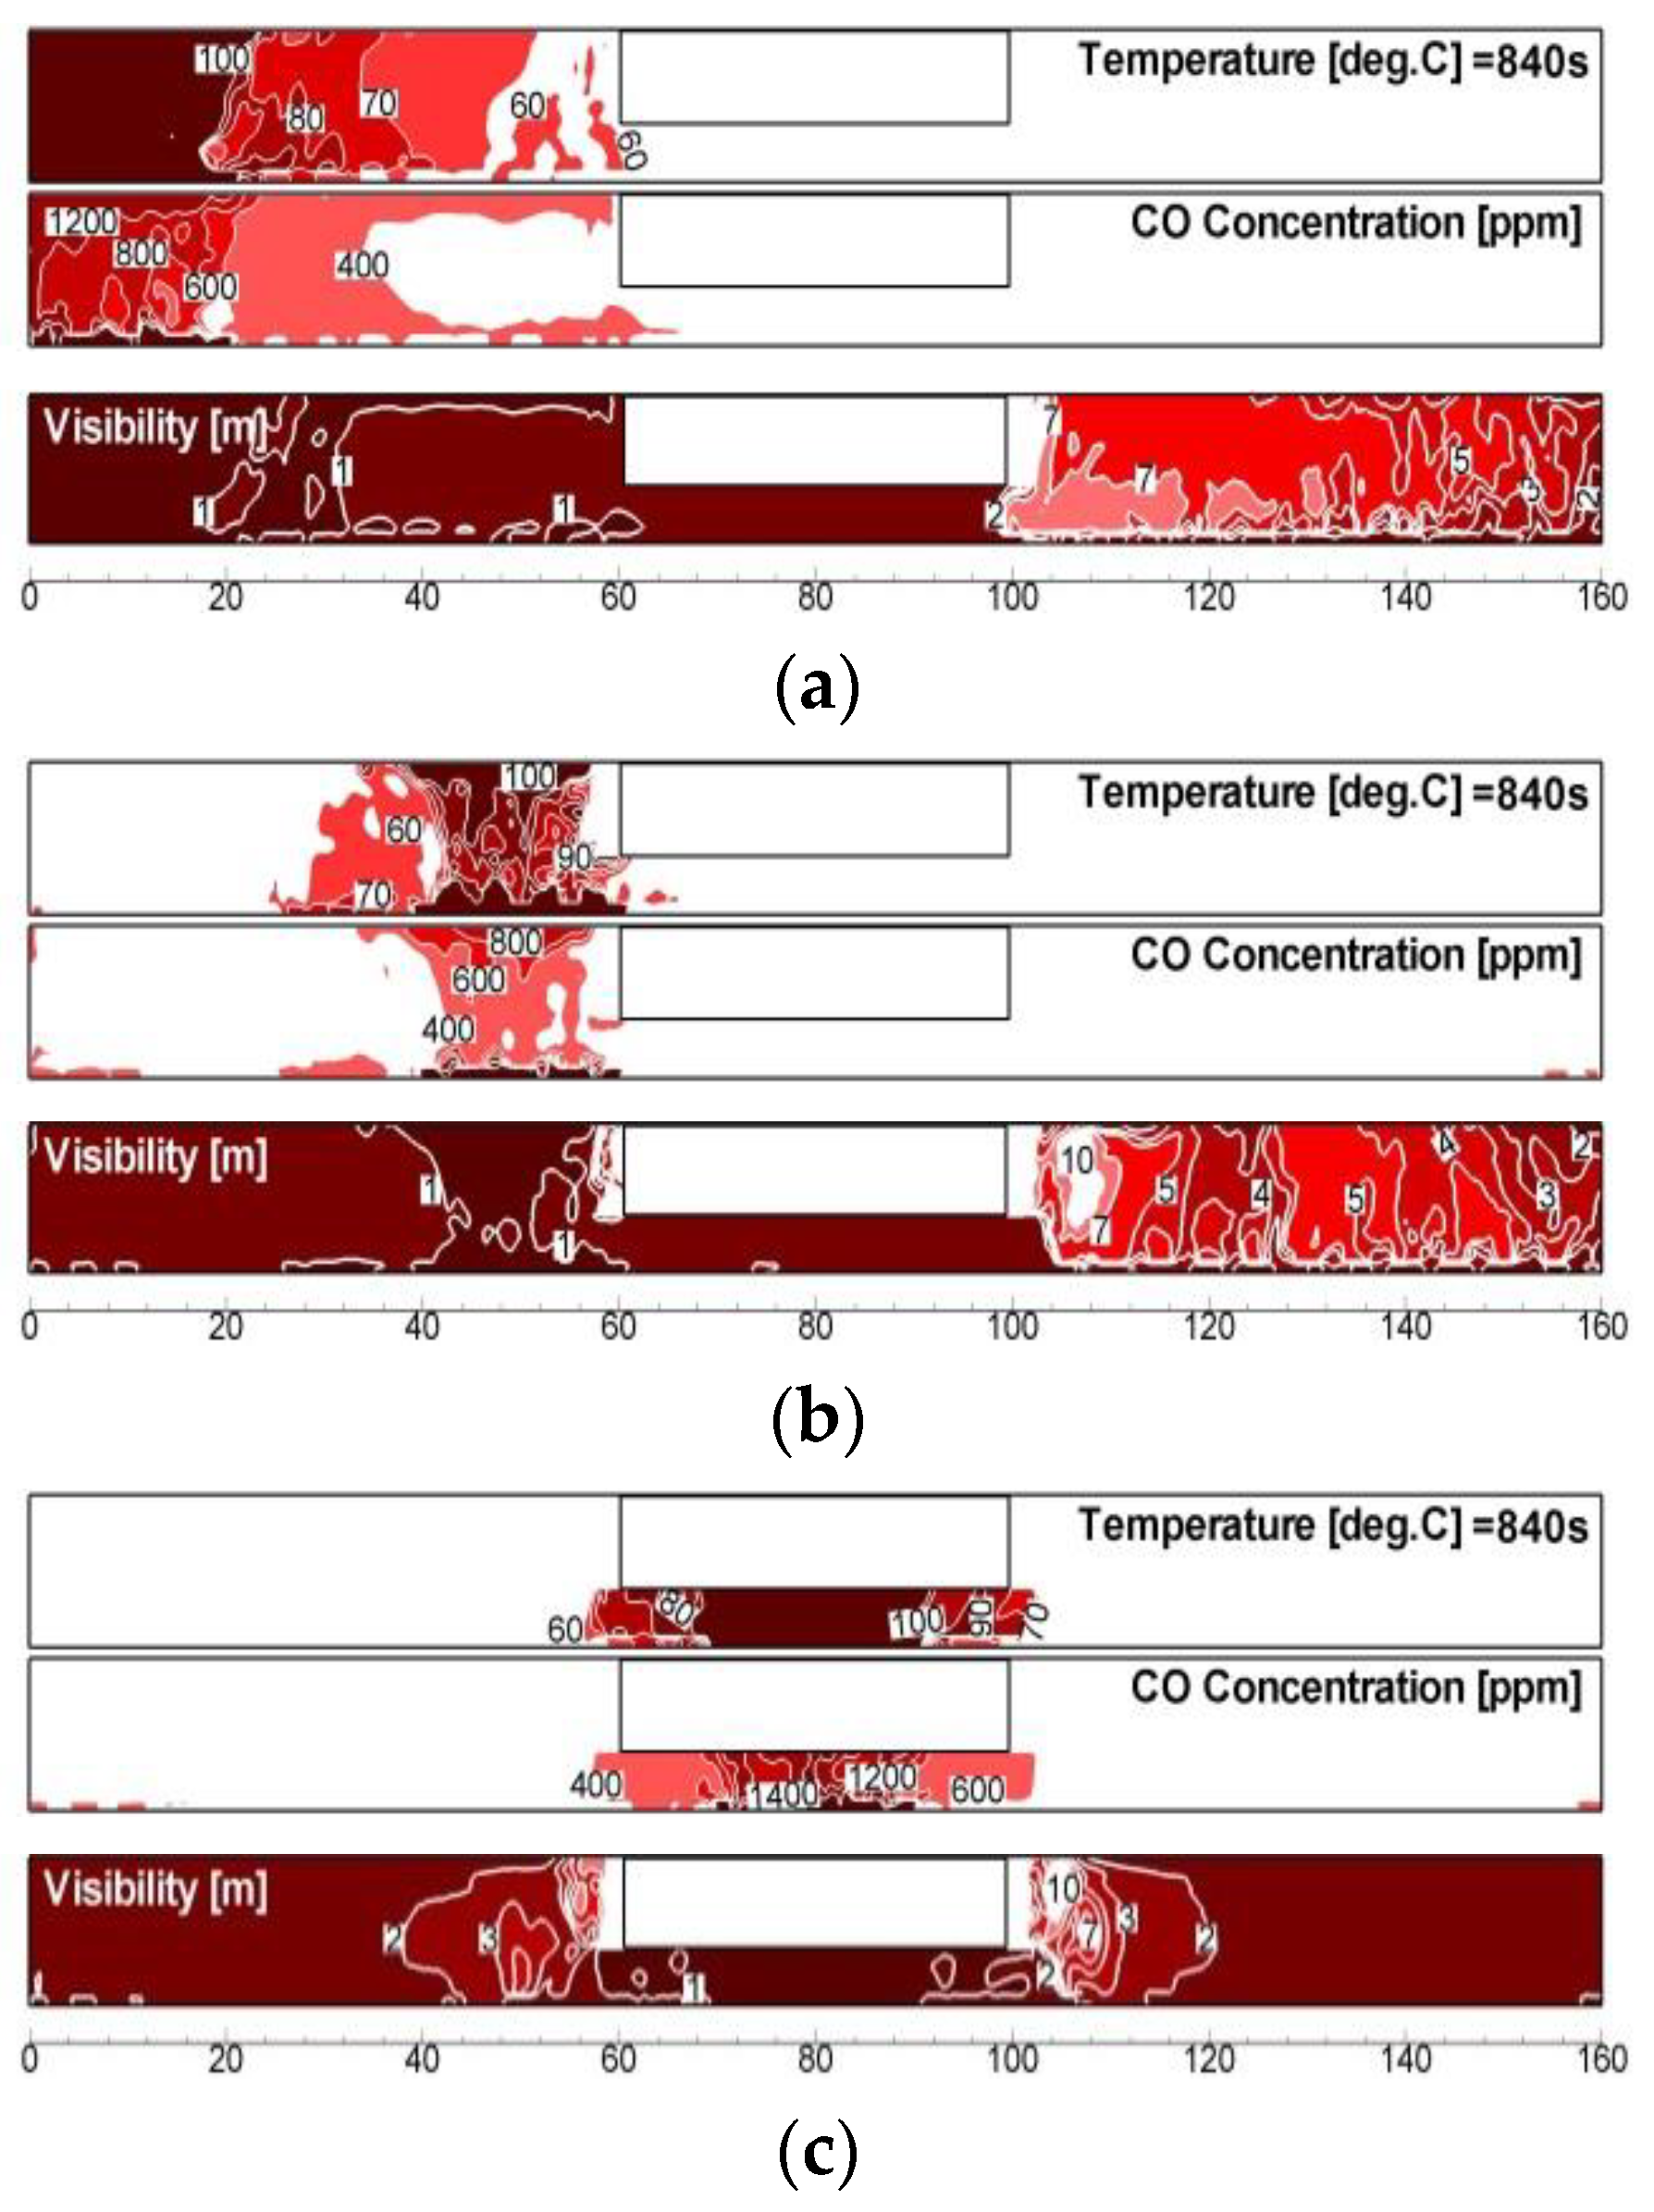
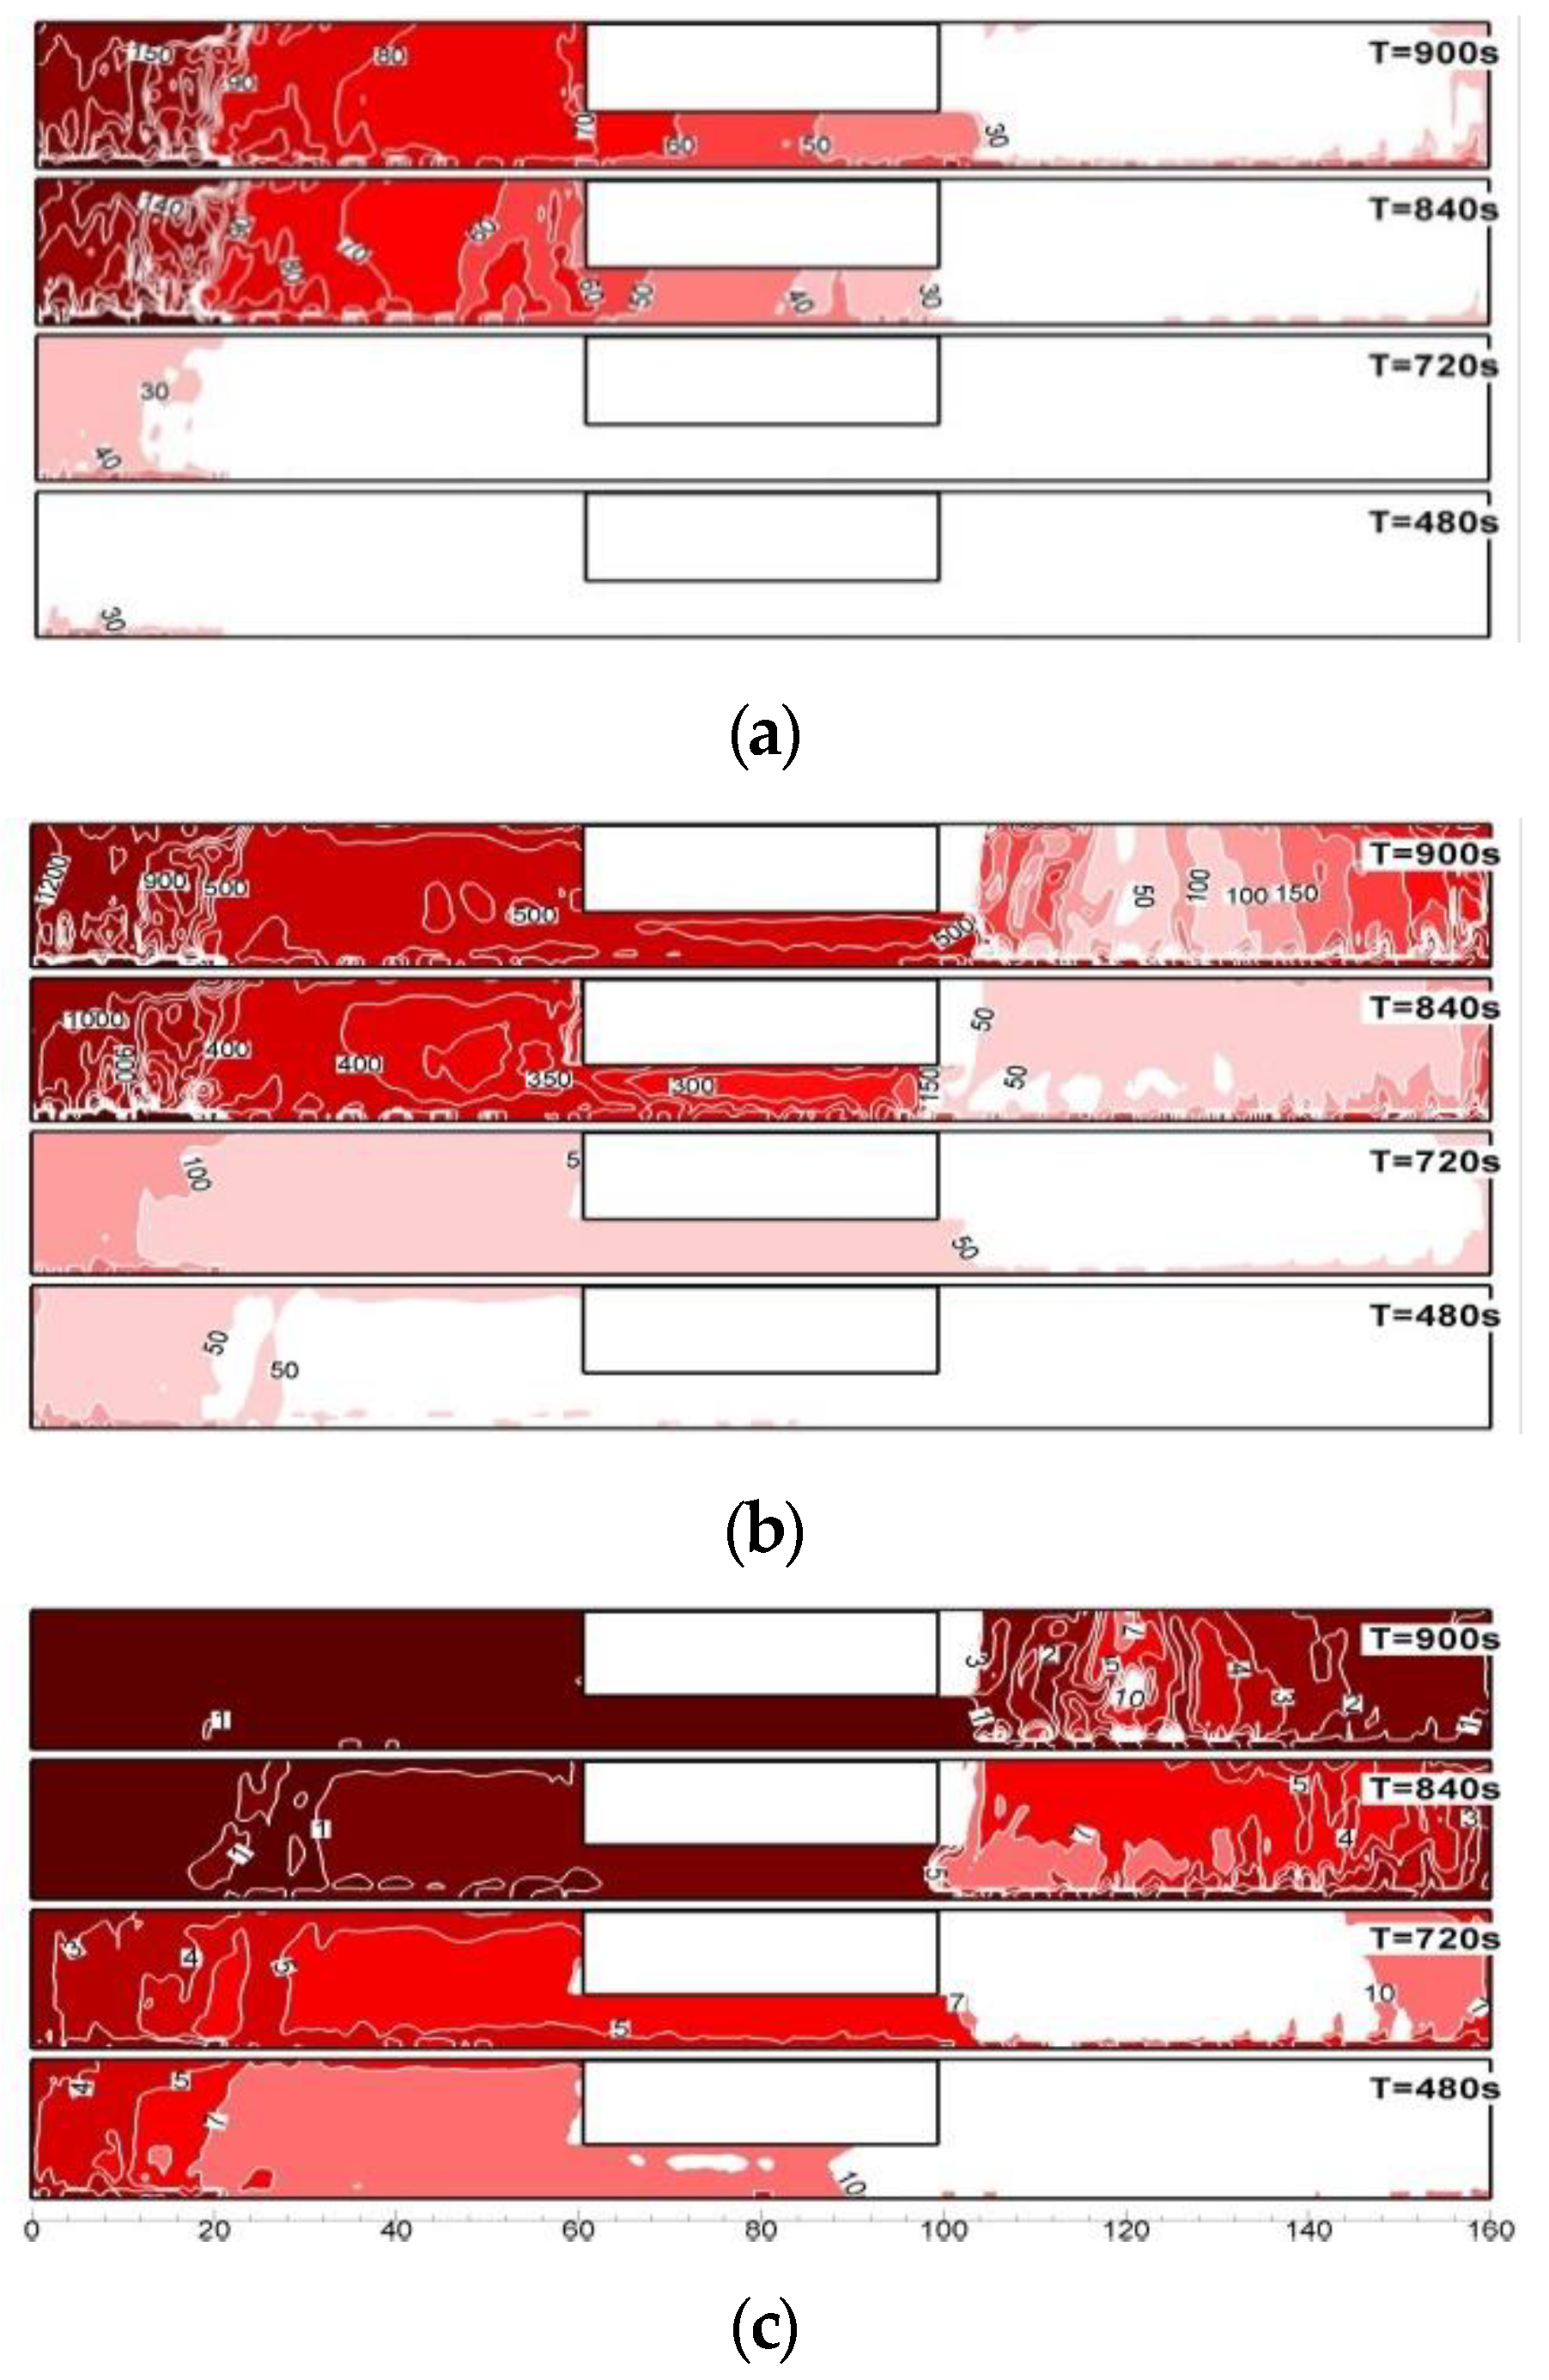
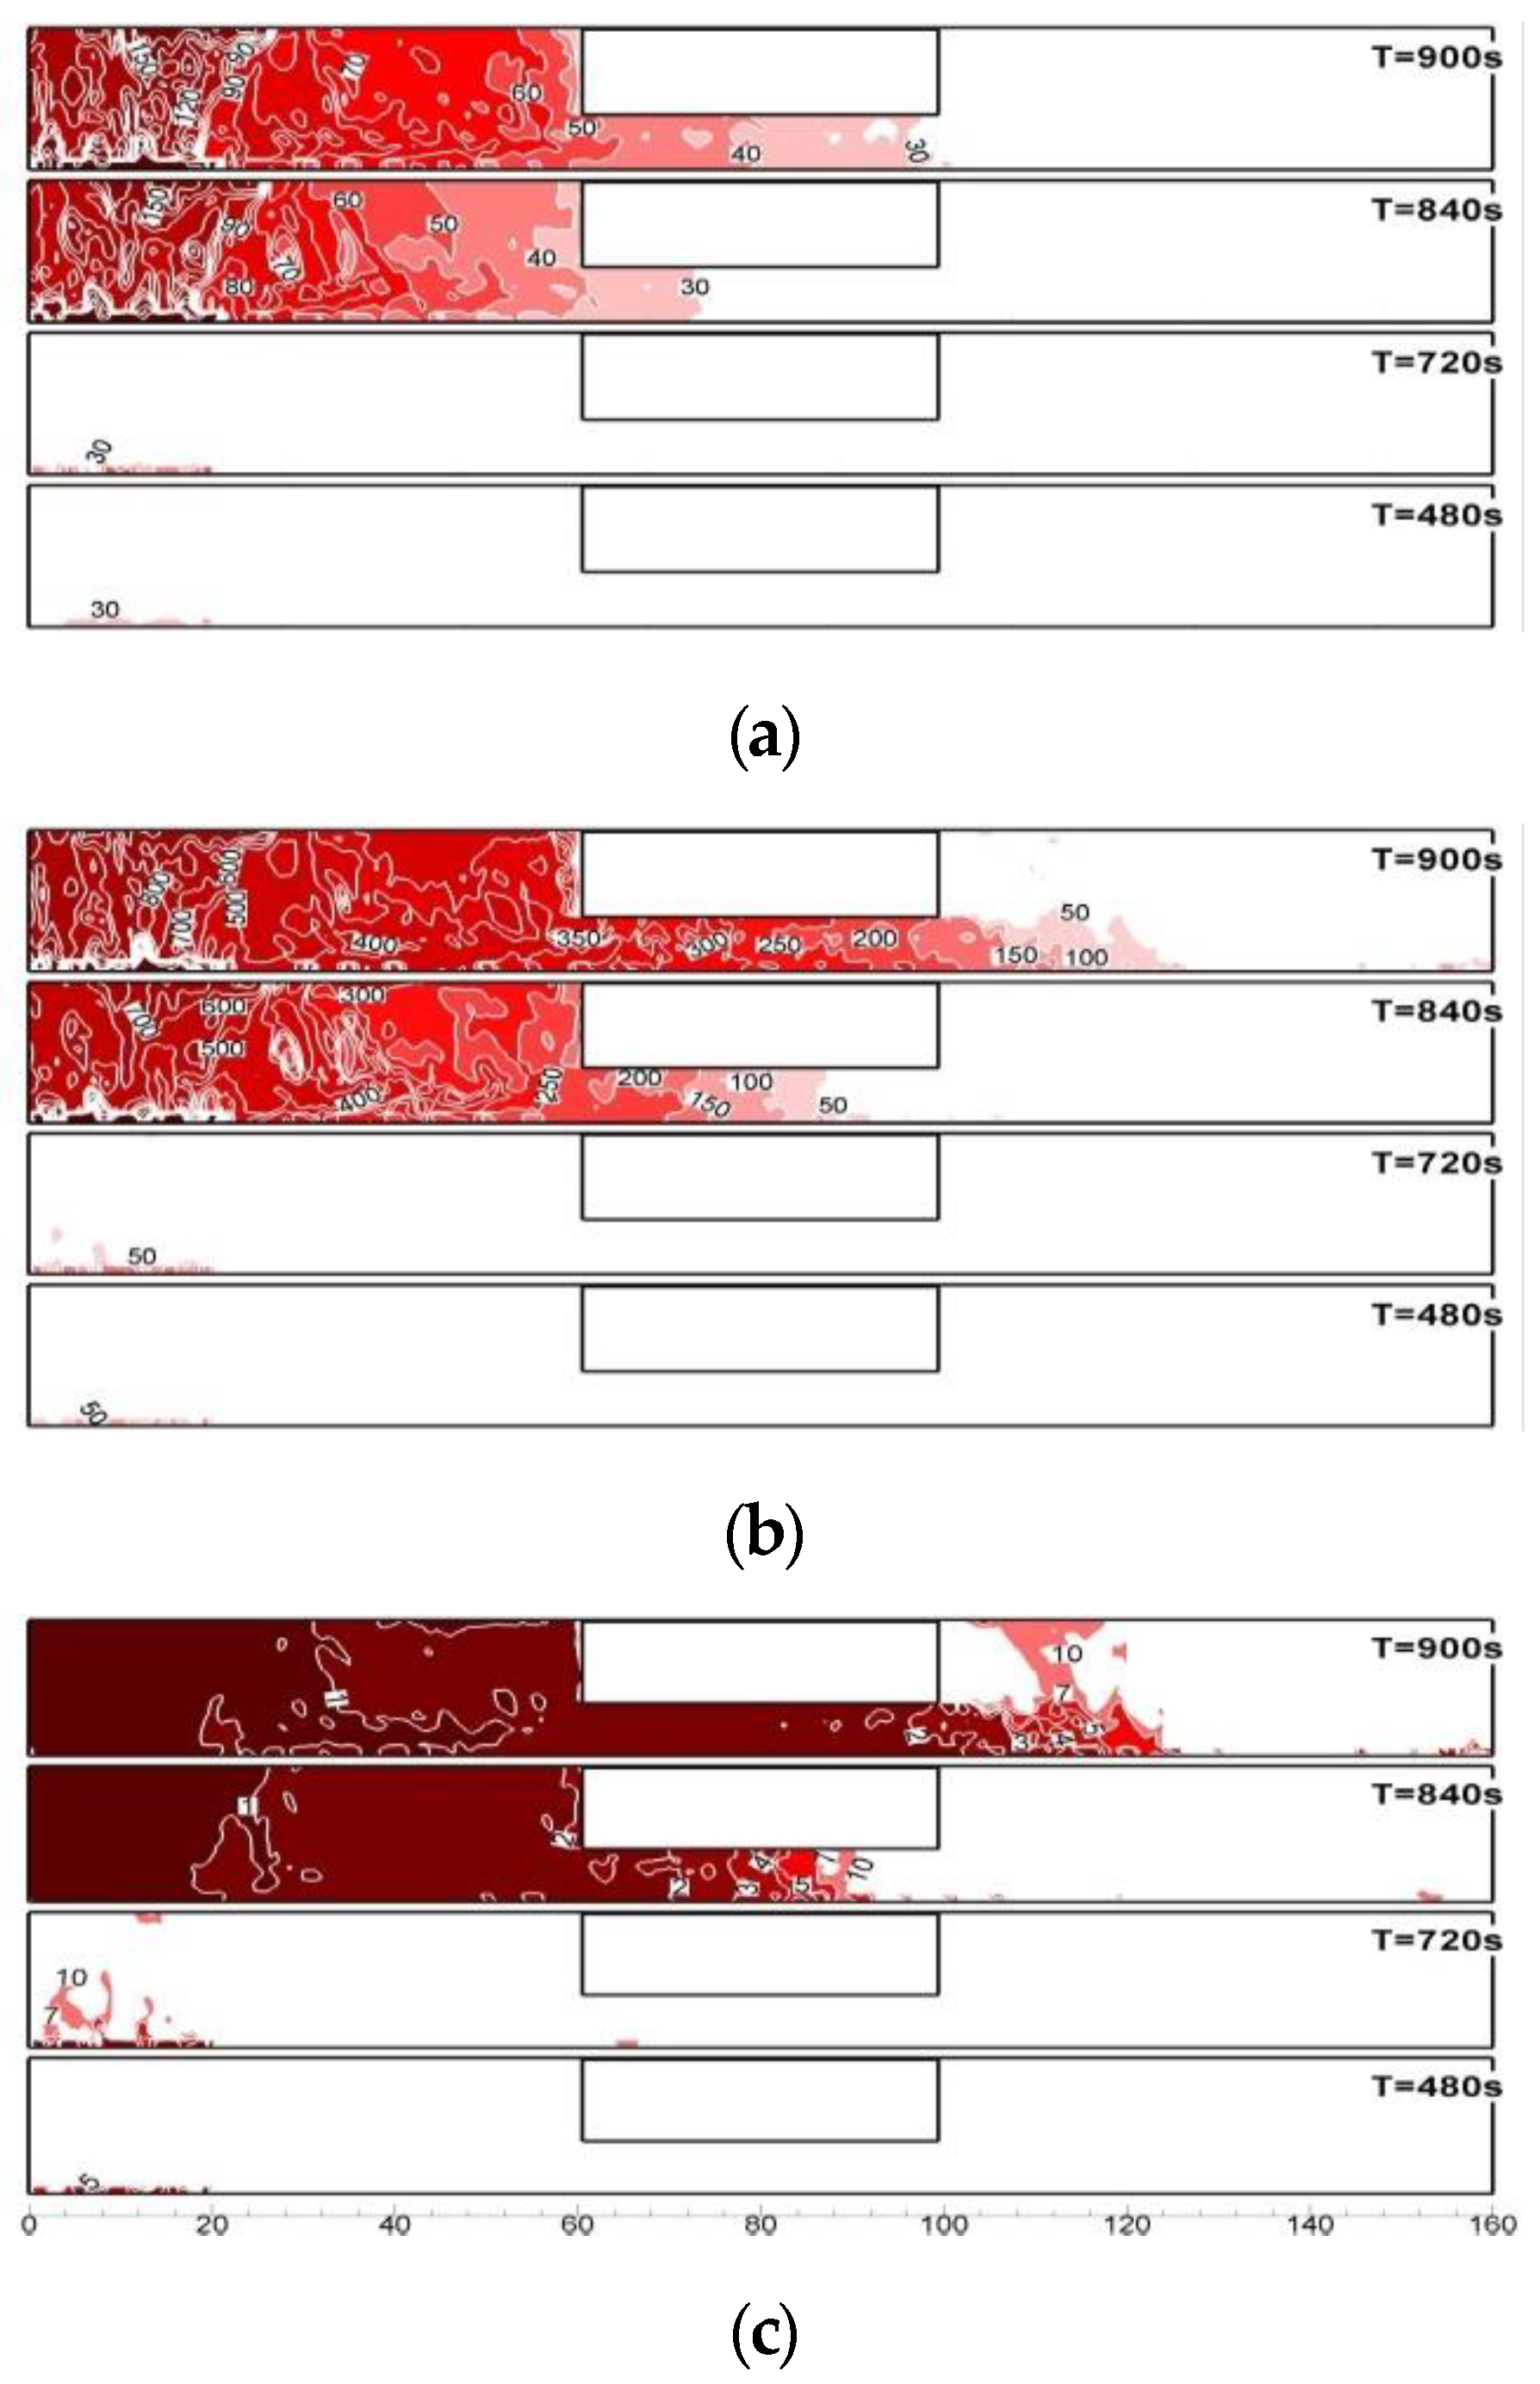
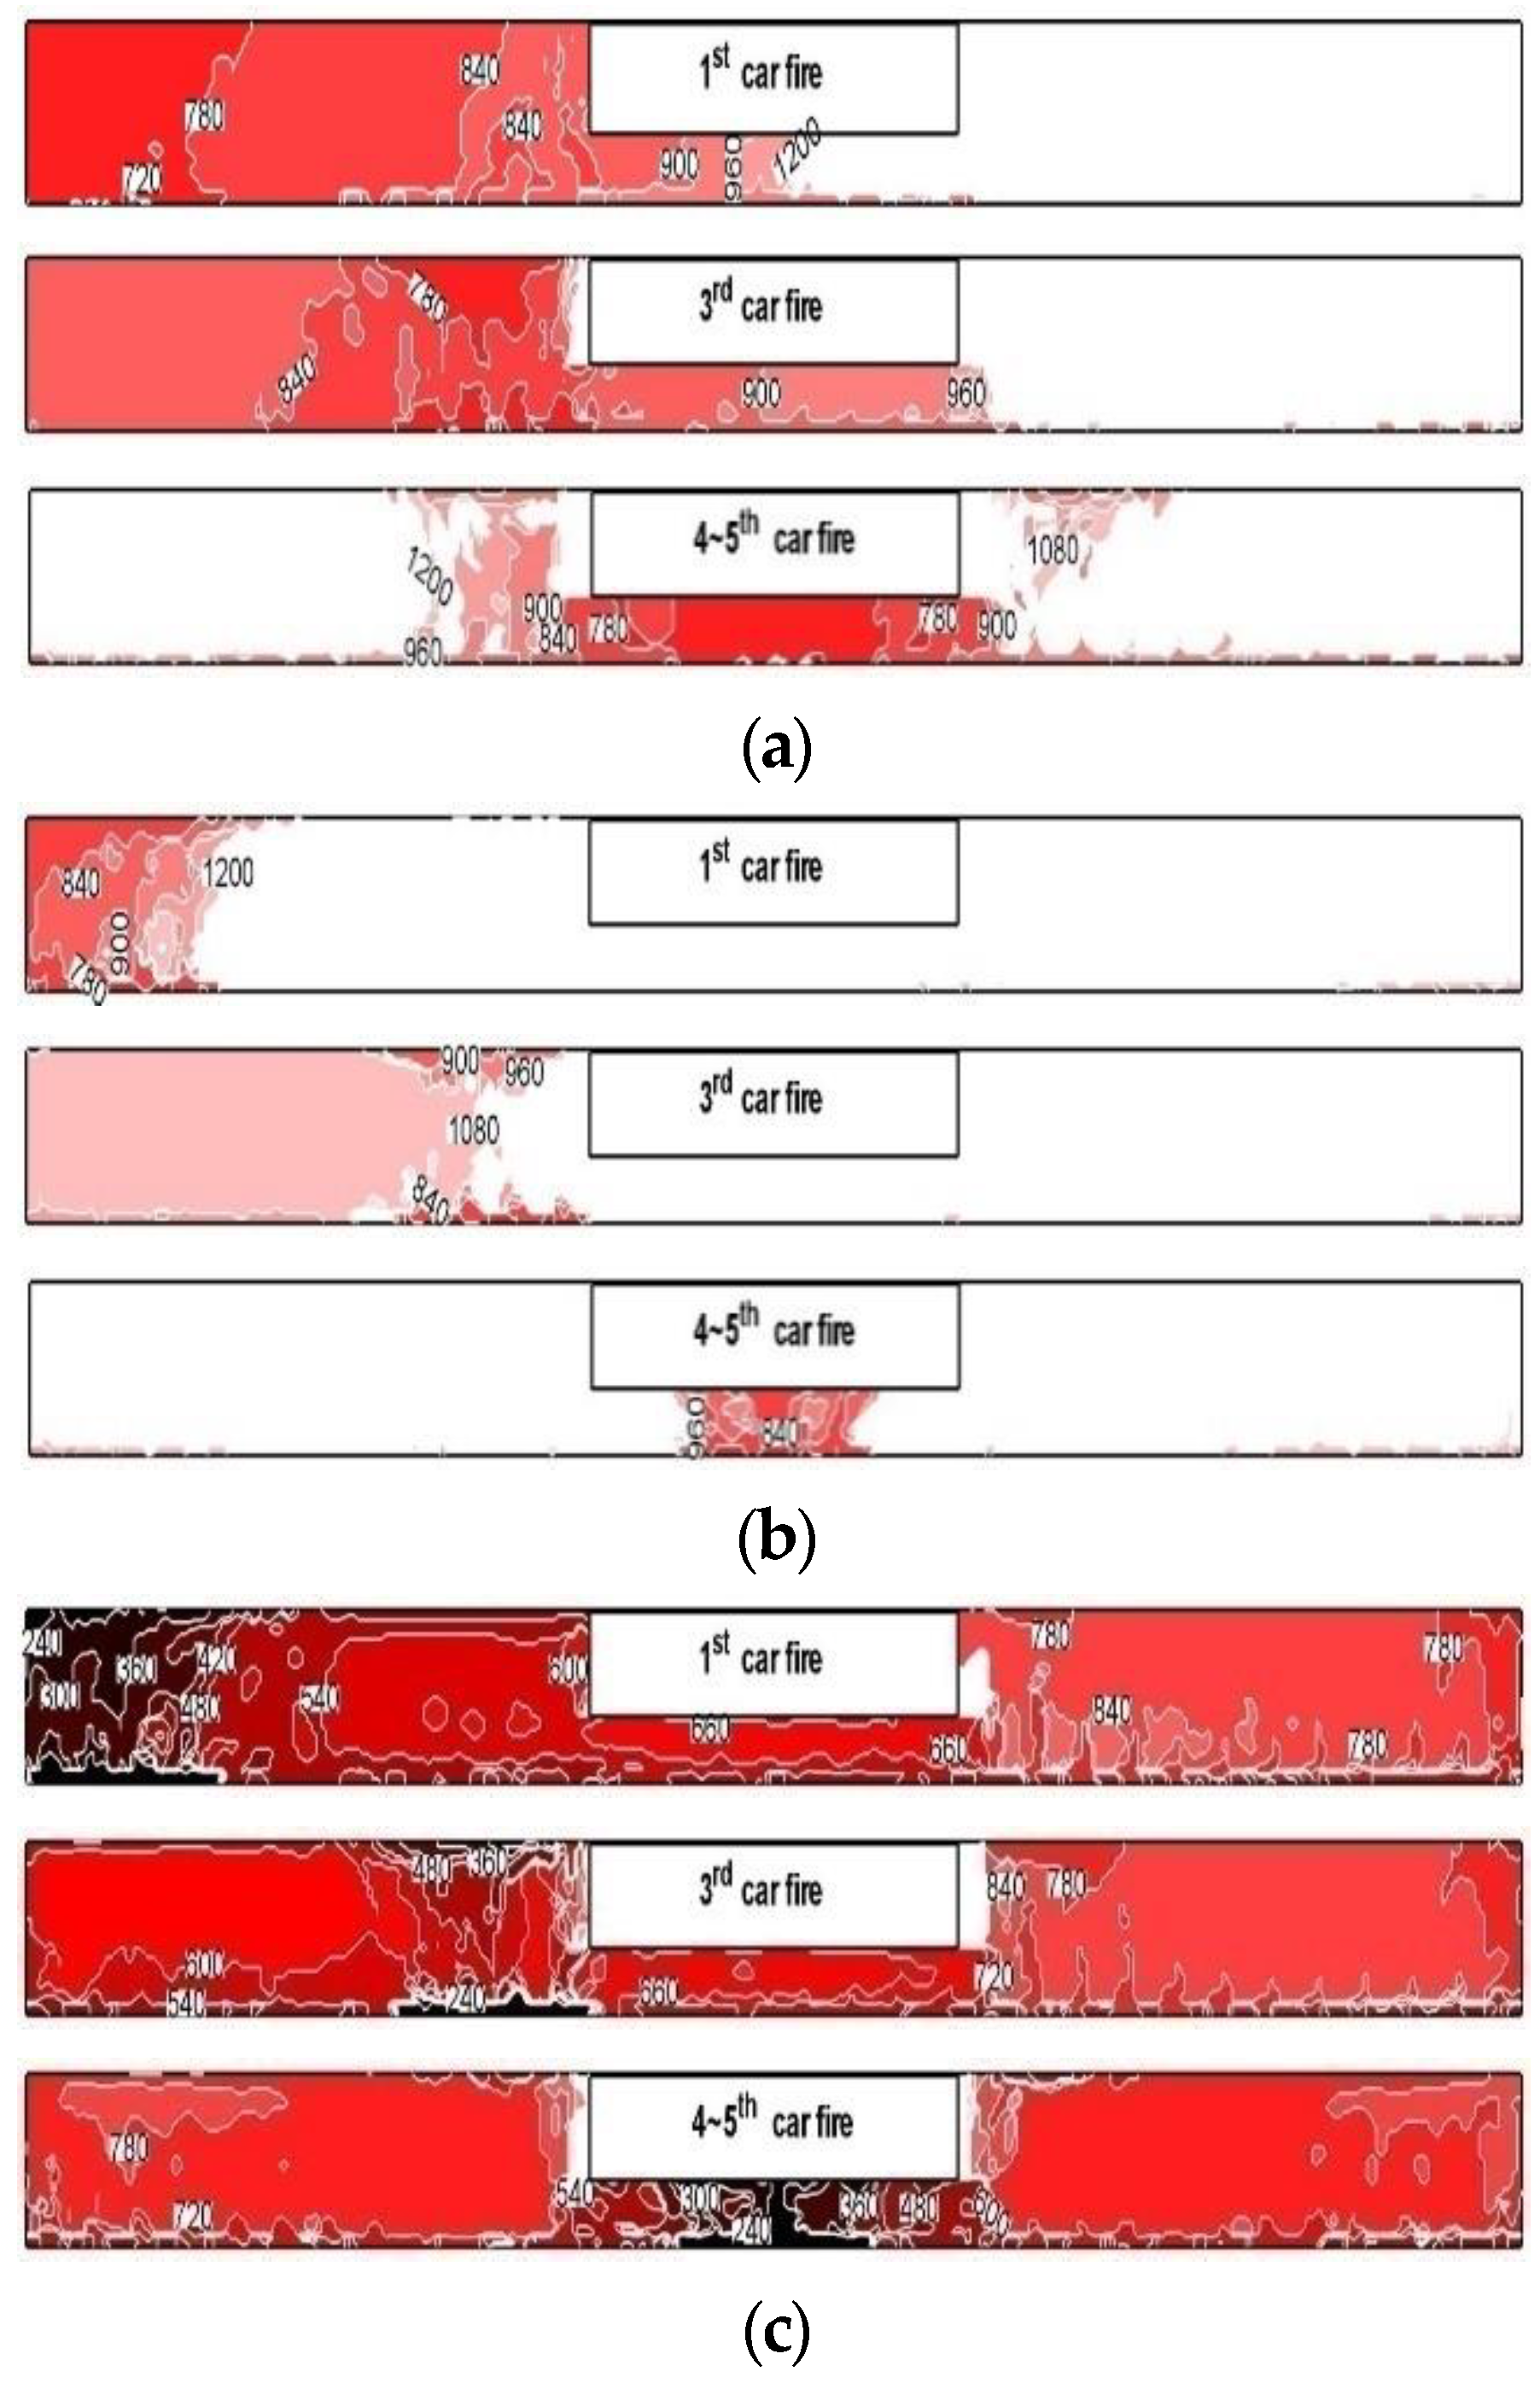
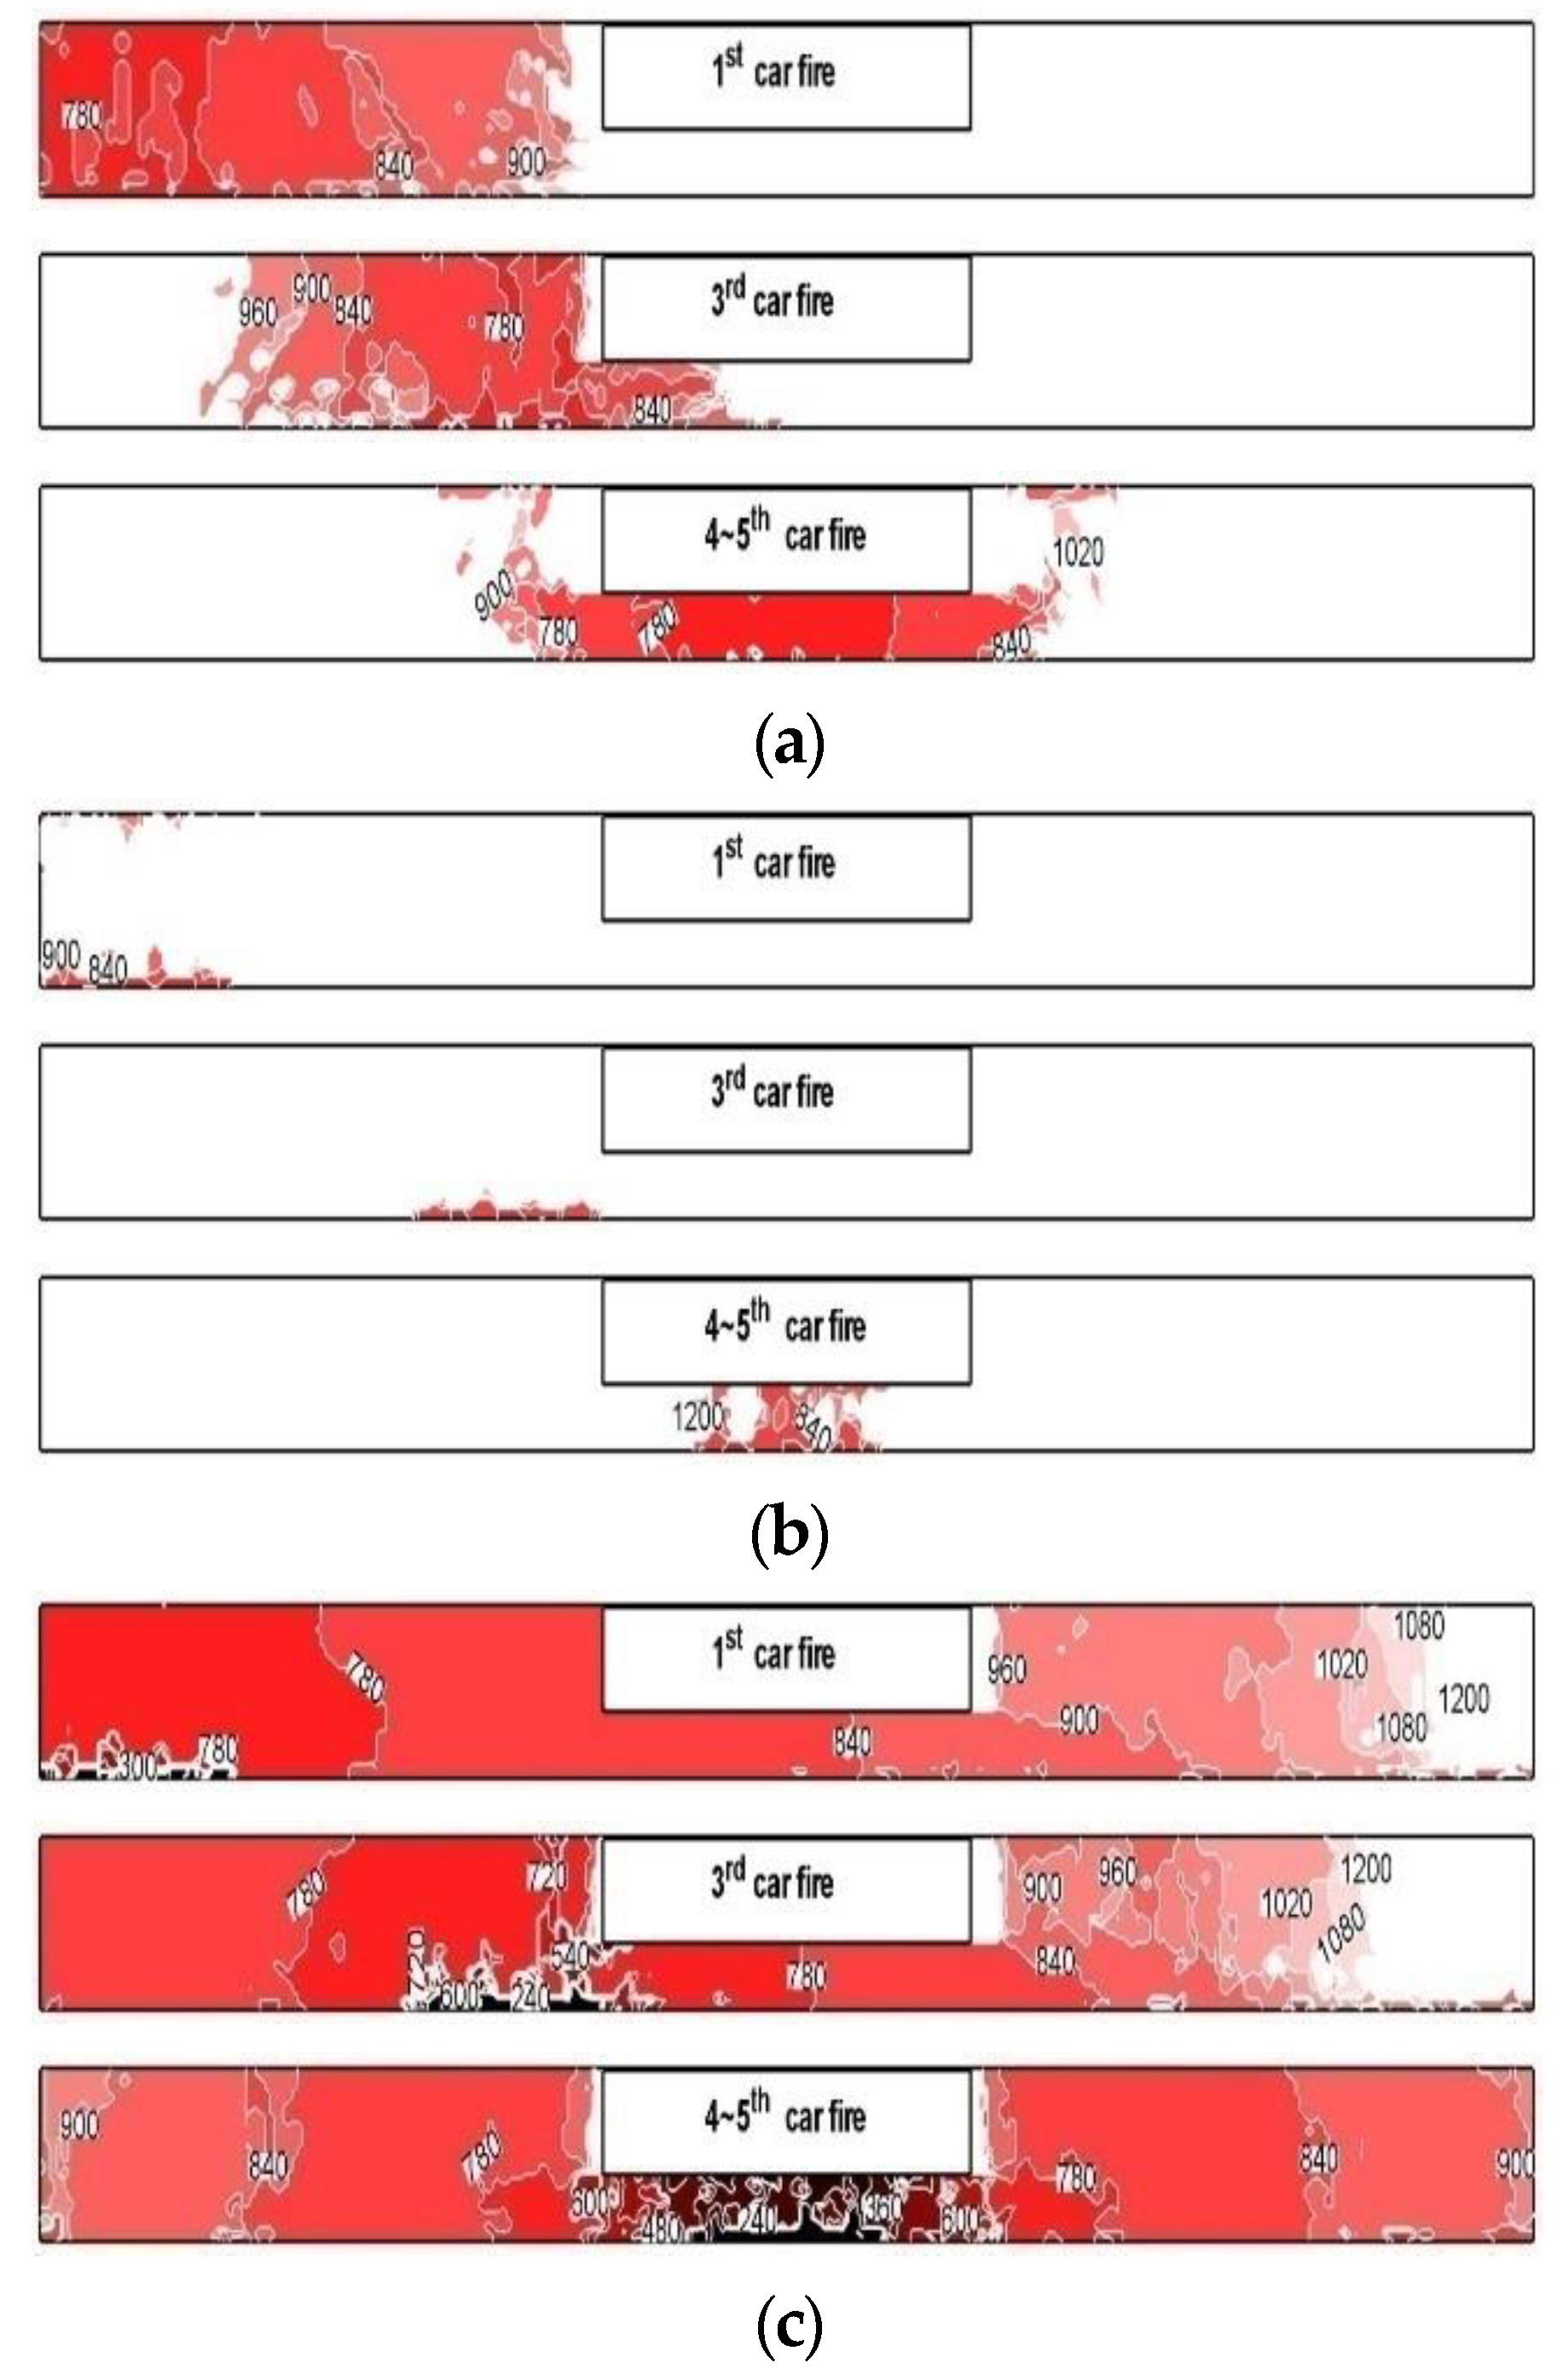
3.1. Platform Fire Characteristics by Fire Location

The fire characteristics of platform should be understood according to the stop position of the fire train. Therefore, the fire characteristics at the platform compared the analysis results in operational modes 0 and 8, which are representative of the operation/non-operation of the whole system among 8 kinds of smoke exhaust operational modes.
Platform fire characteristics can be identified by the distributions of the entire platform temperature and visibility at 840 s, which reaches a maximum heat generation of 20 MW. Figure 7 shows the distributions of temperature, CO and visibility of the entire platform in operational mode 0, which is stoppage of the entire smoke exhaust system. Figure 7a shows the result of a 1st passenger train fire at 840 s after a fire. It can be seen that the temperature and CO distributions are distributed around the platform at the location of the fire. However, the smoke distribution extends to the opposite side of the platform, while the visibility of the entire platform decreases below 7 m.
Figure 7b shows the case of a 3rd passenger train fire, and the smoke movement spreads rapidly to the platform opposite the central stairs. Because the fire occurred at the entrance of the staircase where evacuation takes place, distributions of the temperature, CO, and visibility were worse than the evacuation environment under the 1st passenger train fire conditions. Therefore, it was found that the visibility of the entire platform decreased to less than 10 m.
Figure 7c shows the case of a fire between 4th and 5th passenger cars, at the central location of the stairs. The distributions of temperature, CO, and smoke are developed symmetrically for the stairways. The visibility of the overall platform was shown to decrease to below 5 m. The visibility is calculated by Equation (2) for the relationship between concentration (C) and distance (S) [65,66].
S = C/(Km ∙ Cs)
where C = 3, Km = 8700 kg/m3, CS = soot concentration.
Figure 8 shows the platform temperature, CO, and visibility distributions under operational mode 8 conditions in 840 s required to reach the maximum heat generation of 20 MW. Based on the same fire location, operational mode 8 shows the maintaining of much lower platform temperature, CO, and smoke distribution than operational mode 0. From the representative comparison of modes 0 with 8, the distributions of the temperature, CO, and visibility in the platform differ according to the location of the fire and clarify that the application of the smoke exhaust system is effective in suppressing the propagation of the fire effluents. This computer-based simulation analysis is very effective in determining whether the egress limit criteria of space temperature, CO, and visible distance are exceeded in real time [67,68,69,70,71,72]. Thus, this assessment can use the distribution map of fire effluents to compare spatial information in hazardous areas unsuitable for evacuation. These simulations enable a quantitative individual risk assessment to be achieved by synchronizing spatial information values with the evacuee’s egress paths in connection with escape limit criteria, as well as understanding the hazards.

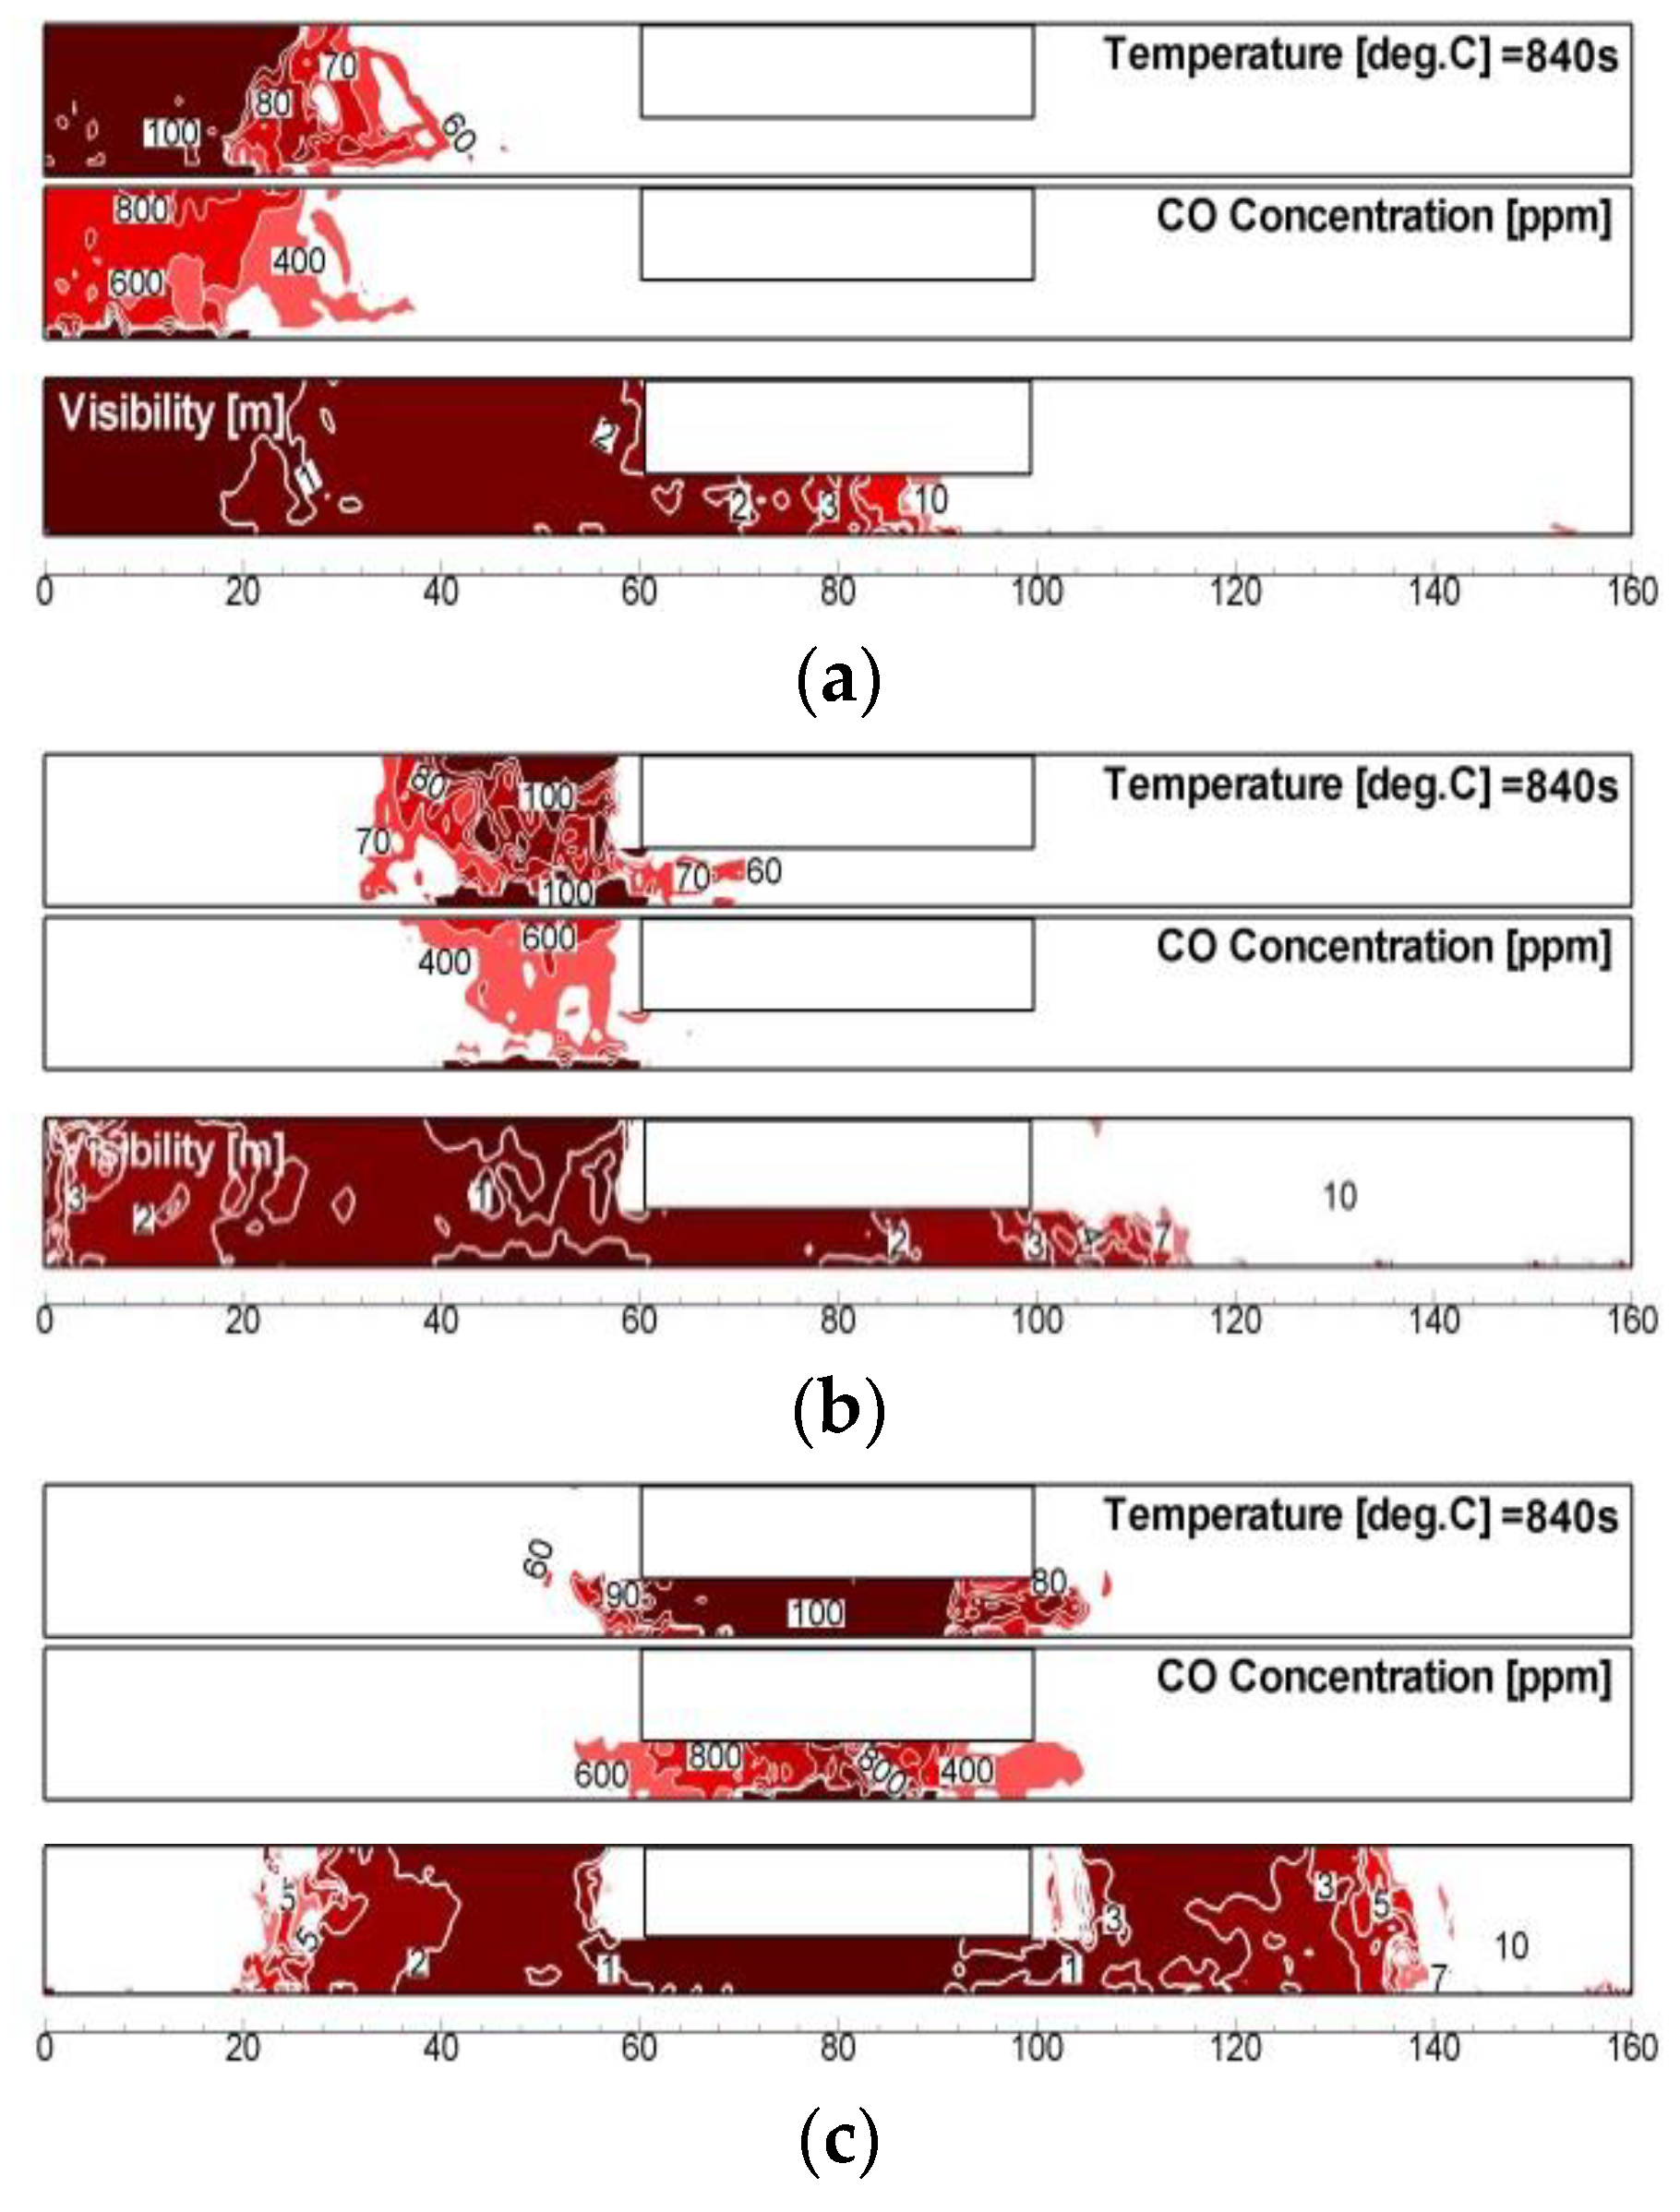
3.2. Evacuation Environment Characteristics of the Platform Due to the Operation of the Smoke Exhaust System
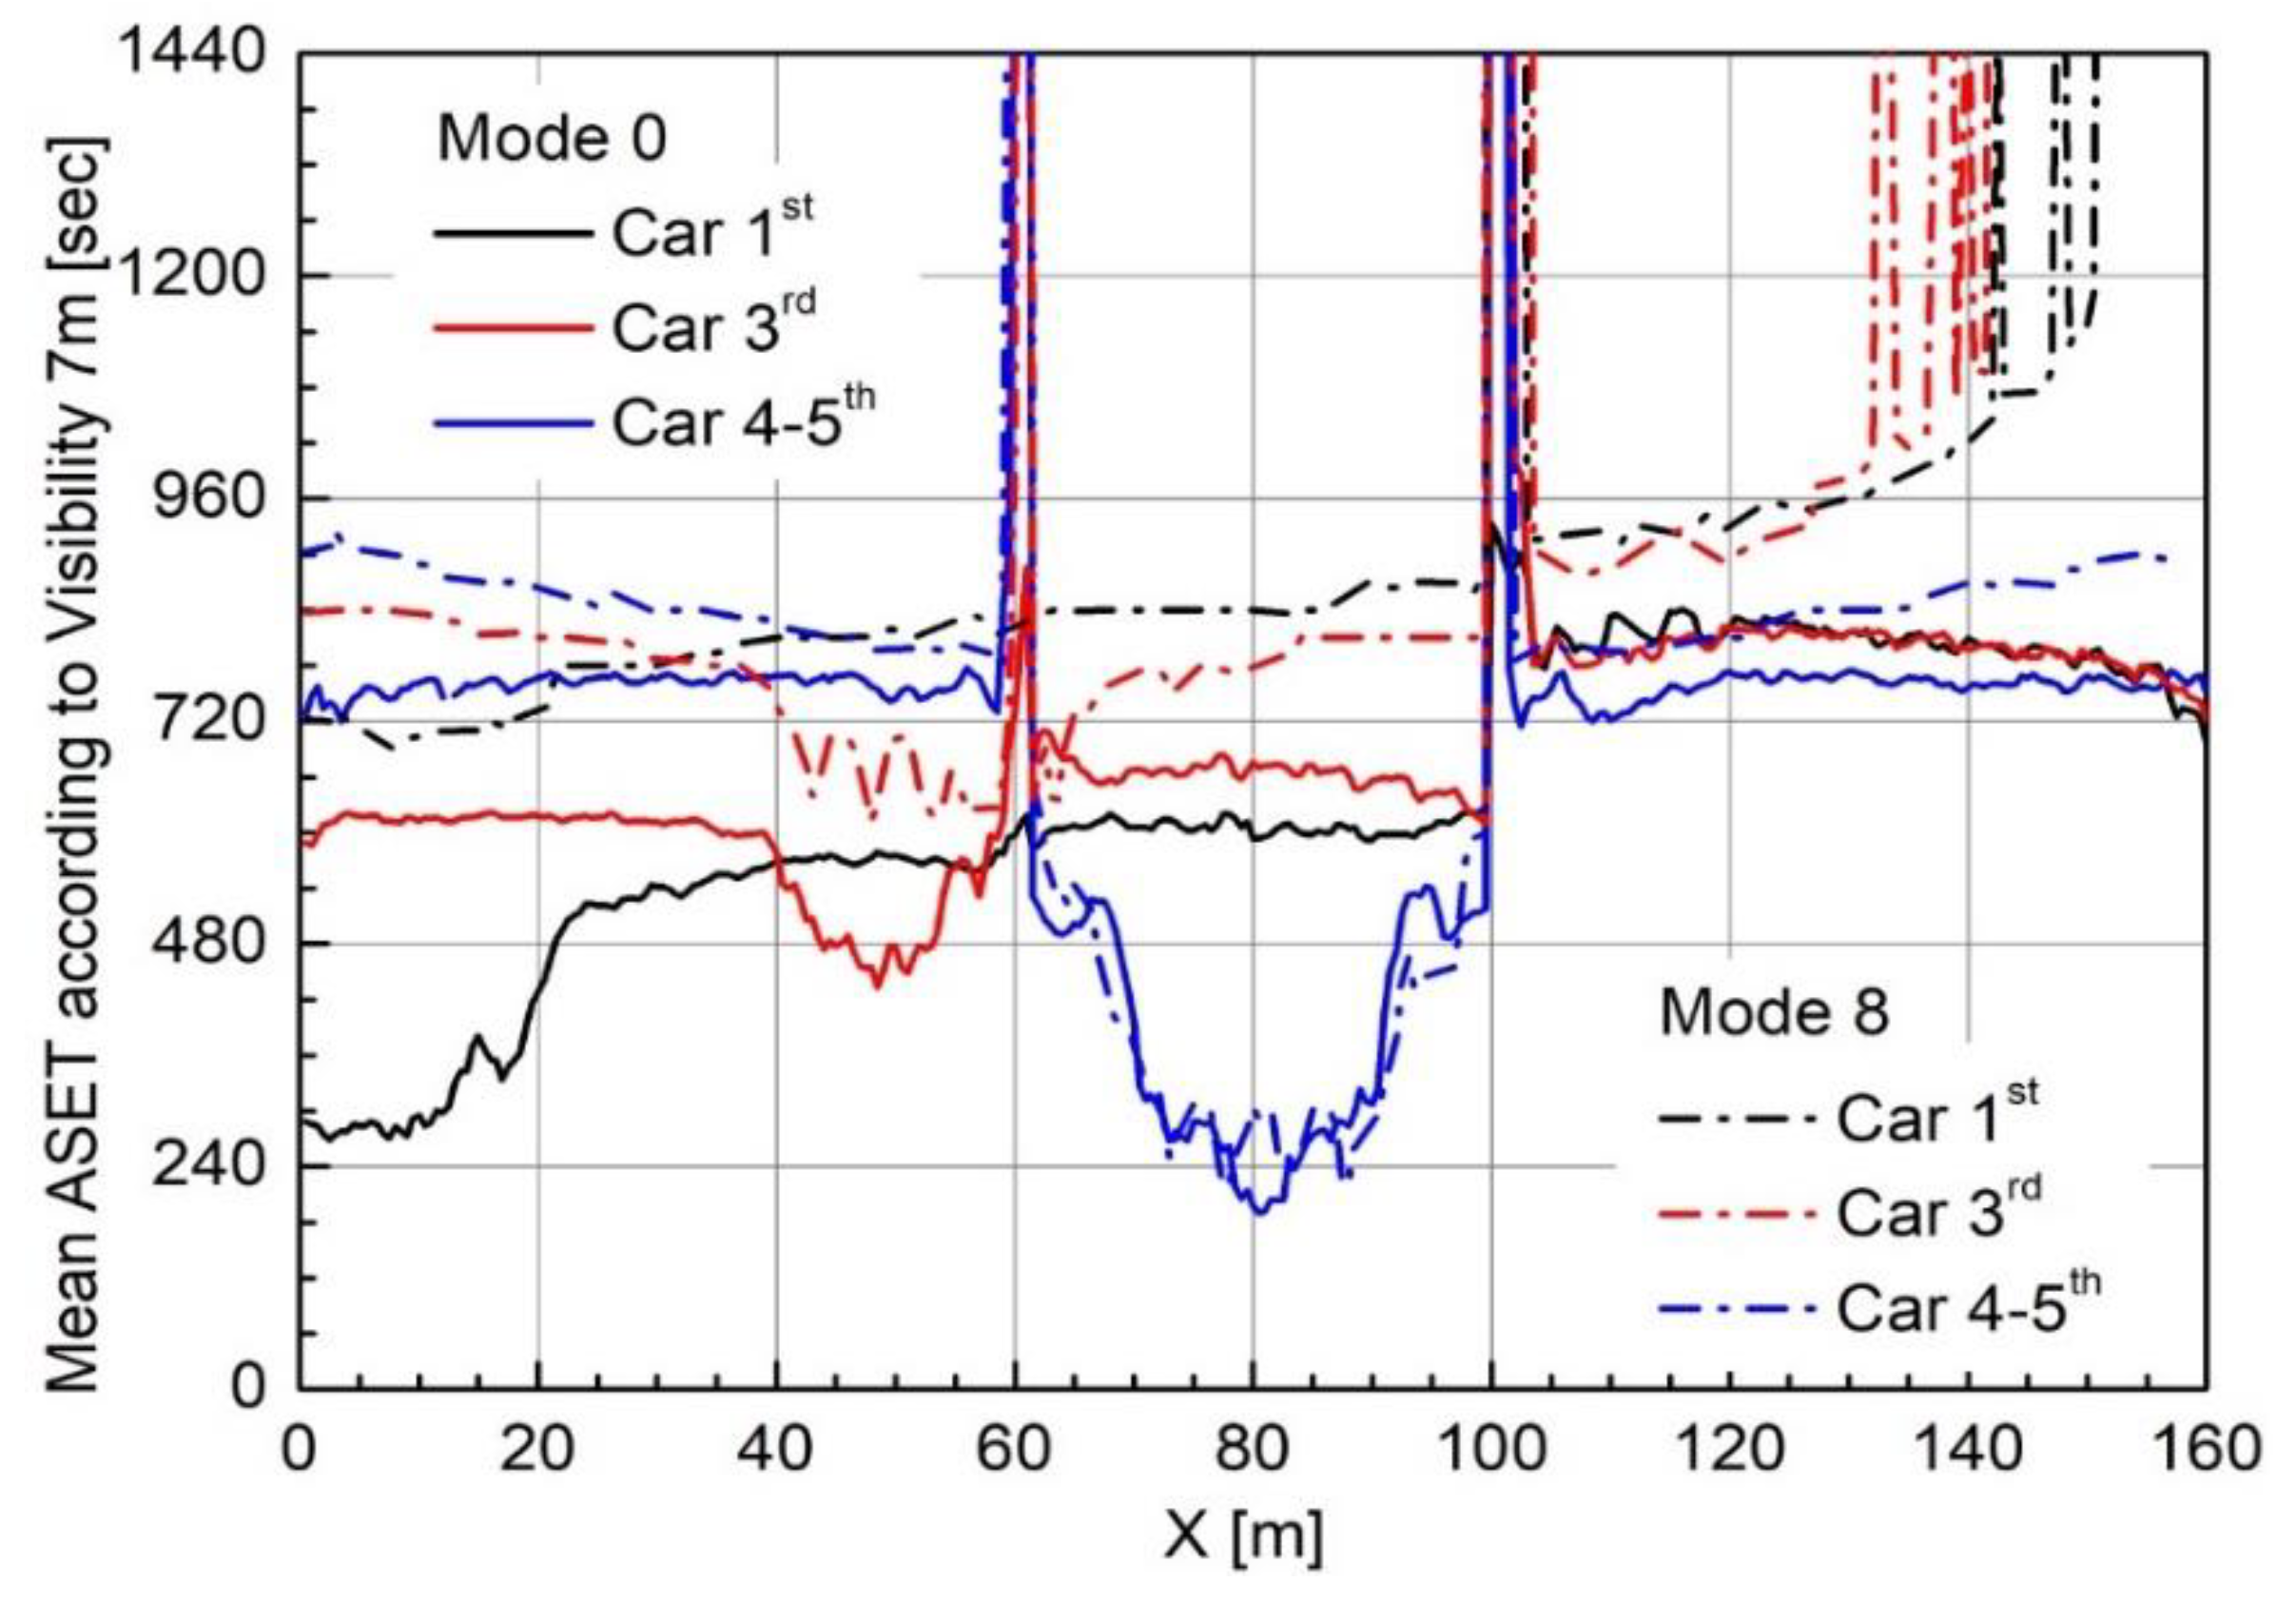
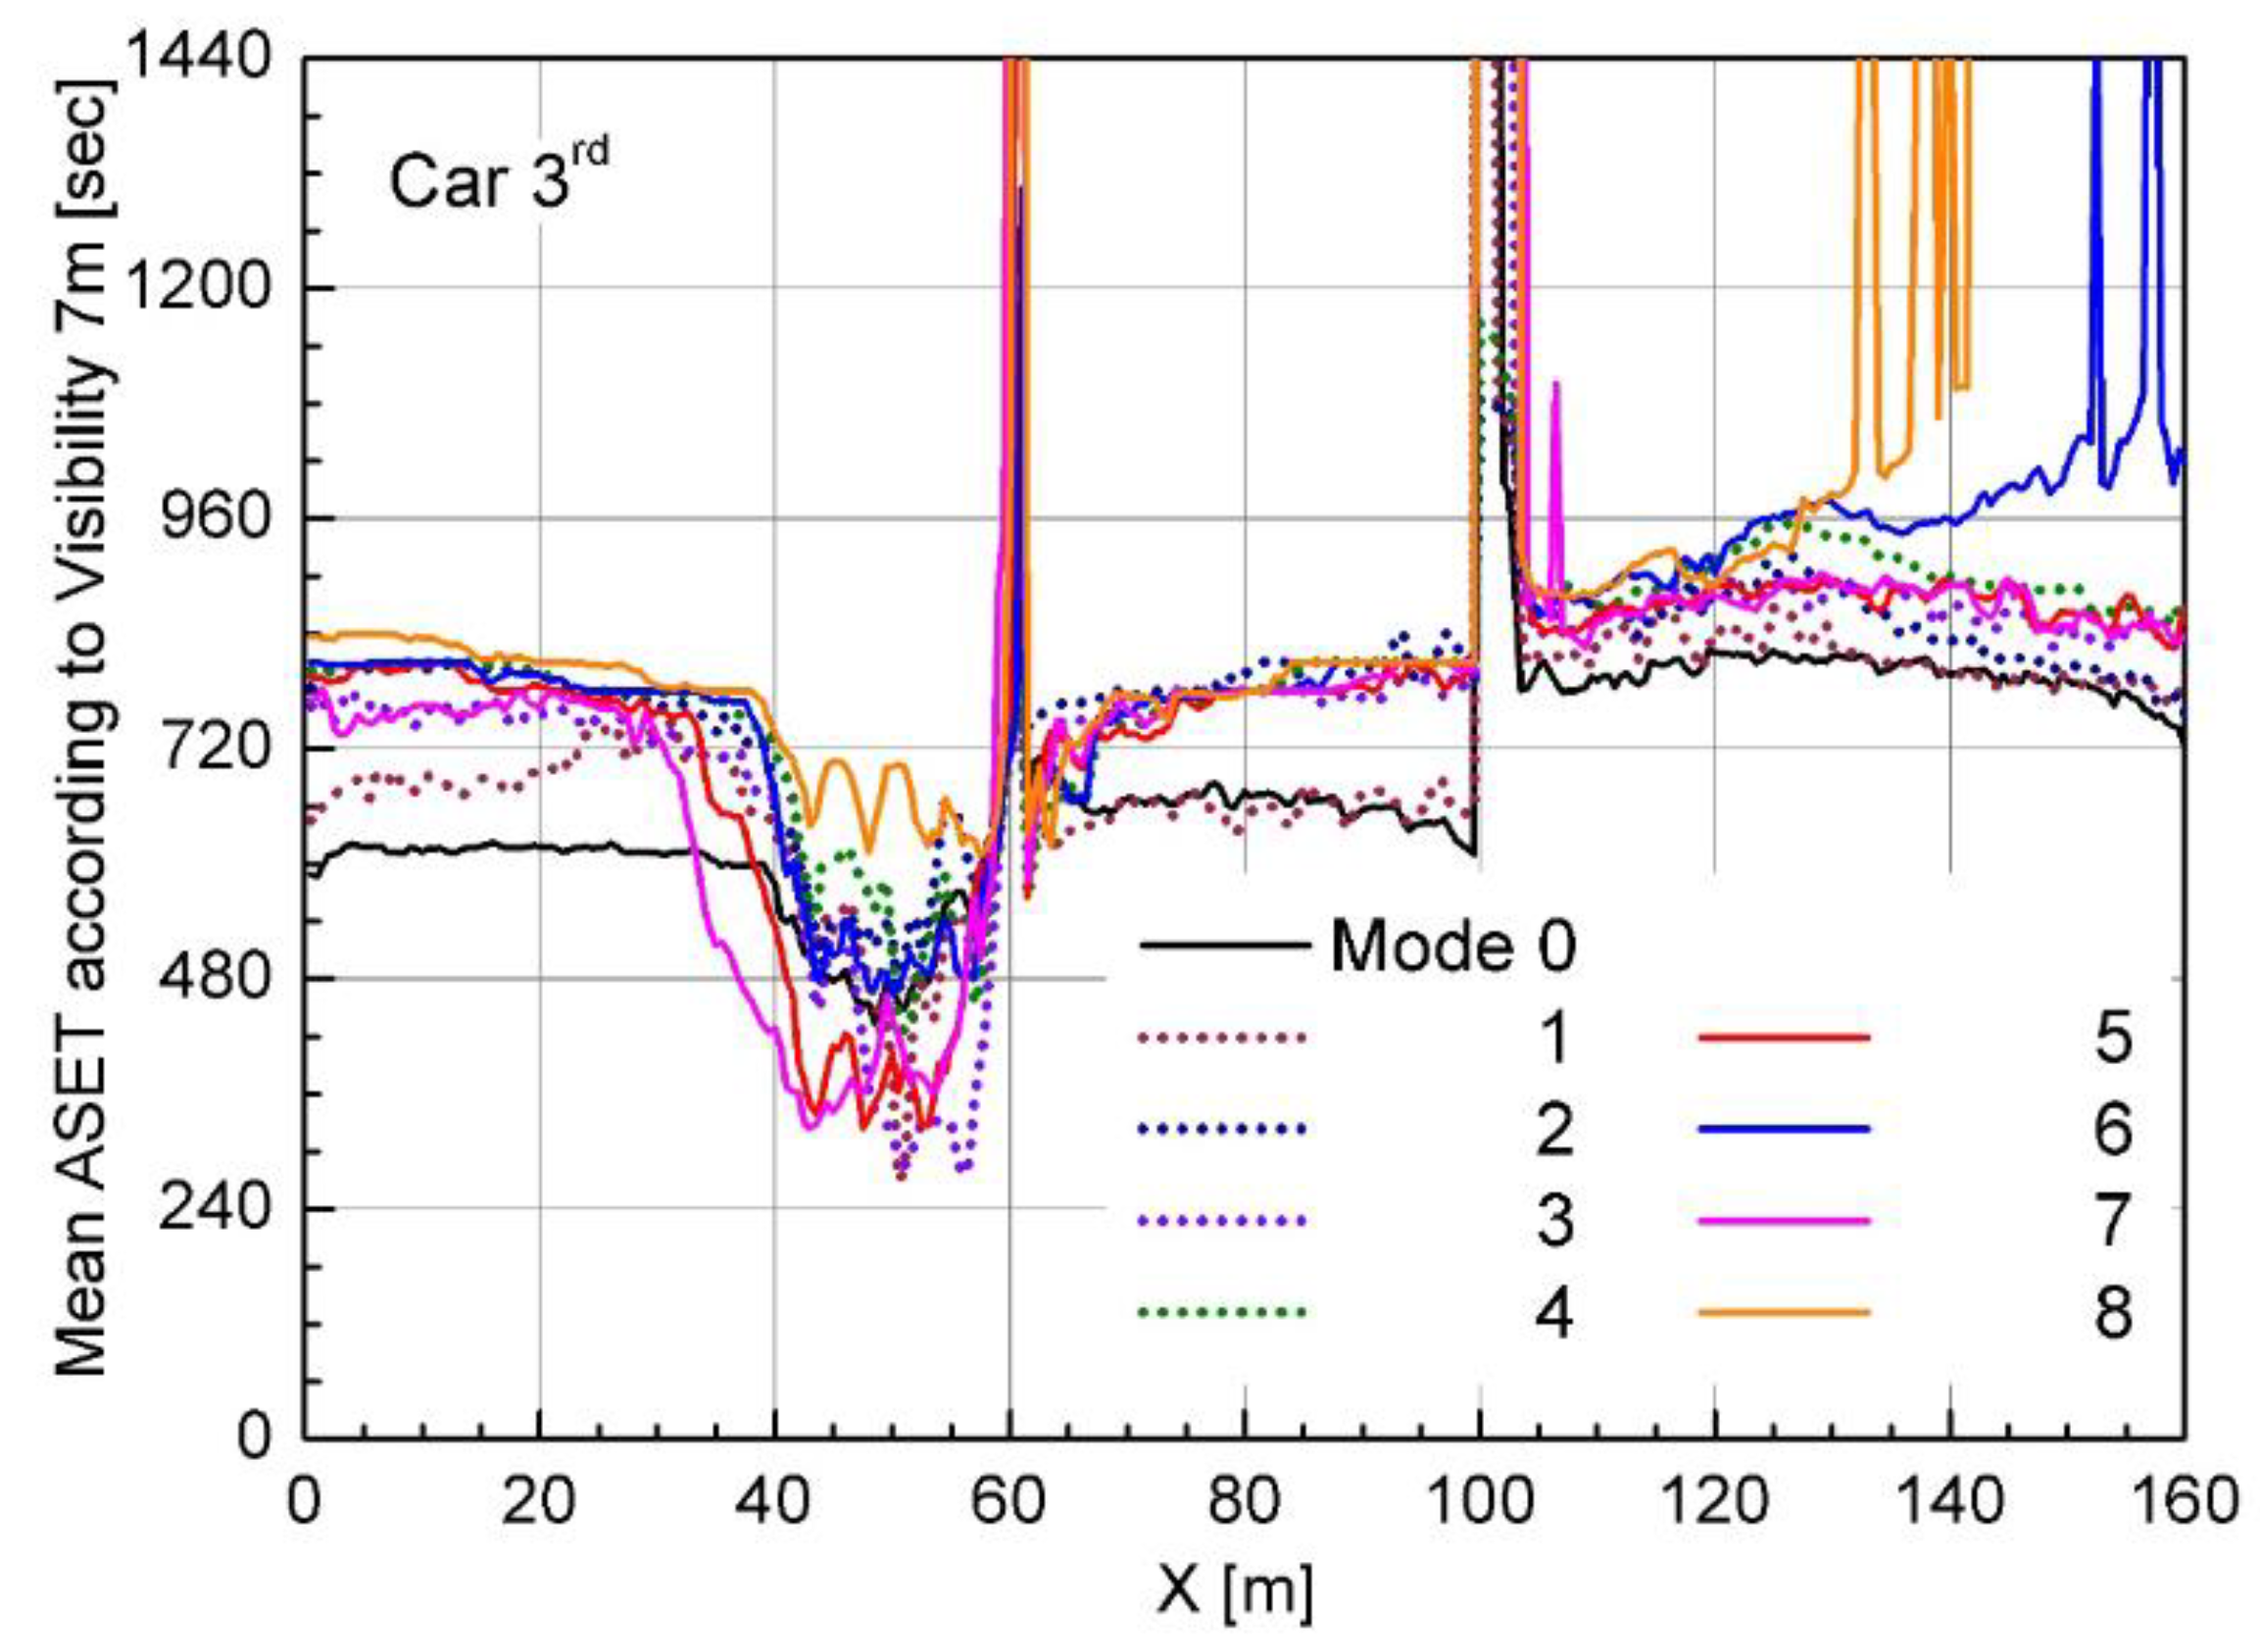
In order to evaluate the evacuation environment characteristics of the platform due to the operation of the smoke exhaust system, the temperature, CO, and visibility of the platform were compared between the operational mode 0, which is all stop condition, and operational mode 8, which is the full operation condition. The applied fire position is the 1st passenger train.
Figure 9 shows the 2-dimensional spatial distributions of the temperature, CO concentration, and visibility obtained based on the evacuee’s breathing line height of 1.8 m for operational mode 0 at 480, 720, 840, and 900 s from the outbreak of fire.
Figure 10 shows the 2-dimensional spatial distribution of the temperature, CO, and visibility obtained based on the evacuee’s breathing line height of 1.8 m for operational mode 8 at 480, 720, 840, and 900 s from the outbreak of fire. The smoke approach to the platform stairs was from 240 s for operational mode 0 and after 840 s for operational mode 8. The exposure time of the entire platform to the fire was after 480 s in operational mode 0 and after 720 s in operational mode 8. The temperature of the stair entrance was found to be above 60 °C in operational mode 0.
However, it was found to be below 60 °C in operational mode 8. The CO concentration of the stair entrance exceeds 100 ppm after 720 s in operational mode 0 and rises to 1200 ppm after 840 s. However, in operational mode 8, it was found that the entire area of the platform remained below 50 ppm till 720 s. In operational mode 0, the visibility shows less than 10 m approximately at 240 s and less than 5 m at 480 s near the fire train. Moreover, the visibility of the staircase entrance decreases to under 5 m. But in operational mode 8, it was found that the visibility of the entire platform is improved to above 10 m up to 720 s. Therefore, it can be seen that the operating conditions of the smoke exhaust mode create a safer evacuation environment, compared to the non-operating conditions.

3.3. ASET Analysis

ASET analysis is possible by comparing the temperature, CO, and visibility in the platform with tenability limits, which is the limit criterion presented in the performance-based design criteria. Each tenability limit is temperature 60 °C, CO concentration 1400 ppm, and visibility 7 m. Therefore, each item’s time to reach this limit corresponds to ASET.
Figure 11 shows the ASET contours of temperature, CO, and visibility at a breathing line height of 1.8 m under ventilation operating mode 0 conditions at three fire positions. The number on the contour in the figure represents ASET, the time to reach the tenability limit. Therefore, the relatively low ASET value means that the evacuee comes under the condition of untenable evacuation situation in a short time.
Figure 11a shows the ASET contour of temperature. It has a value of about 750 s near the fire’s place, regardless of the fire location, and has a value of about 1200 s or more in the platform opposite the fire location. The fastest effect on the temperature’s tenability limit was about 780 s with the fire on the 3rd passenger train. Figure 11b shows the ASET contour of CO. The fastest ASET was 840 s at the condition of the fire on the 3rd passenger train. Figure 11c shows the ASET contour of visibility. It was shown to be affected the fastest on the stair within 540 s at the condition of fire on the 3rd passenger train. Therefore, in mode 0, the most dangerous fire was identified as the fire on the 3rd passenger train.
Figure 12 shows the ASET contours of temperature, CO, and visibility at the breathing line height of 1.8 m for the ventilation operational mode 8 by the variation of fire position. Figure 12a shows the ASET contour of temperature. The temperature ASET has the same value of about 750 s at the fire location, regardless of the fire location. Among the fire locations, fire between 4th and 5th car condition has the largest ASET area of 1200 s. Therefore, it can be seen that the area is not affected up to 1200 s, which is the simulation calculation time. Even in mode 8, the condition that most quickly affected the evacuation was the 3rd passenger train fire with an ASET of about 780 s. Figure 12b shows the ASET contour of CO, which does not affect the evacuee at all under the condition of operational mode 8. Figure 12c shows the ASET contour of visibility. Even in operational mode 8, the smoke showed the fastest 540 s to the tenability limit under the 3rd passenger train fire conditions. From the ASET analysis, it was confirmed that the fastest ASET is determined by visibility in the case of train fire at platform, and that CO toxicity has relatively very little influence on evacuees.
The result of comparison according to the location of fire clarified that the highest ASET value arose when the fire occurred on the side of stairs of the condition in fire between 4th and 5th passenger trains. Therefore, it was found that the most sufficient evacuation time could be secured among the fire locations selected in this study. In the case of the 3rd passenger train fire that occurred at the entrance of stairs, it showed the shortest ASET, making it the most vulnerable to evacuee safety. Moreover, in Mode 8, it was shown that the most important risk factor to be considered is the decrease in visibility due to smoke generation, and the effect of CO is very little.
Figure 13 shows the Longitudinal platform mean visibility’s ASET according to the fire location for the condition of operational modes 0 and 8.
The lowest ASET is found around the fire train, and it shows the characteristic of symmetrical distribution on both sides of the platform in case of 4th–5th passenger train fire. Table 2 shows the mean ASET values for fire trains in modes 0 and 8.
When the smoke exhaust system was applied from mode 0 to mode 8, the improvement rate of ASET was 1757% in the 3rd, 1250% in the 1st, and the lowest 18% in the fire between 4th and 5th passenger trains. Therefore, it was confirmed that the application of mode 8 improved the evacuation environment from the excellent smoke exhaust effect on the fire generated in the 3rd passenger train near the stairs.
Figure 14 shows the ASET of mean width visibility over platform length under the third vehicle fire condition, which is the most vulnerable to evacuation. The ASET for visibility results show a comparison of the non-operating exhaust operational mode 0 and operational smoke exhaust detail modes 5–8 under the 3rd passenger train fire condition.
The difference between the maximum and minimum values of ASET for each of Modes 5 to 8 is shown in order in Table 3, which confirms that Modes 5 and 6 are the same, and 8 is more favorable for evacuation than Mode 7. Therefore, it was confirmed that the safest condition for evacuation was to pressurize the platform by introducing external air into the platform using the HVAC system of the platform under the combined condition of TES and station exhaust.

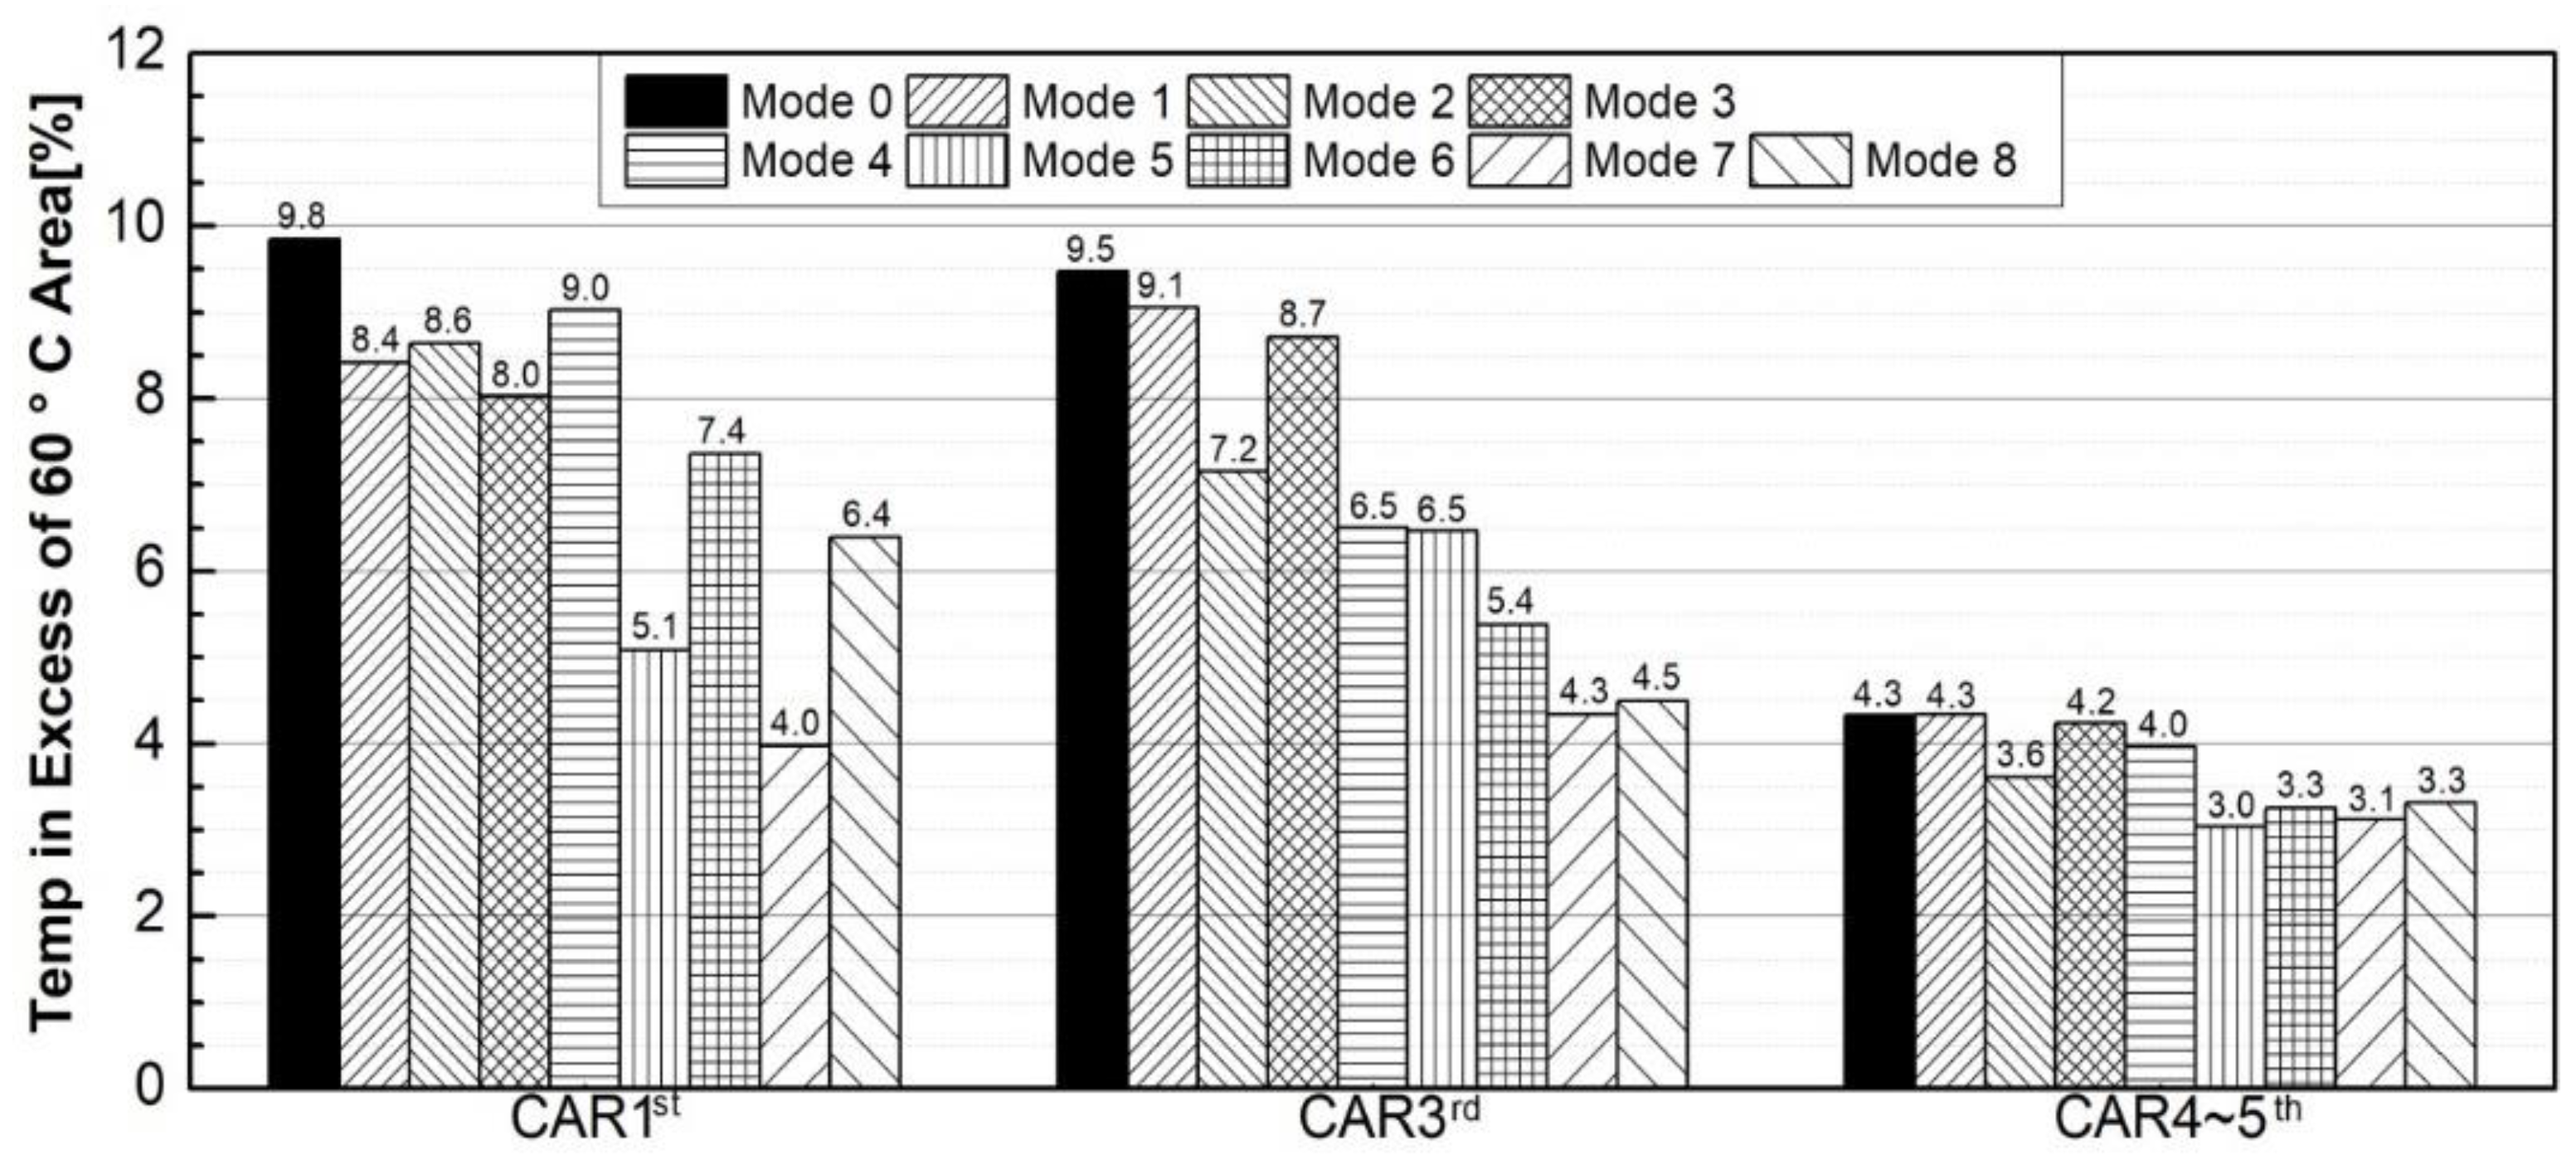
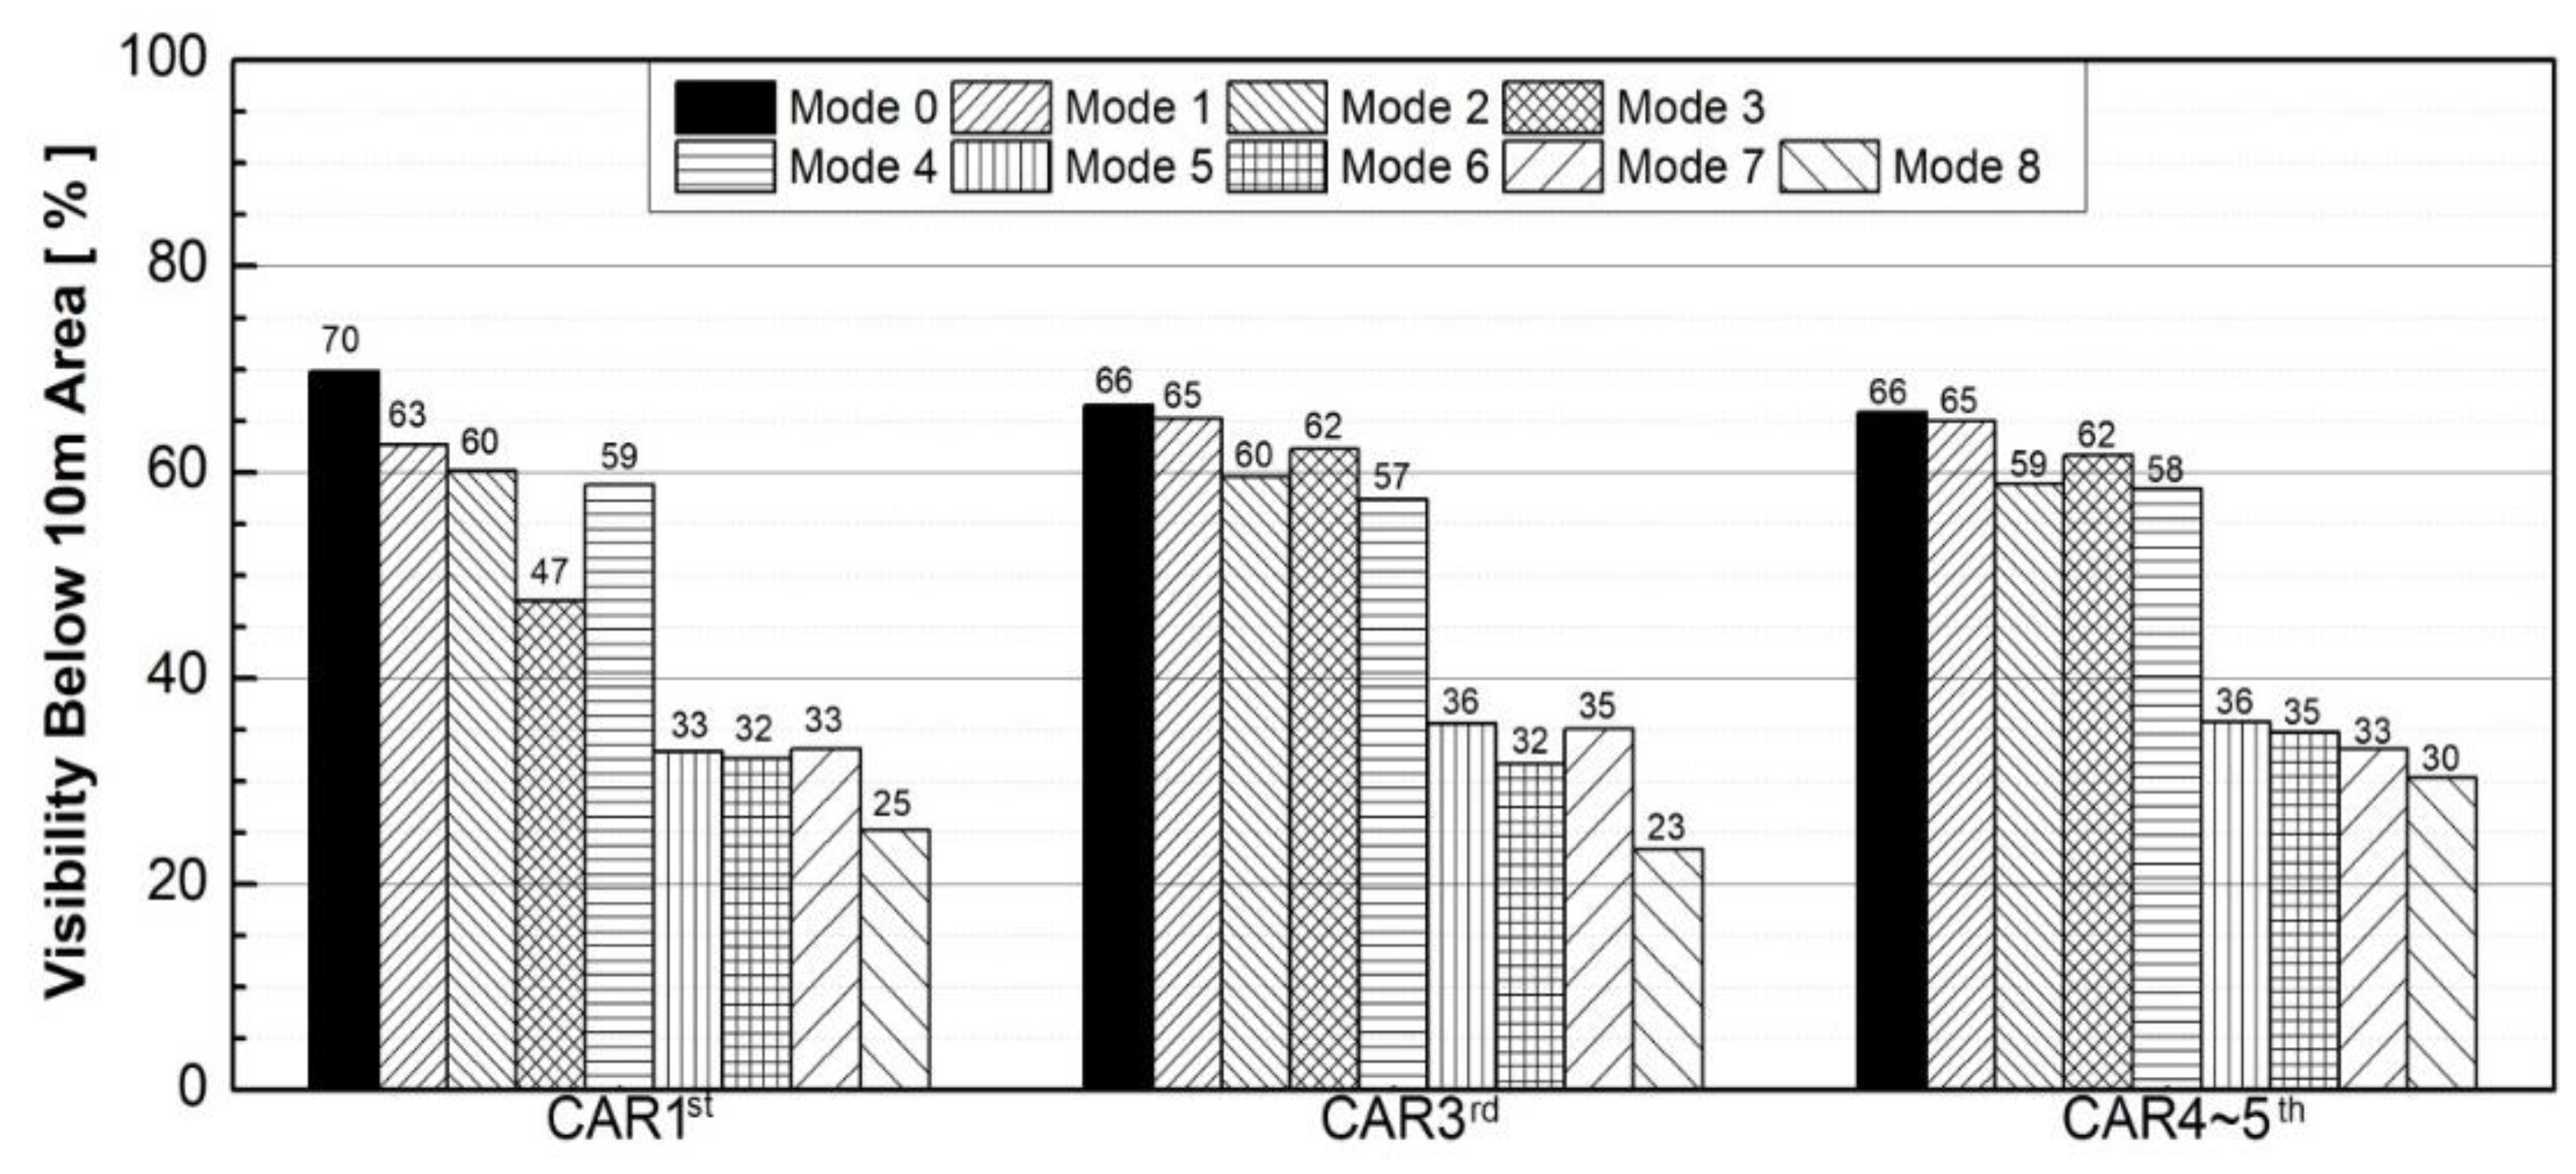
3.4. Untenable Area Analysis

ASET analysis means the time to reach the tenability limits, so that a closer examination of the suitability of the evacuation environment can be made by analyzing the area with values above the tenability limits [73,74]. Therefore, in this study, Untenable Area analysis was performed to identify the area exceeding the tenability limits. Table 4 shows the tenability limits of fire effluent that are applied in performance-based design for the temperature, carbon monoxide, and visibility.
The Untenable area analysis is calculated with Equations (3) and (4) for the % area that exceed the tenability limits for temperature and visibility, except for CO, which has less impact.
Platform   area   %   ratio   that   has   over   evacuation   temperature   limit   60   ° C = ( Platform   area   over   60   ° C   temperature   total   platform   Area   ) ,
Platform   area   %   ratio   that   has   over   evacuation   visibility   limit   10   m = ( Platform   area   over   65   mg / m 3   soot   density   total   platform   Area   ) ,
In addition to the ASET assessment, the Untenable Area analysis can be obtained with the quantitative result of exceeding the tenability limit, which is advantageous for the relative evaluation of the performance of each mode. Figure 15 shows the result of Equation (3), the platform area % ratio that has over evacuation temperature limit 60 °C according to the variation of smoke exhaust operational mode and fire location. The 1st and 3rd passenger train fire-occurring conditions were the lowest in Mode 7, while fire-occurring condition between 4th and 5th passenger train was the lowest in Mode 5. The values of the platform area ratio over the evacuation temperature limit 60 °C like those under the condition of the fire-occurring passenger train between 4th and 5th show the lowest value of 4.3% or less, regardless of the smoke exhaust operational mode. From the untenable area analysis, which reflects the diversity of fire locations, operational mode 7 confirms that the best optimal temperature-based evacuation safety is achieved.
Figure 16 shows the result of Equation (4) of the platform area % ratio that has evacuation visibility limit under 10 m according to the variation of smoke exhaust operational mode and fire location. It can be known from this result that the smoke exhaust operational modes 5 to 8 is more effective in improving the evacuation visibility than operational modes 0 to 4, in which the tunnel exhaust fan (tunnel exhaust) is not operating. Operational mode 8 has been identified as the best smoke exhaust system by exceeding the evacuation visibility limit of 23% of the total platform area.

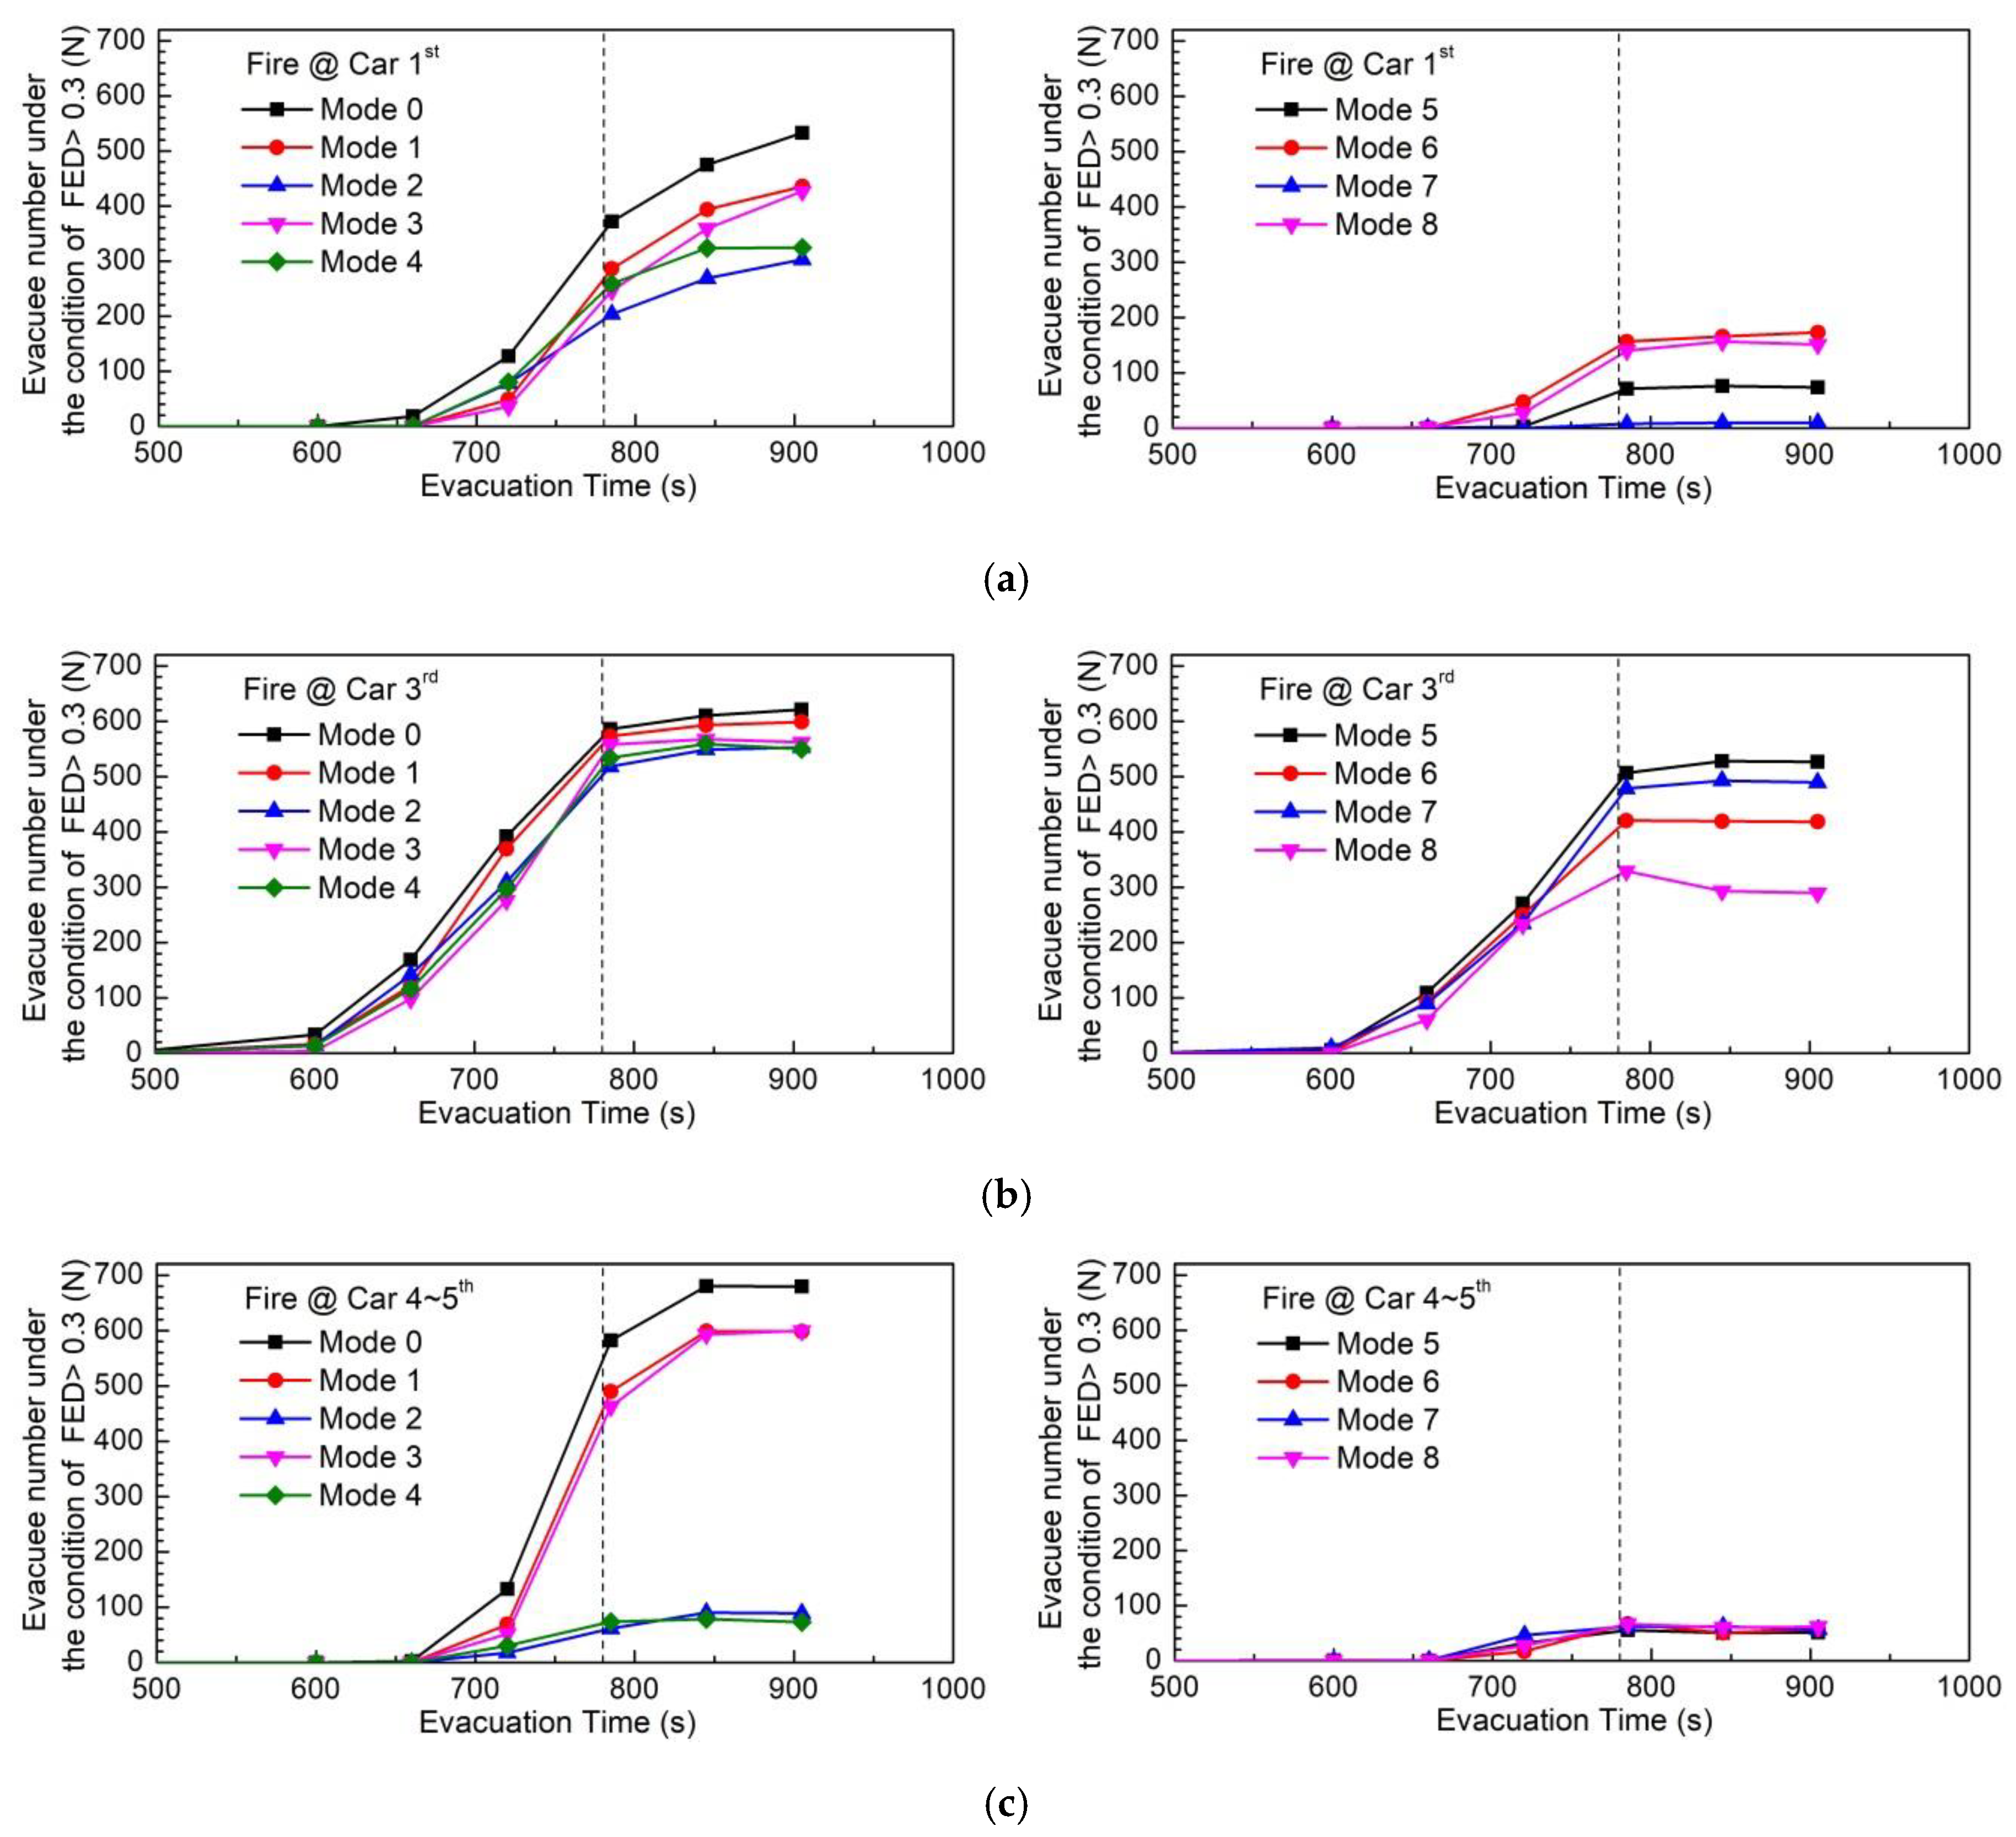
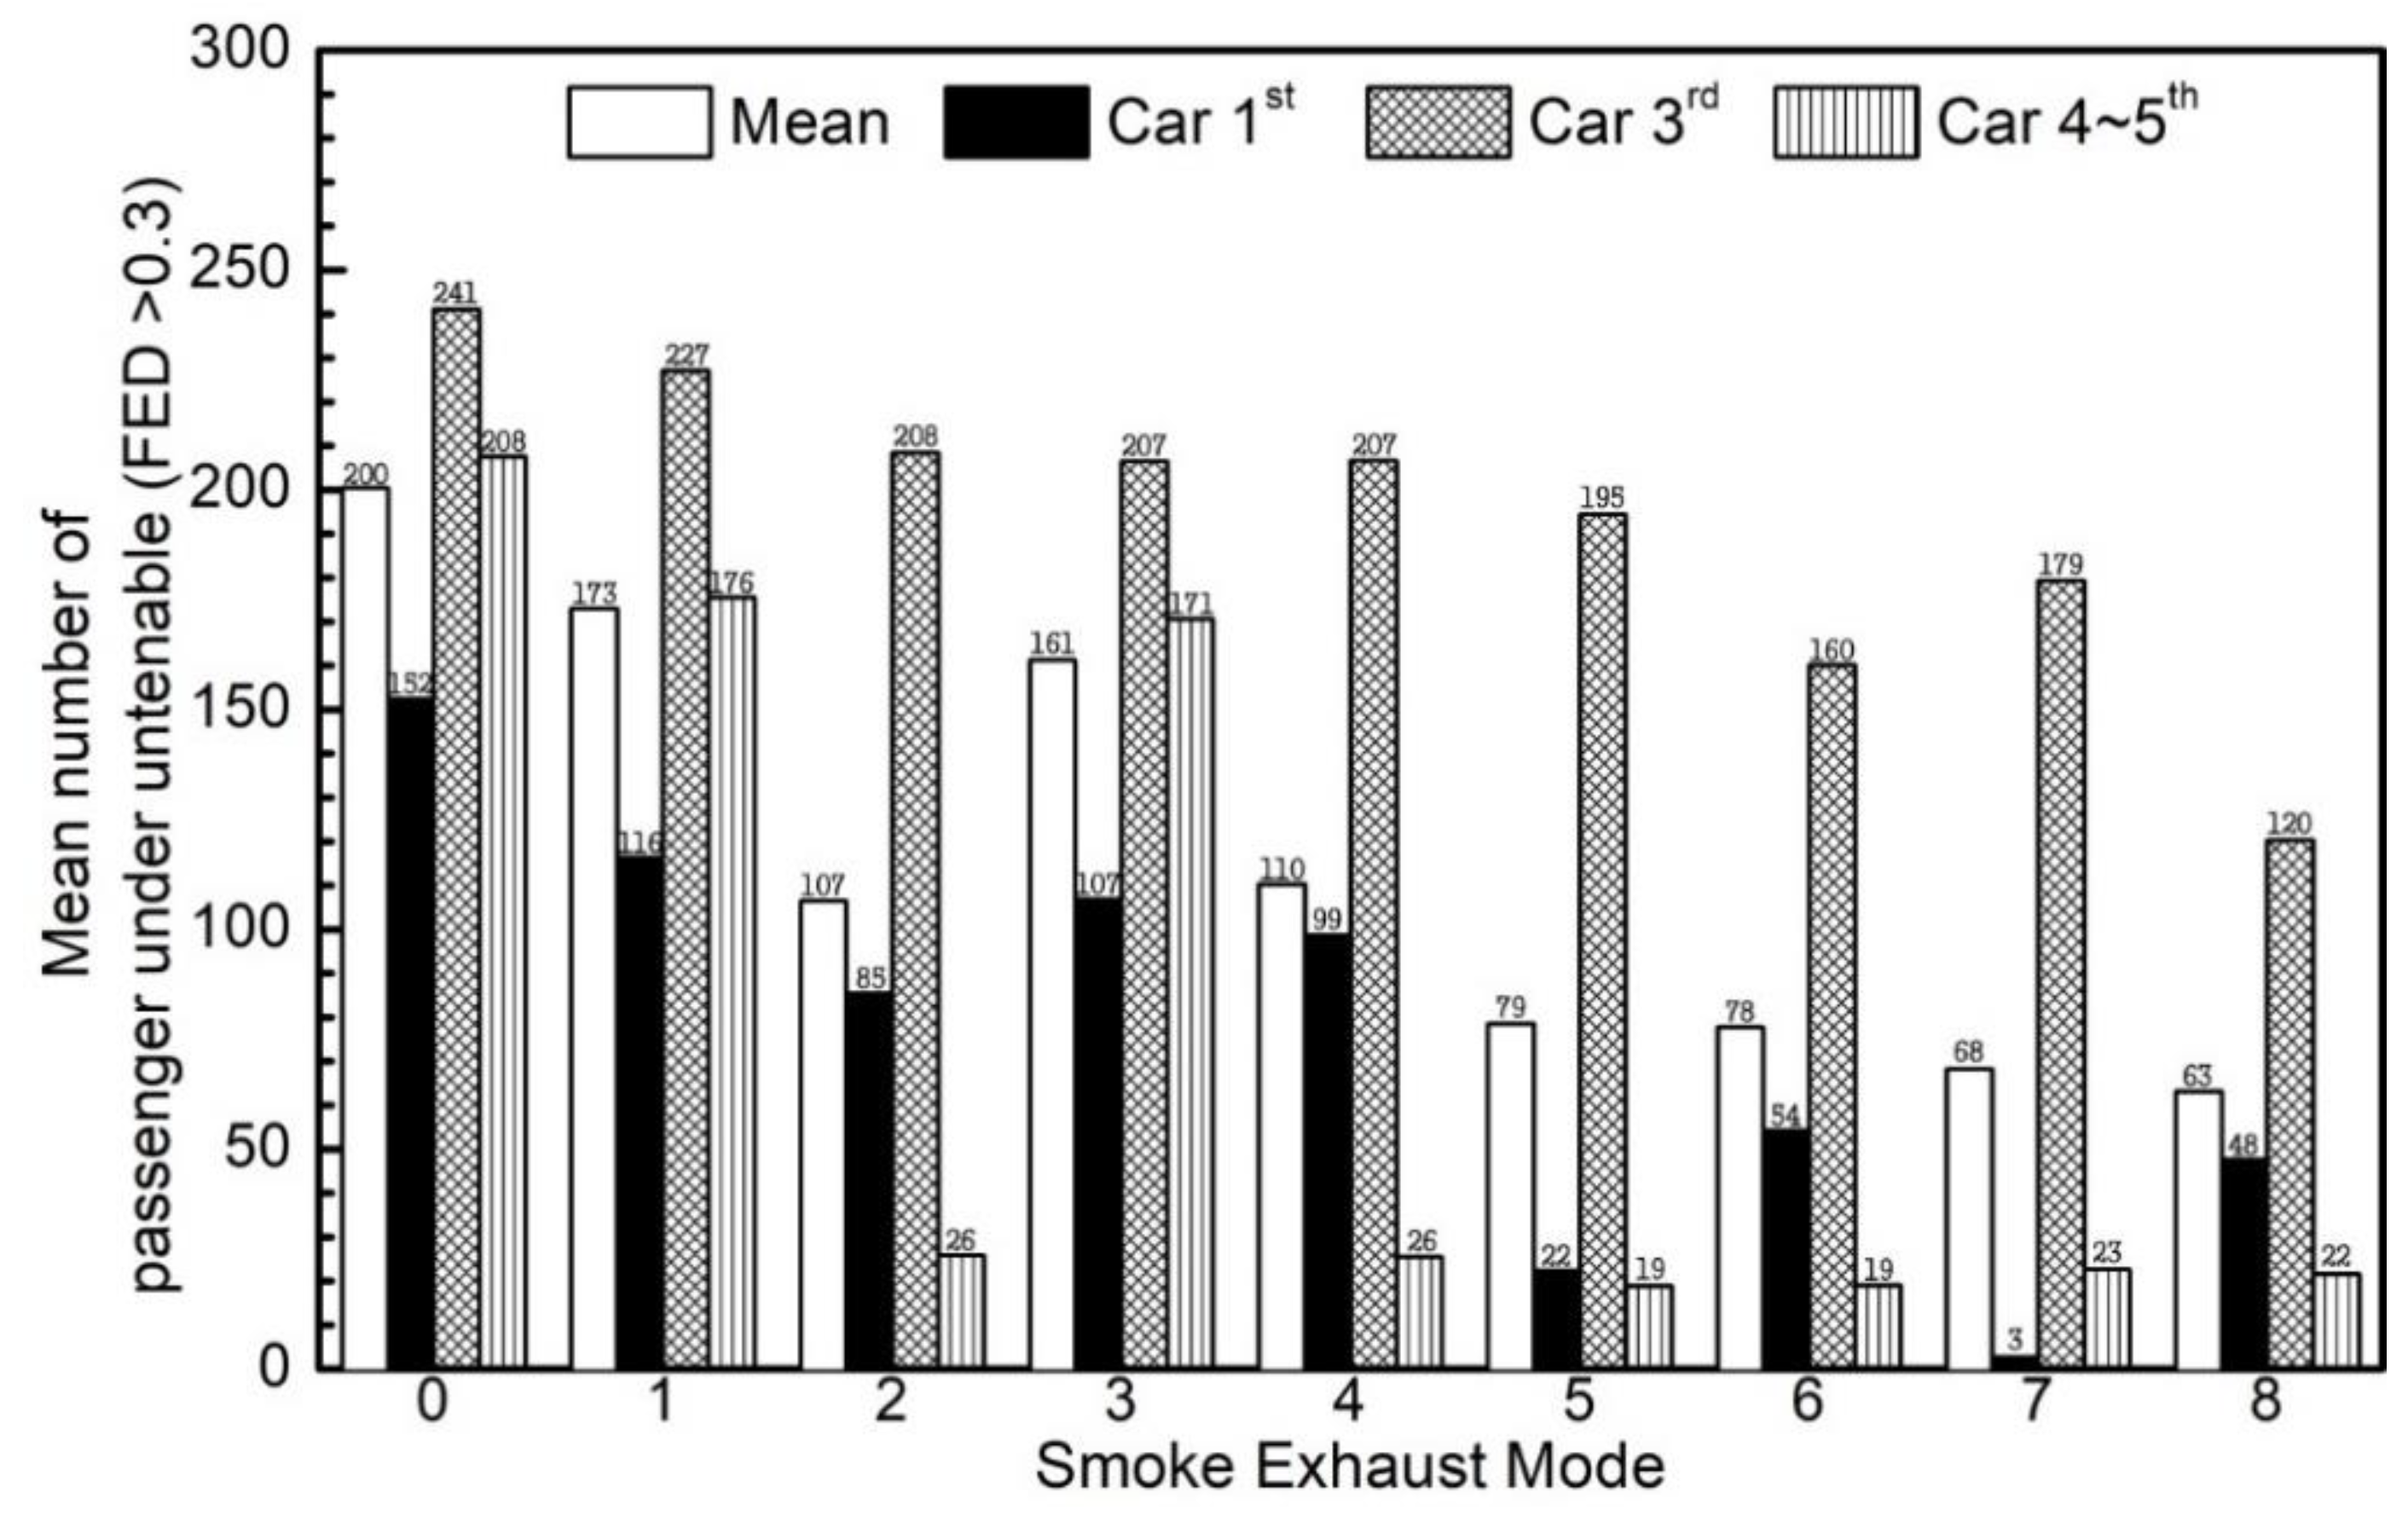
3.5. Fatality Estimate

Figure 17 shows the fatality estimation result by the FED value obtained by Equation (1) over the time of evacuation. In this analysis, the FED >0.3 was applied as a condition for fatality estimate [63].
The characteristics obtained with the Fatality Estimate are as follows:
  • In general, fatality increased rapidly from (660 to 780) s, regardless of the location of the fire train.
  • The slope of fatality decreases after 780 s when Flash-over occurs.
  • The condition that produces the highest fatality is in Mode 0.
  • In the same fire location, fatality is relatively lower in Modes (5–8) with station exhaust system than the Modes (1–4) group.
The not-adopted condition for the station exhaust system (Modes 1–4): Modes 2 and 4 that provide platform air supply regardless of fire location showed a tendency for relatively low fatality, compared to modes 1 and 3. The adopted condition for the station exhaust system (Modes 5–8): Under the 1st passenger train fire condition, Modes 5 and 7 with platform exhaust are relatively lower than Modes 6 and 8 with platform air supply. However, the conditions of the 3rd passenger train fire showed relatively low fatality in Modes 6 and 8 applied to the platform air supply, and fatality occurred similarly in fire between 4th and 5th passenger trains, regardless of the air supply or exhaust application. Table 5 shows the time when the initial fatality occurred for each condition, and it was confirmed that fatality occurred the fastest in the 3rd passenger train fire condition.
Figure 18 shows the total number of fatalities by fire location up to the end of evacuation from the platform for each smoke exhaust operational mode, and it has the following characteristics.
Operating groups in modes (5–8) with station exhaust systems on both sides of the platform have a lower characteristic of fatality than non-adopted group modes 0–4.
The 1st passenger train fire had the lowest fatality of 11 people in Mode 7, and it can be found that the platform exhaust method (operational modes 5 and 7) provided a safer evacuation environment than the platform air supply method (operational modes 6 and 8).
The 3rd passenger train fire had the lowest fatality of 131 people in Mode 8, and it can be found that the platform air supply method (operational modes 6 and 8) provided a safer evacuation environment than the platform exhaust method (operational modes 5 and 7).
The between 4th and 5th passenger train fire showed the lowest fatality of 19 people in Modes 5 and 6, and it was shown that in Modes 1–4, the platform air supply method (operational modes 2 and 4) provide a safer evacuation environment. Moreover, in Modes 5–8, the platform air supply method (operating modes 6 and 8) provided a slightly safer evacuation environment than the platform air exhaust method.
The fire train that generates the most fatalities is the 3rd passenger train fire condition. In this case, the application of mode 8 was found to be the optimal condition to bring the fatalities to the lowest level.
From the mean values for the three fire locations adopted in this study, the most effective combination of smoke exhaust systems for evacuation safety was found to be mode 8, with an average value of 63 fatalities. Mode 8 is operated by a combination of platform HVAC air supply + TES and a station exhaust system at both ends of the tunnel in the platform tunnel.

4. Conclusions

The directions against disaster in subways inquired as sustainable urban planning techniques, which are presented in this study, are as summarized:
(a)
The ASET/RSET assessment is evaluated by starting time for the existence of untenable fire effluent’s value which is generated in the platform. Therefore, it may produce excessive design capacity. It was found that the fatality estimates, the ASET/RSET assessment, is evaluated by starting time for the existence of untenable fire effluent’s value, which is generated in the platform. Therefore, it may produce excessive design capacity.
(b)
The application of untenable area analysis allows efficient evaluation of the smoke exhaust performance of the facility by reflecting the area ratio of the platform occupied by the fire effluents. However, more accurate evacuation safety assessments can be obtained if they can be linked to evacuee’s real-time location information.
(c)
To improve the accuracy of the FED analysis, fire effluent data should be provided for the type of interior finish applied to the subway. Lack of information on the material to be applied in the future can be a decisive obstacle to risk assessment.
(d)
The calculated fatality by the FED analysis depends on the performance of the smoke exhaust facility, and evacuation drills are limited within the performance design range. Therefore, subway fire disaster prevention should be developed along with performance-based design.
(e)
To minimize casualties from fires occurring in the subways, current studies separated into fields of design and operation of the subways against disasters must be developed toward integration.
(f)
The distribution of fire effluents on the platform and evacuation routes for evacuees are the main judgment factors for the calculation of fatalities. Since evacuees have different evacuation routes under the individual circumstances, the development of agent-based evacuation simulations can provide more accurate quantitative fatality predictions.
(g)
The integrated studies on prevention of disasters in the subways should focus on the improvement in assessment of performance of equipment for prevention of disasters and the assessment of accuracy in human-oriented risk assessment against disasters.
The main cause of death in subway fires is asphyxiation, due to the closed specificity of the underground space unlike ground structures and the characteristic stack effect, which has the same evacuation route as the smoke flow. The performance evaluation of the smoke exhaust system has been mostly performed on fires generated from platform stop conditions. However, fire does not only occur on the platform but also within the tunnel. In the event of a fire while in a tunnel, it takes time to move to the rescue site to evacuate passengers. Therefore, a fire while the train is running has a longer evacuation start time than a fire that occurs when the vehicle is stopped on the platform.
This study did not include simulations of fires that occur in the running subway. In the near future, platform fire analysis, which combines fire dynamics simulation in tunnel sections should be enabled to perform evaluation and design of smoke exhaust systems for safe evacuation of passengers. In addition, intelligent operation to optimize smoke exhaust is essential too.

Author Contributions

Conceptualization, D.R. and J.R.; methodology, J.R.; software, J.R.; validation, D.R., J.R.; formal analysis, J.R.; investigation, D.R.; resources, J.R.; data curation, J.R.; writing—original draft preparation, J.R.; writing—review and editing, D.R.; visualization, J.R.; supervision, D.R.; project administration, J.R.; funding acquisition, D.R. All authors have read and agreed to the published version of the manuscript.

Funding

This research received no external funding.

Acknowledgments

This work was supported by Incheon National University Research Grant in 2017.

Conflicts of Interest

The authors declare no conflict of interest.

References

  1. Todd, L. Sustainability and Livability, Summary of Definitions, Goals, Objectives and Performance Indicators; Victoria Transport Policy Institute: Victoria, BC, Canada, 2011. [Google Scholar]
  2. National Research Council of the National Academies. Underground Engineering for Sustainable Urban Development; The National Academies Press: Washington, DC, USA, 2012; pp. 105–111. [Google Scholar]
  3. Todd, L. Well Measured. Developing Indicators for Sustainable and Livable Transport Planning; Victoria Transport Policy Institute: Victoria, BC, Canada, 2019. [Google Scholar]
  4. NFPA. NFPA 130-Standard for Fixed Guideway Transit and Passenger Rail Systems; National Fire Protection Association: Quincy, MA, USA, 2017. [Google Scholar]
  5. South Korea Daegu Subway Station-Arson. Available online: http://www.railsystem.net/south-korea-daegu-subway-station-arson/ (accessed on 15 May 2018).
  6. Rie, D.H.; Hwang, M.W.; Kim, S.J.; Yoon, S.W.; Ko, J.W.; Kim, H.Y. A study of optimal vent mode for the smoke control of subway station fire. Tunn. Undergr. Space Technol. 2006, 21, 300–301. [Google Scholar] [CrossRef]
  7. Giachetti, B.; Couton, D.; Plourde, F. Smoke spreading analysis from an experimental subway scale model. Fire Saf. J. 2016, 86, 75–82. [Google Scholar] [CrossRef]
  8. Giachetti, B.; Couton, D.; Plourde, F. Smoke spreading analyses in a subway fire scale model. Tunn. Undergr. Space Technol. 2017, 70, 233–239. [Google Scholar] [CrossRef]
  9. Li, A.-C.; Shu, C.-M.; Teng, Y.-T.; Shen, T.-S.; Hsieh, P.-P. Performance-based fire safety engineering assessment of national museum of marine science and technology. Procedia Eng. 2018, 211, 325–331. [Google Scholar] [CrossRef]
  10. Park, J.; Kim, H.G.; Yoon, S.W.; Seo, S.Y.; Ha, H.S.; Lee, S.P. Development of Fire Scenarios for PBD Fire Safety Design in High-Rise Structures. In Proceedings of the Society Air-Conditioning and Refrigeration Engineering, Youngpeong, Korea, 27–29 June 2012; pp. 258–260. [Google Scholar]
  11. Emad, A.H. Fire Engineering in Sustainable Buildings: An Evaluation for the Application of Performance-Based Design in Abu Dhabi; University of Central Lancashire: Preston, UK, 2016. [Google Scholar]
  12. Till, R.C.; Groner, N. Using Desirable System States to Design for a Hypothetical Subway Arson Incident. J. Appl. Secur. Res. 2009, 4, 245–257. [Google Scholar] [CrossRef]
  13. Xu, H.; Yu, M.; Huang, H.; Fan, Y. A Preliminary Study on the Comprehensive Evaluation of the Disaster Prevention System of Large Urban Underground Space. Geotech. Saf. Risk 2015, 457–462. [Google Scholar] [CrossRef]
  14. Li, Q.; Deng, Y.; Liu, C.; Zeng, Q.; Lu, Y. Modeling and analysis of subway fire emergency response: An empirical study. Saf. Sci. 2016, 84, 171–180. [Google Scholar] [CrossRef]
  15. Wu, J.; Hu, Z.; Chen, J.; Li, Z. Risk assessment of underground subway stations to fire disasters using Bayesian network. Sustainability 2018, 10, 3810. [Google Scholar] [CrossRef] [Green Version]
  16. Emily, Y.Y.C.; Zhe, H.; Kevin, K.C.H.; Gloria, K.W.C.; Holly, C.Y.L.; Eugene, S.K.L.; May, P.S.Y. Health Emergency Disaster Risk Management of Public Transport Systems: A Population-Based Study after the 2017 Subway Fire in Hong Kong. China. Int. J. Environ. Res. Public Health 2019, 16, 228. [Google Scholar]
  17. Panagiotis, N.; Konstantinos, K. Applying stochastic-based approach for developing a quantitative risk assessment method on the fire safety of underground tunnels. Tunn. Undergr. Space Technol. 2018, 81, 619–631. [Google Scholar]
  18. Quan, L.; Ishikawa, T.; Michiue, T.; Li, D.R.; Zhao, D.; Zhu, B.L.; Maeda, H. Quantitative morphometry of granular ‘dot-like’ubiquitin-immunoreactivity in the crus cerebriin asphyxiation and fire fatalities. Leg. Med. 2005, 7, 81–88. [Google Scholar] [CrossRef] [PubMed]
  19. Purser, D.A. The evolution of toxic effluents in fires and the assessment of toxic hazard. Toxicol. Lett. 1992, 64–65, 247–255. [Google Scholar] [CrossRef]
  20. Zhu, B.-L.; Ishikawa, T.; Li, Q.; Oritani, S.; Li, D.-R.; Zhao, D.; Michiue, T.; Tsuda, K.; Kamikodai, Y.; Okazaki, S.; et al. Possible factors contributing to the postmortem lung weight in fire fatalities. Hitoshi. Legal Med. 2005, 139–143. [Google Scholar] [CrossRef] [PubMed]
  21. The application of fire safety engineering principles to fire safety design of building. In PD7974-6: Human Factors: Life Safety Strategies–Occupant Evacuation, Behavior and Condition; British Standard Institution: London, UK, 2004.
  22. Wang, Q. Emergency evacuation capability assessment of subway operation based on Artificial Neural Network. In Proceedings of the 2016 12th International Conference on Natural Computation, Fuzzy Systems and Knowledge Discovery (ICNC-FSKD), Changsha, China, 13–15 August 2016; pp. 12–17. [Google Scholar] [CrossRef]
  23. Cong, C.; Zhou, R. Smoke flow analysis under different exhaust mode in case a fire occurs in a subway carriage. In Proceedings of the 2019 International Conference on Intelligent Transportation, Big Data & Smart City (ICITBS), Changsha, China, 12–13 January 2019; pp. 66–71. [Google Scholar] [CrossRef]
  24. Wu, F.; Zhou, R.; Shen, G.; Jiang, J.; Li, K. Effects of ambient pressure on smoke back-layering in subway tunnel fires. Tunn. Undergr. Space Technol. 2018, 79, 134–142. [Google Scholar] [CrossRef]
  25. Wu, W.-Z.; You, S. Minimal Ventilation velocity to Control Smoke in Subway Fire. 2009 International Conference on Measuring Technology and Mechatronics Automation Measuring Technology and Mechatronics Automation. In Proceedings of the International Conference on ICMTMA 09, Hunan, China, 11–12 April 2009. [Google Scholar]
  26. Tang, F.; Cao, Z.; He, Z.; Ling, X.; Wan, Q. Thermal plume temperature profile of buoyancy-driven ceiling jet in a channel fire using ceiling smoke extraction. Tunn. Undergr. Space Technol. 2018, 78, 215–221. [Google Scholar] [CrossRef]
  27. Park, J.T.; Won, C.S.; Hur, N.K. A numerical study on the fire emergency in the underground station with track exhaust system (TES). J. Comput. Fluid Eng. 2006, 11, 26–31. [Google Scholar]
  28. Meng, N.; Hu, L.; Wu, L.; Yang, L.; Zhu, S.; Chen, L.; Tang, W. Numerical study on the optimization of smoke ventilation mode at the conjunction area between tunnel track and platform in emergency of a train fire at subway station. Tunn. Undergr. Space Technol. 2014, 40, 151–159. [Google Scholar] [CrossRef]
  29. Hu, L.; Wu, L.; Lu, K.; Zhang, X.; Liu, S.; Qiu, Z. Optimization of emergency ventilation mode for a train on fire stopping beside platform of a metro station. Build. Simul. 2014, 7, 137–146. [Google Scholar] [CrossRef]
  30. Li, D.-Y.; Zhu, G.-Q. Effect of Platform Screen Doors on Mechanical Smoke Exhaust in Subway Station Fire. 2017, 8th International Conference on Fire Science and Fire Protection Engineering (ICFSFPE 2017). Procedia Eng. 2018, 211, 343–352. [Google Scholar] [CrossRef]
  31. Zhou, Y.; Bu, R.-W.; Xu, Z.-S.; Chen, H.-J.; Gong, J.-H. Numerical Simulation of Smoke Control Effectiveness with Different Exhaust Modes in a Large Subway Station. 2017, 8th International Conference on Fire Science and Fire Protection Engineering (ICFSFPE 2017). Procedia Eng. 2018, 211, 1065–1074. [Google Scholar] [CrossRef]
  32. McKeen, P. Computational Modeling of Fire Safety in Metro-Stations. Masters of Applied Science in Building Science; Ryerson University: Toronto, ON, Canada, 2016. [Google Scholar]
  33. Ferrazzini, M.; Busslinger, A. Smoke ventilation concepts of CEVA-an underground rail link with 4 stations. In 14th International Symposium on AVVT; BHR Group: Cranfield, UK, 2011. [Google Scholar]
  34. Patel, S.J. Smoke control system for the underground stations of the New York City’s number 7 subway line extension project. In Proceedings of the 12th International symposium on AVVT, Portoroz, Slovenia, 11–13 July 2006. [Google Scholar]
  35. Construction starts on first GTX line in Seoul. Available online: https://www.railjournal.com/passenger/commuter-rail/construction-starts-on-first-gtx-line-in-seoul/ (accessed on 2 January 2019).
  36. Lee, S.H. Forecasting Changes in Trade Areas Due to the Introduction of GTX, a New Regional Express Rail System in Seoul Metropolitan Area. Korea Spat. Plan. Rev. 2018, 18, 37–51. [Google Scholar]
  37. Park, C.-B.; Lee, B.-S.; Lee, J. A Study on the Applicability of the Conventional TTX Propulsion System on the High-speed Propulsion System for a Deep-underground GTX. Int. J. Railw. 2010, 3, 54–59. [Google Scholar]
  38. Andy, T. Seoul to build high-speed regional rail network. Int. Railw. J. 2017. [Google Scholar]
  39. McGrattan, K.B.; McDermott, R.J.; Weinschenk, C.G.; Forney, G.P. Fire Dynamics Simulator (6th Edition) Technical Reference Guide Volume 1: Mathematical Model, NIST Special Publication 1018, FDS Version 6.0.1, SVN Revision 17529; NIST: Gaithersburg, MD, USA, 2013. [Google Scholar]
  40. KRRI. Guideline for Fire Safety Evaluation of Railway Tunnel; KRRI: Seoul, Korea, 2011. [Google Scholar]
  41. Kim, S.S.; Cho, N.W.; Rie, D.H. A Research for Assessment Fire Toxic Gas of Construction Material Using FT-IR and FED. Fire Sci. Eng. 2011, 25, 27–31. [Google Scholar]
  42. Lee, K.J.; Choi, Y.U.; Lee, Y.S. A Study on the Fire Risk Estimation based on a Fractional Effective Dose Model using Multi Sensors. In Proceedings of the Symposium of the Korean Institute of communications and Information Sciences, Jeju, Korea, 22–24 June 2016; pp. 846–847. [Google Scholar]
  43. Hartzell, G.E.; Emmons, H.W. The Fractional Effective Dose Model for Assessment of Toxic Hazards in Fires. J. Fire Sci. 1988, 356–362. [Google Scholar] [CrossRef]
  44. Zhang, N.; Zhou, D. Impact of the Heat Release Rate to the Flow Characteristics of Fire Smoke in Subway Tunnel under the Effect of Piston Wind. In Proceedings of the 2016 IEEE International Conference on Intelligent Rail Transportation (ICIRT) Intelligent Rail Transportation (ICIRT), Birmingham, UK, 23–25 August 2016; pp. 394–400. [Google Scholar]
  45. Willemann, D.; Sanchez, J.G. Computer modeling tech. and analysis used in design of tunnel ventilation fan plants for the New York city subway. In Proceedings of the 2002 ASMWIEEE Joint Rail Conference, Washington, DC, USA, 23–25 April 2002; pp. 23–25. [Google Scholar]
  46. Flores-Herrera, L.A.; Sandoval-Pineda, J.M.; Silva-Rivera, U.S.; Tamayo-Meza, P.A.; Rivera-Blas, R. CFD simulation of obstructed ventilation ports in a subway tunnel. Int. J. Simul. Model. 2017, 16, 386–398. [Google Scholar] [CrossRef]
  47. Wang, W.L.; Lo, T.Y.J. A Simulation Study on Passenger Escape in Rail Tunnels. Procedia Eng. 2014, 71, 552–557. [Google Scholar] [CrossRef] [Green Version]
  48. Ryu, J.O.; Kim, J.S.; Rie, D.H. Numerical Study on the Supply and Exhaust Port Size and Fire Management Method in the Semi-transverse Ventilation System for Road Tunnel. Fire Sci. Eng. 2016, 30, 68–74. [Google Scholar] [CrossRef] [Green Version]
  49. Bao, R.; Ki, A.; Hao, X.; Lei, W.; Deng, B. Prediction of the spread of smoke in a huge transit terminal subway station under six different fire scenarios. Tunn. Undergr. Space Technol. 2012, 31, 128–138. [Google Scholar]
  50. Qu, L.; Chow, W.K. Common practices in fire hazard assessment for underground transportations. Tunn. Undergr. Space Technol. Inc. Trenchless Technol. Res. 2013, 38, 377–384. [Google Scholar] [CrossRef]
  51. Poo, S. A dynamic approach to ASET/RSET assessment in performance based design. Procedia Eng. 2014, 71, 173–181. [Google Scholar]
  52. Cooper, Y.; Stroup, D.W. Calculating Available Safe Egress Time (ASET)–A Computer Program and User’s Guide. US Dep. of Commerce, National Bureau of Standards. 1982. Available online: https://www.nist.gov/publications/calculating-available-safe-egress-time-aset-computer-program-and-users-guide (accessed on 4 November 2018).
  53. Zhang, L.; Wu, X.; Liu, M.; Liu, W.; Ashuri, B. Discovering worst fire scenarios in subway stations: A simulation approach. Autom. Constr. 2019, 99, 183–196. [Google Scholar] [CrossRef]
  54. Purser, D.A. Effects of pre-fire age and health status on vulnerability to incapacitation and death from exposure to carbon monoxide and smoke irritants in Rose park fire incident victims. Fire Mater. 2017, 41, 555–569. [Google Scholar] [CrossRef]
  55. Purser, D.A.; McAllister, J.L. Assessment of Hazards to Occupants from Smoke, Toxic Gases, and Heat, SFPE Handbook of Fire Protection Engineering; Springer: Berlin/Heidelberg, Germany, 2016; pp. 2308–2428. [Google Scholar]
  56. Richard, G.G. Estimating Data for Incapacitation of People by Fire Smoke. Fire Technol. 2004, 40, 201–207. [Google Scholar]
  57. Stuhmiller, J.H.; Long, D.W.; Stuhmiller, L.M. An Internal Dose Model of Incapacitation and Lethality Risk from Inhalation of Fire Gases. Inhal. Toxicol. 2006, 18, 347–364. [Google Scholar] [CrossRef] [PubMed]
  58. Anna, S.; Hull, R. Fire Toxicity; CRC Press: Boca Raton, FL, USA, 2010. [Google Scholar]
  59. Kim, N.K.; Kang, Y.S.; Rie, D.H. Estimating toxic harmfulness based on quantitative analysis (1)-Factor analysis of harmfulness of combustion products on building materials. Fire Saf. J. 2019, 106, 80–87. [Google Scholar] [CrossRef]
  60. Beom, J.J.; Lee, K.W. A Comparative Study on the Toxicity Evaluation for Fire Smoke by FDS. J. Korean Inst. Gas 2015, 19, 38–44. [Google Scholar] [CrossRef] [Green Version]
  61. Purser, D.A. Toxicity Assessment of Combustion Products. In SFPE Handbook of Fire Protection Engineering, Society of Fire Protection Engineers and National Fire Protection Association; DiNenno, P.J., Ed.; Springer: Quincy, MA, USA, 1988; pp. 2308–2428. [Google Scholar]
  62. Speitel, L.C. Toxicity Assessment of Combustion Gases and Development of a Survival Model; Federal Aviation Administration: Washington, DC, USA, 1995. [Google Scholar]
  63. Life-Threatening Components of Fire Guidelines for the Estimation of Time Available for Escape Using Fire Data; Technical Specification ISO/TS 13571; International Organization for Standardization: Geneva, Switzerland, 2002.
  64. Maevski, I.Y. NCHRP Synthesis 415: Design Fires in Road Tunnels–A Synthesis of Highway Practice; Transportation Research Board: Washington, DC, USA, 2011. [Google Scholar]
  65. Węgrzyński, W.; Vigne, G. Experimental and numerical evaluation of the influence of the soot yield on the visibility in smoke in CFD analysis. Fire Saf. J. 2017, 91, 389–398. [Google Scholar] [CrossRef]
  66. Jin, T.; Yamada, T. Irritating Effects of Fire Smoke on Visibility. Fire Sci. Technol. 1985, 5, 79–90. [Google Scholar] [CrossRef] [Green Version]
  67. Caruso, G.; Ferroni, L. Numerical Simulation of a Fire Scenario. CFD Lett. Dec. 2014, 6, 131–143. [Google Scholar]
  68. Ludeman, J. Fire and Life Safety Analysis-College Campus Building; Culminating Experience Project Reports in Fire Protection Engineering; DigitalCommons@CalPoly: San Luis, CA, USA, 2018. [Google Scholar]
  69. Almohammadi, S. Fire and Life Safety Report Orfalea College of Business; Culminating Experience Project Reports in Fire Protection Engineering; DigitalCommons@CalPoly: San Luis, CA, USA, 2017. [Google Scholar]
  70. Tharima, A.F.; Rahman, M.M.; Yusoff, M.Z.; Kueh, A.B.H. Multi-objective optimization of underground car park design for tenability under fire-induced smoke. Tunn. Undergr. Space Technol. Inc. Trenchless Technol. Res. 2019, 85, 220–230. [Google Scholar] [CrossRef]
  71. Wood, D.J. Fire Protection and Life Safety Analysis-Building 192–Engineering IV; Culminating Experience Project Reports in Fire Protection Engineering; DigitalCommons@CalPoly: San Luis, CA, USA, 2018. [Google Scholar]
  72. Dew, J. Fire Protection and Life Safety Evaluation-Hinesville CBOC VA Clinic, Culminating Experience Project Reports in Fire Protection Engineering; DigitalCommons@CalPoly: San Luis, CA, USA, 2014. [Google Scholar]
  73. Purser, D. ASET and RSET: Addressing some issues in relation to occupant behavior and tenability. In Fire Safety Science, Fire Safety Science-Proceedings of the 7th International Symposium; International Association for Fire Safety Science: Garston, UK, 2003; pp. 91–102. [Google Scholar]
  74. Babrauskas, V.; Fleming, J.M.; Don Russell, B. RSET/ASET, a flawed concept for fire safety assessment. Fire Mater. 2010, 37, 341–355. [Google Scholar] [CrossRef]
Figure 1. The GTX subway line in the Seoul metropolitan area.
Sustainability 12 00372 g001
Figure 2. Comparison of fire growth curves: (a) previous studies; (b) adopted fire growth curve.
Sustainability 12 00372 g002
Figure 3. Flow chart of the analysis.
Sustainability 12 00372 g003
Figure 4. Evacuation analysis flow-chart.
Sustainability 12 00372 g004
Figure 5. Platform dimension. PSD: platform screen door; ST EA1: station exhaust system1; ST EA2: station exhaust system 2. TESUP: upper track exhaust system; TESDN: bottom track exhaust eystem; HVAC: platform heating; ventilating and air conditioning system; PSD: platform screen door.
Sustainability 12 00372 g005
Figure 6. Flow chart of the smoke exhaust operational modes.
Sustainability 12 00372 g006
Figure 7. Temperature, CO, and visibility distributions at the height of 1.8 m above platform according to the variation of fire location by the ventilation operational mode 0: (a) 1st subway passenger train fire; (b) 3rd subway passenger train fire; (c) between 4th and 5th subway passenger train.
Sustainability 12 00372 g007
Figure 8. Temperature, CO, and visibility distributions at the height of 1.8 m above platform according to the variation of fire location by the ventilation operational mode 8: (a) 1st subway passenger train fire; (b) 3rd subway passenger train fire; (c) between 4th and 5th subway passenger train.
Sustainability 12 00372 g008
Figure 9. Temperature and CO; soot distribution at the respiration height 1.8m of platform according to the fire location of 1st car by the ventilation operational mode 0: (a) temperature; (b) CO concentration; (c) visibility.
Sustainability 12 00372 g009
Figure 10. Temperature and CO; soot distribution at the respiration height 1.8 m of platform according to the fire location of 1st car by the ventilation operational mode 8: (a) temperature; (b) CO concentration; (c) visibility.
Sustainability 12 00372 g010
Figure 11. ASET contours for exhaust operational mode 0 for 3 kinds of fire position: (a) temperature; (b) CO concentration; (c) visibility.
Sustainability 12 00372 g011
Figure 12. ASET contours for exhaust operational mode 8 by 3 kinds of fire position: (a) temperature; (b) CO concentration; (c) visibility.
Sustainability 12 00372 g012
Figure 13. Longitudinal platform Mean ASET according to the fire location for the condition of operational modes 0 and 8.
Sustainability 12 00372 g013
Figure 14. Longitudinal platform Mean ASET according to visibility by the variation of exhaust operational mode for the fire at the 3rd passenger train.
Sustainability 12 00372 g014
Figure 15. Platform area ratio that has evacuation temperature limit over 60 °C.
Sustainability 12 00372 g015
Figure 16. Platform area ratio that has evacuation visibility limit over 10 m.
Sustainability 12 00372 g016
Figure 17. Fatality estimate by smoke exhaust operational mode: (a) 1st passenger train fire; (b) 3rd passenger train fire; (c) fire between 4th and 5th passenger train.
Sustainability 12 00372 g017
Figure 18. Total fatality by smoke operational mode.
Sustainability 12 00372 g018
Table 1. Platform supply and exhaust air flow rate for each smoke exhaust operational mode.
DivisionHVAC System of PlatformTES (Track Exhaust Sys.)Station Exhaust System (at Both Sides)Smoke Exhaust Operational Mode
Supply AirExhaust AirSupply AirExhaust Air
Air flow rate (m3/min)834 (50,000 m3/h)834 (50,000 m3/h)403.2403.23600
Fan operation condition for smoke exhaust operational mode-----0
-ON---1
ON----2
-ONONON-3
ON-ONON-4
-ONONONON5
ON-ONONON6
-ON (100,000 m3/h)ON(806)ON(806)ON7
ON (100,000 m3/h)-ON(806)ON(806)ON8
Table 2. ASET by fire train location under the condition of modes 0 and 8.
ModePosition of Passenger Train
1st3rd4th–5th
Mean
ASET
0630700703
814181930830
Table 3. Average difference of ASET.
Mode (ASETmax—ASETmin)
5 (190) = 6 (190) < 7 (234) < 8 (1222)
Table 4. Tenability limits.
Physical PropertySafe Condition
Temperatureunder 60 °C
Carbon monoxideunder 1400 ppm
Visibility 2over 10 m
Table 5. Start time of fatality occurring.
Position of Passenger Train Fire Mode 0~4Mode 5~8
1st600 s600 s
3rd360 s480 s
between 4th~5th660 s600 s

