Abstract
Soils in arid and semi-arid environments are threatened by salinization. A cost-effective and efficient way to reclaim saline land is through leaching. This will be most effective in situations where direct human impact is the cause for salinity, e.g., in environments affected by industrial use or land rehabilitation following mining. Irrigation, which is the most common means of achieving salt leaching, is not feasible for the reclamation of mine sites’ salt-affected soils located in remote areas, and thus, land reclamation largely relies on natural climatic conditions. This study was conducted to assess the effect of different climatic conditions of semi-arid environments on spatio-temporal salt leaching from brine-affected soil, and investigate the efficacy of the reduction of soil bulk density as a reclamation technique for saline land experiencing water scarcity. Three regions (represented by the Australian cities of Roma, Mount Isa, and Quilpie) representing semi-arid environments of Australia were selected, and their climatic scenarios (23 years) were applied to a validated HYDRUS-1D model. A brine-affected soil typical to Queensland, Australia, was chosen for this study. The investigations established that a greater number of individual high rainfall events resulted in a greater reduction of salinity in Roma (96%) and Mount Isa (93.31%) compared with Quilpie (58.75%), in which the soil salinity approached a level (<2 dS m−1) that was suitable for sustaining plant growth. Soil salinity reduced to 8 dS m−1 under the climatic conditions of the Quilpie region. This study also demonstrated that the success of salt leaching from a brine-affected soil is a consequence of a sensitive response to the depth of individual rainfall events rather than rainfall distribution and the total amount of rainfall, and is controlled by the physical properties of the soil. Where climatic conditions cannot solely assist with salt leaching, reclamation may be successful by reducing soil bulk density.
1. Introduction
Salinity affects approximately 400 Mha of land globally [1,2], almost 80% of which is affected by primary salinization, with the remaining 20% impacted by secondary salinization as a result of anthropogenic activities, such as agriculture, mining activities, as well as oil and gas extraction [3]. In this context, Australia holds vast mineral and energy resources where significant ecological biodiversity or agro-ecosystems are situated [4]. Therefore, it is a legislative requirement to reclaim post-mining landscapes to provide safe, stable, and non-polluting environments [5], which offer an opportunity for the revegetation of saline post-mining landscapes [6,7].
Leaching is a typical technique for the reclamation of a saline soil, and if the soil is saline-sodic, a Ca2+ amendment (e.g., gypsum) to ameliorate the soil structure followed by leaching is applied [8,9,10,11,12,13] to reduce the concentrations of soil solutes to a level (~2 dS m−1) suitable for growing plants and revegetation [8,10,14]. Irrigation is a conventional method for salt leaching. However, it is often not feasible for the reclamation of post-mining areas, due to their location in remote areas and a lack of water availability. Water availability is a critical factor for the mining industry in many parts of Australia, as approximately one-third of Australia is arid with <250 mm annual rainfall, and another one-third is semi-arid (250–550 mm annual rainfall), with most mining areas located in semi-arid environments [4]. Therefore, post-mining land reclamation (i.e., salt leaching) relies on natural climatic conditions.
For salt leaching to be successful, the salt must be removed from the surface soil, and leached to depths from where its return becomes unlikely [8]. Therefore, it is not only soil parameters that decide the success of salt leaching, but also environmental factors such as climatic conditions [15,16,17,18]. Salt-affected soils are mostly found in ‘arid and semi-arid environments’ [2,19,20] where solutes may be leached to deeper depths of the soil profile during rainfall events, but then return to the surface soil during evaporation through capillary rise [16,17,21,22,23]. Therefore, rainfall characteristics such as the amount and distribution (i.e., intensity, frequency, and duration) as well as evaporation can determine salt dynamics in the soil, and, thus, the success of salt leaching and land reclamation. In this context, understanding the influence of different rainfall and evaporation patterns (climatic variability), typical semi-arid environments, on spatial and temporal salt movement is essential for designing the best reclamation technique for a saline post-mining landscape.
Until now, several studies [24,25,26,27,28,29] demonstrated the distribution of salinity within different depths of ‘agricultural soil’ under different irrigation regimes and plant cultivation practices. Studies [17,23] have also been conducted to evaluate the evolution of salts on the calcareous hillslopes of Mediterranean soils under different climatic conditions. However, the literature still lacks any information on the effect of different rainfall and evaporation patterns of semi-arid environments on long-term spatio-temporal salt movement (salt leaching) within a soil profile, despite its importance for designing a cost-effective reclamation practice for post-mining landscapes across semi-arid climatic regions.
This study aims (i) to simulate and evaluate the effect of different climatic conditions (rainfall and evaporation patterns) of semi-arid regions on the success of salt leaching from a brine-affected soil; and (ii) to assess the reduction of soil bulk density as a reclamation option for post-mining landscapes experiencing water scarcity.
2. Materials and Methods
2.1. Study Sites and their Climatology
Mining activities in semi-arid environments of Australia have led to the salinization of soils. These salt-affected soils require rehabilitation due to legislation requirements [5]. In this context, three regions in Queensland, Australia (Roma, Mount Isa, and Quilpie), which are major mining areas within Australia, were selected (Figure 1). These regions are also representative of typical semi-arid environments of Australia, but, nevertheless, show differences (Figure 1 and Table 1). Based on the Koeppen classification system modified by the Bureau of Meteorology, Australia [30], Mount Isa and Quilpie are classified as grasslands, and Roma is categorized as subtropical. The climatological characteristics of these three regions, which are presented in Table 1, show the lower amount of annual rainfall and effective rainy days for the Quilpie region compared to the other studied sites. However, potential evaporation of the Mount Isa region is higher, compared to the other sites (Table 1). The intensity-frequency-duration (IFD) of the rainfalls, which were calculated based on 30 years of rainfall data by statistical analyses [31], were collected from the Bureau of Meteorology [32] and summarized in Table A1 and Table A2. Based on the calculation, the amount of rainfall (within 168 h; maximum time for calculation) with 63.20% annual exceedance probability (AEP) is 93.8, 92.5, and 67.3 mm for Roma, Mount Isa, and Quilpie, respectively (Table A1). The intensity of frequent rainfall (AEP of 63.20%) is 27.9, 28.9, and 19.6 mm h−1 for Roma, Mount Isa, and Quilpie, respectively (Table A2). Therefore, based on the climate data and these statistical analyses (Table 1, Table A1 and Table A2), the Quilpie region has dispersed small rainfall events, while the Mount Isa region has dispersed high rainfall events compared to the other sites. Roma region has frequent high rainfall events compared to the other studied sites (Table A1, Table A2 and Table 1).
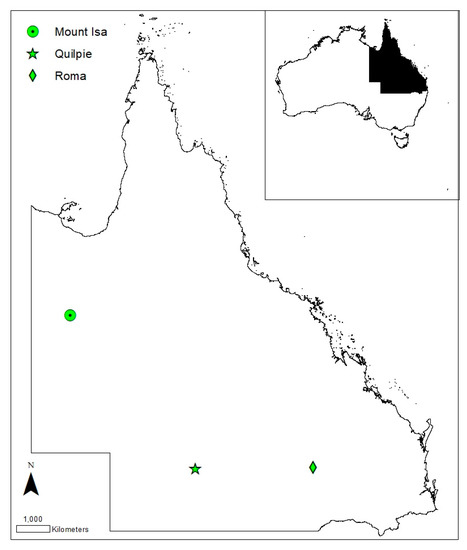
Figure 1.
Map of Queensland indicating the studied sites.

Table 1.
Climatic data for the studied sites [30].
2.2. Soil Characteristics
To evaluate the effect of the selected climatic conditions on salt leaching (i.e., land reclamation), a brine-affected soil, typical to Queensland and representative for saline soils in each of the three regions based on the Queensland Department of Environment and Resource Management [33] and Queensland Government [34] classifications, was used in this study. The soil is representative of that found in mine sites located in the three studied regions. The soil used in this study was collected from an oilfield located in Quilpie Shire, South West Queensland, Australia (Figure 1). The oilfield land was affected by highly saline water, a by-product of oil extraction [35]. A comprehensive description of the oilfield land was reported in Shaygan, Mulligan, and Baumgartl [35]. The selected soil was classified as silty loam (18% clay, 60% silt, and 22% sand) and as saline-sodic (EC: 13.58 ± 0.26 dS m−1 and pH: 7.96 ± 0.09) with an average bulk density of 1.57 g cm−3 [35]. The soil was also non-calcareous, and X-Ray diffraction analysis indicated that it contains gypsum (17% wt) [35]. The salt crust on the surface soil prevented vegetation establishment and growth [35]. The microbial activities were very low due to the high soil salinity [35].
To determine the physical properties of the soil, intact soil samples (n = 8) were collected from the study site in Quilpie. Then, the saturated hydraulic conductivity was determined using a constant head permeability test [36]. To determine the water retention curve of the soil, we followed the Shaygan [37] method. The saturated soil cores were desiccated to −1, −2, and −3 kPa with 24 h intervals using a sand-based tension table. Then, the soil cores were placed on a porous plate in vacuum controlled pressure for 4, 6, and 5 days sequentially, to obtain water potentials at −10, −30, and −50 kPa. Then, the samples were transferred to a pressure plate (1500F1; Soil Moisture, Santa Barbara, CA, USA) for three weeks to achieve the soil water potential at −500 kPa. The soil samples were weighed for each desiccation step to determine the gravimetric water content. The volumetric water content was then derived from the gravimetric water content using the bulk density. Subsequently, the soil water retention curve was determined based on the measured values and by using RETC software [38].
The disturbed samples (n = 8) were also collected from the site, dried in a 40 °C dehydrating oven and sieved to less than 2 mm. The exchangeable cations (Na+, K+, Ca2+, Mg2+) were released as described in Rayment and Lyons [39] using a 1:20 w/v (soil: 1 M NH4Cl) extraction after treatment by 60% aqueous ethanol and 20% aqueous glycerol to remove soluble salts. The exchangeable cations were then measured by a Varian Vista-Pro inductivity-coupled plasma-optical emission spectrometer (ICP-OES) (ThermoFisher Scientific, Waltham, MA, USA). In this study, the cation exchange capacity was equal to the sum of the adsorbed concentrations of the four cations [39,40]. The soil solution cations (Na+, K+, Ca2+, Mg2+) were also analyzed by an inductivity-coupled plasma-optical emission spectrometer (ICP-OES) and the anions (Cl− and SO4−2) were measured by ion chromatography (IC) (ThermoFisher Scientific, Waltham, MA, USA). The quantity of precipitated gypsum was calculated as described in Suarez and Šimůnek [41]. The diffusion coefficient value and dispersivity value of NaCl were used for the modeling study as mentioned in other studies [42,43]. The Gapon exchange coefficients (KCa/Na, KCa/Mg, KCa/K), which described the partitioning between the solid phase and solution, were calculated as described in White, et al. [44] using the following equation:
where y and x are the valances of species i and j, c is the concentration of the ions in solution, and is the concentration of the exchange phase.
A reduction in soil bulk density can change soil hydraulic properties [45]. Therefore, to determine the hydraulic properties of soil with a bulk density of 1.2 g cm−3, the soil was dried and sieved to less than 2 mm. Subsequently, it was packed into small cores (40 mm height and 56 mm diameter) to achieve a bulk density of 1.2 g cm−3. Three replicates were produced. The soil cores were then subjected to three wet-dry cycles to stimulate aggregate formation. After the final cycle, the soil cores were saturated to determine saturated hydraulic conductivity and water retention curve based on the methods mentioned previously in Klute and Drikson [36] and Shaygan [37]. Average values of three replicates were used in the model. The detailed chemical and physical properties of the soil are summarized in Table 2.
Table 2.
The HYDRUS model inputs for the brine-affected soil with bulk density (BD) of 1.57 g cm−3 (natural soil) and 1.2 g cm−3 (reclaimed soil).
2.3. Validation of HYDRUS-1D Model
A numerical model (HYDRUS-1D with major ion chemistry module [40,46]) was used to simulate the solute dynamics in the soil profile under different climatic conditions. The model was validated prior to its application. We comprehensively described the validation procedure of the HYDRUS model in Shaygan, Baumgartl, Arnold, and Reading [43]. Here, only a summary of the validation procedure was provided.
A series of laboratory column studies were conducted to validate the model parameters [43]. In summary, the saline-sodic soil was collected from the Quilpie site and was packed into 30 cm long columns (7 cm diameter) [43]. After the application of three wet-dry cycles to create consolidation after refilling, the experiments were carried out by establishing an initial water potential of −6 kPa at the soil surface [43]. The columns were exposed to the atmospheric conditions of a laboratory [43], and a designated rainfall of 10.9 mm depth and 10 min duration with an annual exceedance probability of 50% [47], based on the Quilpie weather data [43]. Following the rain event application, the soil water potentials were recorded using tensiometers (T5x; UMS, Munich, Germany) installed at three depths (3.5, 12, and 25 cm) [43]. Consequently, the observed water potentials from the laboratory study were compared statistically with the modeled water potentials using RMSE (root mean square error), d (index of agreement), and NSE (Nash-Sutcliffe Efficiency co-efficient) [43]. The statistical results (Table A3) indicated that the HYDRUS model can accurately replicate the water movement within the soil profile [43].
Soil water samplers (Rhizon Flex; Rhizosphere Research Products; Wageningen, The Netherlands) were also installed at three depths; 3.5cm, 12cm, and 25cm of the column, and pore water was collected during and after the application of the rain event [43]. The collected samples were analyzed for their chemistry, and statistical comparisons were performed using RMSE (root mean square error), MAE (mean absolute error), and RE (relative error) [43]. The statistical results (Table A4) indicated that the HYDRUS model can accurately reproduce the movement of the solutes within the soil profile [43]. From these experiments, we concluded that the HYDRUS is able to predict solute transport (salt leaching) within the soil profile [43]. As the model has been validated, it can be used as a tool to indicate salt movement both spatially and temporally under different climatic conditions (different rainfall and evaporation patterns).
2.4. Application of the Validated HYDRUS-1D Model
Following the model validation, the model was used to compare the effect of different rainfall and evaporation patterns of the studied sites on salt leaching in semi-arid regions of Queensland. Only one type of soil was used in this study, as soil factors need to be consistent in order to effectively monitor and evaluate variable climatic conditions. As mentioned previously, the studied soil was typical to Queensland, and can be found in the mine sites of the studied regions [33,37]. A homogenous soil profile was defined for the simulation to reflect the conditions of the mine sites where the soil is relatively homogenous up to a depth of one meter [48]. As the model was validated using soil column study observations, the model can be used to evaluate the effect of climatic scenarios on spatio-temporal salt movement in the soil profile.
A one-meter deep soil profile (bare soil) was defined for the simulation. The bulk density of the soil profiles was set to 1.57 g cm−3 with the input parameters that were summarized in Table 2. The van Genuchten–Mualem single-porosity model [49] was applicable for this soil. The atmospheric boundary condition with no surface run-off was set as the upper boundary condition, and free drainage was chosen as the lower boundary condition for the water flow model. The boundary conditions reflected the conditions of the sites.
In this study, it was hypothesized that the rainfall had a low amount of soluble salts based on the rainfall chemistry analysis (Ca2+: 0.024 mmol L−1; Na+: 0.043 mmol L−1; Mg2+: 0.0411 mmol L−1; K+: 0.048 mmol L−1; Alkalinity: 0.005; SO4−2: 0.00157 mmol L−1; Cl−: 0.006 mmol L−1). The zero gradient boundary condition was used in the solute transport model as a lower boundary condition, as the water flow is directed out of the modeled domain. The “concentration flux BC” was chosen for the upper boundary condition of solute transport model, because the concentrations of solutes were variable. The “Kred” function, which simulates chemistry-dependent hydraulic conductivity, was activated in the model. This function adjusted the soil hydraulic conductivity based on the chemistry of the soil solution. The “kinetics precipitation/dissolution” function, which defines a kinetic model for precipitation and dissolution of minerals, was also activated in the model. An initial soil water potential of −20 kPa was chosen for the surface soil as it reflected the drained condition after rainfall.
The rainfall and evaporation series (from 1990 to 2012) of the studied regions, which were collected from the Bureau of Meteorology [30], were used for the simulation (Figure A1 and Figure A2). The climatic scenario from the last 23 years was selected, as it represents all climatic extremes, including droughts and high rainfall events. After applying the climatic scenarios, the model simulated EC, SAR, and major cations (Na+, Ca2+, Mg2+, and K+) of soil pore water on a daily basis. A diagram indicating the used methods for this study to assess the effect of different climatic scenarios on the spatio-temporal salt movement was presented in Figure A3.
3. Results
3.1. Simulation of Solute Distribution within a Brine-Affected Soil under Different Climatic Scenarios
The spatio-temporal distribution of solutes to the depth of 30 cm, similar to the plant root zone in brine-affected soils located in semi-arid environments [35,50,51], is presented in Figure 2, Figure 3, Figure 4 and Figure 5, and rainfall and evaporation patterns are indicated in Figure A1 and Figure A2. The changes in salinity and solute concentrations at the depth of 5 cm of soil that is important for seed germination and plant establishment [51] are also presented in Table 3. The distribution of solutes (cations) were affected by climate variability. Generally, during rainfall events, deeper depths of the soil profile showed a higher concentration of Na+ (Figure 2). This was contrasted by the decrease of Na+ concentration during dry events, to a depth of 10 cm (Figure 2). In all studied regions, the Na+ concentration reduced significantly during the 23 years of the simulation (Figure 2). In Roma and Mount Isa, Na+ concentration increased from the initial value during the preliminary dry period (Figure 2 and Figure A1). Then, Na+ concentration of the surface soil (0–30 cm), influenced by individual intense (high) rainfall events, reduced to <40 mmol L−1 after 2315 and 5165 days in Roma and Mount Isa, respectively (Figure 2). Subsequently, the Na+ concentration remained well below the initial value, even during long-term dry periods (Figure 2 and Figure A1). In Quilpie, the Na+ concentration reduced and remained below the initial value; however, there were a large number of fluctuations over the time period (Figure 2). Across the studied sites, the Na+ concentration reduced sharply in Roma (Figure 2) and its relative reduction was greater (95.93%) compared to those of the other sites but was comparable to the reduction of Na+ (92.99%) in Mount Isa (Table 3).
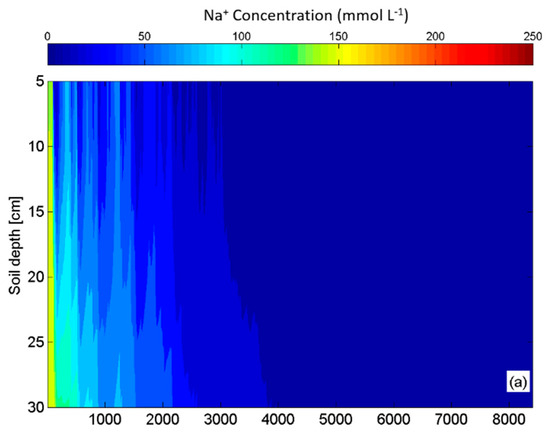
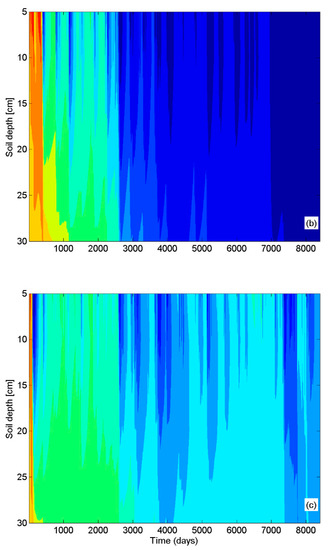
Figure 2.
The simulated Na+ concentration for (a) Roma, (b) Mount Isa, and (c) Quilpie when the soil has a bulk density of 1.57 g cm−3.
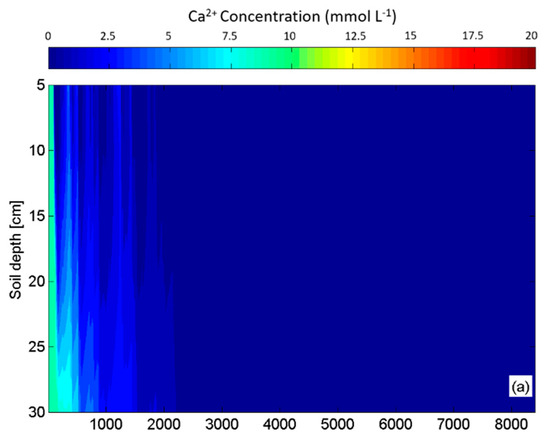
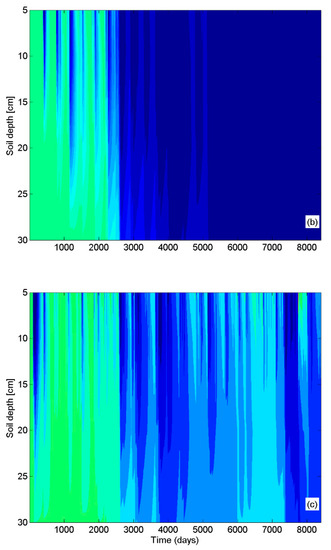
Figure 3.
The simulated Ca2+ concentration for (a) Roma, (b) Mount Isa, and (c) Quilpie when the soil has a bulk density of 1.57 g cm−3.
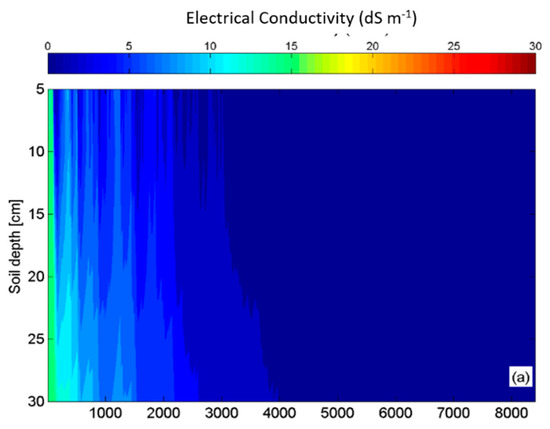
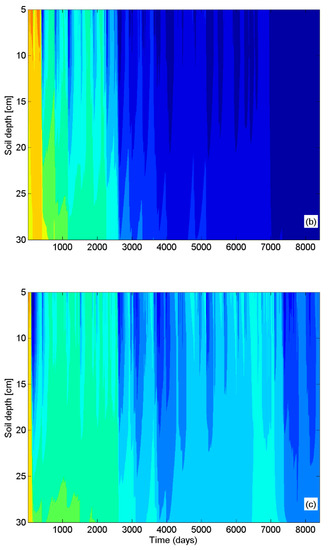
Figure 4.
The simulated electrical conductivity (EC) for (a) Roma, (b) Mount Isa, and (c) Quilpie when the soil has a bulk density of 1.57 g cm−3.
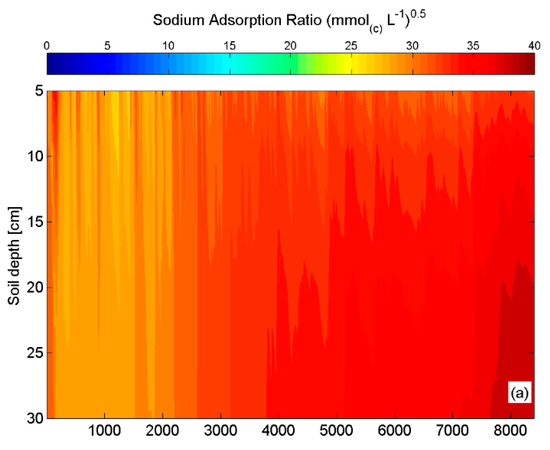
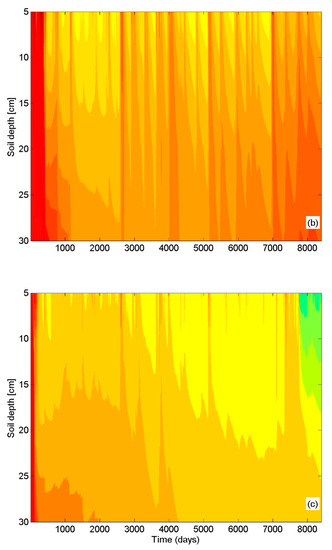
Figure 5.
The simulated sodium adsorption ratio (SAR) for (a) Roma, (b) Mount Isa, and (c) Quilpie when the soil has a bulk density of 1.57 g cm−3.
Table 3.
The relative reduction or increase in solute concentrations at the depth of 5 cm of the soil profile under different climatic conditions.
The distribution of Mg2+ and K+ concentrations followed a similar pattern to the distribution of Na+ concentrations within the soil profiles (Figure A4 and Figure A5). However, K+ concentration increased at the end of the simulation for the Quilpie site (Figure A5). Only individual intense rainfall events affected the distribution of Ca2+ concentrations within the soil profiles (Figure 3). The Ca2+ concentration returned to the initial value (10.5 mmol L−1) during preliminary dry periods (Figure 3 and Figure A1). Subsequently, individual intense rainfall events decreased Ca2+ concentrations to <0.018 mmol L−1 and <0.18 mmol L−1 in Roma and Mount Isa, respectively (Figure 3 and Figure A1). Likewise, the relative reduction of Ca2+ concentration was greater in Roma (99.85%) and Mount Isa (99.12%) (Table 3). Although the Ca2+ concentration decreased in Quilpie during the 23 years of simulation, it fluctuated and, in some instances, increased to higher concentrations than the initial value (Figure 3).
The electrical conductivity of the soil followed a similar pattern to the dynamics of Na+ (Figure 2), Ca2+ (Figure 3), Mg2+ (Figure A4), and K+ (Figure A5) content in the soil profiles, and it decreased significantly to <1 dS m−1 (during 23 years of simulation) within the surface soil in Roma and Mount Isa (Figure 4). In contrast, the salinity fluctuated and decreased to 8 dS m−1 within the surface soil profile in Quilpie (Figure 4). Sodium adsorption ratio values increased with increasing depth of the soil profile in all studied sites (Figure 5). While SAR values reduced in Quilpie and Mount Isa during the 23 years of simulation, these values increased in Roma (Figure 5).
3.2. Simulation of Solute Distribution within a Reclaimed Brine-Affected Soil
Until now, the model simulated the distribution of solutes within a soil profile with a soil bulk density of 1.57 g cm−3. The model was re-run using characteristics for soil with a bulk density of 1.2 g cm−3 (Table 2), which reflected the conditions of a reclaimed soil ripped/loosened to the depth of one meter. It was hypothesized that if the soil bulk density was reduced to 1.2 g cm−3, the concentrations of solutes may reduce to a level where the soil is capable of growing plants (i.e., soil salinity of <2 dS m−1). The model was re-run for the Quilpie region only, as the soil salinity remained high (8 dS m−1) after 23 years of simulation when the soil had a bulk density of 1.57 g cm−3 (Figure 2, Figure 3, Figure 4 and Figure 5).
When the soil bulk density was reduced to 1.2 g cm−3, the soil salinity and Na+ concentration reduced significantly (over 23 years) to 0.7 dS m−1 (Figure 6a) and 6.7 mmol L−1 (Figure 6b), respectively. The distribution of Ca2+ (Figure 6c), Mg2+ (Figure 7a), and K+ (Figure 7b) concentrations followed a similar pattern to the distribution of EC (Figure 6a) and Na+ concentrations (Figure 6b) in the soil profile, and decreased to 0.039 (Figure 6c), 0.046 (Figure 7a) and 0.1 (Figure 7b) mmol L−1, respectively during 23 years of simulation. Sodium adsorption ratio (SAR) values within the soil profile reduced slightly over the 23 years of simulation, but increased with increasing depths of the soil profile (Figure 7c). After a reduction in the soil bulk density, the salinity of the surface soil (at a depth of 5 cm) reduced by 96.14% (Table 4). Sodicity of the soil at the depth of 5 cm also decreased, but the rate of reduction was lower compared with the salinity (Table 4). The concentrations of cations at the depth of 5 cm decreased by >93% after reducing the bulk density (Table 4).
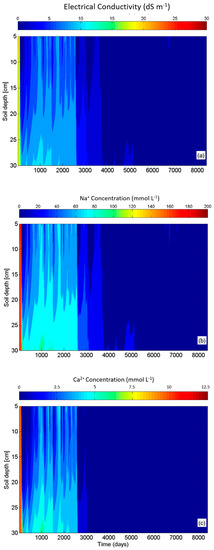
Figure 6.
The simulated (a) Electrical Conductivity (EC), (b) Na+ concentration, and (c) Ca2+ concentration for Quilpie when the soil has a bulk density of 1.2 g cm−3.
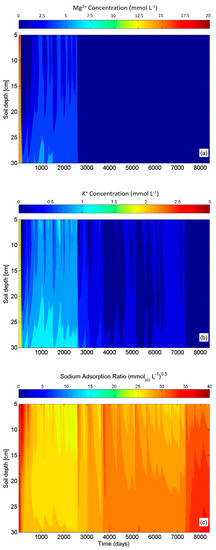
Figure 7.
The simulated (a) Mg2+ concentration, (b) K+ concentration, and (c) SAR for Quilpie when the soil has a bulk density of 1.2 g cm−3.
Table 4.
The relative reduction in solute concentrations at the depth of 5 cm of the reclaimed soil profile (bulk density of 1.2 g cm−3) under Quilpie climatic conditions.
4. Discussion
4.1. The Effect of Different Climatic Scenarios on The Success of Salt Leaching
The solute movement in a soil profile is driven by environmental factors associated with the water regime, such as rainfall and evaporation [15,17,52]. The solute concentrations were distributed to deeper depths of the soil profile during rain events, and, thus, leaching occurred. Conversely, the limited leaching in the soil created by evaporation, and capillary rise led to a cyclic increase in solute concentrations in the surface soil (Figure 2, Figure 3 and Figure 4). This was in agreement with the results of other studies [17,23] that evaluated salt evolution in the soils of Mediterranean regions. In this study, no significant difference was observed for the distribution and reduction of solutes in the soil profile exposed to Roma and Mount Isa climatic scenarios. Both frequent high rainfall events (i.e., Roma climatic conditions) and dispersed high rainfall events (i.e., Mount Isa climatic conditions) reduced the soil salinity to a level where the soil was capable of supporting plant growth (<2 dS m−1), while dispersed small rainfall events (i.e., Quilpie climatic conditions) decreased the soil salinity up to 8 dS m−1 (Figure 4). This suggests that the depth of each individual rainfall event plays a more significant role in salt leaching success compared with its distribution. In other words, individual high (intense/penetrating) rainfall events can leach the solutes to deeper depths of the soil profile, where returning solutes to the surface soil is not feasible. In contrast, small rainfall events (either frequent or infrequent), cannot provide successful leaching for high bulk density soil, and only provide a temporary desalinization zone for the surface soil (up to the depth of 10 cm). This study implies that rainfall characteristics are greater barriers than poor soil conditions for successful salt leaching and land reclamation, and locations with a similar amount of total rainfall but different rainfall characteristics, provide different soil desalinization zones, which may not always deliver successful salt leaching.
The high potential evaporation of Mount Isa and Quilpie affected the longevity of salt leaching, and led to the cyclic increase of solutes at the surface soil. However, the depth of individual rainfall events of the Mount Isa region then played a more important role, and leached the solutes from the surface soil (Figure 2, Figure 3, Figure 4 and Figure 5). This suggests that potential evaporation can only play a key factor in the success of salt leaching when there is a lack of occurrence of individual high rainfall events, as per the Quilpie site.
Successful salt leaching (Figure 5a,b) led to an increase in sodicity, possibly as a result of a greater concentration of Na+ compared with the total soluble cation and reduction of Ca2+ concentrations [11,13,53]. In contrast, limited leaching of solutes (in Quilpie) resulted in the reduction of sodicity within the surface soil during the simulation (Figure 5c). Therefore, in agreement with Rengasamy and Olsson [11], this study confirmed that leaching of a brine-affected soil can increase sodicity.
4.2. Applications for Designing a Reclamation Practice for Saline Post-Mining Landscapes
The typical reclamation approach for saline-sodic soils is an application of gypsum followed by irrigation for salt leaching [11,12,54]. However, most mining operations are located in remote areas with limited access to water/irrigation. Therefore, salt leaching relies on climatic conditions. In this context, the simulation indicated that the depth of an individual rainfall event is the key factor for salt leaching, where a high soil bulk density (e.g., 1.57 g cm−3) is a limiting factor for permeability and water flow. However, the distribution of rainfall events did not affect the success of salt leaching significantly (Table 3). For instance, individual intense rainfall events in Mount Isa and Roma could leach the solutes to greater depths of the soil profile. Consequently, the distribution of rainfall events (either frequent or dispersed) prevented the re-salinization occurrence (Figure 2, Figure 3 and Figure 4). This suggests the salt-affected soils in Roma and Mount Isa are capable of growing plants or regenerating under the natural climatic conditions over a long-term time period without the need for irrigation or soil amelioration.
Where climatic conditions cannot assist with successful salt leaching and irrigation is not feasible, soil amelioration is inevitable. This study indicated that a reduction in soil bulk density significantly improved salt leaching from surface soil in a semi-arid environment (i.e., Quilpie region), that receives dispersed rainfall events of low volume and lacks the occurrence of high rainfall events (Figure 6 and Figure 7). A reduction in the soil bulk density to the depth of one meter using soil ripping may create a secondary pore system that favors the downward movement of solutes and prevents upward solute transport. Soil ripping, which is a conventional method for the reduction of soil bulk density, can break the capillary rise and prevent solutes from returning to the soil surface [55]. In this study, a lower soil bulk density (1.2 g cm−3) created a greater total porosity (0.562 cm3 cm−3; Table 2), with a macro-pore volume (0.17 cm3 cm−3) and greater hydraulic conductivity (14.4 cm day−1; Table 2). Consequently, it decreased the soil salinity to a level (<2 dS m−1) that is capable of supporting plant growth. In agreement with other studies [56,57], which concluded that a reduction in bulk density can reduce soil salinity and sodicity, this study indicated that a reduction of soil bulk density can decrease soil salinity and sodicity of the surface soil (Figure 6 and Figure 7). A previous field experiment on the study site [51], the brine-affected soil located in Quilpie shire, has also confirmed the effect of the reduction of bulk density on increasing plant establishment, in which the diversity and density of native plant seedlings increased in the areas, which were ripped to a depth of 15 cm after one year, whereas areas which were not ripped had no vegetation (Table A5). A series of studies on the brine-affected soil in Quilpie region indicated that the addition of organic matter (i.e., wood chips) can be a strategy to increase the macro-pore volume, and total porosity, and hence improve salt leaching from the soil [13,43,51]. However, this current study found that the reduction of soil salinity was greater when the soil bulk density decreased compared with the addition of organic matter (wood chips). All the above suggests that saline land reclamation strategies must be designed based on climatic conditions as well as edaphic factors. Furthermore, the creation of a secondary pore system is able to compensate for the lack of high rainfall events for salt leaching.
5. Conclusions
The rainfall characteristics of a semi-arid region are significant factors for the success of mined land reclamation. This study suggests that, in semi-arid environments, sites receiving individual rainfall events with high volumes (either dispersed or frequent rain events), may not need soil amelioration for successful salt leaching and reclamation. Where salt leaching is restricted due to the lack of individual intense rainfall events and low annual rainfall (<400 mm), as per the Quilpie site, an amelioration strategy, such as a reduction in soil bulk density, is required to accelerate salt leaching by improving the pore system. A reduction in soil bulk density can decrease concentrations of solutes for the surface soil (5 cm) by up to 99%. A 96% reduction in soil salinity can also be observed after soil bulk density reduction. This study suggests that the reclamation strategy must be site-specific, and the climatic conditions, most notably the occurrence of individual high rainfall events, must be considered as one of the main parameters for designing a cost-effective land reclamation strategy.
Author Contributions
Conceptualization, T.B. and M.S.; methodology, T.B. and M.S.; software, M.S.; validation, M.S.; formal analysis, M.S.; investigation, M.S.; writing—original draft preparation, M.S.; writing—review and editing, M.S. and T.B. All authors have read and agreed to the published version of the manuscript.
Funding
This research received no external funding.
Acknowledgments
The authors would like to thank Centre for Mined Land Rehabilitation, The University of Queensland, for supporting this study.
Conflicts of Interest
The authors declare no conflict of interest.
Appendix A
Table A1.
Rainfall depth (mm) in relation to AEP (annual exceedance probability) for Roma, Mount Isa, and Quilpie [32].
Table A1.
Rainfall depth (mm) in relation to AEP (annual exceedance probability) for Roma, Mount Isa, and Quilpie [32].
| Annual Exceedance Probability (AEP) | |||||||||||||||||||||
|---|---|---|---|---|---|---|---|---|---|---|---|---|---|---|---|---|---|---|---|---|---|
| Roma | Mount Isa | Quilpie | |||||||||||||||||||
| Duration | 63.20% | 50% | 20% | 10% | 5% | 2% | 1% | 63.20% | 50% | 20% | 10% | 5% | 2% | 1% | 63.20% | 50% | 20% | 10% | 5% | 2% | 1% |
| 1 min | 2.23 | 2.53 | 3.5 | 4.18 | 4.86 | 5.79 | 6.51 | 1.98 | 2.3 | 3.28 | 3.93 | 4.55 | 5.36 | 5.97 | 1.6 | 1.89 | 2.89 | 3.65 | 4.47 | 5.66 | 6.67 |
| 2 min | 3.96 | 4.51 | 6.31 | 7.59 | 8.9 | 10.7 | 12.1 | 3.39 | 3.95 | 5.65 | 6.75 | 7.79 | 9.07 | 10 | 2.64 | 3.11 | 4.79 | 6.1 | 7.53 | 9.75 | 11.7 |
| 3 min | 5.49 | 6.25 | 8.71 | 10.5 | 12.2 | 14.7 | 16.6 | 4.77 | 5.56 | 7.94 | 9.5 | 11 | 12.8 | 14.2 | 3.73 | 4.4 | 6.74 | 8.57 | 10.5 | 13.6 | 16.2 |
| 4 min | 6.84 | 7.78 | 10.8 | 13 | 15.1 | 18.1 | 20.4 | 6.08 | 7.07 | 10.1 | 12.1 | 14 | 16.3 | 18.1 | 4.75 | 5.6 | 8.57 | 10.9 | 13.3 | 17.1 | 20.3 |
| 5 min | 8.05 | 9.15 | 12.7 | 15.2 | 17.7 | 21.1 | 23.7 | 7.29 | 8.47 | 12.1 | 14.5 | 16.7 | 19.6 | 21.8 | 5.68 | 6.7 | 10.2 | 12.9 | 15.9 | 20.2 | 23.9 |
| 10 min | 12.6 | 14.4 | 19.8 | 23.6 | 27.4 | 32.5 | 36.5 | 12.2 | 14.1 | 20.1 | 24.1 | 28 | 33 | 36.8 | 9.21 | 10.9 | 16.6 | 20.9 | 25.5 | 32.2 | 37.8 |
| 15 min | 15.8 | 18 | 24.8 | 29.5 | 34.3 | 40.7 | 45.8 | 15.7 | 18.2 | 26 | 31.2 | 36.2 | 42.7 | 47.6 | 11.5 | 13.6 | 20.8 | 26.3 | 32.1 | 40.4 | 47.5 |
| 30 min | 21.8 | 24.7 | 34.2 | 40.9 | 47.6 | 56.8 | 64.1 | 22.4 | 26 | 37.1 | 44.4 | 51.5 | 60.7 | 67.6 | 15.6 | 18.4 | 28.2 | 35.6 | 43.6 | 55.4 | 65.3 |
| 1 h | 27.9 | 31.7 | 44.1 | 53 | 62 | 74.4 | 84.3 | 28.9 | 33.6 | 48 | 57.5 | 66.6 | 78.4 | 87.1 | 19.6 | 23.1 | 35.3 | 44.7 | 55 | 70.3 | 83.4 |
| 2 h | 34 | 38.6 | 53.8 | 64.8 | 76.2 | 91.9 | 105 | 34.9 | 40.5 | 57.8 | 69.3 | 80.3 | 94.6 | 105 | 23.9 | 28.1 | 42.6 | 54 | 66.3 | 85 | 101 |
| 3 h | 37.6 | 42.6 | 59.4 | 71.6 | 84.2 | 102 | 116 | 38.2 | 44.3 | 63.1 | 75.7 | 88 | 104 | 116 | 27 | 31.5 | 47.5 | 60 | 73.6 | 94 | 112 |
| 6 h | 44 | 49.9 | 69.2 | 83.3 | 97.7 | 118 | 135 | 44.2 | 51 | 72.6 | 87.4 | 102 | 122 | 137 | 33.4 | 38.8 | 57.6 | 72.2 | 88 | 111 | 131 |
| 12 h | 51.6 | 58.3 | 80.4 | 96.2 | 112 | 135 | 153 | 51.5 | 59.4 | 84.8 | 102 | 120 | 145 | 164 | 41.7 | 48.3 | 70.9 | 88.1 | 107 | 132 | 154 |
| 24 h | 60.7 | 68.7 | 94.2 | 112 | 130 | 155 | 174 | 61.3 | 71 | 102 | 124 | 146 | 178 | 203 | 51.1 | 59.3 | 87.1 | 108 | 129 | 159 | 182 |
| 48 h | 71.9 | 81.6 | 112 | 132 | 152 | 179 | 200 | 73.8 | 86.3 | 126 | 153 | 180 | 221 | 254 | 59.5 | 69.7 | 104 | 129 | 154 | 188 | 215 |
| 72 h | 79.1 | 90.1 | 123 | 145 | 166 | 195 | 217 | 81.6 | 96 | 141 | 172 | 203 | 249 | 286 | 63 | 74.3 | 112 | 140 | 168 | 205 | 234 |
| 96 h | 84.3 | 96.3 | 132 | 155 | 176 | 206 | 228 | 86.7 | 102 | 151 | 185 | 218 | 268 | 307 | 64.7 | 76.8 | 117 | 146 | 176 | 215 | 246 |
| 120 h | 88.3 | 101 | 138 | 162 | 183 | 213 | 236 | 89.9 | 106 | 157 | 193 | 227 | 279 | 321 | 65.8 | 78.2 | 119 | 150 | 181 | 221 | 252 |
| 144 h | 91.4 | 105 | 143 | 167 | 188 | 218 | 240 | 91.7 | 108 | 161 | 197 | 232 | 286 | 329 | 66.6 | 79.1 | 121 | 152 | 185 | 225 | 256 |
| 168 h | 93.8 | 107 | 147 | 170 | 191 | 221 | 243 | 92.5 | 109 | 162 | 198 | 234 | 289 | 333 | 67.3 | 79.9 | 122 | 154 | 187 | 227 | 257 |
Annual Exceedance Probability (AEP): the probability or likelihood of an event occurring.
Table A2.
Rainfall intensity (mm h−1) in relation to AEP (annual exceedance probability) for Roma, Mount Isa, and Quilpie [32].
Table A2.
Rainfall intensity (mm h−1) in relation to AEP (annual exceedance probability) for Roma, Mount Isa, and Quilpie [32].
| Annual Exceedance Probability (AEP) | |||||||||||||||||||||
|---|---|---|---|---|---|---|---|---|---|---|---|---|---|---|---|---|---|---|---|---|---|
| Roma | Mount Isa | Quilpie | |||||||||||||||||||
| Duration | 63.20% | 50% | 20% | 10% | 5% | 2% | 1% | 63.20% | 50% | 20% | 10% | 5% | 2% | 1% | 63.20% | 50% | 20% | 10% | 5% | 2% | 1% |
| 1 min | 134 | 152 | 210 | 251 | 292 | 347 | 391 | 119 | 138 | 197 | 236 | 273 | 322 | 358 | 96.3 | 114 | 174 | 219 | 268 | 340 | 400 |
| 2 min | 119 | 135 | 189 | 228 | 267 | 321 | 364 | 102 | 118 | 169 | 203 | 234 | 272 | 300 | 79.1 | 93.4 | 144 | 183 | 226 | 292 | 351 |
| 3 min | 110 | 125 | 174 | 209 | 245 | 293 | 332 | 95.5 | 111 | 159 | 190 | 219 | 256 | 283 | 74.5 | 87.9 | 135 | 171 | 211 | 272 | 325 |
| 4 min | 103 | 117 | 162 | 194 | 227 | 271 | 306 | 91.2 | 106 | 151 | 181 | 209 | 245 | 272 | 71.2 | 84 | 129 | 163 | 200 | 256 | 304 |
| 5 min | 96.6 | 110 | 152 | 182 | 212 | 253 | 285 | 87.5 | 102 | 145 | 174 | 201 | 236 | 262 | 68.2 | 80.4 | 123 | 155 | 190 | 242 | 287 |
| 10 min | 75.9 | 86.1 | 119 | 142 | 164 | 195 | 219 | 73.1 | 84.8 | 121 | 145 | 168 | 198 | 221 | 55.3 | 65.2 | 99.5 | 125 | 153 | 193 | 227 |
| 15 min | 63.3 | 71.8 | 99.2 | 118 | 137 | 163 | 183 | 62.9 | 73 | 104 | 125 | 145 | 171 | 190 | 46.2 | 54.5 | 83.3 | 105 | 128 | 162 | 190 |
| 30 min | 43.5 | 49.4 | 68.5 | 81.8 | 95.3 | 114 | 128 | 44.7 | 51.9 | 74.2 | 88.9 | 103 | 121 | 135 | 31.1 | 36.8 | 56.4 | 71.3 | 87.3 | 111 | 131 |
| 1 h | 27.9 | 31.7 | 44.1 | 53 | 62 | 74.4 | 84.3 | 28.9 | 33.6 | 48 | 57.5 | 66.6 | 78.4 | 87.1 | 19.6 | 23.1 | 35.3 | 44.7 | 55 | 70.3 | 83.4 |
| 2 h | 17 | 19.3 | 26.9 | 32.4 | 38.1 | 46 | 52.4 | 17.5 | 20.3 | 28.9 | 34.6 | 40.2 | 47.3 | 52.7 | 12 | 14 | 21.3 | 27 | 33.2 | 42.5 | 50.6 |
| 3 h | 12.5 | 14.2 | 19.8 | 23.9 | 28.1 | 33.9 | 38.7 | 12.7 | 14.8 | 21 | 25.2 | 29.3 | 34.7 | 38.7 | 8.99 | 10.5 | 15.8 | 20 | 24.5 | 31.3 | 37.2 |
| 6 h | 7.34 | 8.31 | 11.5 | 13.9 | 16.3 | 19.7 | 22.4 | 7.37 | 8.51 | 12.1 | 14.6 | 17 | 20.3 | 22.8 | 5.57 | 6.47 | 9.61 | 12 | 14.7 | 18.5 | 21.8 |
| 12 h | 4.3 | 4.86 | 6.7 | 8.01 | 9.36 | 11.3 | 12.8 | 4.29 | 4.95 | 7.06 | 8.54 | 10 | 12.1 | 13.7 | 3.48 | 4.02 | 5.91 | 7.34 | 8.88 | 11 | 12.8 |
| 24 h | 2.53 | 2.86 | 3.93 | 4.67 | 5.41 | 6.45 | 7.27 | 2.55 | 2.96 | 4.26 | 5.16 | 6.07 | 7.4 | 8.46 | 2.13 | 2.47 | 3.63 | 4.49 | 5.39 | 6.61 | 7.6 |
| 48 h | 1.5 | 1.7 | 2.33 | 2.75 | 3.16 | 3.73 | 4.17 | 1.54 | 1.8 | 2.62 | 3.19 | 3.76 | 4.61 | 5.29 | 1.24 | 1.45 | 2.16 | 2.68 | 3.22 | 3.92 | 4.48 |
| 72 h | 1.1 | 1.25 | 1.71 | 2.02 | 2.3 | 2.71 | 3.01 | 1.13 | 1.33 | 1.96 | 2.39 | 2.82 | 3.46 | 3.97 | 0.875 | 1.03 | 1.56 | 1.94 | 2.33 | 2.85 | 3.25 |
| 96 h | 0.879 | 1 | 1.37 | 1.61 | 1.83 | 2.14 | 2.37 | 0.903 | 1.07 | 1.58 | 1.93 | 2.27 | 2.79 | 3.2 | 0.674 | 0.8 | 1.22 | 1.52 | 1.83 | 2.24 | 2.56 |
| 120 h | 0.736 | 0.841 | 1.15 | 1.35 | 1.53 | 1.78 | 1.96 | 0.749 | 0.884 | 1.31 | 1.6 | 1.89 | 2.33 | 2.67 | 0.548 | 0.651 | 0.996 | 1.25 | 1.51 | 1.84 | 2.1 |
| 144 h | 0.635 | 0.726 | 0.993 | 1.16 | 1.31 | 1.52 | 1.67 | 0.637 | 0.752 | 1.12 | 1.37 | 1.61 | 1.99 | 2.29 | 0.462 | 0.549 | 0.842 | 1.06 | 1.28 | 1.56 | 1.78 |
| 168 h | 0.558 | 0.639 | 0.872 | 1.01 | 1.14 | 1.32 | 1.45 | 0.551 | 0.649 | 0.962 | 1.18 | 1.39 | 1.72 | 1.98 | 0.401 | 0.475 | 0.728 | 0.915 | 1.11 | 1.35 | 1.53 |
Annual Exceedance Probability (AEP): the probability or likelihood of an event occurring.

Figure A1.
Rainfall pattern for (a) Roma, (b) Mount Isa, and (c) Quilpie.
Table A3.
The results of statistical analyses for the validation of HYDRUS-1D in terms of predicting water movement within a soil profile [43].
Table A3.
The results of statistical analyses for the validation of HYDRUS-1D in terms of predicting water movement within a soil profile [43].
| Soil Depth | Statistical Analyses (n = 9170) | Rain Event (10.9 mm) |
|---|---|---|
| 3.5 cm | NSE | 0.94 |
| d | 0.98 | |
| RMSE (kPa) | 0.35 | |
| 12 cm | NSE | 0.96 |
| d | 0.99 | |
| RMSE (kPa) | 0.21 | |
| 25 cm | NSE | 0.95 |
| d | 0.98 | |
| RMSE (kPa) | 0.17 |
n: number of observation; NSE: Nash–Sutcliffe Efficiency co-efficient; d: index of agreement; RMSE: root mean square error.
Table A4.
The results of statistical analyses for the validation of HYDRUS-1D in terms of predicting solute movement within a soil profile [43].
Table A4.
The results of statistical analyses for the validation of HYDRUS-1D in terms of predicting solute movement within a soil profile [43].
| Statistical Analyses (n = 3) | EC (dS m−1) | SAR (mmol(c) L−1)0.5 | Major Cations (mmol L−1) | |||
|---|---|---|---|---|---|---|
| Ca2+ | Mg2+ | Na+ | K+ | |||
| RMSE | 0.76 | 2.00 | 9.9 | 0.37 | 7.91 | 0.07 |
| MAE | 0.60 | 1.41 | 0.74 | 0.37 | 6.17 | 0.07 |
| RE | 4.28 | 6.48 | 8.80 | 2.69 | 5.06 | 5.12 |
n: number of observation; RMSE: root mean square error; MAE: mean absolute error; RE: relative error.

Figure A2.
Evaporation series for (a) Roma, (b) Mount Isa, and (c) Quilpie.

Figure A3.
A diagram indicating the used methods for assessing the effect of climatic variability on salt movement.

Figure A4.
The simulated Mg2+ concentration for (a) Roma, (b) Mount Isa, and (c) Quilpie when the soil has a bulk density of 1.57 g cm−3.

Figure A5.
The simulated K+ concentration for (a) Roma, (b) Mount Isa, and (c) Quilpie when the soil has a bulk density of 1.57 g cm−3.
Table A5.
The average seedling number for native plant species in 2012 (six weeks after soil ripping to a depth of 15 cm) and 2013 (one year after soil ripping to a depth of 15 cm) [51].
Table A5.
The average seedling number for native plant species in 2012 (six weeks after soil ripping to a depth of 15 cm) and 2013 (one year after soil ripping to a depth of 15 cm) [51].
| Plant Species | Year | |
|---|---|---|
| 2012 | 2013 | |
| Seedling Number (number/m2) | ||
| Atriplex spp. | 0.7 ± 0.13 | 17.74 ± 1.06 *** |
| Frankenia serpyllifolia | 0.00 ± 0.00 | 1.06 ± 0.002 |
| Osteocarpum acroptrerum | 0.00 ± 0.00 | 7.32 ± 0.94 |
| Sclerolaena longicuspis | 0.29 ± 0.08 | 5.57 ± 0.39 *** |
| Tecticornia pergranulata | 0.00 ± 0.00 | 1.32 ± 0.31 |
Mean value ± standard deviation, *** significant at p < 0.001.
References
- Bot, A.J.; Nachtergaele, F.O.; Young, A. Land Resource Potential and Constratnts at Regional and Country Levels; Food & Agriculture Organization: Rome, Italy, 2000; p. 114. [Google Scholar]
- Amini, S.; Ghadiri, H.; Chen, C.; Marschner, P. Salt-affected soils, reclamation, carbon dynamics, and biochar: A review. J. Soils Sediments 2016, 16, 939–953. [Google Scholar] [CrossRef]
- Forkutsa, I.; Sommer, R.; Shirokova, Y.I.; Lamers, J.P.A.; Kienzler, K.; Tischbein, B.; Martius, C.; Vlek, P.L.G. Modeling irrigated cotton with shallow groundwater in the Aral Sea Basin of Uzbekistan: II. Soil salinity dynamics. Irrig. Sci. 2009, 27, 319–330. [Google Scholar] [CrossRef]
- Halwatura, D.; Lechner, A.M.; Arnold, S. Drought severity-duration-frequency curves: A foundation for risk assessment and planning tol for ecosystem establishment in post-mining landscapes. Hydrol. Earth Syst. Sci. 2015, 19, 1069–1091. [Google Scholar] [CrossRef]
- Commonwealth of Australia. Mine Closure and Completion. Leading Practice Sustainable Development Program for Mining Industry; Department of Industry Tourism and Resources: Canberra, Australia, 2006.
- Debez, A.; Huchzermeyer, B.; Abdelly, C.; Koyro, H.W. Current challenges and future opportunities for a sustainable utilization of halophytes. In Sabkha Ecosystems; Öztürk, M., Böer, B., Barth, H.J., Clüsener-Godt, M., Khan, M.A., Breckle, S.W., Eds.; Springer: Berlin, Germany, 2011; Volume 46, pp. 59–77. [Google Scholar]
- Shaygan, M.; Baumgartl, T.; Arnold, S. Germination of Atriplex halimus seeds under salinity and water stress. Ecol. Eng. 2017, 102, 636–640. [Google Scholar] [CrossRef]
- Qadir, M.; Ghafoor, A.; Murtaza, G. Amelioration strategies for saline soils: A review. Land Degrad. Dev. 2000, 11, 501–521. [Google Scholar] [CrossRef]
- Qadir, M.; Qureshi, R.H.; Ahmad, N. Horizonal flushing: A promising ameliorative technology for hard saline-sodic and sodic soils. Soil Tillage Res. 1998, 45, 119–131. [Google Scholar] [CrossRef]
- Qadir, M.; Steffens, D.; Yan, F.; Schubert, S. Sodium removal from a calcareous saline–sodic soil through leaching and plant uptake during phytoremediation. Land Degrad. Dev. 2003, 14, 301–307. [Google Scholar] [CrossRef]
- Rengasamy, P.; Olsson, K.A. Sodicity and soil structure. Soil Res. 1991, 29, 935–952. [Google Scholar] [CrossRef]
- Sumner, M. Sodic soils-New perspectives. Soil Res. 1993, 31, 683–750. [Google Scholar] [CrossRef]
- Shaygan, M.; Reading, L.P.; Baumgartl, T. Effect of physical amendments on salt leaching characteristics for reclamation. Geoderma 2017, 292, 96–110. [Google Scholar] [CrossRef]
- Tanji, K.K. Salinity in the soil environment. In Salinity: Environment-Plants-Molecules; Lauchli, A., Luttge, U., Eds.; Kluwer Academic Publishers: London, UK; Boston, MA, USA; Dordrecht, The Netherlands, 2002. [Google Scholar]
- Baumgartl, T.; Richards, B. Evaporation and salt transport under variable conditions. In Proceedings of the Life of Mine Conference, Maximising Rehabilitation Outcomes, Brisbane, Australia, 10–12 July 2012; pp. 179–186. [Google Scholar]
- Ahuja, L. Modeling soluble chemical transfer to runoff with rainfall impact as a diffusion process. Soil Sci. Soc. Am. J. 1990, 54, 312–321. [Google Scholar] [CrossRef]
- Pariente, S. Soluble salts dynamics in the soil under different climatic conditions. Catena 2001, 43, 307–321. [Google Scholar] [CrossRef]
- Reynolds, W.D.; Drury, C.F.; Parkin, G.W.; Lauzon, J.D.; Saso, J.K.; Zhang, T.; Liu, K.; Welacky, T.W.; Yang, X.; Tan, C.S.; et al. Solute dynamics and the Ontario nitrogen index: I. Chloride leaching. Can. J. Soil Sci. 2016, 96, 105–121. [Google Scholar] [CrossRef]
- Rengasamy, P. World salinization with emphasis on Australia. J. Exp. Bot. 2006, 57, 1017–1023. [Google Scholar] [CrossRef]
- Szabolcs, I. Salt-Affected Soils; CRC Press: Boca Raton, FL, USA, 1989. [Google Scholar]
- De Vries, J. Solute Transport and Water Flow in an Unsaturated, Heterogeneous Profile with Root Water Uptake; Wageningen University: Wageningen, The Netherlands, 2016. [Google Scholar]
- Lavee, H.; Imeson, A.; Pariente, S.; Benyamini, Y. The response of soils to simulated rainfall along a climatological gradient in an arid and semi-arid region. Catena 1991, 19, 19–37. [Google Scholar]
- Zwikel, S.; Lavee, H.; Sarah, P. Temporal evolution of salts in Mediterranean soils transect under different climatic conditions. Catena 2007, 70, 282–295. [Google Scholar] [CrossRef]
- He, B.; Cai, Y.; Ran, W.; Jiang, H. Spatial and seasonal variations of soil salinity following vegetation restoration in coastal saline land in eastern China. Catena 2014, 118, 147–153. [Google Scholar] [CrossRef]
- Macdonald, B.; Melville, M.D.; White, I. The distribution of soluble cations within chenopod-patterned ground, arid western New South Wales, Australia. Catena 1999, 37, 89–105. [Google Scholar] [CrossRef]
- Mahmoodabadi, M.; Yazdanpanah, N.; Sinobas, L.R.; Pazira, E.; Neshat, A. Reclamation of calcareous saline sodic soil with different amendments (I): Redistribution of soluble cations within the soil profile. Agric. Water Manag. 2013, 120, 30–38. [Google Scholar] [CrossRef]
- Rahman, H.A.A.; Dahab, M.H.; Mustafa, M.A. Impact of soil amendments on intermittent evaporation, moisture distribution and salt residtribution in saline-sodic clay soil columns. Soil Sci. 1996, 161, 793–802. [Google Scholar] [CrossRef]
- Tejada, M.; Garcia, C.; Gonzalez, J.L.; Hernandez, M.T. Use of organic amendment as a strategy for saline soil remediation: Influence on the physical, chemical and biological properties. Soil Biol. Biochem. 2006, 38, 1413–1421. [Google Scholar] [CrossRef]
- Zeng, W.; Xu, C.; Wu, J.; Huang, J. Soil salt leaching under different irrigation regimes: HYDRUS-1D modelling and analysis. J. Arid Land 2014, 6, 44–58. [Google Scholar] [CrossRef]
- Bureau of Meteorology. Climate Data Online. Available online: http://reg.bom.gov.au/climate (accessed on 6 January 2013).
- Green, J.; Xuereb, K.; Johnson, F.; Moore, G.; The, C. The revised Intensity-Frequency-Duration (IFD) design rainfall estimates for Australia–An overview. In Proceedings of the 34th Hydrology and Water Resources Symposium, Sydney, Australia, 19–22 November 2012; pp. 1–8. [Google Scholar]
- Bureau of Meteorology. Rainfall IFD Data System. Available online: http://www.bom.gov.au/water/designRainfalls/revised-ifd/?coordinate_type=dd&latitude=26.55&longitude=148.77&sdmin=true&sdhr=true&sdday=true&user_label=Roma+&year=2016 (accessed on 31 October 2018).
- Queensland Department of Environment and Resource Managment. Salinity Management Handbook, 2nd ed.; Department of Environment and Resource Management: Queensland Brisbane, Australia, 2011.
- Queensland Government. Common Soil Types in Queensland. Available online: https://www.qld.gov.au/environment/land/management/soil/soil-testing/types (accessed on 16 December 2019).
- Shaygan, M.; Mulligan, D.; Baumgartl, T. The potential of three halophytes (Tecticornia pergranulata, Sclerolaena longicuspis and Frankenia serpyllifolia) for the rehabilitation of brine-affected soils. Land Degrad. Dev. 2018, 29, 2002–2014. [Google Scholar] [CrossRef]
- Klute, A.; Dirksen, C. Hydraulic conductivity and diffusivity: Laboratory methods. In Methods of Soil Analysis-Physical and Mineralogical Methods; Klute, A., Ed.; American Society of Agronomy: Madison, WI, USA, 1982; Volume 2, pp. 687–734. [Google Scholar]
- Shaygan, M. Evaluating the Leaching of Salt Affected Soils for the Purpose of Reclamation and Revegetation; The University of Queensland, Sustainable Minerals Institute: Brisbane, Australia, 2016. [Google Scholar]
- van Genuchten, M.T.; Leij, F.J.; Yates, S.R. The RETC Code for Quantifying the Hydraulic Functions of Unsaturated Soils, Version 1.0; EPA report 600/2-91/065; US Salinity Laboratory, USDA-ARS: Riverside, CA, USA, 1991.
- Rayment, G.E.; Lyons, D.J. Soil Chemical Methods: Australasia; CSIRO: Collingwood, Victoria, Australia, 2011; Volume 3.
- Šimůnek, J.; Šejna, M.; Saito, H.; Sakai, M.; van Genuchten, M.T. The Hydrus-1D Software Package for Simulating the Movement of Water, Heat, and Multiple Solutes in Variably Saturated Media; Version 4.16; Department of Environmental Sciences, University of California: Riverside, CA, USA, 2013; p. 340. [Google Scholar]
- Suarez, D.L.; Šimůnek, J. UNSATCHEM: Unsaturated water and solute transport model with equilibrium and kinetic chemistry. Soil Sci. Soc. Am. J. 1997, 61, 1633–1646. [Google Scholar] [CrossRef]
- Fell, C.J.D.; Hutchison, H.P. Diffusion coefficients for sodium and potassium chlorides in water at elevated temperatures. J. Chem. Eng. Data 1971, 16, 427–429. [Google Scholar] [CrossRef]
- Shaygan, M.; Baumgartl, T.; Arnold, S.; Reading, L.P. The effect of soil physical amendments on reclamation of a saline-sodic soil: Simulation of salt leaching using HYDRUS-1D. Soil Res. 2018, 56, 829–845. [Google Scholar] [CrossRef]
- White, G.; Zelazny, L.; Sparks, D. Charge properties of soil colloids. In Soil Physical Chemistry; Sparks, D., Ed.; CRC Press: Boca Raton, FL, USA, 1986; pp. 39–81. [Google Scholar]
- Marshall, T.J.; Holmes, J.W.; Rose, C.W. Soil Physics; Cambridge University Press: New York, NY, USA, 1996. [Google Scholar]
- Simunek, J.; Van Genuchten, M.T.; Sejna, M. Recent developments and applications of HYDRUS computer software packages. Vadose Zone J. 2016, 6, 1–25. [Google Scholar] [CrossRef]
- Bureau of Meteorology. Rainfall IFD Data System. Available online: http://www.bom.gov.au/water/designRainfalls/revised-ifd/?coordinate_type=dms&latdeg=26&latmin=36&latsec=31&londeg=144&lonmin=15&lonsec=26&sdmin=true&sdhr=true&sdday=true&user_label=Quilpie+Airport (accessed on 12 May 2014).
- Fletcher, A. Assessment of OFB Impacts and Rehabilitation Options; Centre for Mined Land Rehabilitation, University of Queensland Brisbane: Brisbane, Australia, 2011; pp. 1–39. [Google Scholar]
- Van Genuchten, M.T. A Closed-form equation for predicting the hydraulic conductivity of unsaturated soils. Soil Sci. Soc. Am. J. 1980, 44, 892–898. [Google Scholar] [CrossRef]
- Keiffer, C.H.; Ungar, I.A. Germination and establishment of halophytes on brine-affected soils. J. Appl. Ecol. 2002, 39, 402–415. [Google Scholar] [CrossRef]
- Shaygan, M.; Reading, L.P.; Arnold, S.; Baumgartl, T. Modeling the effect of soil physical amendments on reclamation and revegetation success of a saline-sodic soil in a semi-arid environment. Arid Land Res. Manag. 2018, 32, 379–406. [Google Scholar] [CrossRef]
- Shimojimaa, E.; Yoshioka, R.; Tamagawa, I. Salinization owing to evaporation from bare-soil surfaces and its influences on the evaporation. J. Hydrol. 1996, 178, 109–136. [Google Scholar] [CrossRef]
- Belden, S.E.; Schuman, G.E.; Depuit, E.J. Salinity and miosture responses in wood residue amended bentonite mine spoil1. Soil Sci. 1990, 150, 874–882. [Google Scholar] [CrossRef]
- Qadir, M.; Qureshi, R.H.; Ahmad, N. Amelioration of calcareous saline-sodic soils through phytoremediation and chemical strategies. Soil Use Manag. 2002, 18, 381–385. [Google Scholar] [CrossRef]
- Ellington, A. Effects of deep ripping on cropping soils and crop production. In Proceedings of the 4th Australian Agronomy Conference, Melbourne, Australia, 24–27 August 1987; pp. 118–139. [Google Scholar]
- Rhoades, J.; Corwin, D. Soil electrical conductivity: Effects of soil properties and application to soil salinity appraisal. Commun. Soil Sci. Plant Anal. 1990, 21, 837–860. [Google Scholar] [CrossRef]
- Barzegar, A.R.; Yousefi, A.; Daryashenas, A. The effect of addition of different amounts and types of organic materials on soil physical properties and yield of wheat. Plant Soil 2002, 247, 295–301. [Google Scholar] [CrossRef]
© 2020 by the authors. Licensee MDPI, Basel, Switzerland. This article is an open access article distributed under the terms and conditions of the Creative Commons Attribution (CC BY) license (http://creativecommons.org/licenses/by/4.0/).