Abstract
The information technology (IT) industry has come to the forefront for economic development of several cities in developing countries such as India and China. Looking at the success of the IT industry in these countries, an argument has emerged that development of such industry in South African cities can revitalize their economy. Therefore, the study examined the potential of development of the IT industry in a South African city by using the case study of a largely service-oriented city—Bloemfontein. A survey research method and system dynamics modeling approach were used. Findings suggest that the city has the potential to emerge as an IT industrial city, however, there exist challenges with regards to infrastructure such as housing, built up space, energy, and attracting the knowledge workers to the city. Appropriate policy interventions to reinforce these infrastructures, which can assist to attract the knowledge workers, will enable enhancement in the earning from the IT industry. Also, the development of the IT industry will strengthen the housing and built up infrastructure for the IT industry as well as enhance the number of knowledge workers in the city.
1. Introduction
Information technology (IT) is increasingly influencing every aspect of the human life and functions of cities across the world. Particularly, it is progressively influencing the socio-economic and spatial development of cities [1,2,3,4,5,6,7] For example, in the last two decades, several cities from the developing world such as India and China have acquired large scale IT industry-based economic activities. In the process, they have become predominantly IT industrial economy-oriented cities, while continuing with their traditional manufacturing industrial or service-oriented economy. Consequently, it has contributed significantly to the economy of those cities [1,4,5].
Development of the IT industry in a city has diverge implications. According to scholars, the IT industry can bring economic opportunities, in terms of employment opportunities, earnings from both domestic market and exports, domestic and foreign investment [1,8,9,10,11,12]. Further, location of the IT industry in a city impacts the land use patterns, city skylines, travel behavior of people, social interactions, and environment [2,13,14,15]. It also causes the expansion of urban areas, decentralization of location of functions, and the amalgamation of adjoining rural areas to cities, which influence the growth and change in urban systems [6,14,15,16]. It creates unique spatial and economic images [8,9,10,11]. Concurrently, it can engender influx of people, increase the demand of houses, road, and other civic infrastructure leading to the rise in land and real estate property values [6,14,15].
Location, investment-friendly policy, international embeddedness, image of the cities, etc., are the important drivers which attract IT industries to a city. Also, adequate urban infrastructures, such as transportation, built up space, energy, housing, recreation facilities, etc., which can attract investment and knowledge workers support setting up and sustenance of the IT industry [1,5,17,18]. Apparently, the performance of the IT industry suffers in cities with inadequate urban infrastructural facilities. For example, poor energy scenarios and congestion due to the lack of an appropriate transportation system cause loss of effective labor hours, and in turn, productivity. Similarly, lack of housing and entertainment facilities cause dissatisfaction and delusion among personnel of the IT industry sector [17,19].
Literature and experience both have evidenced that location of the IT industry in the cities has both positive and negative impacts. It has its own demands and requirements. However, it is also argued that such industry can transform or revitalize the cities through its contribution to the economy, infrastructure, and image building. Consequently, many countries, including China and India, have framed policies and strategies both at the national and city level to develop sustainable IT industrial cities and make them nationally and globally important. The policies generally focus on attracting foreign investment, corporate tax incentives, creation of single window system, and scrapping of licensing systems, land and building asset provisions, and creation of adequate infrastructural facilities and social amenities, which would facilitate growth of the IT industry in cities and reinforce economic growth [20,21,22,23]. Consequently, growth of the IT industry leading to emergence of new IT cities and strengthening of existing IT cities has been experienced.
In the context of South African cities, the potential and opportunities for development of the IT industry have not been explored. Further, with the South African economy in transition and the decline of mining and manufacturing industries, an argument has emerged to explore new ways to revitalize the medium and large cities of the country [24,25]. This argument has become more important for cities which do not have much of the natural, mining resources, and industrial activities for their economic vitality. Therefore, by using the case study of the city of Bloemfontein, the study examined the perspectives of the development of the IT industry in a South African city. In other words, it examined whether the city has the potential to develop as an IT industrial city and the various factors that can assist in developing the IT industry in the city so that economic prosperity can be engendered. The development of the IT industry was examined by the behavior of the various parameters, such as earnings from the IT industry (turn over) and growth of knowledge workers under the influence of built infrastructure development. The scenarios of the supply and demand of different built infrastructure and energy have been examined to understand how they influence IT industrial growth. Conversely, it also examined how the development of the IT industry would influence the infrastructure development in the city, which would contribute to the sustainable development of the city. However, the investigations related to the impact of the IT industry on social aspects such as education, health, community, and cost of living, as well as environment has been kept out of the scope of the paper. The study contributes, in terms of establishing interlinkage among infrastructure, human resource and IT industry and their causal feedback relations, which needs to be considered while developing policy interventions for development of sustainable IT industries in South African cities.
2. Attributes Underpinning the Development of the IT Industry and IT City
The IT industry includes both software and hardware products, although predominantly, products are related to software development and business processing activities. Scholars have advocated that the IT industry can become a driver for both economic development and image building [1,8,18]. Several studies show that cities have experienced economic growth because of IT industrial activities and related investments. In other words, economic growth and IT industrial activities demonstrate a strong positive correlation [16,26,27,28,29,30,31,32,33,34,35,36,37,38,39]. It is also generally acknowledged that IT industrial development and the knowledge economy have contributed significantly to economic and human development in recent years [40,41,42]. Further, IT products, such as software and computing materials, remain at the heart of today’s socio-economic systems and specifically, for industries, business, and other socio-economic activities. In the wake of the current Industry 4.0, the complexity and dynamicity of most of the functions are IT driven. Such a scenario makes the development of the IT industry in a city more relevant [43]. Cities with IT or knowledge-based industry and societies are more likely to be successful to meet the challenges that the process of globalization has posed and also to promote inclusive development [44,45]. It is therefore unequivocally argued, that IT industrial development will bring in both social and economic development in a city.
However, there are certain elements that are argued to be vital for the development of the IT industry in a city. Such elements include human resource, investment, innovation, research and development, environment, image, and more importantly, infrastructure.
According to scholars such as Komninos et al., (2013) and Van Winden, Berg, Van Den, and Peter, (2007), Yigitcanlar, O’Connor, and Westerman, (2008) and Yigitcanlar, Velibeyoglu, and Baum, (2008a) [18,46,47,48], social/human capital is vital for the development of the IT industry and more so for the development of the city. The cities with IT industrial activities need to have intellectual capital and should be based on the combination of the availability of knowledge workers, creative capacity of the citizens, the exchange of institutional expertise and digital applications to organize the collective intelligence, and capacity to innovate [47]. It is also argued that concentration of highly qualified knowledge workers is conducive to the development of the IT industry and the cities encompassing such activities [49,50]. The effectiveness of the IT industry and productivity depend on the availability of IT professionals or knowledge workers to plan for, develop, maintain, and integrate information systems applications [51]. Moreover, competency is observed to be the most important pointer for the recruitment and retention of knowledge workers [52]. However, employee turnover is a major challenge in the IT industry [29,53]. The tendency to leave one IT firm for the other is very strong. The causes of turnover vary from external environmental factors such as economy, social, and physical environment to the organizational variables such as type of industry, occupation, organization size, payment, supervisory level, location, selection process, work environment, benefits, promotions and growth, job satisfaction, working conditions, etc. [29,54,55,56].
Investment is observed to be vital to the development of the IT industry. However, in the wake of limited investment from domestic sources and looking at the nature of the IT industry, it is found that since the 1980s, the developing countries consider foreign direct investment (FDI) to be vital for economic growth. Moreover, it is considered as a catalyst and growth engine for economic development, particularly for the growth of the IT industry [57,58]. It is argued that it not only can affect the rate of growth and level of per capita income, but it also can assist development of human capital, technology, and innovation, which are essential requirements for the IT industry [12]. For example, IT not only facilitates start-up businesses but also enhances their development and growth as well as facilitates contemporary entrepreneurial endeavors [59,60,61]. Consequently, efforts are continuously made by the developing countries to attract FDI [62,63].
Further, the IT industry has undergone technological and product level convergence at different points of time; however, the core competencies of the IT companies have not been affected [64]. So, creativity, innovation, training, and adaptation to changing scenarios also assist the long-term growth of the IT industry and the urban areas where they are situated [49,65]. Image of a city, such as quality of life, tourism resources, culture, competitive environment for development of new businesses, etc., attract both knowledge workers and skilled professionals, which encourage setting up or growth of the IT industry in those cities [13,49,66,67]. Thus, it is advocated that creativity, innovation, and knowledge workers assist in creation of knowledge-intensive businesses, or in other words, the IT industry.
The IT industry has critical environmental implications too. About 2% of global CO2 emissions are accounted from the IT industry and related activities. It is also argued that IT can significantly contribute to control and reduce 98% of CO2 emissions caused by other activities and industries [68]. Sustainable management of the environment is therefore an essential strategic component of a city that can attract the IT industry. This includes less consumerist lifestyles, an energy mix (conventional energy with renewable energy sources), the creation of green zones, sustainable housing with intelligent energy measuring tools, waste compactors, vehicle recharging stations, energy-saving lamps, waste treatment, etc., which can assist in creating safe and renewable use of the natural resources [66].
However, infrastructure in the form of energy, mobility and accessibility, housing, and built up space remain at the forefront of IT industry development [1,19,69,70,71,72]. Establishment of an excellent infrastructure and using it efficiently is an essential requirement to enable the city to attract and set up an IT industry. However, literature and evidence from IT cities revealed that growth of an IT industry also can cause stress on the infrastructure, impact the living condition and environment [1]. For example, it can contribute to traffic congestion, pollution, increase cost of housing, etc., which need to be taken care of. Besides, availability of land, tax incentives, supportive policy, and governance system of the cities play a role in the development of such industry in a city [49,69].
Therefore, according to literature, the IT industry is set up and grows significantly in cities that can attract investment, have adequate and satisfactory levels of infrastructure, high levels of living satisfaction, less environmental stress, capacity to attract and retain talented knowledge workers (human resources) [1,9,10,11,72], competitive environment for development of new business, offer platforms for innovation and portray a creative image [17,18,21,23,47,48,64,73].
3. Case Study City: Bloemfontein
The city of Bloemfontein in South Africa was taken as the case study for this investigation. The city is chosen as the case study because in general it could be a representative of similar cities in South Africa such as East London, Port Elizabeth, Klerksdorp, Pietermaritzburg, Centurion, Mafikeng, etc., from the socio-economic and morphological point of view. Bloemfontein is one of the six major cities of the country and forms the most important constituent of the Mangaung metropolitan municipalities. Geographically, it is situated at the latitude of 29.133 and longitude of 26.214, which makes the city located almost at the center of the country. The city has a spatial land area of 236.17 square kilometers and has a population of more than 460,000 [74]. It is regarded as one of the fast-growing cities in the country. Functionally, it is the capital city of the Free State province as well as it is the judicial capital of South Africa, as the judicial Appellate and Supreme Court of the country are located in the city.
The city is unique in itself because of its certain functional and physical characteristics. It is considered as the most important city in the central region of the country. Unlike other major cities of the country, it does not have mining or marine-based resources. It also does not boast any major tourism resource as found in other parts of the country. However, the important economic functions include trade and service, small industrial, and some informal economic activities. The majority of the people are employed in government services, finance, trade, transport, small industry, and informal sector activities. It also houses several regional centers of business, corporate houses, and professional institutions. However, in the absence of major mining activities and availability of marginal industrial activities, it is largely regarded as a service function-oriented city.
The city has a designated central business district (CBD) and about 40 suburban areas. The CBD has a mixed land use, although predominated by commercial and administrative activities. The suburban areas are largely residential areas. The residential areas are of low density constituting low rise buildings. The industries are located towards the periphery of the city. However, in recent years, decentralization of various urban functions has been experienced and new centers in and around the residential sub urban areas have been created.
The city is accessible from all parts of the country by all the three modes of transportation such as, road, rail, and air. However, rail transportation is confined to freight movement only. An international airport is located in the city, which provides connecting flights to the major cities of South Africa and abroad. The city has also adequate civic infrastructure and services such as water supply, sanitation, sewerage, and solid waste management system, which are provided by the Mangaung Metro Municipality.
One of the major potentials of the city is the availability of educational facilities. Some of the schools located in the city are well recognized in the country. Two out of the total 23 universities in the country are in the city. The two universities offer tertiary education to almost 50,000 students. More than 1000 skilled and competent graduates belonging to scientific, engineering, and technology fields are generated per year from the universities and colleges in and around the city.
Information technology (IT), communication sector, and internet have a reasonable presence. Most of the parts of the city are well connected by broad band and wireless connectivity. Although, IT industrial activities do not have a significant presence, they are starting to place their foot. Currently, there are about 27 software-related industries engaged in both software development and providing services to the local market, although at a smaller scale. More than 600 professionals are estimated to be directly employed in the sector, who are engaged in software development or providing IT and communication-related services.
Another significant aspect of the city is that the city government has made economic growth one of the major thrust areas for its sustainable development. However, in the absence of major industrial, mining, tourism activities, etc., experts, planners, and some academicians argue that there is a very meagre opportunity for large scale economic development unless a paradigm shift is made, and innovative economic activities based on its potential are engendered. Consequently, looking at the availability of an acceptable level of transportation and civic infrastructure, educational facilities and potential availability skilled personnel, particularly in the scientific and engineering field, an argument has emerged that IT industrial activities can bring significant economic growth to the city and can create a distinct image.
4. Methodology
Epistemological positivism philosophical approach underpins this study. Based on this philosophical approach, a mixed method of research design was adopted [75]. First, a survey research methodology was adopted to collect both quantitative and qualitative data. The data collected were analyzed both quantitatively and qualitatively. Both qualitative and quantitative data collection and subsequent analyses were conducted because of the lack of availability of adequate structured and statistical data related to the study area. A system dynamics (SD) modeling approach was employed as it can capture complex relationships and causal feedback effects, which is found to be suitable for understanding the non-linear complex problems related to urban systems. The details of the data collection, data analyses, and SD modeling are discussed in the following sub sections.
4.1. Input Data, Constraints, and Assumptions
Data from both primary and secondary sources were collected. Statistical (secondary) data was collected from authentic published and unpublished literatures, reports, and documents of organizations such as Statistics, SA, Mangaung Metro municipality, IT industry, CENTLEC, etc. Two types of surveys, such as the households survey and IT industry survey, were conducted to collect the primary data. The surveys were conducted among a total number of 240 selected households and 15 IT industries located in the city. The sample size for the household survey is deemed to be adequate at a confidence level of 95%, and confidence interval of 6.3% at the worst-case percentage of 50% and therefore accepted. The household survey was conducted in six suburban areas of the city which included the CBD at the center and five suburbs such as Dan Piennar in the north, Universitas in the south, Langenhoven park in the south west, Fichrardtpark in the west, and Heidedal in the east. These areas were selected based on their geographical location, demographic characteristics, land use, infrastructure availability, and spatial characteristics so that they represent the heterogeneity of the city. The survey was administered through a stratified random sampling survey method by using pre-tested questionnaires at the households’ level. The number of households surveyed in the sub urban areas ranged between 40 and 60 based on proportionate distribution of population in those areas. The household data was used to understand the general infrastructural scenarios of the city.
The IT industry survey was conducted by following a random sampling process. The number of IT industries surveyed constitutes more than 50% of the total number of companies available in the city, therefore the sample size is deemed adequate. The data collected was used to understand the types of activities being undertaken by different companies under the IT industry, number of employees, earning (turn over), exports, infrastructure demand, challenges, and opportunities of the IT industry in the city. Further, discussions with experts and professionals related to urban development, real estate, energy field, and the IT industry were made to understand and corroborate the factors, which could influence the setting up and growth of the IT industry in the city.
Initially, the data collected were checked for reliability by means of Cronbach’s alpha test and consistency by use of standard deviation. Then, relevant statistical analyses such as tabulation and percentage analysis were used to identify the major factors that influence the setting up and growth of the IT industry and the inputs for the development and simulation of the SD model. The tabulation and percent analysis of the data collected from the household survey was conducted for parametrization or identifying the major factors as no structured statistical data relating to earnings from the IT industry and infrastructure such as housing, energy, built up space for IT industry, water supply and sanitation, local transportation human resources, and environment and image were available. The lack of statistical data compelled to use the primary data, specifically the perceptions of the respondents to examine the relative influence of the parameters on the location of the IT industry. However, the responses from the household survey were corroborated from the qualitative data collected through discussion from experts and professionals. The qualitative data collected from the experts and professionals were analyzed by using narrative and interpretative methods.
Further, the data collected from the IT industry with regards to earnings from exports, human resource, rate of growth of earning, rate of growth and attrition rate of human resources, investment, etc., were analyzed on aggregate basis to observe their mean values and used as inputs to initialize and simulate the SD model. Also, input data regarding various infrastructure such as houses, built up space, energy, and their growth rates collected from the various organizations were analyzed on aggregate basis by use of descriptive statistics, such as mean values, and used to develop the model.
4.2. Systems Applications and Systems Dynamics in Urban Development Modeling
Since a city is a complex system where various subsystems such as infrastructure, IT industry, and human resource are interdependent and interlinked to each other, and many variables belonging to the subsystems and the city as a system have causal feedback relations, at the heart of the methodological frame work of this paper, the systems theory and applied systems analysis (ASA) implied SD modeling approach was found suitable and thus considered. Systems theory and ASA implied SD modeling uses explicit causal-effect assumptions between related variables in a system [76]. In other words, causal relations between different elements of a system are explicitly brought out by causal loop diagrams. Consequently, it offers means to capture complex relationships and feedback effects within a set of interrelated activities and processes [77,78,79,80], providing policy makers with a practical tool, which can be used to solve complex wicked problems [81]. It provides a structured way of analyzing complex interrelationships that are problematic or simply of interest to mankind and assist in evolving policy interventions for complex problems [82]. From the quantitative representation of the relationships, the SD modeling [83] is also grounded in the control theory [84] and modern theory of nonlinear dynamics [85]. The model is built using stocks and flows, and represented by stock and flows diagrams. SD has been a useful simulation tool to understand the complex processes and to experiment with scenarios and policies for an urban system.
The SD model was developed and simulated under different scenarios of policy interventions to examine the perspectives of the IT industry in the city. For this purpose, first causal loop diagrams (CLD), among influential factors, were developed followed by development of stock flow diagrams (structure) and mathematical simulation model and scenario analysis [81,86,87,88].
5. Modeling
The model to examine the perspective of the IT industry in Bloemfontein was developed by following a systematic process. Initially, the factors that could predominately influence the set up of the IT industry and status of the variables that are essential for the development of the sub models and the integrated model were established from the results obtained from the statistical analyses of the data collected from the households and IT industry survey, as well as from the secondary sources and expert discussions. Then, CLDs were developed to observe the feedback relationships among the variables, to conceptualize the sub models and the model, and to develop dynamic hypotheses. Further, the structure or stock flow diagram was built, and then mathematical simulation model was developed. The model was then simulated to examine the behavior of the IT industry under different scenarios of policy interventions.
5.1. Factors Influencing IT Industry in the City
Table 1 presents the status of various factors, which have bearings on the IT industry development in the city. The factors were evaluated from the perceptions of the respondents from the households’ survey and the IT industry survey conducted in the city for the said purpose. Expert opinions were also used to corroborate the findings of the statistical analyses. The factors were classified under several categories, such as infrastructure, environment and image, investment, policy, and human resource. The factors were evaluated based on the challenges they create in the city. It was found that under the infrastructure, housing, energy (electrical), and built up space for IT industry are the major challenges. More than 88% of the respondents perceived housing as a major challenge in general, and according to the urban development experts and IT industry professionals, it remains vital to attract quality knowledge workers to the city to work in the IT industry. As the real estate development experts and IT professionals discussed, houses of specific quality that are suitable for high paid personnel in the IT industry are limited. More than 80% of the respondents also believed that energy is a major challenge, particularly for the industry. A discussion with experts from the energy sector in the city and IT industry professionals revealed that currently, there is not much of a supply challenge or availability of energy in the city except during crises or power outage in exigency situations. Also, the city is not likely to face significant energy challenges in the future. However, the major challenge is the cost of energy (tariff of energy), particularly for the industry sector. The survey also revealed that a significant challenge exists with regards to availability of built up space, particularly for the IT industry. Currently, the IT industry functions mostly from rented buildings in commercial or office complexes. The available spaces are inadequate in terms of quantity and quality. No specific built up spaces such as IT parks and special industrial or economic zones, which could bolster the IT industrial activities, exist in the city as per the opinions of the professionals from the IT industry. However, other infrastructures such as water supply and sanitation facilities and the local road transportation system are currently adequate and seem not to influence the IT industry directly.

Table 1.
Factors (challenges) influencing location of the Information Technology (IT) industry.
According to the people (Table 1), local environment in terms of pollution and living conditions is not a major challenge. However, according to IT professionals, the city does not pose an economic image. Further, according to IT industry professionals, the IT policy of the country and incentives for the location of the industry in the city (or region) (according to 53.33% of IT industry professionals) are not largely conducive. Moreover, the city does not have an IT policy of its own, and thus does not provide any incentives for setting up an IT industry in the city.
According to the IT industry survey (Table 1), investment in terms of investment in general industrial development, and specifically in the IT industry, remains a concern. However, according to the people surveyed and supported by IT industry professionals and urban development experts in the city, investment in infrastructure such as upgradation, maintenance, and creation of physical infrastructure is not a major concern as the metro municipal corporation makes provision in its budget regularly, although to a limited extent.
Human resource forms one of the core components of the IT industry development. The scenario of human resource was examined in terms of availability of the skilled knowledge worker, attrition rate of knowledge workers, and potential availability of knowledge workers in the city. According to the IT industry, the attrition rate is very high and current availability of the knowledge workers is a major concern. However, the city has potential for availability of the knowledge workers because of the location of the two universities in the city as well as the availability of a number of colleges and universities in and around the city from where a significant number of sciences, engineering, and technology graduates emerges every year.
Thus, based on the survey results and discussion with the experts and industry professionals, human resource (knowledge workers), and infrastructure in terms of housing, energy (energy tariff), and built up space for the IT industry are taken as the major factors, which could influence the development of the IT industry in the city and are used in the model building. Further, consideration for investment from the IT industry in the concerned infrastructure as a feedback is also made in the model development. However, social factors, environment, and economic image are taken as exogenous factors and presumed that they will be qualitatively influenced by the development of the IT industry in the long run.
5.2. Conceptual Modeling: Use of Causal Loop Diagrams
Based on the four important factors, such as human resource (knowledge worker), housing, energy, and built up space for the IT industry and their influence on the development of the IT industry in the city, CLDs were developed and used to build conceptual SD models. CLDs are constructed based on the feedback relationships among the variables. Conceptual sub models for each of the factors were developed by considering the CLDs and the various parameters influencing each factor. Further, an integrated conceptual SD model was developed by integrating the above mentioned four factors with the IT industry (in terms of earnings from the IT industry) and their causal feedback relationships to extract dynamic hypotheses, which could form the base of the developing policy interventions for the development of the IT industry. The conceptual sub models for each factor and the integrated model were then utilized to develop stock flow diagram and a computational simulation model. The CLDs and conceptual models for each factor and integrated conceptual SD model are discussed below.
5.2.1. Human Resource (Knowledge Worker) Sub Model
The critical human resource in the IT industry is the knowledge workers. Knowledge workers directly impact the earnings from the IT industry. Figure 1 presents the conceptual SD model for knowledge workers. The availability of the knowledge workers depends on the normal inflow of knowledge workers from the local universities and from outside if conditions are right, such as competitive salary and suitable infrastructure and facilities. So, availability of knowledge workers and general inflow of knowledge workers form reinforcing causal loop R1. However, attrition of the knowledge worker is a major cause of reduction in the availability of knowledge workers. Attrition occurs because of the lack of adequate infrastructure, such as houses fit for such personnel and lack of appropriate economic image and competitive environment. Furthermore, lack of competitive salary or lack of incentives discourages people to join or encourages to leave the IT industry. Thus, attrition of knowledge workers creates balancing loop B1 with the availability of knowledge worker. However, it is envisaged, that the balancing loop B1 can be countered by the reinforcing loop R1 by offering appropriate incentives, creating a competitive image, and strengthening the infrastructure.
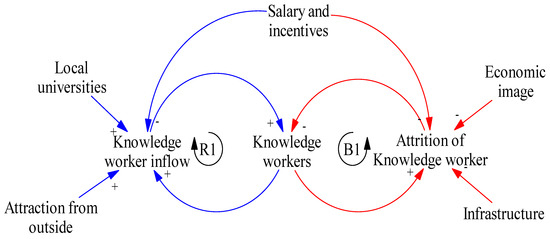
Figure 1.
Conceptual sub model for knowledge workers.
In the sub model, the knowledge worker is the stock variable which is defined by (1) and the rate variables knowledge worker inflow and attrition rate are defined by (2) and (3):
5.2.2. Housing Sub Model
Figure 2 shows the conceptual SD sub model for the housing in the city. Housing is found to be a critical infrastructure that attracts or dissuades knowledge workers to join the IT industry in the city. There is also normal inflow of houses and the city has adequate stock of houses for normal use by the residents. However, due to the increase in population, there is an increased demand for the houses, consequently new construction occurs. On the other hand, the stock of houses is reducing because of normal depreciation and degradation of the houses, which forms a balancing loop B2. However, the inflow of houses because of new construction causes a reinforcing loop R2 and is likely to reinforce the housing stock. Although the demand for houses largely engenders from the population of the city, there is an additional demand for houses because of the significant student population. However, the knowledge workers have a demand for a specific quality (such as safe, fully furnished, and with amenities) of houses, which are not largely available. The demand for such houses also adds to the demand of houses in the city. Thus, investment for new construction including the construction of specific type houses suitable for knowledge workers and refurbishment of the degraded houses will increase housing supply in the city, which will be able to meet the demands of the human resource of the IT industry, including that of knowledge workers. This scenario is envisaged to further strengthen the reinforcing loop R2 and likely to counter the balancing loop B2. Consequently, housing infrastructure will become an important attracting factor for knowledge workers in their decision making to work in the city.
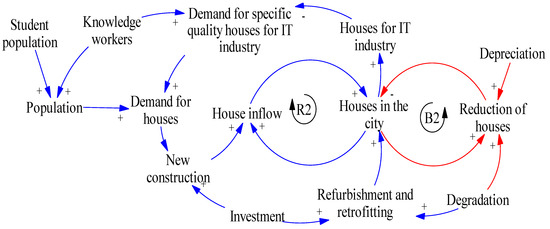
Figure 2.
Conceptual sub model for houses.
In the sub model, the houses in the city is the stock variable which is defined by (4) and the rate variables housing inflow and reduction rate of houses are defined by (5) and (6):
5.2.3. Built Up Space Sub Model
Built up space is crucial for the operation of the IT industry. There is a specific requirement for built up space for knowledge workers and the operation of IT industrial activities. The conceptual sub model developed for the built-up space in the city is presented in the Figure 3. Currently, there is a meagre availability of specific built up space available for the IT industry although a significant amount of built up spaces for other professional and commercial activities are available. The IT industry is mostly operating in the rented commercial spaces. Although, new constructions are found to strengthen the built-up space in the city, a reduction in the built-up space is experienced because of depreciation and change of functions of the spaces. So, the built-up space for the IT industry and reduction in built up space form a disruptive loop B3 and cause in the reduction of the built-up space stock in the city. Further, if a new IT industry is set up, a further demand for built up space will arise aggravating the current scenario. However, investment for new construction will increase the inflow of built up space, which will strengthen the built up space stock through reinforcing loop R3, and likely to balance the disruptive mechanism B3. Further, the refurbishing of the degraded built up space will add to the built up space stock, which consequently is able to meet the demand of the IT industry and assist the IT industry growth.
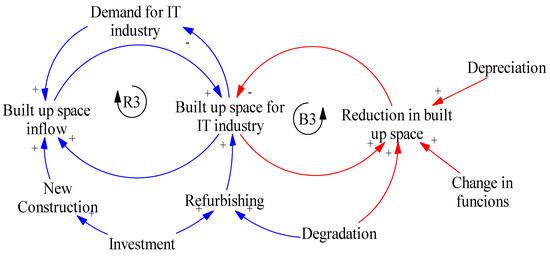
Figure 3.
Conceptual sub model for built up space.
The stock variable built up space for IT in industries in the city is defined by (7) and the rate variables built up space inflow and reduction of built up space are defined by (8) and (9):
5.2.4. Energy Sub Model
Energy (or uninterrupted power supply) is very important for the efficient functioning of the IT industry. So, energy is an important requirement for the IT industry development in the city. The city procures the energy from ESKOM (Electricity Supply Commission), a public sector company in the country, and distributes through CENTLEC (SOC) Ltd. (CENTLEC), a power distribution company under the Mangaung metro municipality. All the industries in the city, including the IT industry, procure energy for their requirement from CENTLEC. The energy supply is also reinforced by the energy available from the renewable sources such as solar energy in the city. However, it is noted that the availability of renewable energy in the system is not significant and does not contribute significantly to total energy supply. A discussion with the professionals from the energy industry revealed that although it is promoted theoretically, the availability and its contribution to the system will remain limited for a foreseeable period. The reason behind this challenge is the lack of renewable energy infrastructure and the need for significant initial investment to develop such infrastructure. Furthermore, although renewable energy can be argued to supplement the energy supply at the individual household level or at some organization level, according to professionals and experts of the IT industry, it is not a viable option as the IT industry itself or the institutions related to energy generation, supply, and distribution are not geared up to develop renewable energy infrastructure within a foreseeable future independently or institutionally. However, renewable energy harvested by the individual households and organization is likely to supplement the energy supply from CENTLEC. Therefore, renewable energy has been considered as a part of the total energy supply in the city. Currently, there is not much challenge with regards to meeting the energy demand of the city. So, energy procurement from CENTLEC and energy for the IT industry form a reinforcing causal loop R4 of demand and supply (Figure 4). However, the major challenge is the cost of energy (or energy tariff) for the industry, which is argued to be expensive and thus, causes obstacles in the development of the IT industry in the city leading to lesser use through the disruptive loop B4. So, R4 is getting balanced by B4 and does not assist in the development of the IT industry (Figure 4). Thus, there is a need to make the availability of energy at an affordable tariff for the IT industry for its growth.
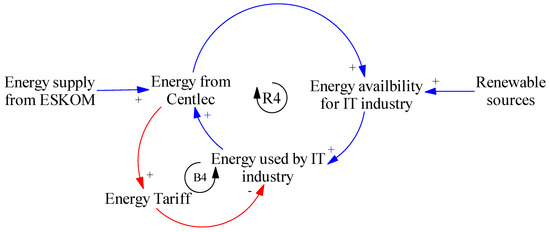
Figure 4.
Conceptual sub model for energy.
5.2.5. Influence of Parameters in Combination on the IT Industry: Integrated Model
Figure 5 presents the conceptual integrated model for the development of the IT industry in the city. The model was developed by considering the influence of the four factors, such as knowledge worker, housing, energy, and built up space and their interlinkage with the IT industry. The development of the IT industry is measured by the earnings from the IT industry. As the availability of knowledge workers is vital for the earnings from the IT industry (according to experts from the IT industry, use of knowledge workers and work hours are major determinants of the costing of projects and earnings from them), both the variables develop a reinforcing causal feedback relationship. In other words, earnings from the IT industry increases because of the availability of knowledge workers and as earning increases, inflow of knowledge workers also increases. Consequently, both the stocks show positive growth. The CLD is represented by the reinforcing loop R5. Further, higher earnings enable the IT industry to invest in the housing required for the knowledge workers, making the desired quality of housing infrastructure available in the city, which would attract or influence the knowledge workers’ decision to come and work in the city, thus enhancing the knowledge worker pool. Consequently, it reinforces the earnings from the IT industry through CLD R5A. Thus, R5A reinforces the feedback mechanism R5. However, the investment from the IT industry directly on the education and for improvement of the living conditions of the city in general and consequent feedback on the human resource stock have not been considered in the model development. As per the opinions of the IT industry experts discussed with this could be a limitation of the IT industry in terms of direct contribution. Also, according to urban development and policy experts, since the metro municipality and government make budgetary provisions and regular investments for such social aspects, specific focus in this direction seems to be highly unlikely. However, there could be indirect effects. Further, higher availability of energy (at an affordable tariff) will allow the IT industry to function efficiently, which will lead to higher earnings from the IT industry. Consequently, it will enable the IT industry to invest in energy, which will facilitate the knowledge workers to be more productive, thus bolstering the earnings from the industry. This phenomenon is represented by CLD R5B. Thus, CLD R5B complements the CLD R5 and strengthens the IT industry. Similarly, built up space for the IT industry, will allow the industry to function without any uncertainty, which will also produce a heathy physical work environment. This in turn will enable the knowledge workers to work more efficiently and produce more leadings to higher earnings. Higher earnings will make the industry invest further in built up infrastructure. The phenomenon works through a feedback loop R5C. Thus, R5C reinforces the feedbacks mechanism R5. Consequently, the parent feedback mechanism between knowledge workers and earnings from the IT industry is reinforced by the three feedback mechanisms because of housing (R5A), energy (R5B), and built up space (R5C) for the industry. Therefore, it is envisaged that the combined effect of knowledge workers, infrastructure such as houses, energy, and built up space will enhance earnings from the IT industry in the city. Also, as a corollary, employment opportunities, particularly in the IT industry, will increase. The enhancement of earnings from the IT industry and increase in employment opportunities will contribute to the economic growth of the IT industry and the city.
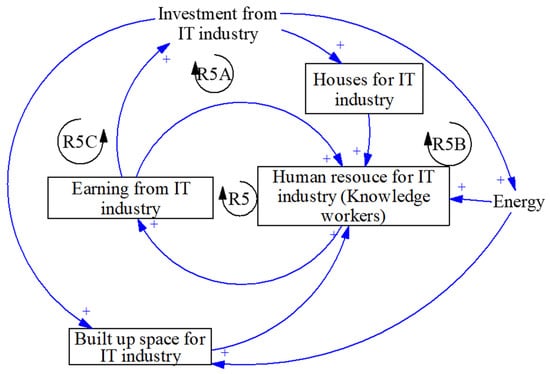
Figure 5.
Conceptual integrated model for the IT industry.
However, it is also argued and evidenced from different cities across the world that higher earnings from the IT industry is likely to lead to higher growth of the city in terms of increase in size, population, employment opportunities, etc. Consequently, there will be increased pressure on the infrastructure and increase in cost of living and degradation of the environment. However, these aspects of impact on the cost of living, increase in cost of use of infrastructure, pressure on infrastructure, and degradation of environment are kept out of the scope of the model development.
5.3. Quantitative Model and Simulated Scenarios
A stock flow diagram and then quantitative model (see stock flow diagram in Appendix B: Figure A1) was developed to observe the behavior of the IT industry in the city under different simulated scenarios. While developing the model, the postulated causal feedback mechanisms as discussed in the Section 5.2 were considered as the dynamic hypotheses. The behavior of the IT industry was examined under two major variables such as earnings from the IT industry and growth of knowledge workers in the industry. Further, scenarios of specific quality houses suitable for IT industry and built up space for the IT industry were examined. For this purpose, the city was considered as a system and IT industry was taken as a subsystem of the city and both have causal feedback relationships. Housing, human resource built up space for the IT industry, and energy are the components of the IT subsystem although they also influence the city system. The earnings from the IT industry, investment from it, and the knowledge workers in the industry are the endogenous parameters, while infrastructure such as houses, built up space, and energy and related variables were taken as exogenous variables. There are five types of stocks such as population, houses, built up space, knowledge workers, and earnings from the IT industry in the system. The stock variable earnings from the IT industry is influenced by the other three stocks such as knowledge workers, houses, and built up space. Population influences the housing stock. However, energy in terms of tariff is considered as an auxiliary variable because the system does not produce any energy, rather procures energy from outside sources, such as from the national grid (ESKOM). These stocks are dependent on a number of rate variables. Population is dependent on the birth rate, death rate, immigration, and outmigration rates. The housing stock is dependent on the rate variables, such as housing construction growth rate, housing refurbishing rate, housing depreciation rate, and housing degradation rate. Built up space is influenced by rate variables, such as built up space construction growth rate, built up space depreciation rate, built up space degradation rate, built up space change of function rate, built up space refurbishing rate. Knowledge worker stock is dependent on the normal knowledge worker growth rate, and attrition rate of knowledge workers. Under the normal conditions, such as in the current state, the earnings from the IT industry is taken as a function of the normal growth rate of the earnings from the IT industry. Initially, SD sub models for population, housing, built up space, knowledge workers (human resources), and earnings from the IT industry were developed. Under the housing sector, the demand and supply scenario of the total houses for the city and specific quality of houses for the IT industry knowledge workers were assessed. Similarly, the demand and supply scenario of built up space was assessed from the sub model developed for the built-up space for the IT industry. The energy scenario was assessed by use of ratio of perspective energy tariff and current tariff. As envisaged, these three variables, in addition to the endogenous variables of the IT industry, influence attraction, retention, or attrition of the knowledge workers, which is vital for the growth of the IT industry. Therefore, the influence of these variables was integrated into the knowledge worker sub model to examine the growth of knowledge workers under different conditions. The integration was made by use of table functions of the ratios of demand and supply of specific quality houses and built up space for the IT industry, ratio of perspective, and current energy tariff. Then, the knowledge worker sub model was integrated into the initial earnings from the IT industry sub model by use of a table function developed considering the influence of knowledge workers on earnings from the IT industry. The table functions were established based on historical data and expert opinions. The investment from the IT industry in the infrastructure, such as housing, built up space, and energy functions as a feedback to reinforce the infrastructure of the city, which in turn assists to attract and retain the knowledge workers and consequently reinforces the IT industry. The stock variable earnings from the IT industry is defined by (10):
The various variables, used to develop the sub models, and the model are presented in Table 2. The variables were initialized at the base year 2018.
Table 2.
Status of the variables influencing the IT industry.
The model (structure or stock flow of the model) (see Appendix B) was built by using Powersim software and employing algorithms (Appendix A). The model was validated first by checking the causal feedbacks relationships with exerts from the IT industry and urban development and modifying them suitably. Further, structure verification test and checking the algorithms were made to eradicate any anomalies and to make the model robust. The validated model was then simulated to make scenario analyses. The simulation time unit was taken as one year from the base year 2018, up to a maximum projected period of 20 years (until the year 2038). The simulation was made by using the Euler integration method with a time step of 0.03150.
Several scenarios were developed based on the changes in the status of the various variables and causal feedback linked policy interventions. The various conditions (to be used for policy options) for development of simulated scenarios are presented in Table 3. However, from a number of simulated scenarios developed, only four simulated scenarios such as normal-business as usual, pessimistic, optimistic, and perceived (feasible) scenarios based on the combined influence of infrastructure and knowledge workers (human resources) and their causal feedbacks were used to examine the behavior of the IT industry in terms of the growth of knowledge workers and earnings from the IT industry and were discussed in this paper. Further, the scenarios of housing of specific quality suitable for the IT industry and built up space for the IT industry were examined by the ratio of supply and demand of both the variables. Business as usual scenario indicates that no growth or reduction from the current status of various variables will occur and no policy interventions will be made. Pessimistic scenario implies that there would be increase in the energy tariff by 50% of the current value, no specific quality houses, and no new built up space for the IT industry, as well as no investment from the IT industry would be made. Optimistic scenario means that there would be a possibility of significant increase in investment from the IT industry (increase by 30%), energy tariff will be reduced by 30% from the current rate, 20% increase in specific quality houses suitable for the IT industry, and 30% increase in built up space for the IT industry. Under the perceived scenario, the investment from the IT industry would increase by 10%, energy tariff would reduce by 20% from the current rate, 10% increase in specific quality houses suitable for knowledge workers, and 20% increase in built up space specifically built for the IT industry.
Table 3.
Simulation scenarios.
6. Simulated Results and Discussion
As mentioned in the Section 5.3, the model was simulated under different scenarios by considering the influence of different variables linked to the dynamic hypotheses (based on and causal feedback relationships). Sensitivity analysis was conducted by use of the table functions premised upon the real-life scenarios as per the perceptions of the exerts and stakeholder. The simulations were conducted to observe the behavior of the IT industry under the four above mentioned scenarios such as business as usual, pessimistic, optimistic, and feasible. The perspective of the IT industry was examined by observing the behavior of the four variables such as earnings from the IT industry, knowledge workers, specific quality of houses for knowledge workers, and built up space for the IT industry.
6.1. Earnings from the IT Industry
Figure 6 presents the behavior of (growth) earning from the IT industry. The results indicate that under the business as usual scenario, the earnings from the IT industry will grow at a very marginal rate to attain a value of maximum 2.4 times of the current earnings by the projected year 2038. However, the growth of the earnings will remain almost static over the projected period under the pessimistic scenario. As evident from results, the earnings from the IT industry may rise at a significant rate over the projected period under the optimistic scenario. Under that circumstances, the earnings can reach a level of 15 times the current value by the projected year 2038. It is also seen that the earnings will grow at a gradual rate from the year 2018 to 2028, however it will show a sharp rise from the year 2028 to 2038. The perceived scenario indicates that the IT industry earnings can reach up to 9.6 times of the current value at the end of the projected year, implying a significant growth. However, this will follow a significant but gradual growth over the projected period. Thus, it is implied that if no policy interventions are made and the condition of the IT industry is left as it is currently, it will show a very meagre growth, while if certain conditions, such as tariff of energy, are increased and built up space and housing infrastructure were not built, the earnings from the industry will remain almost static. However, if appropriate policy interventions are made to provide appropriate infrastructure in terms of specific quality of housing and built up space to attract knowledge workers and energy tariff is optimally reduced, then the earnings from the IT industry will grow significantly.
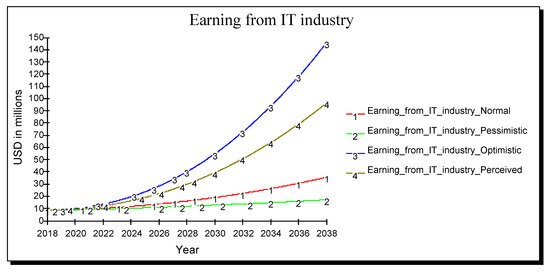
Figure 6.
Earnings from the IT industry under different scenarios.
6.2. Growth of Knowledge Workers (Human Resource)
The knowledge worker is considered as an important parameter for the growth of the IT industry and earnings from the IT industry. Figure 7 presents the growth of knowledge workers under different simulated scenarios. It is found that under the business as usual scenario, the knowledge worker stock will increase at a low rate but gradually will reach about 2.2 times the current number of knowledge workers. However, under pessimistic scenario the growth will be very marginal and only an increase of about 31% may be expected. Under the optimistic scenario, the growth of knowledge workers shows a sharp rise particularly after the year 2021, reaching up to 6.00 times the current knowledge worker numbers by the end of projected year 2038. The perceived scenario presents a more gradual rise until the year 2023, after which the increase is more significant, and the number of knowledge workers will reach about 4.60 times the current level. Thus, it is indicated that if appropriate conditions are created, such as provision of housing, and built up space for IT industry are made, then knowledge workers will be attracted to the city, benefiting the IT industry in the city significantly.
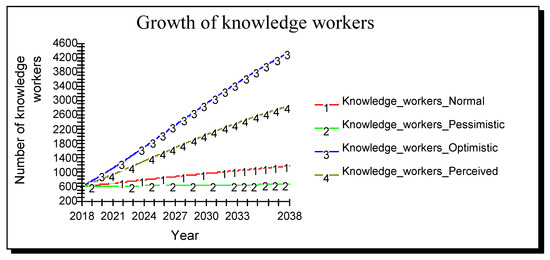
Figure 7.
Growth of knowledge workers under different scenarios.
6.3. Growth in Infrastructure (Houses and Built up Space)
As mentioned earlier, under infrastructure, only houses and built up space for the IT industry were examined. Figure 8 presents the scenario of ratio of supply and demand of specific quality houses suitable for the IT industry personnel in the city. As evident from Figure 8, under the business as usual scenario, the ratio of supply and demand is about 0.7 in the current state, which is expected to decrease gradually over the projected period indicating significant unavailability of suitable quality of houses for the IT industry personnel. The situation will be exacerbated under the pessimistic scenario when there will be no investment from the IT industry, or no policy interventions are made from the city. However, contrary to this, if a large investment is made specifically for construction of such houses, as well as refurbishment of the degraded houses are made under optimistic scenario, the ratio of supply and demand will be high (gap between supply and demand will be very meagre) during the initial years, although the ratio may decrease gradually. This implies that under this scenario, there will be adequate availability of such houses during the initial years, although it may reduce later years because of more demand. However, the gap between supply and demand will be much lesser than the business as usual or pessimistic scenarios. The perceived scenario depicts that at an appropriate investment from the IT industry and refurbishment of the degraded houses to a specific standard suitable for IT industry human resource, the demand and supply scenario will remain within acceptable limits. It shows that supply will be at the 80% levels of the demand for the first five years, but will decrease gradually over the projected years. This indicates that the demand of such houses will remain if growth of the IT industry occurs in the city, however, with policy interventions, the gap between supply and demand will be reduced significantly. The higher supply of quality houses will also reinforce the housing infrastructure in the city.
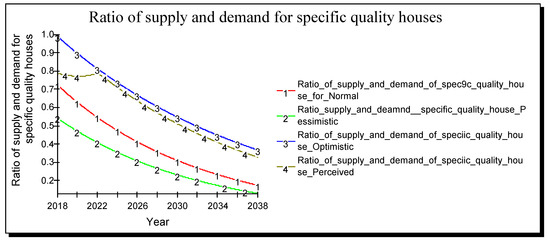
Figure 8.
Growth of houses suitable for the IT industry under different scenarios.
Figure 9 presents the ratio of supply and demand of built up space for the IT industry. It is seen, that under the business as usual scenario, there is a considerable gap between the demand and supply and it is likely to increase. Although the ratio is currently high, it will show significant reduction indicating that supply will not be able to match the demand. This scenario will be aggravated under the pessimistic scenario. This implies that if no policy interventions are made and certain conditions deteriorate, such as no investment occur from the IT industry, the supply of built up space will be drastically lower than the demand. On the other hand, there may be a significant change in the supply and demand status under the optimistic scenario. Initially the supply will match the demand, although it may show a gradual decrease for a few years from (2022 to 2028), after which it will again show gradual increase to meet the demand. However, if reasonable investments are made from the IT industry to create the built-up space for the IT industry and refurbishments of the degraded or unsuitable spaces under a perceived scenario, a gradual rise in the supply of built up space will be attained and the gap between supply and demand will decline gradually. It is also indicated that if the IT industry grows in the city, a significant demand for the built-up space will occur over the projected years, however, the supply will also increase significantly, which will reinforce the built-up space in the IT industry and in the city.
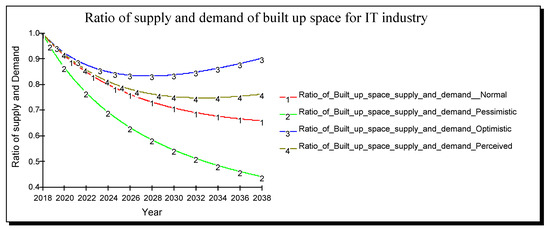
Figure 9.
Growth of built up space for the IT industry under different scenarios.
6.4. Discussion
It is evident from the results that knowledge workers play a crucial role in the development of the IT industry. The earnings from the IT industry largely depend on the knowledge workers, which has corroborated the findings of other scholars [1,17,18,19]. However, knowledge workers have specific demands and requirements to be attracted to a city or place to work. The foremost requirements are appropriate infrastructure, such as high-quality houses, and working conditions, such as built up space [1,5,17,18,19,71,72]. It is seen from the results of this study that the stock of knowledge workers rises with the availability of the specific quality of houses and built up infrastructure, and consequently assists in the growth of the IT industry.
Further, it is evident from this study, that energy remains a vital infrastructure for the growth of the IT industry. While availability of energy remains an important parameter [1,72], the cost of energy in combination with other infrastructure also plays an important role in the growth of the IT industry, as it provides an incentive to situate the industry in a city. Thus, policy interventions for the availability of appropriate infrastructure in terms of houses, built up infrastructure, and optimization of energy tariff to encourage the IT industry, along with attracting the knowledge workers to the city, will enhance the perspectives of the IT industry in Bloemfontein.
7. Conclusions
South African cities are facing a transition. The predominant economic activities, such as mining and conventional industrial activities, are on the wane. Most of the cities are depending on the service activities. The situation of the cities without such specific industrial, mining, or tourism activities are more challenging. At the same time, the governance systems of the country and cities are envisaging to make the cities sustainable and smart. Among the key areas of interventions identified, are infrastructure and economic growth. Under these premise arguments, a paradigm shift has emerged to move away from the conventional economic activities and institute progressive knowledge oriented economic activities. Therefore, the objective of the study was to examine the potential for the development of the IT industry in South African cities. In other words, the study examined the various factors that can assist in developing the IT industry in a city and what policy interventions are necessary to enhance the earnings from the IT industry, knowledge workers, and infrastructure for the IT industry such as houses and built up space for the industry. The study was conducted by using the city of Bloemfontein in South Africa. The survey research method and ASA implied SD modeling approach were used for this purpose. Findings suggested that the city has ample scope for development of the IT industry if appropriate policy interventions are made. It was found that knowledge workers, houses of specific quality suitable for knowledge workers, built up space for the IT industry, and energy tariff are influential variables for the development of the IT industry in the city. It is also revealed that if the current scenario exists, the IT industry in the city will grow marginally and under pessimistic conditions, such as significant increase in energy tariff and no enhancement of houses and built up space and no investment from the IT industry, the growth of the industry with remain static. However, policy intervention for creating the adequate houses of specific quality suitable for the IT industry human resource, adequate creation of built up space for the IT industry, optimal reduction of energy tariff, and a reasonable investment from the IT industry on the required infrastructure will significantly enhance the knowledge workers and earnings from the IT industry in the city. Simultaneously, both housing infrastructure and built up space for the IT industry will be strengthened as well as growth in knowledge workers, thus reinforcing the development of a sustainable IT industry in the city.
The study has contributed to the discourses of the ASA paradigm based on systems theory, particularly in the use of ASA and systems theory to deal with complex problems in the urban systems. It evidenced the interplay among various influential parameters of various subsystems, such as different infrastructure subsystems and human resources influencing the IT industry system, which is a subsystem of the city as a complex system and how economics of the IT industry and infrastructure and human resources are interlinked, particularly in the South African context. Also, it offers a methodology to understand the inter-linkage among various parameters under the infrastructure, human resource aspects, and IT industry development in a city. Further, the SD model developed can assist in simulating behaviors of the IT industry system and infrastructure system in a city in a developing country such as South Africa. Moreover, from the practical implication point of view, the model can enable the policy and decision makers and the city development authorities to foresee the impacts of different policy interventions on the development of an IT industry in a city. In other words, the study evidenced that the policy and decision makers and the city authorities should look beyond the policies for offering normal incentives, such as the provision of land, tax incentives, creating single window system, ease of licensing system, etc., to attract the IT industry to a city and make to policies for the development of appropriate infrastructure that can attract the IT industry and the knowledge workers to a city.
The study has some limitations. The first limitation is that only a few endogenous variables and exogenous variables were considered. The influential variables were decided based on the perception survey and expert opinions. Further, the survey was conducted with a limited sample size. Various qualitative variables, such as environment, living standard, satisfaction level of knowledge workers, were not integrated into the model. Although, apparently, development of the IT industry may have unintended consequences on the city in the forms of pressure on infrastructure, increase in the cost of use of infrastructure, such as increase in the cost and renting of houses, increase in general living cost, environmental degradation, etc., they have been kept out of the scope of the current study and would be considered as the future scope of the research. Also, although renewable energy source can be argued to be a viable and affordable energy source, it was not considered as a dynamic hypothesis in the modeling because of its limited availability and requirement of significant investment for related infrastructure. Additionally, another limitation is that the direct investment from the IT industry on social aspects, such as on the education and for improvement of the living conditions of the city in general and its feedback on the human resource stock, have not also been considered in the model development. However, in the further stage of the research, such aspects will be considered to get further insights into the situation of the IT industry development and its impact on the city. However, despite the limitations, the study at its current state perceives that South African cities have significant potential to develop an IT industry if appropriate policy interventions for infrastructure development and to attract or retain knowledge worker are made.
Funding
The research was funded by National Research Foundation (NRF), South Africa Grant Number: 106023, 15-12-2016.
Acknowledgments
The author would like to acknowledge the support of the National Research Foundation (NRF), South Africa for this study. This study is a part of larger research project- Integration of Information and Communication Technology for sustainable cities in South Africa funder by NRF (Grant Number: 106023, 15-12-2016).
Conflicts of Interest
The author does not have any conflict of interest.
Appendix A
| Model Algorithm | |
| init | Built_up_space_supply = 6250 |
| flow | Built_up_space_supply = −dt × Rate_19 |
| −dt × BSR_depreciarion_rate | |
| +dt × BS_Construction_rate | |
| doc | Built_up_space_supply = SQM |
| init | Built_up_space_supply_1 = 6250 |
| flow | Built_up_space_supply_1 = −dt × Built_up_space_reduction_rate |
| +dt × BS_Construction_rate_1 | |
| −dt × BSR_depreciarion_rate_1 | |
| doc | Built_up_space_supply_1 = SQM |
| init | Built_up_space_supply_2 = 6250 |
| flow | Built_up_space_supply_2 = −dt × BSR_depreciarion_rate_2 |
| +dt × BS_Construction_rate_2 | |
| −dt × Built_up_space_reduction_rate_1 | |
| doc | Built_up_space_supply_2 = SQM |
| init | Built_up_space_supply_3 = 6250 |
| flow | Built_up_space_supply_3 = −dt × Built_up_space_reduction_rate_2 |
| +dt × BS_Construction_rate_3 | |
| −dt × BSR_depreciarion_rate_3 | |
| doc | Built_up_space_supply_3 = SQM |
| init | Earning_from_IT_industry_4 = 9.125 |
| flow | Earning_from_IT_industry_4 = +dt × IT_earnign_growth_rate_4 |
| doc | Earning_from_IT_industry_4 = millionUSD |
| init | Earning_from_IT_industry_Normal = 9.125 |
| flow | Earning_from_IT_industry_Normal = +dt × IT_earnign_growth_rate |
| doc | Earning_from_IT_industry_Normal = millionUSD |
| init | Earning_from_IT_industry_Optimistic = 9.125 |
| flow | Earning_from_IT_industry_Optimistic = +dt × IT_earnign_growth_rate_2 |
| doc | Earning_from_IT_industry_Optimistic = millionUSD |
| init | Earning_from_IT_industry_Percieved = 9.125 |
| flow | Earning_from_IT_industry_Percieved = +dt × IT_earnign_growth_rate_3 |
| doc | Earning_from_IT_industry_Percieved = millionUSD |
| init | Earning_from_IT_industry_Pessimistic = 9.125 |
| flow | Earning_from_IT_industry_Pessimistic = +dt × IT_earnign_growth_rate_1 |
| doc | Earning_from_IT_industry_Pessimistic = millionUSD |
| init | Housing_supply = 167000 |
| flow | Housing_supply = −dt × Degradation_rate |
| −dt × Depreciation_rate | |
| +dt × H_Cnstruction_rate | |
| init | Housing_supply_1 = 167000 |
| flow | Housing_supply_1 = −dt × Depreciation_rate_1 |
| +dt × H_Construction_rate_1 | |
| −dt × Degradation_rate_1 | |
| init | Housing_supply_2 = 167000 |
| flow | Housing_supply_2 = −dt × Degradation_rate_2 |
| +dt × H_Cnstruction_rate_2 | |
| −dt × Depreciation_rate_2 | |
| init | Housing_supply_3 = 167000 |
| flow | Housing_supply_3 = +dt × H_Cnstruction_rate_3 |
| −dt × Degradation_rate_3 | |
| −dt × Depreciation_rate_3 | |
| init | Knowldge_workers_Normal = 625 |
| flow | Knowldge_workers_Normal = −dt × Attrition_rate |
| +dt × Knowledge_worker_growth_rate | |
| init | Knowldge_workers_Optimistic = 625 |
| flow | Knowldge_workers_Optimistic = +dt × Knowledge_worker_growth_rate_2 |
| −dt × Attrition_rate_2 | |
| init | Knowldge_workers_Percieved = 625 |
| flow | Knowldge_workers_Percieved = −dt × Attrition_rate_3 |
| +dt × Knowledge_worker_growth_rate_3 | |
| init | Knowldge_workers_Pessimistic = 625 |
| flow | Knowldge_workers_Pessimistic = −dt × Attrition_rate_1 |
| +dt × Knowledge_worker_growth_rate_1 | |
| init | Knowledge_workers_4l = 625 |
| flow | Knowledge_workers_4l = −dt × Attrition_rate_4 |
| +dt × Knowledge_worker_growth_rate_4 | |
| init | Populatuion = 463064 |
| flow | Populatuion = −dt × OMR |
| +dt × IMR | |
| −dt × DR | |
| +dt × BR | |
| init | Populatuion_1 = 463064 |
| flow | Populatuion_1 = +dt × BR_1 |
| −dt × OMR_1 | |
| +dt × IMR_1 | |
| −dt × DR_1 | |
| init | Populatuion_2 = 463064 |
| flow | Populatuion_2 = −dt × DR_2 |
| +dt × IMR_2 | |
| +dt × BR_2 | |
| −dt × OMR_2 | |
| init | Populatuion_3 = 463064 |
| flow | Populatuion_3 = −dt × OMR_3 |
| +dt × BR_3 | |
| +dt × IMR_3 | |
| −dt × DR_3 | |
| aux | Attrition_rate = Knowldge_workers_Normal × ARF |
| aux | Attrition_rate_1 = Knowldge_workers_Pessimistic × ARF_1 |
| aux | Attrition_rate_2 = Knowldge_workers_Optimistic × ARF_2 |
| aux | Attrition_rate_3 = Knowldge_workers_Percieved × ARF_3 |
| aux | Attrition_rate_4 = Knowledge_workers_4l × ARF_4 |
| aux | BR = Populatuion × BRF |
| aux | BR_1 = Populatuion_1 × BRF_1 |
| aux | BR_2 = Populatuion_2 × BRF_2 |
| aux | BR_3 = Populatuion_3 × BRF_3 |
| aux | BS_Construction_rate = Built_up_space_supply × (BSCRF + BSRF) × Impact_on_built_up_space |
| aux | BS_Construction_rate_1 = Built_up_space_supply_1 × (BSCRF_1 + BSRF_1) × Impact_on_built_up_space_1 |
| aux | BS_Construction_rate_2 = Built_up_space_supply_2 × (BSCRF_2 + BSRF_2) × Impact_on_built_up_space_2 |
| aux | BS_Construction_rate_3 = Built_up_space_supply_3 × (BSCRF_3 + BSRF_3) × Impact_on_built_up_space_3 |
| aux | BSR_depreciarion_rate = Built_up_space_supply × BDRF |
| aux | BSR_depreciarion_rate_1 = Built_up_space_supply_1 × BDRF_1 |
| aux | BSR_depreciarion_rate_2 = Built_up_space_supply_2 × BDRF_2 |
| aux | BSR_depreciarion_rate_3 = Built_up_space_supply_3 × BDRF_3 |
| aux | Built_up_space_reduction_rate = Built_up_space_supply_1 × (BSCFRF_1 + BSDRF_1) |
| aux | Built_up_space_reduction_rate_1 = Built_up_space_supply_2 × (BSCFRF_2 + BSDRF_2) |
| aux | Built_up_space_reduction_rate_2 = Built_up_space_supply_3 × (BSCFRF_3 + BSDRF_3) |
| aux | Degradation_rate = Housing_supply × HDGRF |
| aux | Degradation_rate_1 = Housing_supply_1 × HDGRF_1 |
| aux | Degradation_rate_2 = Housing_supply_2 × HDGRF_2 |
| aux | Degradation_rate_3 = Housing_supply_3 × HDGRF_3 |
| aux | Depreciation_rate = Housing_supply × HDPRF |
| aux | Depreciation_rate_1 = Housing_supply_1 × HDPRF_1 |
| aux | Depreciation_rate_2 = Housing_supply_2 × HDPRF_2 |
| aux | Depreciation_rate_3 = Housing_supply_3 × HDPRF_3 |
| aux | DR = Populatuion × DRF |
| aux | DR_1 = Populatuion_1 × DRF_1 |
| aux | DR_2 = Populatuion_2 × DRF_2 |
| aux | DR_3 = Populatuion_3 × DRF_3 |
| aux | H_Cnstruction_rate = Housing_supply × (HCRF + HRF) × Impact_of_investment_on_houisng_supply |
| aux | H_Cnstruction_rate_2 = Housing_supply_2 × (HCRF_2 + HRF_2) × Impact_of_investment_on_houisng_supply_2 |
| aux | H_Cnstruction_rate_3 = Housing_supply_3 × (HCRF_3 + HRF_3) × Impact_of_investment_on_houisng_supply_3 |
| aux | H_Construction_rate_1 = Housing_supply_1 × (HCRF_1 + HRF_1) × Impact_of_investment_on_houisng_supply_1 |
| aux | IMR = Populatuion × IMRF |
| aux | IMR_1 = Populatuion_1 × IMRF_1 |
| aux | IMR_2 = Populatuion_2 × IMRF_2 |
| aux | IMR_3 = Populatuion_3 × IMRF_3 |
| aux | IT_earnign_growth_rate = Earning_from_IT_industry_Normal × ((ITEGRF + Earning_from_knowldge_workers × 0.20/Earning_from_IT_industry_Normal)) |
| aux | IT_earnign_growth_rate_1 = Earning_from_IT_industry_Pessimistic × (ITEGRF_1 + Earning_from_knowldge_workers_1 × 0.20/Earning_from_IT_industry_Pessimistic) |
| aux | IT_earnign_growth_rate_2 = (Earning_from_IT_industry_Optimistic × (ITEGRF_2 + Earning_from_knowldge_workers_2 × 0.20/Earning_from_IT_industry_Optimistic)) |
| aux | IT_earnign_growth_rate_3 = (Earning_from_IT_industry_Percieved × (ITEGRF_3 + Earning_from_knowldge_workers_3 × 0.20/Earning_from_IT_industry_Percieved)) |
| aux | IT_earnign_growth_rate_4 = Earning_from_IT_industry_4 × ITEGRF_4 |
| aux | Knowledge_worker_growth_rate = Knowldge_workers_Normal × KWGRF × (Ratio_of_Built_up_space_supply_and_demand__Normal + Ratio_of_supply_and_demand_of_spec9c_quality_house_for_Normal) × Impact_on_knowldge_workers |
| aux | Knowledge_worker_growth_rate_1 = Knowldge_workers_Pessimistic × KWGRF_1 × (Ratio_of_Built_up_space_supply_and_demand_Pessimistic + Ratio_supply_and_deamnd__specific_quality_house_Pessimistic) × Impact_on_knowldge_workers_1 |
| aux | Knowledge_worker_growth_rate_2 = Knowldge_workers_Optimistic × KWGRF_2 × (Impact_of_built_up_spoace_on_knowledge_workers + Ratio_of_demand_and_supply_of_speciic_quality_house_Optimistic) × Impact_on_knowldge_workers_2 |
| aux | Knowledge_worker_growth_rate_3 = Knowldge_workers_Percieved × KWGRF_3 × (Impact_of_built_up_spoace_on_knowledge_workers_1 + Ratio_of_demand_and_supply_of_speciic_quality_house_Percieved) × Impact_on_knowldge_workers_3 |
| aux | Knowledge_worker_growth_rate_4 = Knowledge_workers_4l × KWGRF_4 |
| aux | OMR = Populatuion × ORF |
| aux | OMR_1 = Populatuion_1 × OMRF_1 |
| aux | OMR_2 = Populatuion_2 × OMRF_2 |
| aux | OMR_3 = Populatuion_3 × OMRF_3 |
| aux | Rate_19 = Built_up_space_supply × (BSCFRF + BSDRF) |
| aux | Deamnd_for_specific_quality_houses_1 = Demand_of_houses_1 × Specific_quality_housing_fraction_1 |
| aux | Deamnd_for_specific_quality_houses_3 = Demand_of_houses_3 × Demand_Specific_quality_housing_fraction_3 |
| aux | Deamnd_for_specific_quality_houses_Optimistic = Demand_of_houses_2 × Demand_Specific_quality_housing_fraction_2 |
| aux | Demand_for_Built_up_space = Knowldge_workers_Normal × DEMAND_per_KWF |
| aux | Demand_for_Built_up_space_1 = Knowldge_workers_Pessimistic × DEMAND_per_KWF_1 |
| aux | Demand_for_Built_up_space_2 = Knowldge_workers_Optimistic × DEMAND_per_KWF_2 |
| aux | Demand_for_Built_up_space_3 = Knowldge_workers_Percieved × DEMAND_per_KWF_3 |
| aux | Demand_for_specific_quality_houses_for_IT_industry = Demand_of_houses × Demand_fraction_for_specific_quality_houses |
| aux | Demand_of_houses = Number_of_households + Student_houses |
| aux | Demand_of_houses_1 = Number_of_households_1 + Student_houses_1 |
| aux | Demand_of_houses_2 = Number_of_households_2 + Student_houses_2 |
| aux | Demand_of_houses_3 = Number_of_households_3 + Student_houses_3 |
| aux | Earning_from_knowldge_workers = ((Knowldge_workers_Normal−625) × (Rate_of_earning_per_knowledge_worker × 365))/1000000 |
| aux | Earning_from_knowldge_workers_1 = ((Knowldge_workers_Pessimistic−625) × (Rate_of_earning_per_knowledge_worker_1 × 365))/1000000 |
| aux | Earning_from_knowldge_workers_2 = ((Knowldge_workers_Optimistic−625) × (Rate_of_earning_per_knowledge_worker_2 × 365))/1000000 |
| aux | Earning_from_knowldge_workers_3 = ((Knowldge_workers_Percieved−625) × (Rate_of_earning_per_knowledge_worker_3 × 365))/1000000 |
| aux | Energy_tarrif_ratio = Perspective_tariff_rate/Current_tariff_rate |
| aux | Energy_tarrif_ratio_1 = Perspective_tariff_rate_1/Current_tariff_rate_1 |
| aux | Energy_tarrif_ratio_2 = Perspective_tariff_rate_2/Current_tariff_rate_2 |
| aux | Energy_tarrif_ratio_3 = Perspective_tariff_rate_3/Current_tariff_rate_3 |
| aux | Gap_in_built_up_space__pessimistic = (Demand_for_Built_up_space_1−Built_up_space_supply_1) |
| aux | Gap_in_built_up_space_demand_and_supply_Normal = (Demand_for_Built_up_space-Built_up_space_supply) |
| aux | Gap_in_built_up_space_oprimistic = (Demand_for_Built_up_space_2−Built_up_space_supply_2) |
| aux | Gap_of_built_up_space_percieved = (Demand_for_Built_up_space_3−Built_up_space_supply_3) |
| aux | Impact_of_built_up_spoace_on_knowledge_workers = GRAPH(TIME,0,0.1,[0.02,0,0.04,0.05,0.13,0.27,0.35,0.44,0.64,0.76,1”Min:0;Max:1”]) × Ratio_of_Built_up_space_supply_and_demand_Optimistic |
| aux | Impact_of_built_up_spoace_on_knowledge_workers_1 = GRAPH(TIME,0,0.1,[0.02,0,0.04,0.05,0.13,0.27,0.35,0.44,0.64,0.76,1”Min:0;Max:1”]) × Ratio_of_Built_up_space_supply_and_demand_Percieved |
| aux | Impact_of_investment_on_houisng_supply = GRAPH(Invetsment_on_housing,0,0.1,[0.04,0.07,0.09,0.13,0.21,0.34,0.49,0.59,0.84,0.99,0”Min:0;Max:1”]) × Invetsment_on_housing |
| aux | Impact_of_investment_on_houisng_supply_1 = GRAPH(Invetsment_on_housing_1,0,0.1,[0.04,0.07,0.09,0.13,0.21,0.34,0.49,0.59,0.84,0.99,0”Min:0;Max:1”]) × Invetsment_on_housing_1 |
| aux | Impact_of_investment_on_houisng_supply_2 = GRAPH(Invetsment_on_housing_2,0,0.1,[0.04,0.07,0.09,0.13,0.21,0.34,0.49,0.59,0.84,0.99,0”Min:0;Max:1”]) × Invetsment_on_housing_2 |
| aux | Impact_of_investment_on_houisng_supply_3 = GRAPH(Invetsment_on_housing_3,0,0.1,[0.04,0.07,0.09,0.13,0.21,0.34,0.49,0.59,0.84,0.99,0”Min:0;Max:1”]) × Invetsment_on_housing_3 |
| aux | Impact_on_built_up_space = GRAPH(TIME,0,0.1,[0.02,0.08,0.13,0.16,0.19,0.27,0.36,0.45,0.6,0.69,1”Min:0;Max:1”]) × Energy_tarrif_ratio |
| aux | Impact_on_built_up_space_1 = GRAPH(Energy_tarrif_ratio_1,0,0.1,[0.97,0.98,0.73,0.63,0.54,0.4,0.3,0.26,0.23,0.17,0.12”Min:0;Max:1”]) |
| aux | Impact_on_built_up_space_2 = GRAPH(Energy_tarrif_ratio_2,0,0.1,[0.97,0.98,0.73,0.63,0.54,0.4,0.3,0.26,0.23,0.17,0.12”Min:0;Max:1”]) × Energy_tarrif_ratio_2 |
| aux | Impact_on_built_up_space_3 = GRAPH(Energy_tarrif_ratio_3,0,0.1,[0.97,0.98,0.73,0.63,0.54,0.4,0.3,0.26,0.23,0.17,0.12”Min:0;Max:1”]) × Energy_tarrif_ratio_3 |
| aux | Impact_on_knowldge_workers = GRAPH(Energy_tarrif_ratio,0,0.1,[0.03,0,0.05,0.1,0.17,0.25,0.34,0.45,0.59,0.77,1”Min:0;Max:1”]) × Energy_tarrif_ratio |
| aux | Impact_on_knowldge_workers_1 = GRAPH(Energy_tarrif_ratio_1,0,0.1,[0.03,0,0.05,0.1,0.17,0.25,0.34,0.45,0.59,0.77,1”Min:0;Max:1”]) × Energy_tarrif_ratio_1 |
| aux | Impact_on_knowldge_workers_2 = GRAPH(Energy_tarrif_ratio_2,0,0.1,[0.06,0.36,0.56,0.69,0.84,0.91,0.96,1,1,0.99,1”Min:0;Max:1”]) × Energy_tarrif_ratio_2 |
| aux | Impact_on_knowldge_workers_3 = GRAPH(Energy_tarrif_ratio_3,0,0.1,[0.06,0.36,0.56,0.69,0.84,0.91,0.96,1,1,0.99,1”Min:0;Max:1”]) × Energy_tarrif_ratio_3 |
| aux | Investment_from_IT_industry = Earning_from_IT_industry_Normal × Investment_from_IT_indutsry_fraction |
| aux | Investment_from_IT_industry_1 = Earning_from_IT_industry_Pessimistic × Investment_from_IT_indutsry_fraction_1 |
| aux | Investment_from_IT_industry_2 = Earning_from_IT_industry_Optimistic × Investment_from_IT_indutsry_fraction_2 |
| aux | Investment_from_IT_industry_3 = Earning_from_IT_industry_Percieved × Investment_from_IT_indutsry_fraction_3 |
| aux | Investment_in_buit_up_space = Investment_from_IT_industry × Investment_on_built_up_space |
| aux | Investment_in_buit_up_space_1 = Investment_from_IT_industry_1 × Investment_on_built_up_space_1 |
| aux | Investment_in_buit_up_space_2 = Investment_from_IT_industry_2 × Investment_on_built_up_space_2 |
| aux | Investment_in_buit_up_space_3 = Investment_from_IT_industry_3 × Investment_on_built_up_space_3 |
| aux | Invetsment_on_housing = Investment_from_IT_industry × Investment_fraction_on_housing |
| aux | Invetsment_on_housing_1 = Investment_from_IT_industry_1 × Investment_fraction_on_housing_1 |
| aux | Invetsment_on_housing_2 = Investment_from_IT_industry_2 × Investment_fraction_on_housing_2 |
| aux | Invetsment_on_housing_3 = Investment_from_IT_industry_3 × Investment_fraction_on_housing_3 |
| aux | Number_of_households = (Populatuion−Student_population)/Family_size |
| aux | Number_of_households_1 = (Populatuion_1−Student_population_1)/Family_size_1 |
| aux | Number_of_households_2 = (Populatuion_2−Student_population_2)/Family_size_2 |
| aux | Number_of_households_3 = (Populatuion_3−Student_population_3)/Family_size_3 |
| aux | Ratio_of_Built_up_space_supply_and_demand__Normal = Built_up_space_supply/Demand_for_Built_up_space |
| aux | Ratio_of_Built_up_space_supply_and_demand_Optimistic = Built_up_space_supply_2/Demand_for_Built_up_space_2 |
| aux | Ratio_of_Built_up_space_supply_and_demand_Percieved = Built_up_space_supply_3/Demand_for_Built_up_space_3 |
| aux | Ratio_of_Built_up_space_supply_and_demand_Pessimistic = Built_up_space_supply_1/Demand_for_Built_up_space_1 |
| aux | Ratio_of_demand_and_supply_of_speciic_quality_house_Optimistic = Supply_of_specific_quality_houses_2/Deamnd_for_specific_quality_houses_Optimistic |
| aux | Ratio_of_demand_and_supply_of_speciic_quality_house_Percieved = Supply_of_specific_quality_houses_3/Deamnd_for_specific_quality_houses_3 |
| aux | Ratio_of_supply_and_demand_of_spec9c_quality_house_for_Normal = Supply_of_specific_quality_houses/Demand_for_specific_quality_houses_for_IT_industry |
| aux | Ratio_supply_and_deamnd__specific_quality_house_Pessimistic = Supply_of_specific_quality_houses_1/Deamnd_for_specific_quality_houses_1 |
| aux | Student_houses = Student_population × Housing_demand_per_student |
| aux | Student_houses_1 = Student_population_1 × Housing_demand_per_student_1 |
| aux | Student_houses_2 = Student_population_2 × Housing_demand_per_student_2 |
| aux | Student_houses_3 = Student_population_3 × Housing_demand_per_student_3 |
| aux | Student_population = Populatuion × Student_population_fraction |
| aux | Student_population_1 = Populatuion_1 × Student_population_fraction_1 |
| aux | Student_population_2 = Populatuion_2 × Student_population_fraction_2 |
| aux | Student_population_3 = Populatuion_3 × Student_population_fraction_3 |
| aux | Supply_of_specific_quality_houses = Housing_supply × Supply_of_specific_quality_houses_fraction |
| aux | Supply_of_specific_quality_houses_1 = Housing_supply_1 × Supply_of_specific_quality_houses_fraction_1 |
| aux | Supply_of_specific_quality_houses_2 = Housing_supply_2 × Supply_of_specific_quality_houses_fraction_2 |
| aux | Supply_of_specific_quality_houses_3 = Housing_supply_3 × Supply_of_specific_quality_houses_fraction_3 |
| const | ARF = 0.015 |
| const | ARF_1 = 0.015 × 1.25 |
| const | ARF_2 = 0.015 |
| const | ARF_3 = 0.015 |
| const | ARF_4 = 0.015 |
| const | BDRF = 0.005 |
| const | BDRF_1 = 0.005 |
| const | BDRF_2 = 0.005 |
| const | BDRF_3 = 0.005 |
| const | BRF = 0.075 |
| const | BRF_1 = 0.075 |
| const | BRF_2 = 0.05 |
| const | BRF_3 = 0.06 |
| const | BSCFRF = 0.0005 |
| const | BSCFRF_1 = 0.0005 × 1.20 |
| const | BSCFRF_2 = 0.0005 × 0.5 |
| const | BSCFRF_3 = 0.0005 |
| const | BSCRF = 0.03 |
| const | BSCRF_1 = 0.03 × 0.5 |
| const | BSCRF_2 = 0.27 |
| const | BSCRF_3 = 0.20 |
| const | BSDRF = 0.0005 |
| const | BSDRF_1 = 0.0005 × 1.2 |
| const | BSDRF_2 = 0.0005 × 0.5 |
| const | BSDRF_3 = 0.0005 × 1.5 |
| const | BSRF = 0.0005 |
| const | BSRF_1 = 0.0005 |
| const | BSRF_2 = 0.25 |
| const | BSRF_3 = 0.20 |
| const | Current_tariff_rate = 1 |
| const | Current_tariff_rate_1 = 1 |
| const | Current_tariff_rate_2 = 1 |
| const | Current_tariff_rate_3 = 1 |
| const | Demand_fraction_for_specific_quality_houses = 0.056 |
| const | DEMAND_per_KWF = 10 |
| doc | DEMAND_per_KWF = SQM |
| const | DEMAND_per_KWF_1 = 10 |
| doc | DEMAND_per_KWF_1 = SQM |
| const | DEMAND_per_KWF_2 = 10 |
| doc | DEMAND_per_KWF_2 = SQM |
| const | DEMAND_per_KWF_3 = 10 |
| doc | DEMAND_per_KWF_3 = SQM |
| const | Demand_Specific_quality_housing_fraction_2 = 0.038 |
| const | Demand_Specific_quality_housing_fraction_3 = 0.05 |
| const | DRF = 0.02 |
| const | DRF_1 = 0.02 |
| const | DRF_2 = 0.02 |
| const | DRF_3 = 0.02 |
| const | Family_size = 2.3 |
| const | Family_size_1 = 2.3 |
| const | Family_size_2 = 2.5 |
| const | Family_size_3 = 2.5 |
| const | HCRF = 0.045 |
| const | HCRF_1 = 0.045 |
| const | HCRF_2 = 0.12 |
| const | HCRF_3 = 0.07 |
| const | HDGRF = 0.0056 |
| const | HDGRF_1 = 0.0056 |
| const | HDGRF_2 = 0.0056 |
| const | HDGRF_3 = 0.0056 |
| const | HDPRF = 0.0085 |
| const | HDPRF_1 = 0.0085 |
| const | HDPRF_2 = 0.0085 |
| const | HDPRF_3 = 0.0085 |
| const | Housing_demand_per_student = 0.5 |
| const | Housing_demand_per_student_1 = 0.5 |
| const | Housing_demand_per_student_2 = 0.5 |
| const | Housing_demand_per_student_3 = 0.5 |
| const | HRF = 0.01 |
| const | HRF_1 = 0.01 |
| const | HRF_2 = 0.1 |
| const | HRF_3 = 0.01 |
| const | IMRF = 0.005 |
| const | IMRF_1 = 0.005 |
| const | IMRF_2 = 0.01 |
| const | IMRF_3 = 0.0045 |
| const | Investment_fraction_on_housing = 0.4 |
| const | Investment_fraction_on_housing_1 = 0.4 |
| const | Investment_fraction_on_housing_2 = 0.4 |
| const | Investment_fraction_on_housing_3 = 0.4 |
| const | Investment_from_IT_indutsry_fraction = 0 |
| const | Investment_from_IT_indutsry_fraction_1 = 0 |
| const | Investment_from_IT_indutsry_fraction_2 = 0.3 |
| const | Investment_from_IT_indutsry_fraction_3 = 0.20 |
| const | Investment_on_built_up_space = 0.6 |
| const | Investment_on_built_up_space_1 = 0.6 |
| const | Investment_on_built_up_space_2 = 0.6 |
| const | Investment_on_built_up_space_3 = 0.6 |
| const | ITEGRF = 0.025 |
| const | ITEGRF_1 = 0.025 |
| const | ITEGRF_2 = 0.025 |
| const | ITEGRF_3 = 0.025 |
| const | ITEGRF_4 = 0.025 |
| const | KWGRF = 0.08 |
| const | KWGRF_1 = 0.065 |
| const | KWGRF_2 = 0.055 |
| const | KWGRF_3 = 0.05 |
| const | KWGRF_4 = 0.065 |
| const | OMRF_1 = 0.004 |
| const | OMRF_2 = 0.005 |
| const | OMRF_3 = 0.004 |
| const | ORF = 0.004 |
| const | Perspective_tariff_rate = 0.85 |
| const | Perspective_tariff_rate_1 = 1.0 |
| const | Perspective_tariff_rate_2 = 1.5 |
| const | Perspective_tariff_rate_3 = 1.3 |
| const | Rate_of_earning_per_knowledge_worker = 40 |
| const | Rate_of_earning_per_knowledge_worker_1 = 40 |
| const | Rate_of_earning_per_knowledge_worker_2 = 40 |
| const | Rate_of_earning_per_knowledge_worker_3 = 40 |
| const | Specific_quality_housing_fraction_1 = 0.056 |
| const | Student_population_fraction = 0.10 |
| const | Student_population_fraction_1 = 0.10 |
| const | Student_population_fraction_2 = 0.10 |
| const | Student_population_fraction_3 = 0.10 |
| const | Supply_of_specific_quality_houses_fraction = 0.05 |
| const | Supply_of_specific_quality_houses_fraction_1 = 0.05 × 0.75 |
| const | Supply_of_specific_quality_houses_fraction_2 = 0.043 |
| const | Supply_of_specific_quality_houses_fraction_3 = 0.045 |
Appendix B

Figure A1.
Structure (Stock flow diagram) of the model for IT industry development.
References
- Das, D.; Sonar, S.G. Perspective Impacts of Information Technology Industry in Development of Pune City in India. J. New Gener. Sci. 2013, 11, 1–17. [Google Scholar]
- De Wet, W.; Koekemoer, E.; Nel, J.A. Exploring the impact of information and communication technology on employees’ work and personal lives. SA J. Ind. Psychol. 2016, 42, 1–11. [Google Scholar] [CrossRef]
- Dickey, J. Urban Impacts of Information Technology, the Future of Urban Form; Nicolas Publishing Company: New York, NY, USA, 1985. [Google Scholar]
- Jae-pyo, H. Causal relationship between ICT R&D investment and economic growth in Korea. Technol. Forecast. Soc. Chang. 2017, 116, 70–75. [Google Scholar]
- Pradhan, R.P.; Arvin, M.B.; Norman, N.R.; Bele, S.K. Economic growth and the developmentof telecommunications infrastructure in the G-20 countries: A panel-VARapproach. Telecommun. Policy 2014, 38, 634–649. [Google Scholar] [CrossRef]
- Talvitie, J. Incorporating the Impact of ICT into Urban and Regional Planning European. J. Spat. Dev. 2004, 10, 2–32. [Google Scholar]
- Townsend, A. Smart Cities: Big Data, Civic Hackers, and the Quest for a New Utopia; W. W. Norton & Company: New York, NY, USA, 2013; ISBN 9780393349788. [Google Scholar]
- Das, D. Engendering image of creative cities by use of Information and Communication Technology in developing countries. Urban Plan. 2016, 1, 1–12. [Google Scholar] [CrossRef]
- Florida, R. The Rise of the Creative Class and How It’s Transforming Work, Leisure, Community, and Everyday Life; Basic Books: New York, NY, USA, 2002. [Google Scholar]
- Florida, R. Cities and the creative class. City Community 2003, 2, 3–19. [Google Scholar] [CrossRef]
- Florida, R. Cities and the Creative Class; Routledge: London, UK, 2005. [Google Scholar]
- Latifa, Z.; Mengkec, Y.; Danish, L.S.; Ximeia, L.; Pathana, Z.H.; Shafaq, S.; Jianqiu, Z. The dynamics of ICT, foreign direct investment, globalization and economic growth: Panel estimation robust to heterogeneity and cross-sectional dependence. Telemat. Inform. 2018, 35, 318–328. [Google Scholar] [CrossRef]
- Su, K.; Li, J.; Fu, H. Smart city and the applications. In Proceedings of the 2011 International Conference on Electronics, Communications and Control (ICECC), Ningbo, China, 9–11 September 2011; pp. 1028–1031. Available online: http://ieeexplore.ieee.org/stamp/stamp.jsp?tp=&arnumber=6066743 (accessed on 13 April 2016).
- Yigitcanlar, T.; Lee, S.H. Korean ubiquitous-eco-city: A smart-sustainable urban form or a branding hoax? Technol. Forecast. Soc. Chang. 2014, 89, 100–114. [Google Scholar] [CrossRef]
- Yigitcanlar, T. Technology and the City: Systems, Applications and Implications; Routledge: New York, NY, USA, 2016. [Google Scholar]
- Miller, E.J.; Hunt, J.D.; Abraham, J.E.; Salvini, P.A. Micro Simulating Urban Systems. Computer. Environ. Urban Syst. 2004, 28, 9–44. [Google Scholar] [CrossRef]
- Yigitcanlar, T.; Baum, S.; Horton, S. Attracting and retaining knowledge workers in knowledge cities. J. Knowl. Manag. 2007, 11, 6–17. [Google Scholar] [CrossRef]
- Yigitcanlar, T.; O’Connor, K.; Westerman, C. The making of knowledge cities: Melbourne’s knowledge-based urban development experience. Cities 2008, 25, 63–72. [Google Scholar] [CrossRef]
- Das, D. The Influence of urban infrastructure on the Information Communication Technology (ICT) industry: A case of an Indian City. In Proceedings of the 1st International Conference on Entrepreneurship Development (ICED) 2017, Bloemfontein, South Africa, 5–7 April 2017; pp. 227–234, ISBN 978-0-9946995-0-3. [Google Scholar]
- Abraham, G.V.; Mario, M. Evaluating Users’ Perceptions of the Digital Doorway: A Narrative Analysis. Inf. Technol. Dev. 2015, 21, 99–112. [Google Scholar] [CrossRef]
- De Silva, D.G.; McComb, R.P. Geographic concentration and high-tech firm survival. Reg. Sci. Urban Econ. 2012, 42, 691–701. [Google Scholar] [CrossRef]
- Francis, K.A.; Babajide, O.; Niki, K. KICT Capacity as the Investment and Use of ICT: Exploring its Antecedents in Africa. Inf. Technol. Dev. 2014, 20, 44–59. [Google Scholar] [CrossRef]
- Young, D.; Keil, R. Reconnecting the disconnected: The politics of infrastructure in the in-between city. Cities 2010, 27, 87–95. [Google Scholar] [CrossRef]
- Das, D. Developing enterprising cities in South Africa. Afr. J. Hosp. Tour. Leis. 2019, 8, 1–14. [Google Scholar]
- Envision a New Africa with This Enterprising Collective. Available online: https://city-press.news24.com/Trending/envision-a-new-africa-with-this-enterprising-collective-20190701 (accessed on 1 July 2019).
- Colecchia, A.; Schreyer, P. ICT Investment and economic growth in the 1990s: Is the United States a unique case? A comparative study of nine OECD countries. Rev. Econ. Dyn. 2002, 5, 408–442. [Google Scholar] [CrossRef]
- Datta, A.; Agarwal, S. Telecommunication and economic growth: A panel data approach. Appl. Econ. 2004, 36, 1649–1654. [Google Scholar] [CrossRef]
- Jalava, J.; Pohjola, M. The roles of electricity and ICT in economic growth: Case Finland. Explor. Econ. Hist. 2008, 45, 270–287. [Google Scholar] [CrossRef]
- James, L.; Lissy, M. Employee Retention Strategies: IT Industry. SCMS J. Indian Manag. 2012, 9, 79–88. [Google Scholar]
- Jorgenson, D. Information technology and the US economy. Am. Econ. Rev 2001, 91, 1–32. [Google Scholar] [CrossRef]
- Jorgenson, D. Information technology and the G7 economies. World Econ. 2005, 4, 139–169. [Google Scholar]
- Jorgenson, D.W.; Motohashi, K. Information technology and the Japanese economy. J. Jpn. Int. Econ. 2005, 19, 460–481. [Google Scholar] [CrossRef]
- Koutroumpis, P. The economic impact of broadband on growth: A simultaneous approach. Telecommun. Policy 2009, 33, 471–485. [Google Scholar] [CrossRef]
- Martínez, D.; Rodríguez, J.; Torres, J. ICT-specific technological change and productivity growth in the US: 1980–2004. Inf. Econ. Policy 2010, 22, 121–129. [Google Scholar] [CrossRef][Green Version]
- Oliner, S.; Sichel, D. The resurgence of growth in the late 1990s: In information technology the story? J. Econ. Perspect. 2000, 14, 3–22. [Google Scholar] [CrossRef]
- Plepys, A. The grey side of ICT. Environ. Impact Assess 2002, 22, 509–523. [Google Scholar] [CrossRef]
- Sassi, S.; Goaied, M. Financial development, ICT diffusion and economic growth: Lessons from MENA region. Telecommun. Policy 2013, 37, 252–261. [Google Scholar] [CrossRef]
- Vu, M.K. ICT as a source of economic Growth in the information Age: Empirical evidence from the 1996-2005 period. Telecommun. Policy 2011, 35, 357–372. [Google Scholar] [CrossRef]
- Vu, M.K. Information and communication technology (ICT) and Singapore’s economic growth. Inf. Econ. Policy 2013, 25, 284–300. [Google Scholar] [CrossRef]
- Asongu, S.A.; Le Roux, S. Enhancing ICT for inclusive human development in Sub-Saharan Africa. Technol. Forecast. Soc. Chang. 2017, 118, 44–54. [Google Scholar] [CrossRef]
- Kuada, J. Private Enterprise-Led Economic Development. In Sub-Saharan Africa, the Human Side of Growth; Kuada, J., Ed.; Palgrave Macmillan: New York, NY, USA, 2015. [Google Scholar]
- Tchamyou, V.S. The role of knowledge economy in African business. J. Knowl. Econ. 2017, 8, 1189–1228. [Google Scholar] [CrossRef]
- Lasi, H.; Fettke, P.; Kemper, H.G.; Feld, T.; Hoffmann, M. Industry 4.0. Bus. Inf. Syst. Eng. 2014, 6, 239–242. [Google Scholar] [CrossRef]
- Alkemade, F.; Surrs, R.A.A. Patterns of expectations for emerging sustainable technologies. Technol. Forecast. Soc. Chang. 2012, 79, 448–456. [Google Scholar] [CrossRef]
- Mishra, V.; Bisht, S.S. Mobile banking in a developing economy: A customer-centric model for policy formulation. Telecommun. Policy 2013, 37, 503–514. [Google Scholar] [CrossRef]
- Komninos, N.; Pallot, M.; Schaffers, H. Smart cities and the future internet in Europe. J. Knowl. Econ. 2013, 4, 119–134. [Google Scholar] [CrossRef]
- VanWinden, W.; van Den Berg, L.; Pol, P. European cities in the knowledge economy. Urban Stud. 2007, 44, 525–549. [Google Scholar] [CrossRef]
- Yigitcanlar, T.; Velibeyoglu, K.; Baum, S. Knowledge Based Urban Development: Planning and Applications in the Information Era; Yigitcanlar, T., Velibeyoglu, K., Baum, S., Eds.; IGI Global: Hershey, PA, USA, 2008. [Google Scholar]
- Navarro, J.L.A.; Ruiz, V.R.L.; Peña, D.N. The effect of ICT use and capability on knowledge-based cities. Cities 2017, 60, 272–280. [Google Scholar] [CrossRef]
- Poelhekke, S. Do Amenities and Diversity Encourage City Growth? A Link through Skilled Labor; Economics working papers ECO2006/10; San Domenico di Fiesole, European University Institute: Fiesole, Italy, 2006. [Google Scholar]
- Agarwal, R.; Ferratt, T.W. Enduring Practices for Managing IT Professionals. Commun. ACM 2002, 45, 73–79. [Google Scholar] [CrossRef]
- Upadhya, C. Employment, exclusion and ‘merit’ in the Indian IT industry. Econ. Political Wkly. 2007, 42, 1863–1868. [Google Scholar]
- Gaan, N.A. Revisit on Impact of Job Attitudes on Employee Turnover: An Empirical Study in Indian IT Industry. Vilakshan XIMB J. Manag. 2011, 8, 33–42. [Google Scholar]
- Achoui, M.; Mansour, M. Employee Turnover and Retention Strategies: Evidence from Saudi Companies. Int. Rev. Res. Pap. 2007, 33, 116. [Google Scholar]
- Arthur, D. The Employee Recruitment and Retention Handbook, 1st ed.; AMACOM/American Management Association: New York, NY, USA, 2001. [Google Scholar]
- Singh, P.; Loncar, N. Pay Satisfaction, Job Satisfaction and Turnover Intent. Département des Relations Industrielles. Université Laval 2010, 65, 470–490. [Google Scholar] [CrossRef]
- Güngör, H.; Katircioglu, S.; Mercan, M. Revisiting the nexus between financial development, FDI, and growth: New evidence from second generation econometric procedures in the Turkish context. Acta Oecon. 2014, 64, 73–89. [Google Scholar] [CrossRef]
- Rahaman, A.; Chakraborty, S. Effects of foreign direct investment on GDP: Empirical evidence from developing country. Adv. Econ. Bus. 2015, 3, 587–592. [Google Scholar]
- Feng, Z.; Dahui, L. Regional ICT access and entrepreneurship: Evidence from China. Inf. Manag. 2018, 55, 188–198. [Google Scholar] [CrossRef]
- Giudice, M.D.; Straub, D. IT and entrepreneurism: An on-again, off-again love affair or a marriage? MIS Q. 2011, 35, 3–7. [Google Scholar]
- Goolsbee, A.; Klenow, P.J. Evidence on learning and network externalities in the diffusion of home computers. J. Law Econ. 2002, 45, 317–343. [Google Scholar] [CrossRef]
- Asokan, P. Foreign direct investment in developing countries-a study with reference to the South Asian Countries. J. Int. Econ. 2014, 5, 65. [Google Scholar]
- Büthe, T.; Milner, H.V. Foreign direct investment and institutional diversity in trade agreements: Credibility, commitment, and economic flows in the developing world, 1971–2007. World Politics 2014, 66, 88–122. [Google Scholar] [CrossRef]
- Ergazakis, K.; Metaxiotis, K.; Psarras, J. Knowledge cities: The answer to the needs of knowledge-based development. J. Inf. Knowl. Manag. Syst. 2006, 36, 67–81. [Google Scholar] [CrossRef]
- Deakin, M.; Allwinkle, S. Urban regeneration and sustainable communities: The role of networks, innovation and creativity in building successful partnerships. J. Urban Technol. 2007, 14, 77–91. [Google Scholar] [CrossRef]
- Caragliu, A.; Del Bo, C.; Nijkamp, P. Smart cities in Europe. J. Urban Technol. 2011, 18, 65–82. [Google Scholar] [CrossRef]
- Giffinger, R.; Fertner, C.; Kramar, H.; Kalasek, R.; Pichler-Milanović, N.; Meijers, E. Smart Cities: Ranking of European Medium-Sized Cities; Vienna University of Technology: Wien, Austria, 2007; Available online: http://www.smart-cities.eu/ (accessed on 13 October 2017).
- Green IT: The New Industry Shock Wave. Available online: http://www.ictliteracy.info/rf.pdf/Gartner_on_Green_IT.pdf (accessed on 23 September 2019).
- Hollands, R.G. Will the real smart city please stand up? City Analysis of Urban Trends, Culture, Theory. Policy Action 2008, 12, 303–320. [Google Scholar]
- Kramers, A.; Höjer, M.; Lövehagen, N.; Wangel, J. Smart sustainable cities–Exploring ICT solutions for reduced energy use in cities. Environ. Model. Softw. 2014, 56, 52–62. [Google Scholar] [CrossRef]
- Pradhan, R.; Mallik, G.; Bagchi, T.P. Information communication technology (ICT) infrastructure and economic growth: A causality evinced by cross-country panel data. IIMB Manag. Rev. 2018, 30, 91–103. [Google Scholar] [CrossRef]
- Sonar, S.G. Planning for Information Technology Cities in India. Ph.D. Thesis, IIT Roorkee, Roorkee, India, 2007, unpublished. [Google Scholar]
- Yigitcanlar, T.; Velibeyoglu, K.; Baum, S. Creative Urban Regions: Harnessing Urban Technologies to Support Knowledge City Initiatives; The Making of Knowledge Cities: Melbourne’s Knowledge-Based Urban Development Experience; Yigitcanlar, T., Velibeyoglu, K., Baum, S., Eds.; IGI Global: Hershey, PA, USA, 2008. [Google Scholar]
- Statistics South Africa. Available online: http://www.statssa.gov.za/ (accessed on 11 July 2018).
- Saunders, M.; Lewis, P.; Thornhill, A. Research Methods for Business Students; Pearson Education Limited: Essex, UK, 2016; ISBN 978-1-292-01662-7. [Google Scholar]
- Cabrera, D.; Colosi, L.; Lobdell, C. Systems thinking. Eval. Progr. Plan 2008, 31, 299–310. [Google Scholar] [CrossRef]
- Forrester, J.W. Confidence in Models of Social Behaviour with Emphasis on Systems Dynamics Models; MIT System Dynamics Group: Cambridge, MA, USA, 1973. [Google Scholar]
- Forrester, J.W. Lessons from systems dynamics modelling. SystDyn Rev. 1987, 3, 136–149. [Google Scholar]
- Forrester, J.W. System dynamics and the lessons of 35 years. A system-based approach to policymaking. SystDyn Rev. 1991, 3, 1–35. [Google Scholar]
- Vennix, J.A.M. Group model-building: Tackling messy problems. Syst. Dyn. Rev. 1999, 15, 379–401. [Google Scholar] [CrossRef]
- Sterman, J.D. A Skeptic’s Guide to Computer Models; Barney, G.O., Kreutzer, W.B., Garett, M.J., Eds.; Westview Press: Boulder, CO, USA, 1991; pp. 209–229. [Google Scholar]
- Mutanga, S.S.; de Vries, M.; Mbohwa, C.; Das, D.K.; Rogner, H. An integrated approach for modelling the electricity value of a sugarcane production system. Appl. Energy 2016, 177, 823–838. [Google Scholar] [CrossRef][Green Version]
- Forrester, J.W. System dynamics, systems thinking, and soft OR. SystDyn Rev. 1994, 10, 1–14. [Google Scholar] [CrossRef]
- Kirkwood, C.W. System Dynamics Methods: A Quick Introduction. Available online: http://www.public.asu.edu/~kirkwood/sysdyn/SDIntro/SDIntro.htm (accessed on 16 October 2017).
- Amigun, B.; Musango, J.K.; Stafford, W. Biofuels and sustainability in Africa. Renew. Sustain. Energy Rev. 2011, 15, 1360–1372. [Google Scholar] [CrossRef]
- Coyle, R.G. System Dynamics Modelling: A Practical Approach; Chapman & Hall: London, UK, 1996. [Google Scholar]
- Forrester, J.W. Principles of Systems; Productivity Press: Cambridge, MA, USA, 1968. [Google Scholar]
- Sterman, J.D.; Forrester, J.W.; Graham, A.K.; Senge, P.M. An Integrated Approach to the Economic Long Wave. Available online: https://www.sciencedirect.com/science/article/abs/pii/0016328785900023#aep-article-footnote-id1 (accessed on 17 December 2015).
© 2019 by the author. Licensee MDPI, Basel, Switzerland. This article is an open access article distributed under the terms and conditions of the Creative Commons Attribution (CC BY) license (http://creativecommons.org/licenses/by/4.0/).