Exploring Perspectives of the Information Technology Industry in a South African City
Abstract
1. Introduction
2. Attributes Underpinning the Development of the IT Industry and IT City
3. Case Study City: Bloemfontein
4. Methodology
4.1. Input Data, Constraints, and Assumptions
4.2. Systems Applications and Systems Dynamics in Urban Development Modeling
5. Modeling
5.1. Factors Influencing IT Industry in the City
5.2. Conceptual Modeling: Use of Causal Loop Diagrams
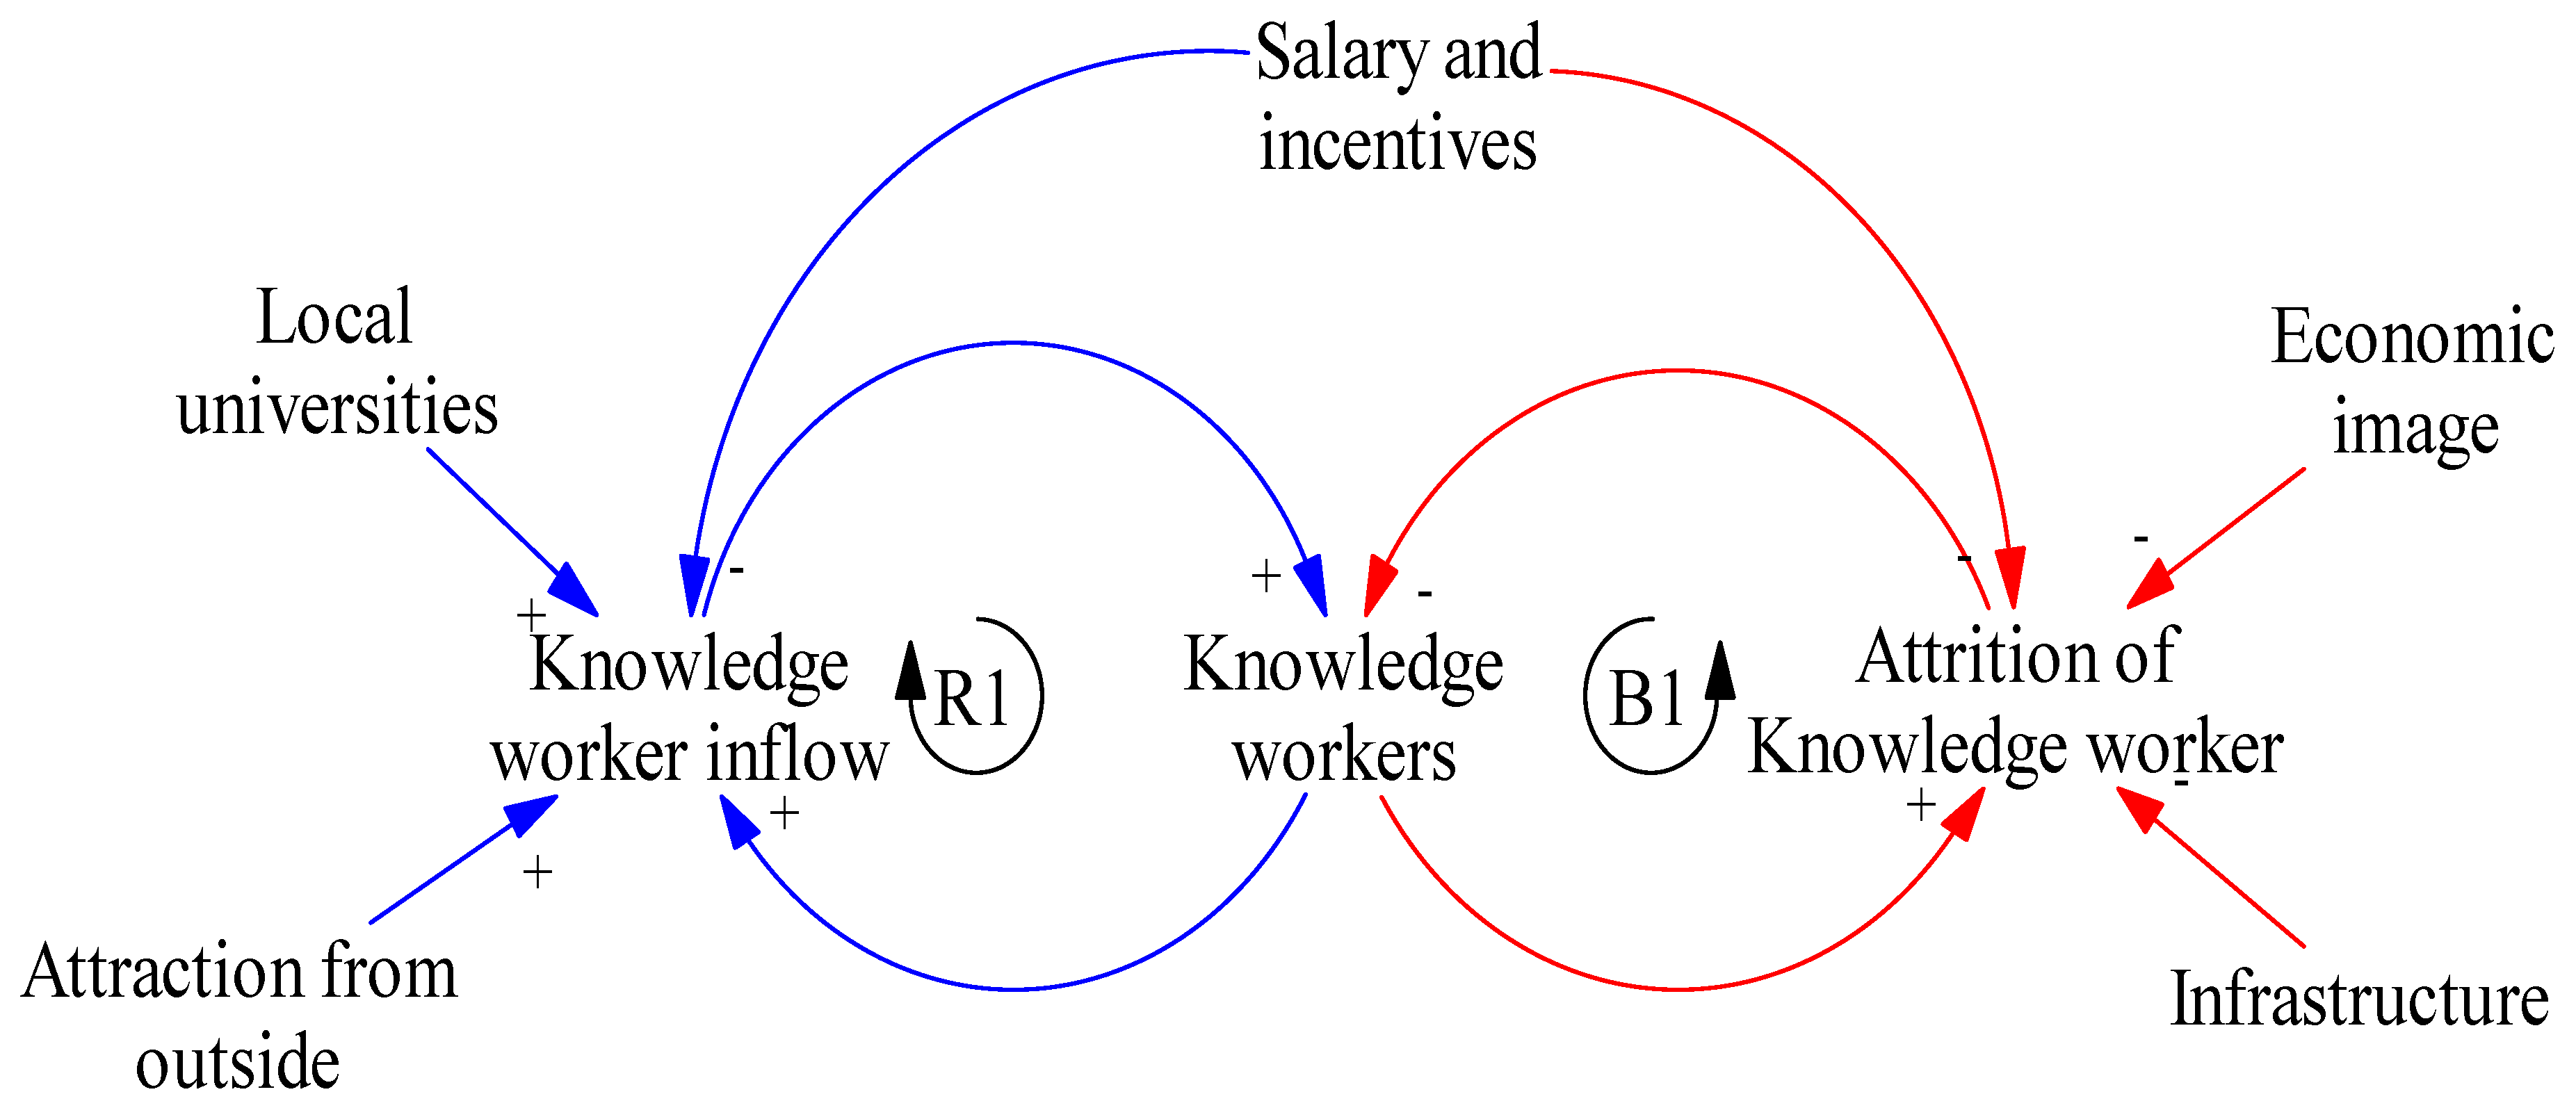
5.2.1. Human Resource (Knowledge Worker) Sub Model
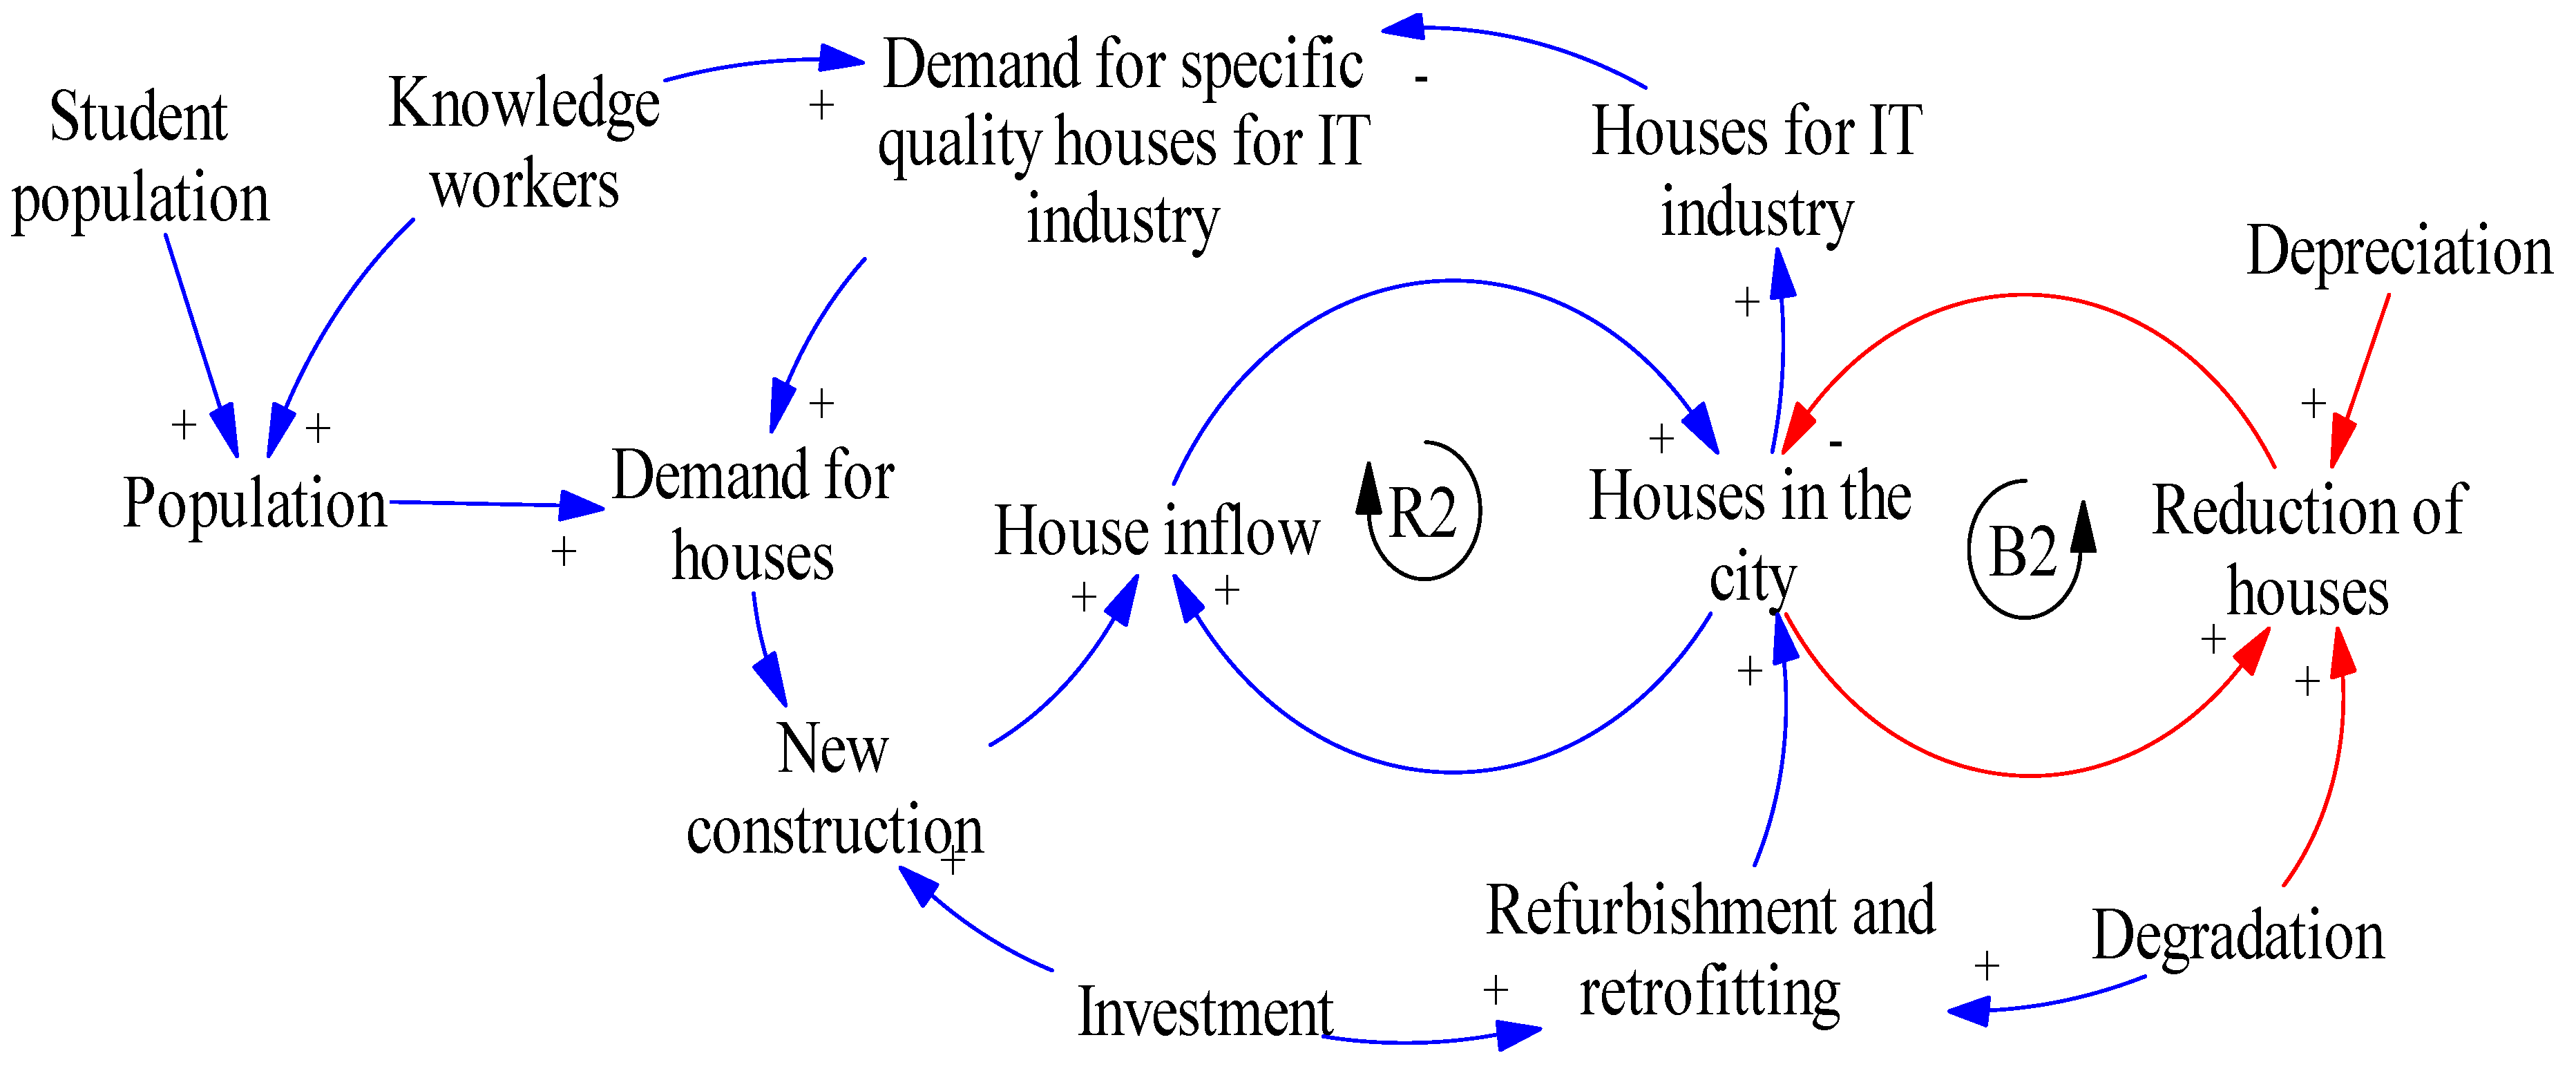
5.2.2. Housing Sub Model
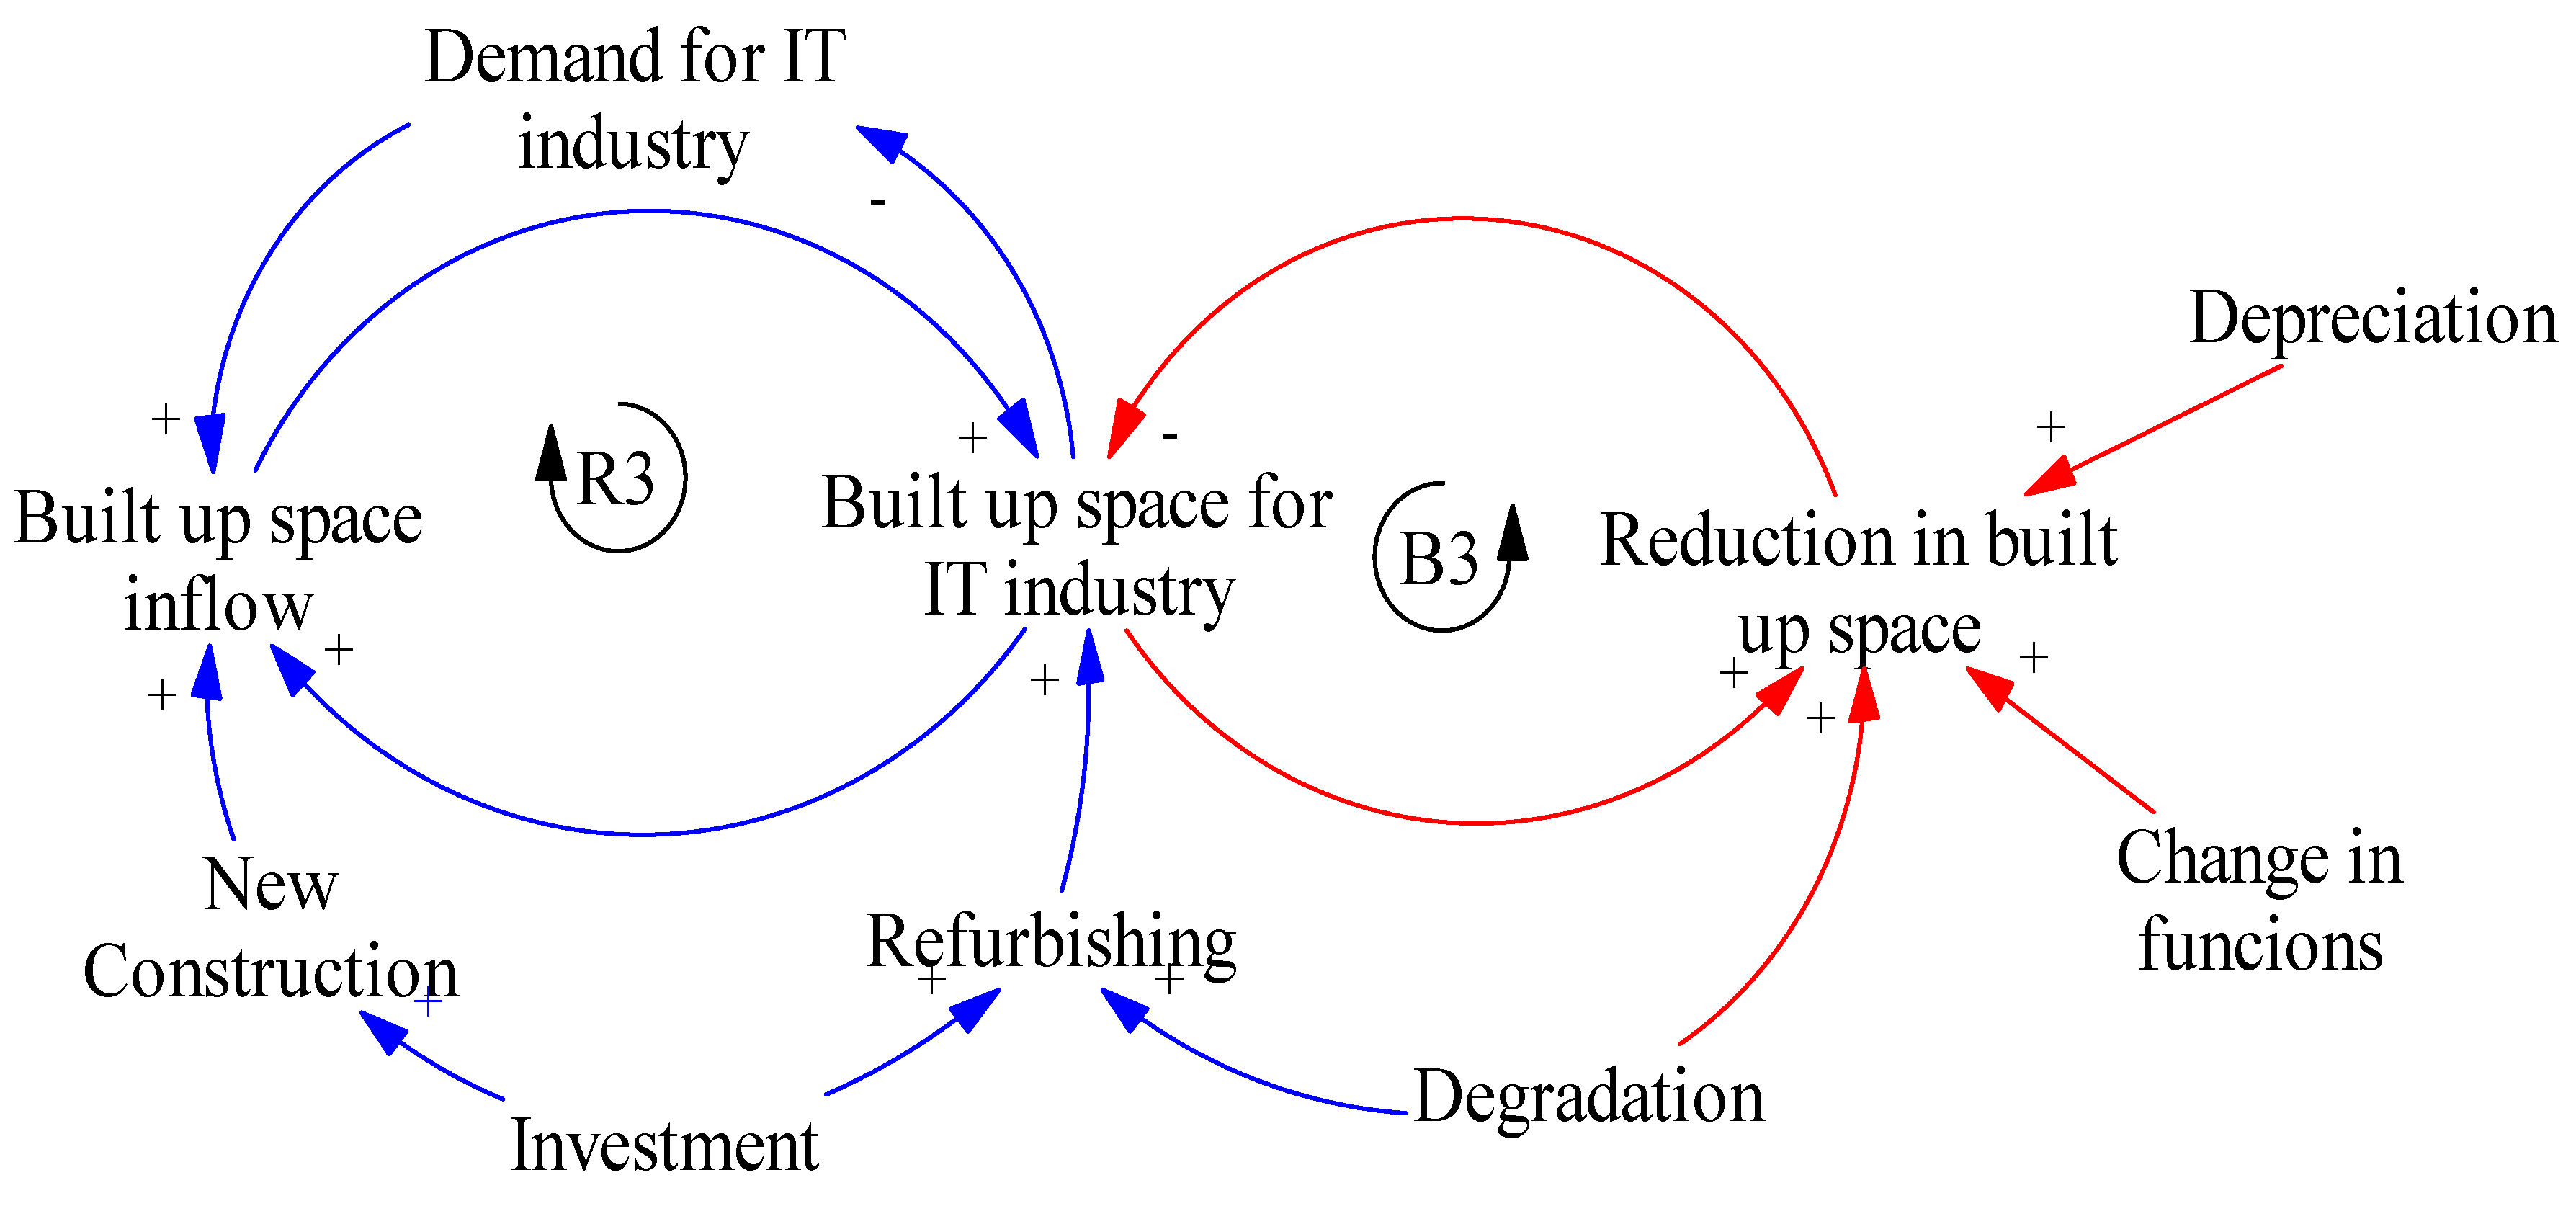
5.2.3. Built Up Space Sub Model
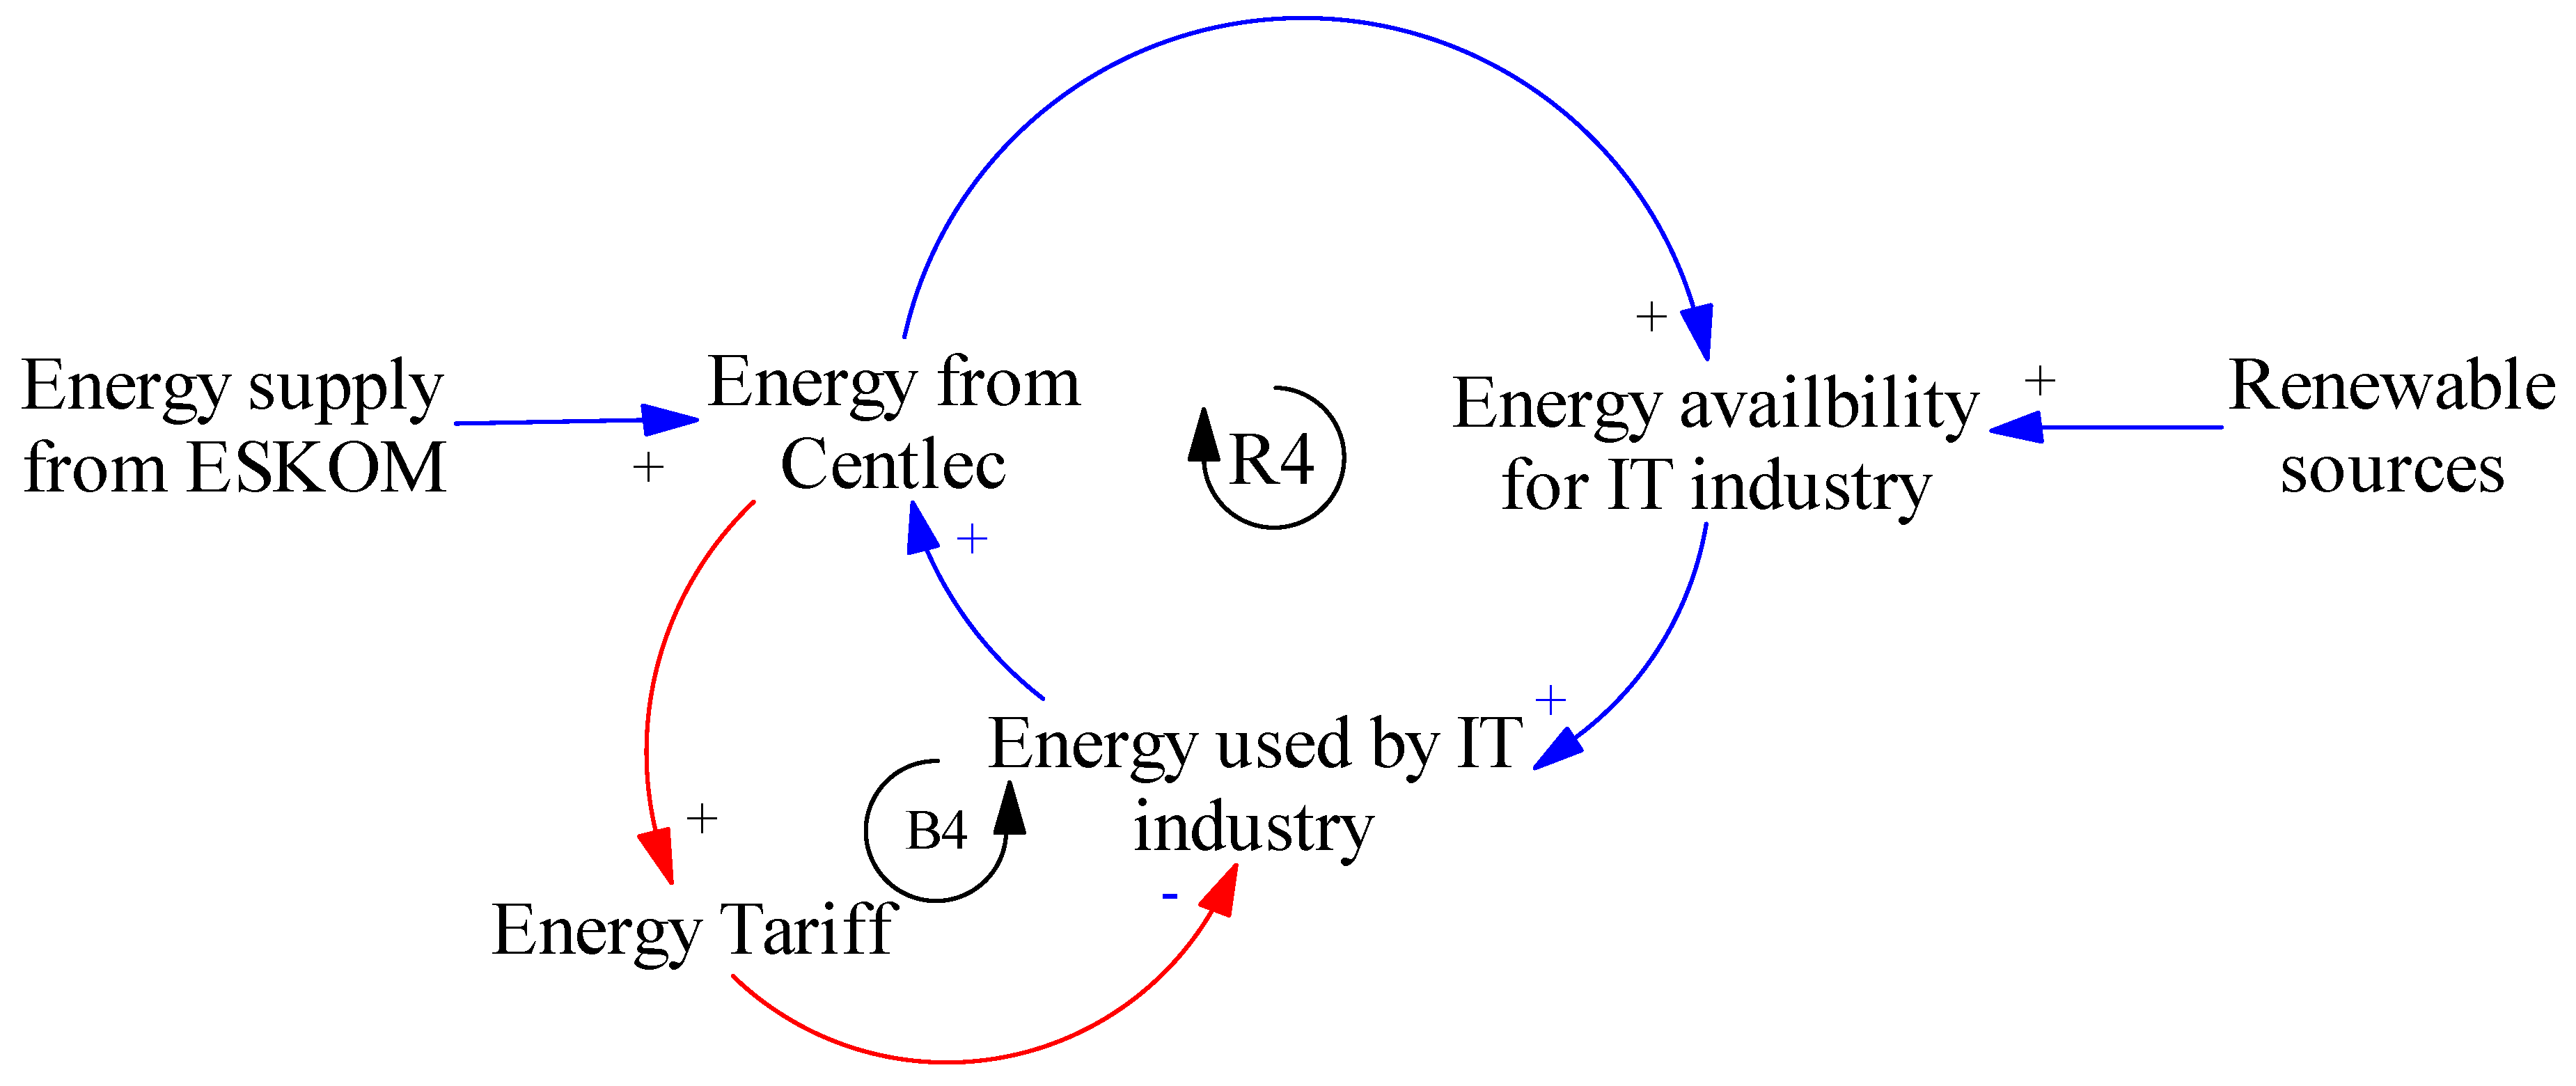
5.2.4. Energy Sub Model
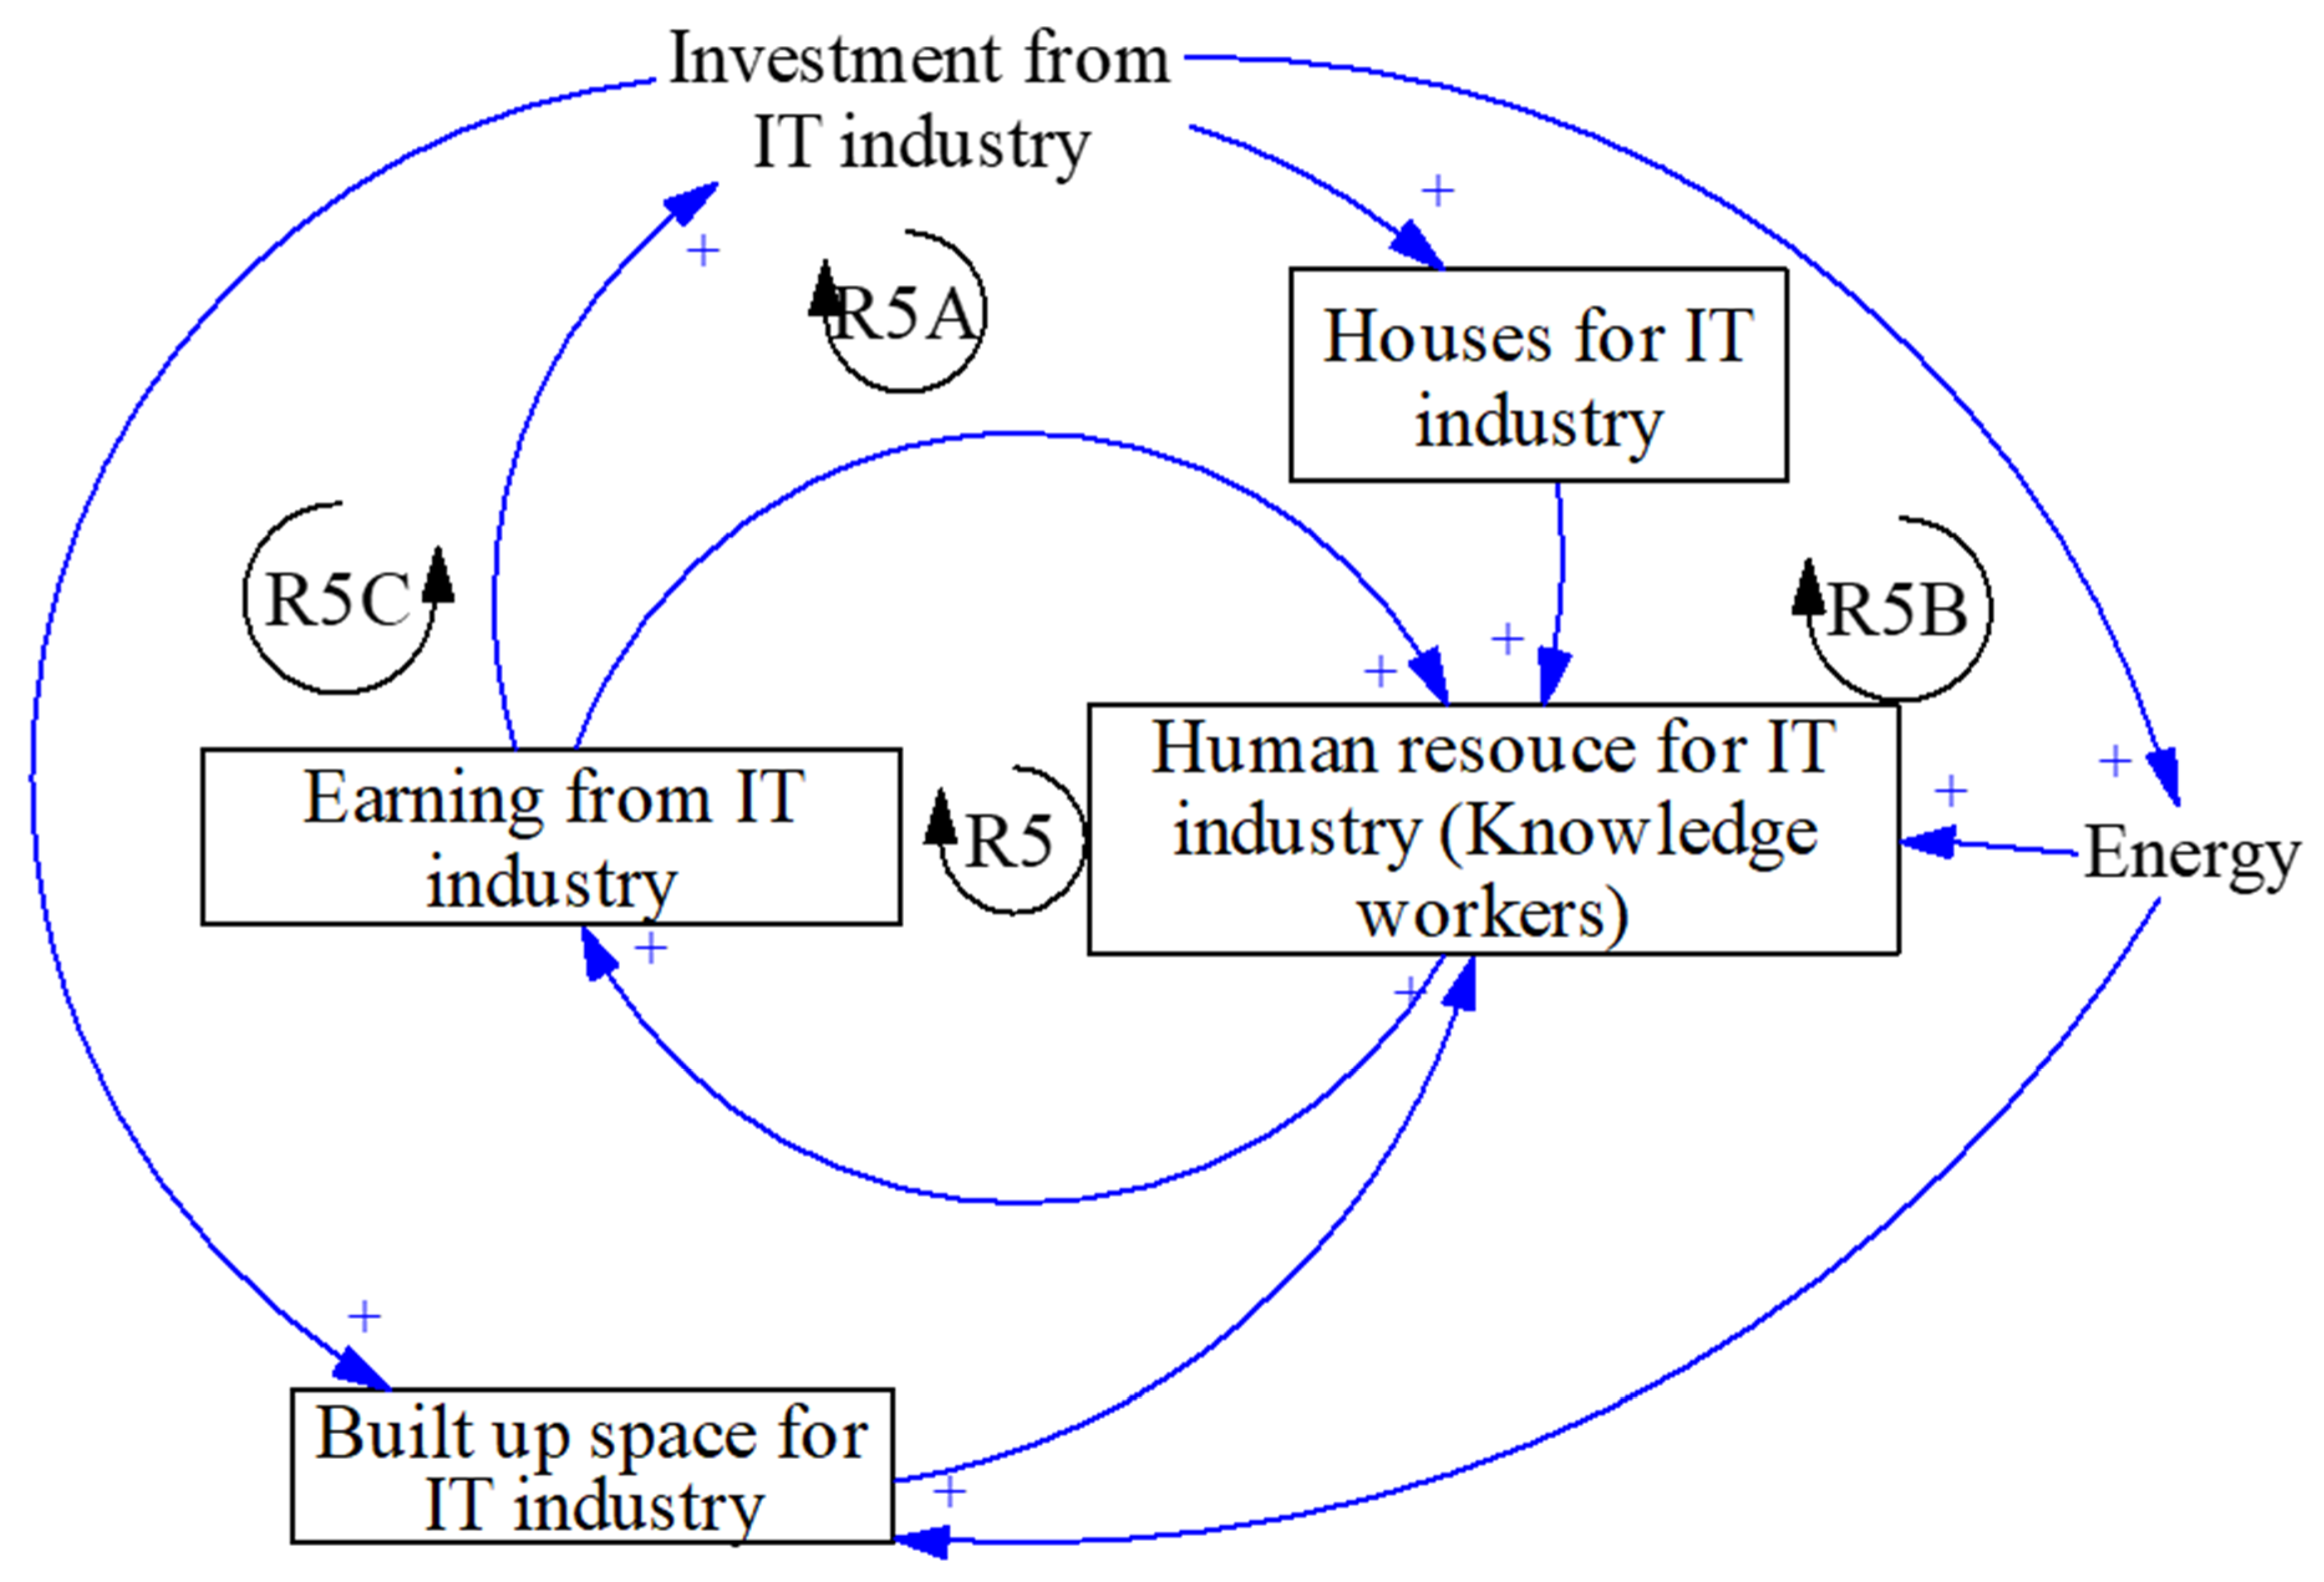
5.2.5. Influence of Parameters in Combination on the IT Industry: Integrated Model
5.3. Quantitative Model and Simulated Scenarios
6. Simulated Results and Discussion
6.1. Earnings from the IT Industry
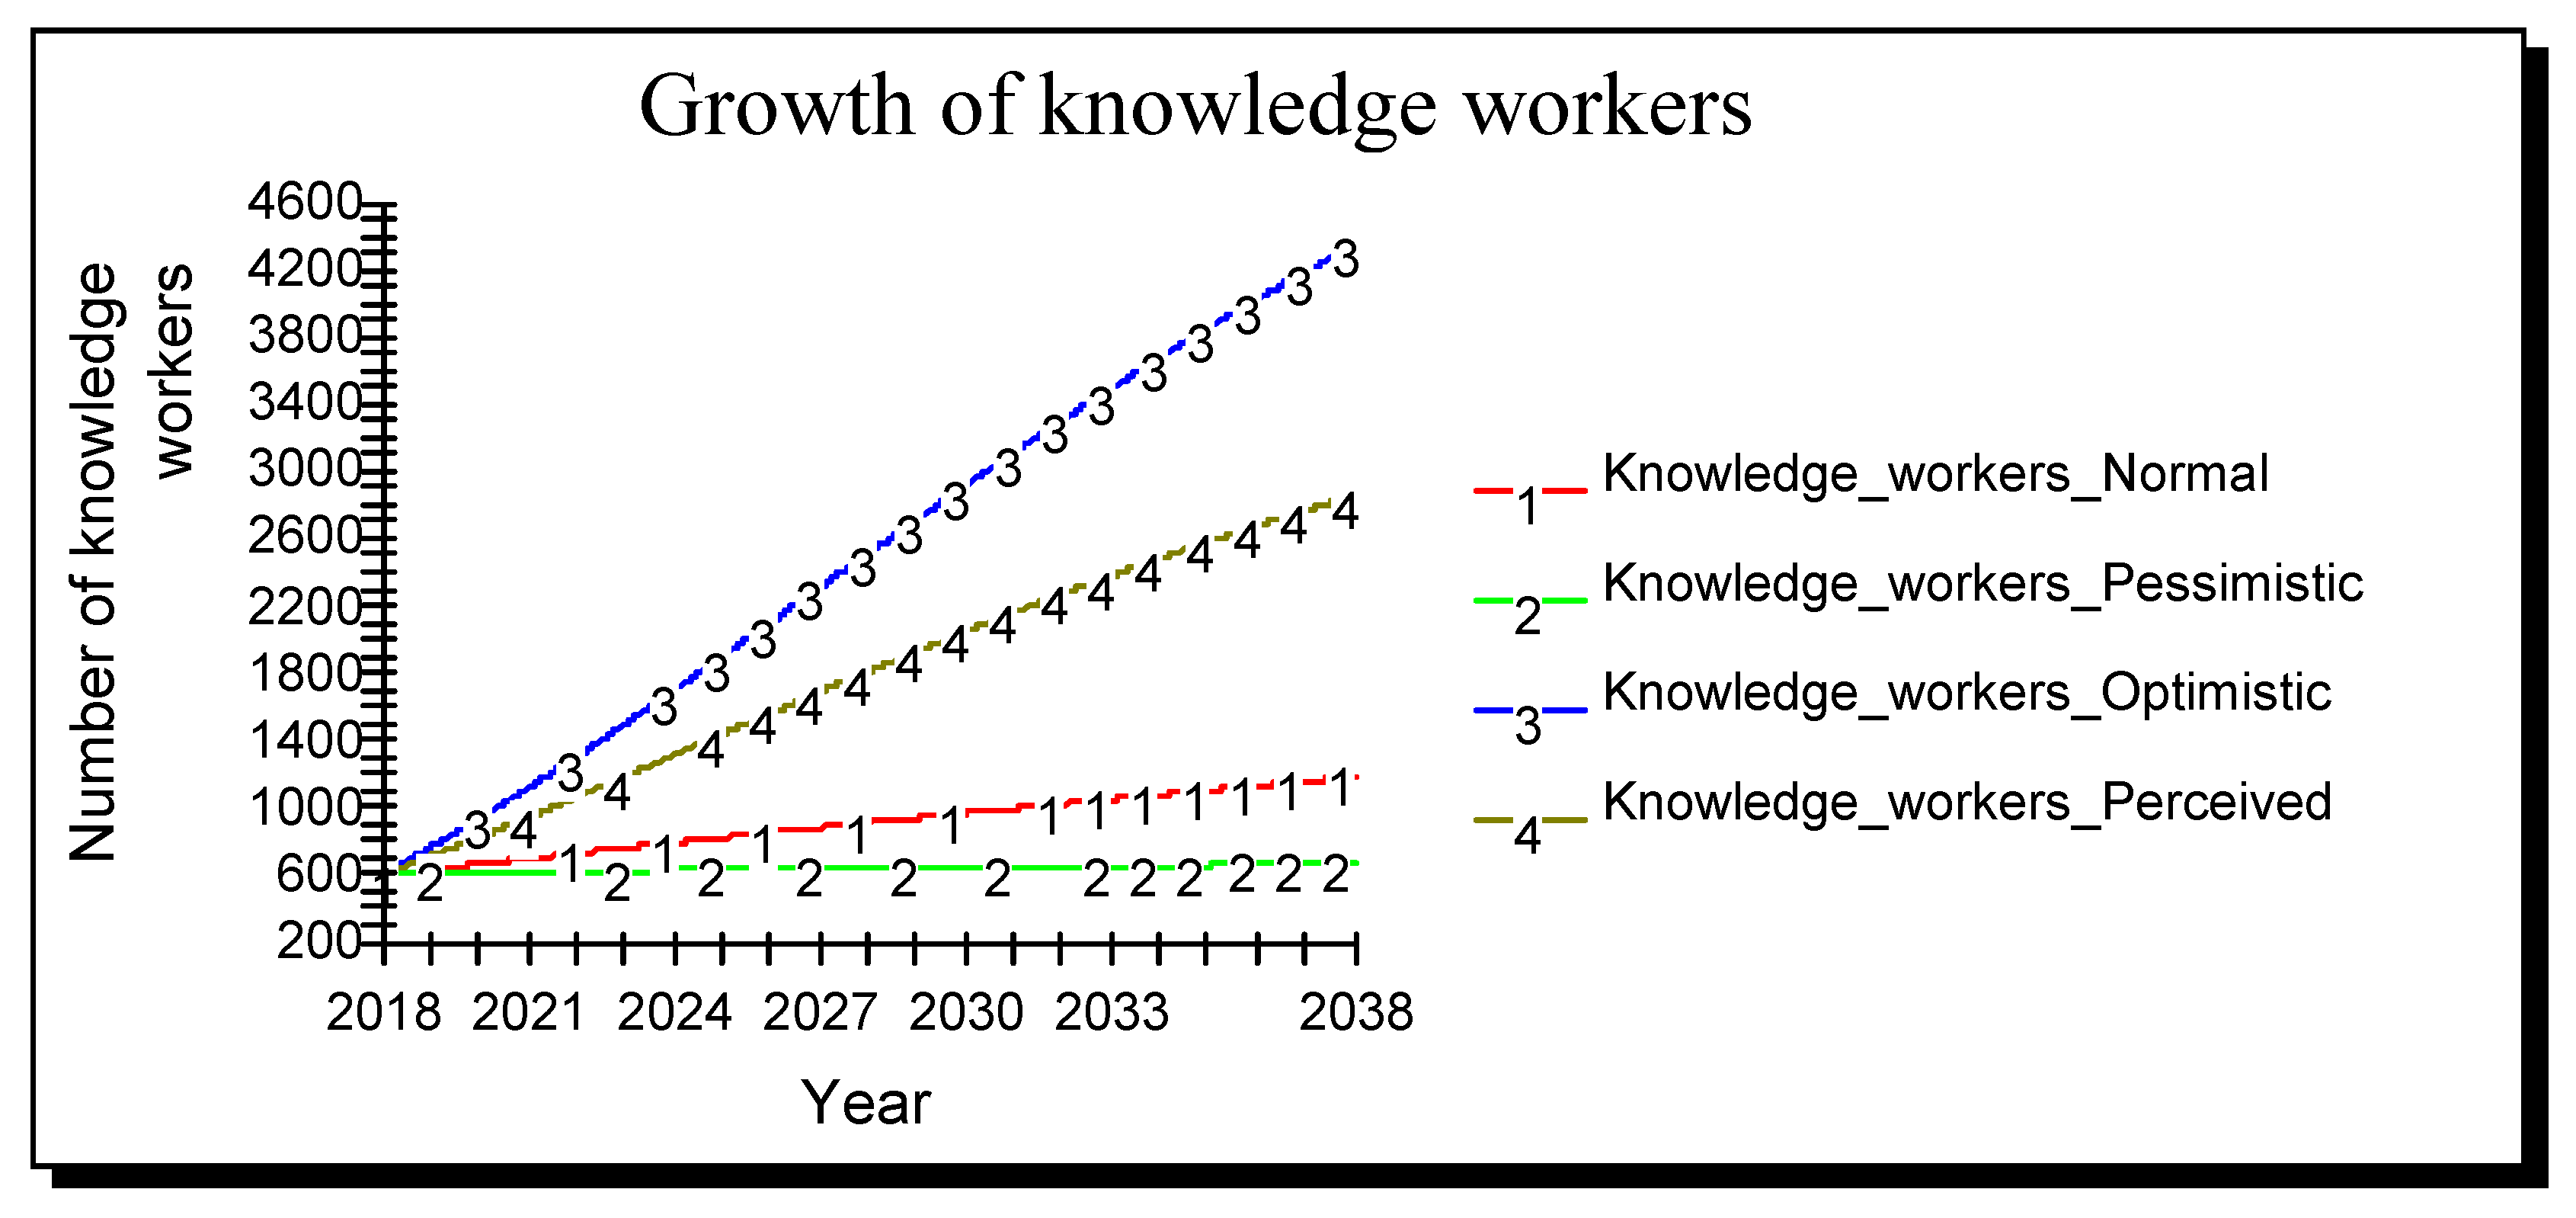
6.2. Growth of Knowledge Workers (Human Resource)
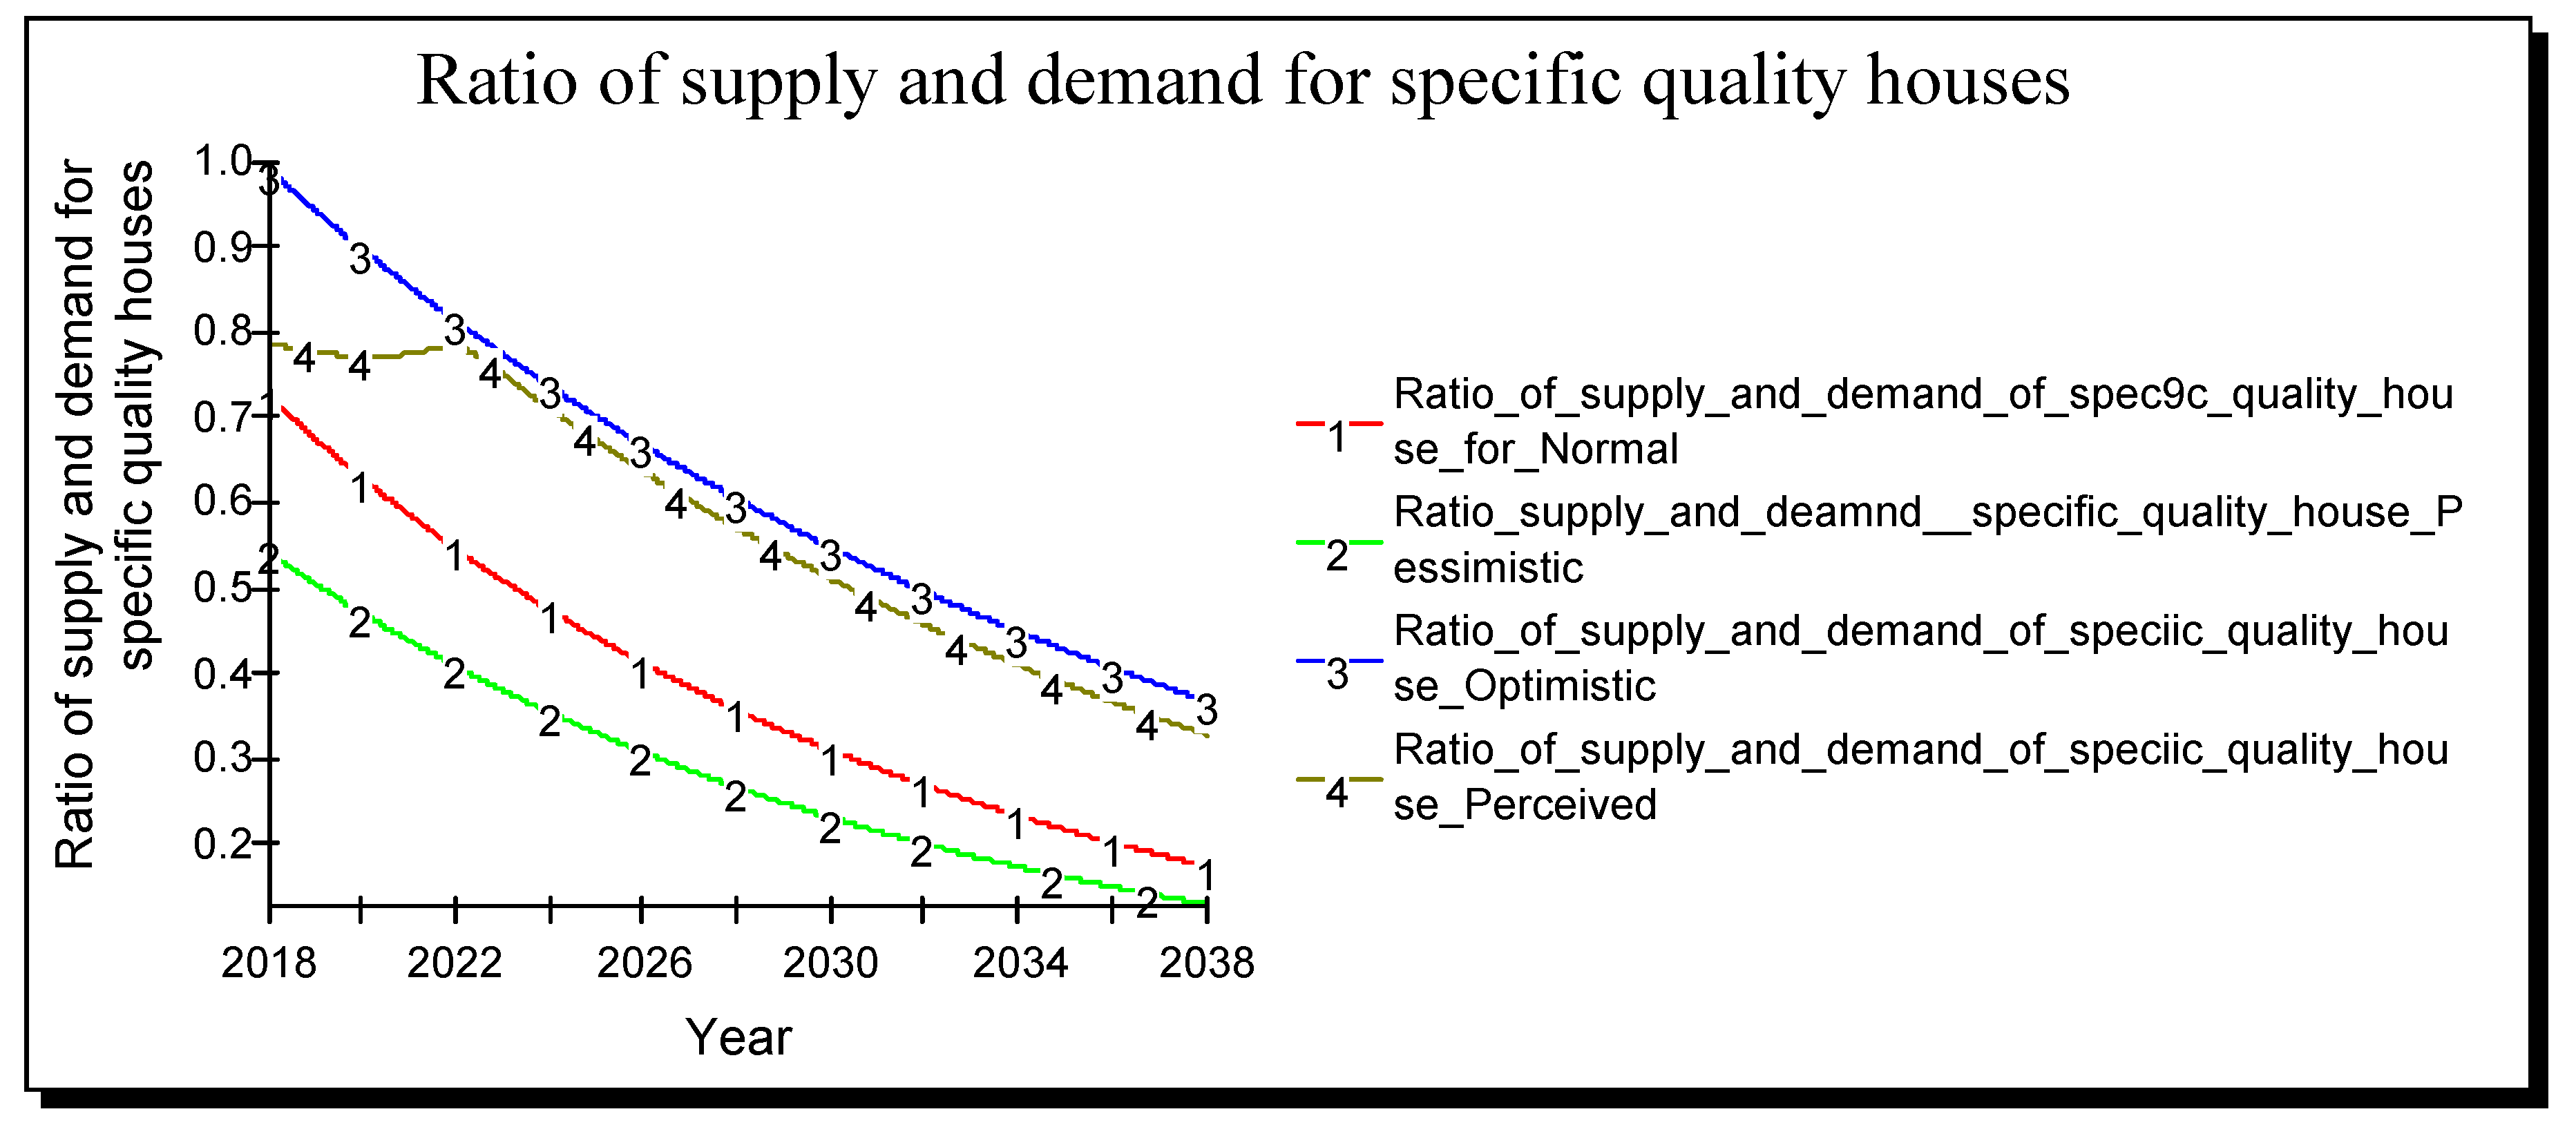
6.3. Growth in Infrastructure (Houses and Built up Space)
6.4. Discussion
7. Conclusions
Funding
Acknowledgments
Conflicts of Interest
Appendix A
| Model Algorithm | |
| init | Built_up_space_supply = 6250 |
| flow | Built_up_space_supply = −dt × Rate_19 |
| −dt × BSR_depreciarion_rate | |
| +dt × BS_Construction_rate | |
| doc | Built_up_space_supply = SQM |
| init | Built_up_space_supply_1 = 6250 |
| flow | Built_up_space_supply_1 = −dt × Built_up_space_reduction_rate |
| +dt × BS_Construction_rate_1 | |
| −dt × BSR_depreciarion_rate_1 | |
| doc | Built_up_space_supply_1 = SQM |
| init | Built_up_space_supply_2 = 6250 |
| flow | Built_up_space_supply_2 = −dt × BSR_depreciarion_rate_2 |
| +dt × BS_Construction_rate_2 | |
| −dt × Built_up_space_reduction_rate_1 | |
| doc | Built_up_space_supply_2 = SQM |
| init | Built_up_space_supply_3 = 6250 |
| flow | Built_up_space_supply_3 = −dt × Built_up_space_reduction_rate_2 |
| +dt × BS_Construction_rate_3 | |
| −dt × BSR_depreciarion_rate_3 | |
| doc | Built_up_space_supply_3 = SQM |
| init | Earning_from_IT_industry_4 = 9.125 |
| flow | Earning_from_IT_industry_4 = +dt × IT_earnign_growth_rate_4 |
| doc | Earning_from_IT_industry_4 = millionUSD |
| init | Earning_from_IT_industry_Normal = 9.125 |
| flow | Earning_from_IT_industry_Normal = +dt × IT_earnign_growth_rate |
| doc | Earning_from_IT_industry_Normal = millionUSD |
| init | Earning_from_IT_industry_Optimistic = 9.125 |
| flow | Earning_from_IT_industry_Optimistic = +dt × IT_earnign_growth_rate_2 |
| doc | Earning_from_IT_industry_Optimistic = millionUSD |
| init | Earning_from_IT_industry_Percieved = 9.125 |
| flow | Earning_from_IT_industry_Percieved = +dt × IT_earnign_growth_rate_3 |
| doc | Earning_from_IT_industry_Percieved = millionUSD |
| init | Earning_from_IT_industry_Pessimistic = 9.125 |
| flow | Earning_from_IT_industry_Pessimistic = +dt × IT_earnign_growth_rate_1 |
| doc | Earning_from_IT_industry_Pessimistic = millionUSD |
| init | Housing_supply = 167000 |
| flow | Housing_supply = −dt × Degradation_rate |
| −dt × Depreciation_rate | |
| +dt × H_Cnstruction_rate | |
| init | Housing_supply_1 = 167000 |
| flow | Housing_supply_1 = −dt × Depreciation_rate_1 |
| +dt × H_Construction_rate_1 | |
| −dt × Degradation_rate_1 | |
| init | Housing_supply_2 = 167000 |
| flow | Housing_supply_2 = −dt × Degradation_rate_2 |
| +dt × H_Cnstruction_rate_2 | |
| −dt × Depreciation_rate_2 | |
| init | Housing_supply_3 = 167000 |
| flow | Housing_supply_3 = +dt × H_Cnstruction_rate_3 |
| −dt × Degradation_rate_3 | |
| −dt × Depreciation_rate_3 | |
| init | Knowldge_workers_Normal = 625 |
| flow | Knowldge_workers_Normal = −dt × Attrition_rate |
| +dt × Knowledge_worker_growth_rate | |
| init | Knowldge_workers_Optimistic = 625 |
| flow | Knowldge_workers_Optimistic = +dt × Knowledge_worker_growth_rate_2 |
| −dt × Attrition_rate_2 | |
| init | Knowldge_workers_Percieved = 625 |
| flow | Knowldge_workers_Percieved = −dt × Attrition_rate_3 |
| +dt × Knowledge_worker_growth_rate_3 | |
| init | Knowldge_workers_Pessimistic = 625 |
| flow | Knowldge_workers_Pessimistic = −dt × Attrition_rate_1 |
| +dt × Knowledge_worker_growth_rate_1 | |
| init | Knowledge_workers_4l = 625 |
| flow | Knowledge_workers_4l = −dt × Attrition_rate_4 |
| +dt × Knowledge_worker_growth_rate_4 | |
| init | Populatuion = 463064 |
| flow | Populatuion = −dt × OMR |
| +dt × IMR | |
| −dt × DR | |
| +dt × BR | |
| init | Populatuion_1 = 463064 |
| flow | Populatuion_1 = +dt × BR_1 |
| −dt × OMR_1 | |
| +dt × IMR_1 | |
| −dt × DR_1 | |
| init | Populatuion_2 = 463064 |
| flow | Populatuion_2 = −dt × DR_2 |
| +dt × IMR_2 | |
| +dt × BR_2 | |
| −dt × OMR_2 | |
| init | Populatuion_3 = 463064 |
| flow | Populatuion_3 = −dt × OMR_3 |
| +dt × BR_3 | |
| +dt × IMR_3 | |
| −dt × DR_3 | |
| aux | Attrition_rate = Knowldge_workers_Normal × ARF |
| aux | Attrition_rate_1 = Knowldge_workers_Pessimistic × ARF_1 |
| aux | Attrition_rate_2 = Knowldge_workers_Optimistic × ARF_2 |
| aux | Attrition_rate_3 = Knowldge_workers_Percieved × ARF_3 |
| aux | Attrition_rate_4 = Knowledge_workers_4l × ARF_4 |
| aux | BR = Populatuion × BRF |
| aux | BR_1 = Populatuion_1 × BRF_1 |
| aux | BR_2 = Populatuion_2 × BRF_2 |
| aux | BR_3 = Populatuion_3 × BRF_3 |
| aux | BS_Construction_rate = Built_up_space_supply × (BSCRF + BSRF) × Impact_on_built_up_space |
| aux | BS_Construction_rate_1 = Built_up_space_supply_1 × (BSCRF_1 + BSRF_1) × Impact_on_built_up_space_1 |
| aux | BS_Construction_rate_2 = Built_up_space_supply_2 × (BSCRF_2 + BSRF_2) × Impact_on_built_up_space_2 |
| aux | BS_Construction_rate_3 = Built_up_space_supply_3 × (BSCRF_3 + BSRF_3) × Impact_on_built_up_space_3 |
| aux | BSR_depreciarion_rate = Built_up_space_supply × BDRF |
| aux | BSR_depreciarion_rate_1 = Built_up_space_supply_1 × BDRF_1 |
| aux | BSR_depreciarion_rate_2 = Built_up_space_supply_2 × BDRF_2 |
| aux | BSR_depreciarion_rate_3 = Built_up_space_supply_3 × BDRF_3 |
| aux | Built_up_space_reduction_rate = Built_up_space_supply_1 × (BSCFRF_1 + BSDRF_1) |
| aux | Built_up_space_reduction_rate_1 = Built_up_space_supply_2 × (BSCFRF_2 + BSDRF_2) |
| aux | Built_up_space_reduction_rate_2 = Built_up_space_supply_3 × (BSCFRF_3 + BSDRF_3) |
| aux | Degradation_rate = Housing_supply × HDGRF |
| aux | Degradation_rate_1 = Housing_supply_1 × HDGRF_1 |
| aux | Degradation_rate_2 = Housing_supply_2 × HDGRF_2 |
| aux | Degradation_rate_3 = Housing_supply_3 × HDGRF_3 |
| aux | Depreciation_rate = Housing_supply × HDPRF |
| aux | Depreciation_rate_1 = Housing_supply_1 × HDPRF_1 |
| aux | Depreciation_rate_2 = Housing_supply_2 × HDPRF_2 |
| aux | Depreciation_rate_3 = Housing_supply_3 × HDPRF_3 |
| aux | DR = Populatuion × DRF |
| aux | DR_1 = Populatuion_1 × DRF_1 |
| aux | DR_2 = Populatuion_2 × DRF_2 |
| aux | DR_3 = Populatuion_3 × DRF_3 |
| aux | H_Cnstruction_rate = Housing_supply × (HCRF + HRF) × Impact_of_investment_on_houisng_supply |
| aux | H_Cnstruction_rate_2 = Housing_supply_2 × (HCRF_2 + HRF_2) × Impact_of_investment_on_houisng_supply_2 |
| aux | H_Cnstruction_rate_3 = Housing_supply_3 × (HCRF_3 + HRF_3) × Impact_of_investment_on_houisng_supply_3 |
| aux | H_Construction_rate_1 = Housing_supply_1 × (HCRF_1 + HRF_1) × Impact_of_investment_on_houisng_supply_1 |
| aux | IMR = Populatuion × IMRF |
| aux | IMR_1 = Populatuion_1 × IMRF_1 |
| aux | IMR_2 = Populatuion_2 × IMRF_2 |
| aux | IMR_3 = Populatuion_3 × IMRF_3 |
| aux | IT_earnign_growth_rate = Earning_from_IT_industry_Normal × ((ITEGRF + Earning_from_knowldge_workers × 0.20/Earning_from_IT_industry_Normal)) |
| aux | IT_earnign_growth_rate_1 = Earning_from_IT_industry_Pessimistic × (ITEGRF_1 + Earning_from_knowldge_workers_1 × 0.20/Earning_from_IT_industry_Pessimistic) |
| aux | IT_earnign_growth_rate_2 = (Earning_from_IT_industry_Optimistic × (ITEGRF_2 + Earning_from_knowldge_workers_2 × 0.20/Earning_from_IT_industry_Optimistic)) |
| aux | IT_earnign_growth_rate_3 = (Earning_from_IT_industry_Percieved × (ITEGRF_3 + Earning_from_knowldge_workers_3 × 0.20/Earning_from_IT_industry_Percieved)) |
| aux | IT_earnign_growth_rate_4 = Earning_from_IT_industry_4 × ITEGRF_4 |
| aux | Knowledge_worker_growth_rate = Knowldge_workers_Normal × KWGRF × (Ratio_of_Built_up_space_supply_and_demand__Normal + Ratio_of_supply_and_demand_of_spec9c_quality_house_for_Normal) × Impact_on_knowldge_workers |
| aux | Knowledge_worker_growth_rate_1 = Knowldge_workers_Pessimistic × KWGRF_1 × (Ratio_of_Built_up_space_supply_and_demand_Pessimistic + Ratio_supply_and_deamnd__specific_quality_house_Pessimistic) × Impact_on_knowldge_workers_1 |
| aux | Knowledge_worker_growth_rate_2 = Knowldge_workers_Optimistic × KWGRF_2 × (Impact_of_built_up_spoace_on_knowledge_workers + Ratio_of_demand_and_supply_of_speciic_quality_house_Optimistic) × Impact_on_knowldge_workers_2 |
| aux | Knowledge_worker_growth_rate_3 = Knowldge_workers_Percieved × KWGRF_3 × (Impact_of_built_up_spoace_on_knowledge_workers_1 + Ratio_of_demand_and_supply_of_speciic_quality_house_Percieved) × Impact_on_knowldge_workers_3 |
| aux | Knowledge_worker_growth_rate_4 = Knowledge_workers_4l × KWGRF_4 |
| aux | OMR = Populatuion × ORF |
| aux | OMR_1 = Populatuion_1 × OMRF_1 |
| aux | OMR_2 = Populatuion_2 × OMRF_2 |
| aux | OMR_3 = Populatuion_3 × OMRF_3 |
| aux | Rate_19 = Built_up_space_supply × (BSCFRF + BSDRF) |
| aux | Deamnd_for_specific_quality_houses_1 = Demand_of_houses_1 × Specific_quality_housing_fraction_1 |
| aux | Deamnd_for_specific_quality_houses_3 = Demand_of_houses_3 × Demand_Specific_quality_housing_fraction_3 |
| aux | Deamnd_for_specific_quality_houses_Optimistic = Demand_of_houses_2 × Demand_Specific_quality_housing_fraction_2 |
| aux | Demand_for_Built_up_space = Knowldge_workers_Normal × DEMAND_per_KWF |
| aux | Demand_for_Built_up_space_1 = Knowldge_workers_Pessimistic × DEMAND_per_KWF_1 |
| aux | Demand_for_Built_up_space_2 = Knowldge_workers_Optimistic × DEMAND_per_KWF_2 |
| aux | Demand_for_Built_up_space_3 = Knowldge_workers_Percieved × DEMAND_per_KWF_3 |
| aux | Demand_for_specific_quality_houses_for_IT_industry = Demand_of_houses × Demand_fraction_for_specific_quality_houses |
| aux | Demand_of_houses = Number_of_households + Student_houses |
| aux | Demand_of_houses_1 = Number_of_households_1 + Student_houses_1 |
| aux | Demand_of_houses_2 = Number_of_households_2 + Student_houses_2 |
| aux | Demand_of_houses_3 = Number_of_households_3 + Student_houses_3 |
| aux | Earning_from_knowldge_workers = ((Knowldge_workers_Normal−625) × (Rate_of_earning_per_knowledge_worker × 365))/1000000 |
| aux | Earning_from_knowldge_workers_1 = ((Knowldge_workers_Pessimistic−625) × (Rate_of_earning_per_knowledge_worker_1 × 365))/1000000 |
| aux | Earning_from_knowldge_workers_2 = ((Knowldge_workers_Optimistic−625) × (Rate_of_earning_per_knowledge_worker_2 × 365))/1000000 |
| aux | Earning_from_knowldge_workers_3 = ((Knowldge_workers_Percieved−625) × (Rate_of_earning_per_knowledge_worker_3 × 365))/1000000 |
| aux | Energy_tarrif_ratio = Perspective_tariff_rate/Current_tariff_rate |
| aux | Energy_tarrif_ratio_1 = Perspective_tariff_rate_1/Current_tariff_rate_1 |
| aux | Energy_tarrif_ratio_2 = Perspective_tariff_rate_2/Current_tariff_rate_2 |
| aux | Energy_tarrif_ratio_3 = Perspective_tariff_rate_3/Current_tariff_rate_3 |
| aux | Gap_in_built_up_space__pessimistic = (Demand_for_Built_up_space_1−Built_up_space_supply_1) |
| aux | Gap_in_built_up_space_demand_and_supply_Normal = (Demand_for_Built_up_space-Built_up_space_supply) |
| aux | Gap_in_built_up_space_oprimistic = (Demand_for_Built_up_space_2−Built_up_space_supply_2) |
| aux | Gap_of_built_up_space_percieved = (Demand_for_Built_up_space_3−Built_up_space_supply_3) |
| aux | Impact_of_built_up_spoace_on_knowledge_workers = GRAPH(TIME,0,0.1,[0.02,0,0.04,0.05,0.13,0.27,0.35,0.44,0.64,0.76,1”Min:0;Max:1”]) × Ratio_of_Built_up_space_supply_and_demand_Optimistic |
| aux | Impact_of_built_up_spoace_on_knowledge_workers_1 = GRAPH(TIME,0,0.1,[0.02,0,0.04,0.05,0.13,0.27,0.35,0.44,0.64,0.76,1”Min:0;Max:1”]) × Ratio_of_Built_up_space_supply_and_demand_Percieved |
| aux | Impact_of_investment_on_houisng_supply = GRAPH(Invetsment_on_housing,0,0.1,[0.04,0.07,0.09,0.13,0.21,0.34,0.49,0.59,0.84,0.99,0”Min:0;Max:1”]) × Invetsment_on_housing |
| aux | Impact_of_investment_on_houisng_supply_1 = GRAPH(Invetsment_on_housing_1,0,0.1,[0.04,0.07,0.09,0.13,0.21,0.34,0.49,0.59,0.84,0.99,0”Min:0;Max:1”]) × Invetsment_on_housing_1 |
| aux | Impact_of_investment_on_houisng_supply_2 = GRAPH(Invetsment_on_housing_2,0,0.1,[0.04,0.07,0.09,0.13,0.21,0.34,0.49,0.59,0.84,0.99,0”Min:0;Max:1”]) × Invetsment_on_housing_2 |
| aux | Impact_of_investment_on_houisng_supply_3 = GRAPH(Invetsment_on_housing_3,0,0.1,[0.04,0.07,0.09,0.13,0.21,0.34,0.49,0.59,0.84,0.99,0”Min:0;Max:1”]) × Invetsment_on_housing_3 |
| aux | Impact_on_built_up_space = GRAPH(TIME,0,0.1,[0.02,0.08,0.13,0.16,0.19,0.27,0.36,0.45,0.6,0.69,1”Min:0;Max:1”]) × Energy_tarrif_ratio |
| aux | Impact_on_built_up_space_1 = GRAPH(Energy_tarrif_ratio_1,0,0.1,[0.97,0.98,0.73,0.63,0.54,0.4,0.3,0.26,0.23,0.17,0.12”Min:0;Max:1”]) |
| aux | Impact_on_built_up_space_2 = GRAPH(Energy_tarrif_ratio_2,0,0.1,[0.97,0.98,0.73,0.63,0.54,0.4,0.3,0.26,0.23,0.17,0.12”Min:0;Max:1”]) × Energy_tarrif_ratio_2 |
| aux | Impact_on_built_up_space_3 = GRAPH(Energy_tarrif_ratio_3,0,0.1,[0.97,0.98,0.73,0.63,0.54,0.4,0.3,0.26,0.23,0.17,0.12”Min:0;Max:1”]) × Energy_tarrif_ratio_3 |
| aux | Impact_on_knowldge_workers = GRAPH(Energy_tarrif_ratio,0,0.1,[0.03,0,0.05,0.1,0.17,0.25,0.34,0.45,0.59,0.77,1”Min:0;Max:1”]) × Energy_tarrif_ratio |
| aux | Impact_on_knowldge_workers_1 = GRAPH(Energy_tarrif_ratio_1,0,0.1,[0.03,0,0.05,0.1,0.17,0.25,0.34,0.45,0.59,0.77,1”Min:0;Max:1”]) × Energy_tarrif_ratio_1 |
| aux | Impact_on_knowldge_workers_2 = GRAPH(Energy_tarrif_ratio_2,0,0.1,[0.06,0.36,0.56,0.69,0.84,0.91,0.96,1,1,0.99,1”Min:0;Max:1”]) × Energy_tarrif_ratio_2 |
| aux | Impact_on_knowldge_workers_3 = GRAPH(Energy_tarrif_ratio_3,0,0.1,[0.06,0.36,0.56,0.69,0.84,0.91,0.96,1,1,0.99,1”Min:0;Max:1”]) × Energy_tarrif_ratio_3 |
| aux | Investment_from_IT_industry = Earning_from_IT_industry_Normal × Investment_from_IT_indutsry_fraction |
| aux | Investment_from_IT_industry_1 = Earning_from_IT_industry_Pessimistic × Investment_from_IT_indutsry_fraction_1 |
| aux | Investment_from_IT_industry_2 = Earning_from_IT_industry_Optimistic × Investment_from_IT_indutsry_fraction_2 |
| aux | Investment_from_IT_industry_3 = Earning_from_IT_industry_Percieved × Investment_from_IT_indutsry_fraction_3 |
| aux | Investment_in_buit_up_space = Investment_from_IT_industry × Investment_on_built_up_space |
| aux | Investment_in_buit_up_space_1 = Investment_from_IT_industry_1 × Investment_on_built_up_space_1 |
| aux | Investment_in_buit_up_space_2 = Investment_from_IT_industry_2 × Investment_on_built_up_space_2 |
| aux | Investment_in_buit_up_space_3 = Investment_from_IT_industry_3 × Investment_on_built_up_space_3 |
| aux | Invetsment_on_housing = Investment_from_IT_industry × Investment_fraction_on_housing |
| aux | Invetsment_on_housing_1 = Investment_from_IT_industry_1 × Investment_fraction_on_housing_1 |
| aux | Invetsment_on_housing_2 = Investment_from_IT_industry_2 × Investment_fraction_on_housing_2 |
| aux | Invetsment_on_housing_3 = Investment_from_IT_industry_3 × Investment_fraction_on_housing_3 |
| aux | Number_of_households = (Populatuion−Student_population)/Family_size |
| aux | Number_of_households_1 = (Populatuion_1−Student_population_1)/Family_size_1 |
| aux | Number_of_households_2 = (Populatuion_2−Student_population_2)/Family_size_2 |
| aux | Number_of_households_3 = (Populatuion_3−Student_population_3)/Family_size_3 |
| aux | Ratio_of_Built_up_space_supply_and_demand__Normal = Built_up_space_supply/Demand_for_Built_up_space |
| aux | Ratio_of_Built_up_space_supply_and_demand_Optimistic = Built_up_space_supply_2/Demand_for_Built_up_space_2 |
| aux | Ratio_of_Built_up_space_supply_and_demand_Percieved = Built_up_space_supply_3/Demand_for_Built_up_space_3 |
| aux | Ratio_of_Built_up_space_supply_and_demand_Pessimistic = Built_up_space_supply_1/Demand_for_Built_up_space_1 |
| aux | Ratio_of_demand_and_supply_of_speciic_quality_house_Optimistic = Supply_of_specific_quality_houses_2/Deamnd_for_specific_quality_houses_Optimistic |
| aux | Ratio_of_demand_and_supply_of_speciic_quality_house_Percieved = Supply_of_specific_quality_houses_3/Deamnd_for_specific_quality_houses_3 |
| aux | Ratio_of_supply_and_demand_of_spec9c_quality_house_for_Normal = Supply_of_specific_quality_houses/Demand_for_specific_quality_houses_for_IT_industry |
| aux | Ratio_supply_and_deamnd__specific_quality_house_Pessimistic = Supply_of_specific_quality_houses_1/Deamnd_for_specific_quality_houses_1 |
| aux | Student_houses = Student_population × Housing_demand_per_student |
| aux | Student_houses_1 = Student_population_1 × Housing_demand_per_student_1 |
| aux | Student_houses_2 = Student_population_2 × Housing_demand_per_student_2 |
| aux | Student_houses_3 = Student_population_3 × Housing_demand_per_student_3 |
| aux | Student_population = Populatuion × Student_population_fraction |
| aux | Student_population_1 = Populatuion_1 × Student_population_fraction_1 |
| aux | Student_population_2 = Populatuion_2 × Student_population_fraction_2 |
| aux | Student_population_3 = Populatuion_3 × Student_population_fraction_3 |
| aux | Supply_of_specific_quality_houses = Housing_supply × Supply_of_specific_quality_houses_fraction |
| aux | Supply_of_specific_quality_houses_1 = Housing_supply_1 × Supply_of_specific_quality_houses_fraction_1 |
| aux | Supply_of_specific_quality_houses_2 = Housing_supply_2 × Supply_of_specific_quality_houses_fraction_2 |
| aux | Supply_of_specific_quality_houses_3 = Housing_supply_3 × Supply_of_specific_quality_houses_fraction_3 |
| const | ARF = 0.015 |
| const | ARF_1 = 0.015 × 1.25 |
| const | ARF_2 = 0.015 |
| const | ARF_3 = 0.015 |
| const | ARF_4 = 0.015 |
| const | BDRF = 0.005 |
| const | BDRF_1 = 0.005 |
| const | BDRF_2 = 0.005 |
| const | BDRF_3 = 0.005 |
| const | BRF = 0.075 |
| const | BRF_1 = 0.075 |
| const | BRF_2 = 0.05 |
| const | BRF_3 = 0.06 |
| const | BSCFRF = 0.0005 |
| const | BSCFRF_1 = 0.0005 × 1.20 |
| const | BSCFRF_2 = 0.0005 × 0.5 |
| const | BSCFRF_3 = 0.0005 |
| const | BSCRF = 0.03 |
| const | BSCRF_1 = 0.03 × 0.5 |
| const | BSCRF_2 = 0.27 |
| const | BSCRF_3 = 0.20 |
| const | BSDRF = 0.0005 |
| const | BSDRF_1 = 0.0005 × 1.2 |
| const | BSDRF_2 = 0.0005 × 0.5 |
| const | BSDRF_3 = 0.0005 × 1.5 |
| const | BSRF = 0.0005 |
| const | BSRF_1 = 0.0005 |
| const | BSRF_2 = 0.25 |
| const | BSRF_3 = 0.20 |
| const | Current_tariff_rate = 1 |
| const | Current_tariff_rate_1 = 1 |
| const | Current_tariff_rate_2 = 1 |
| const | Current_tariff_rate_3 = 1 |
| const | Demand_fraction_for_specific_quality_houses = 0.056 |
| const | DEMAND_per_KWF = 10 |
| doc | DEMAND_per_KWF = SQM |
| const | DEMAND_per_KWF_1 = 10 |
| doc | DEMAND_per_KWF_1 = SQM |
| const | DEMAND_per_KWF_2 = 10 |
| doc | DEMAND_per_KWF_2 = SQM |
| const | DEMAND_per_KWF_3 = 10 |
| doc | DEMAND_per_KWF_3 = SQM |
| const | Demand_Specific_quality_housing_fraction_2 = 0.038 |
| const | Demand_Specific_quality_housing_fraction_3 = 0.05 |
| const | DRF = 0.02 |
| const | DRF_1 = 0.02 |
| const | DRF_2 = 0.02 |
| const | DRF_3 = 0.02 |
| const | Family_size = 2.3 |
| const | Family_size_1 = 2.3 |
| const | Family_size_2 = 2.5 |
| const | Family_size_3 = 2.5 |
| const | HCRF = 0.045 |
| const | HCRF_1 = 0.045 |
| const | HCRF_2 = 0.12 |
| const | HCRF_3 = 0.07 |
| const | HDGRF = 0.0056 |
| const | HDGRF_1 = 0.0056 |
| const | HDGRF_2 = 0.0056 |
| const | HDGRF_3 = 0.0056 |
| const | HDPRF = 0.0085 |
| const | HDPRF_1 = 0.0085 |
| const | HDPRF_2 = 0.0085 |
| const | HDPRF_3 = 0.0085 |
| const | Housing_demand_per_student = 0.5 |
| const | Housing_demand_per_student_1 = 0.5 |
| const | Housing_demand_per_student_2 = 0.5 |
| const | Housing_demand_per_student_3 = 0.5 |
| const | HRF = 0.01 |
| const | HRF_1 = 0.01 |
| const | HRF_2 = 0.1 |
| const | HRF_3 = 0.01 |
| const | IMRF = 0.005 |
| const | IMRF_1 = 0.005 |
| const | IMRF_2 = 0.01 |
| const | IMRF_3 = 0.0045 |
| const | Investment_fraction_on_housing = 0.4 |
| const | Investment_fraction_on_housing_1 = 0.4 |
| const | Investment_fraction_on_housing_2 = 0.4 |
| const | Investment_fraction_on_housing_3 = 0.4 |
| const | Investment_from_IT_indutsry_fraction = 0 |
| const | Investment_from_IT_indutsry_fraction_1 = 0 |
| const | Investment_from_IT_indutsry_fraction_2 = 0.3 |
| const | Investment_from_IT_indutsry_fraction_3 = 0.20 |
| const | Investment_on_built_up_space = 0.6 |
| const | Investment_on_built_up_space_1 = 0.6 |
| const | Investment_on_built_up_space_2 = 0.6 |
| const | Investment_on_built_up_space_3 = 0.6 |
| const | ITEGRF = 0.025 |
| const | ITEGRF_1 = 0.025 |
| const | ITEGRF_2 = 0.025 |
| const | ITEGRF_3 = 0.025 |
| const | ITEGRF_4 = 0.025 |
| const | KWGRF = 0.08 |
| const | KWGRF_1 = 0.065 |
| const | KWGRF_2 = 0.055 |
| const | KWGRF_3 = 0.05 |
| const | KWGRF_4 = 0.065 |
| const | OMRF_1 = 0.004 |
| const | OMRF_2 = 0.005 |
| const | OMRF_3 = 0.004 |
| const | ORF = 0.004 |
| const | Perspective_tariff_rate = 0.85 |
| const | Perspective_tariff_rate_1 = 1.0 |
| const | Perspective_tariff_rate_2 = 1.5 |
| const | Perspective_tariff_rate_3 = 1.3 |
| const | Rate_of_earning_per_knowledge_worker = 40 |
| const | Rate_of_earning_per_knowledge_worker_1 = 40 |
| const | Rate_of_earning_per_knowledge_worker_2 = 40 |
| const | Rate_of_earning_per_knowledge_worker_3 = 40 |
| const | Specific_quality_housing_fraction_1 = 0.056 |
| const | Student_population_fraction = 0.10 |
| const | Student_population_fraction_1 = 0.10 |
| const | Student_population_fraction_2 = 0.10 |
| const | Student_population_fraction_3 = 0.10 |
| const | Supply_of_specific_quality_houses_fraction = 0.05 |
| const | Supply_of_specific_quality_houses_fraction_1 = 0.05 × 0.75 |
| const | Supply_of_specific_quality_houses_fraction_2 = 0.043 |
| const | Supply_of_specific_quality_houses_fraction_3 = 0.045 |
Appendix B
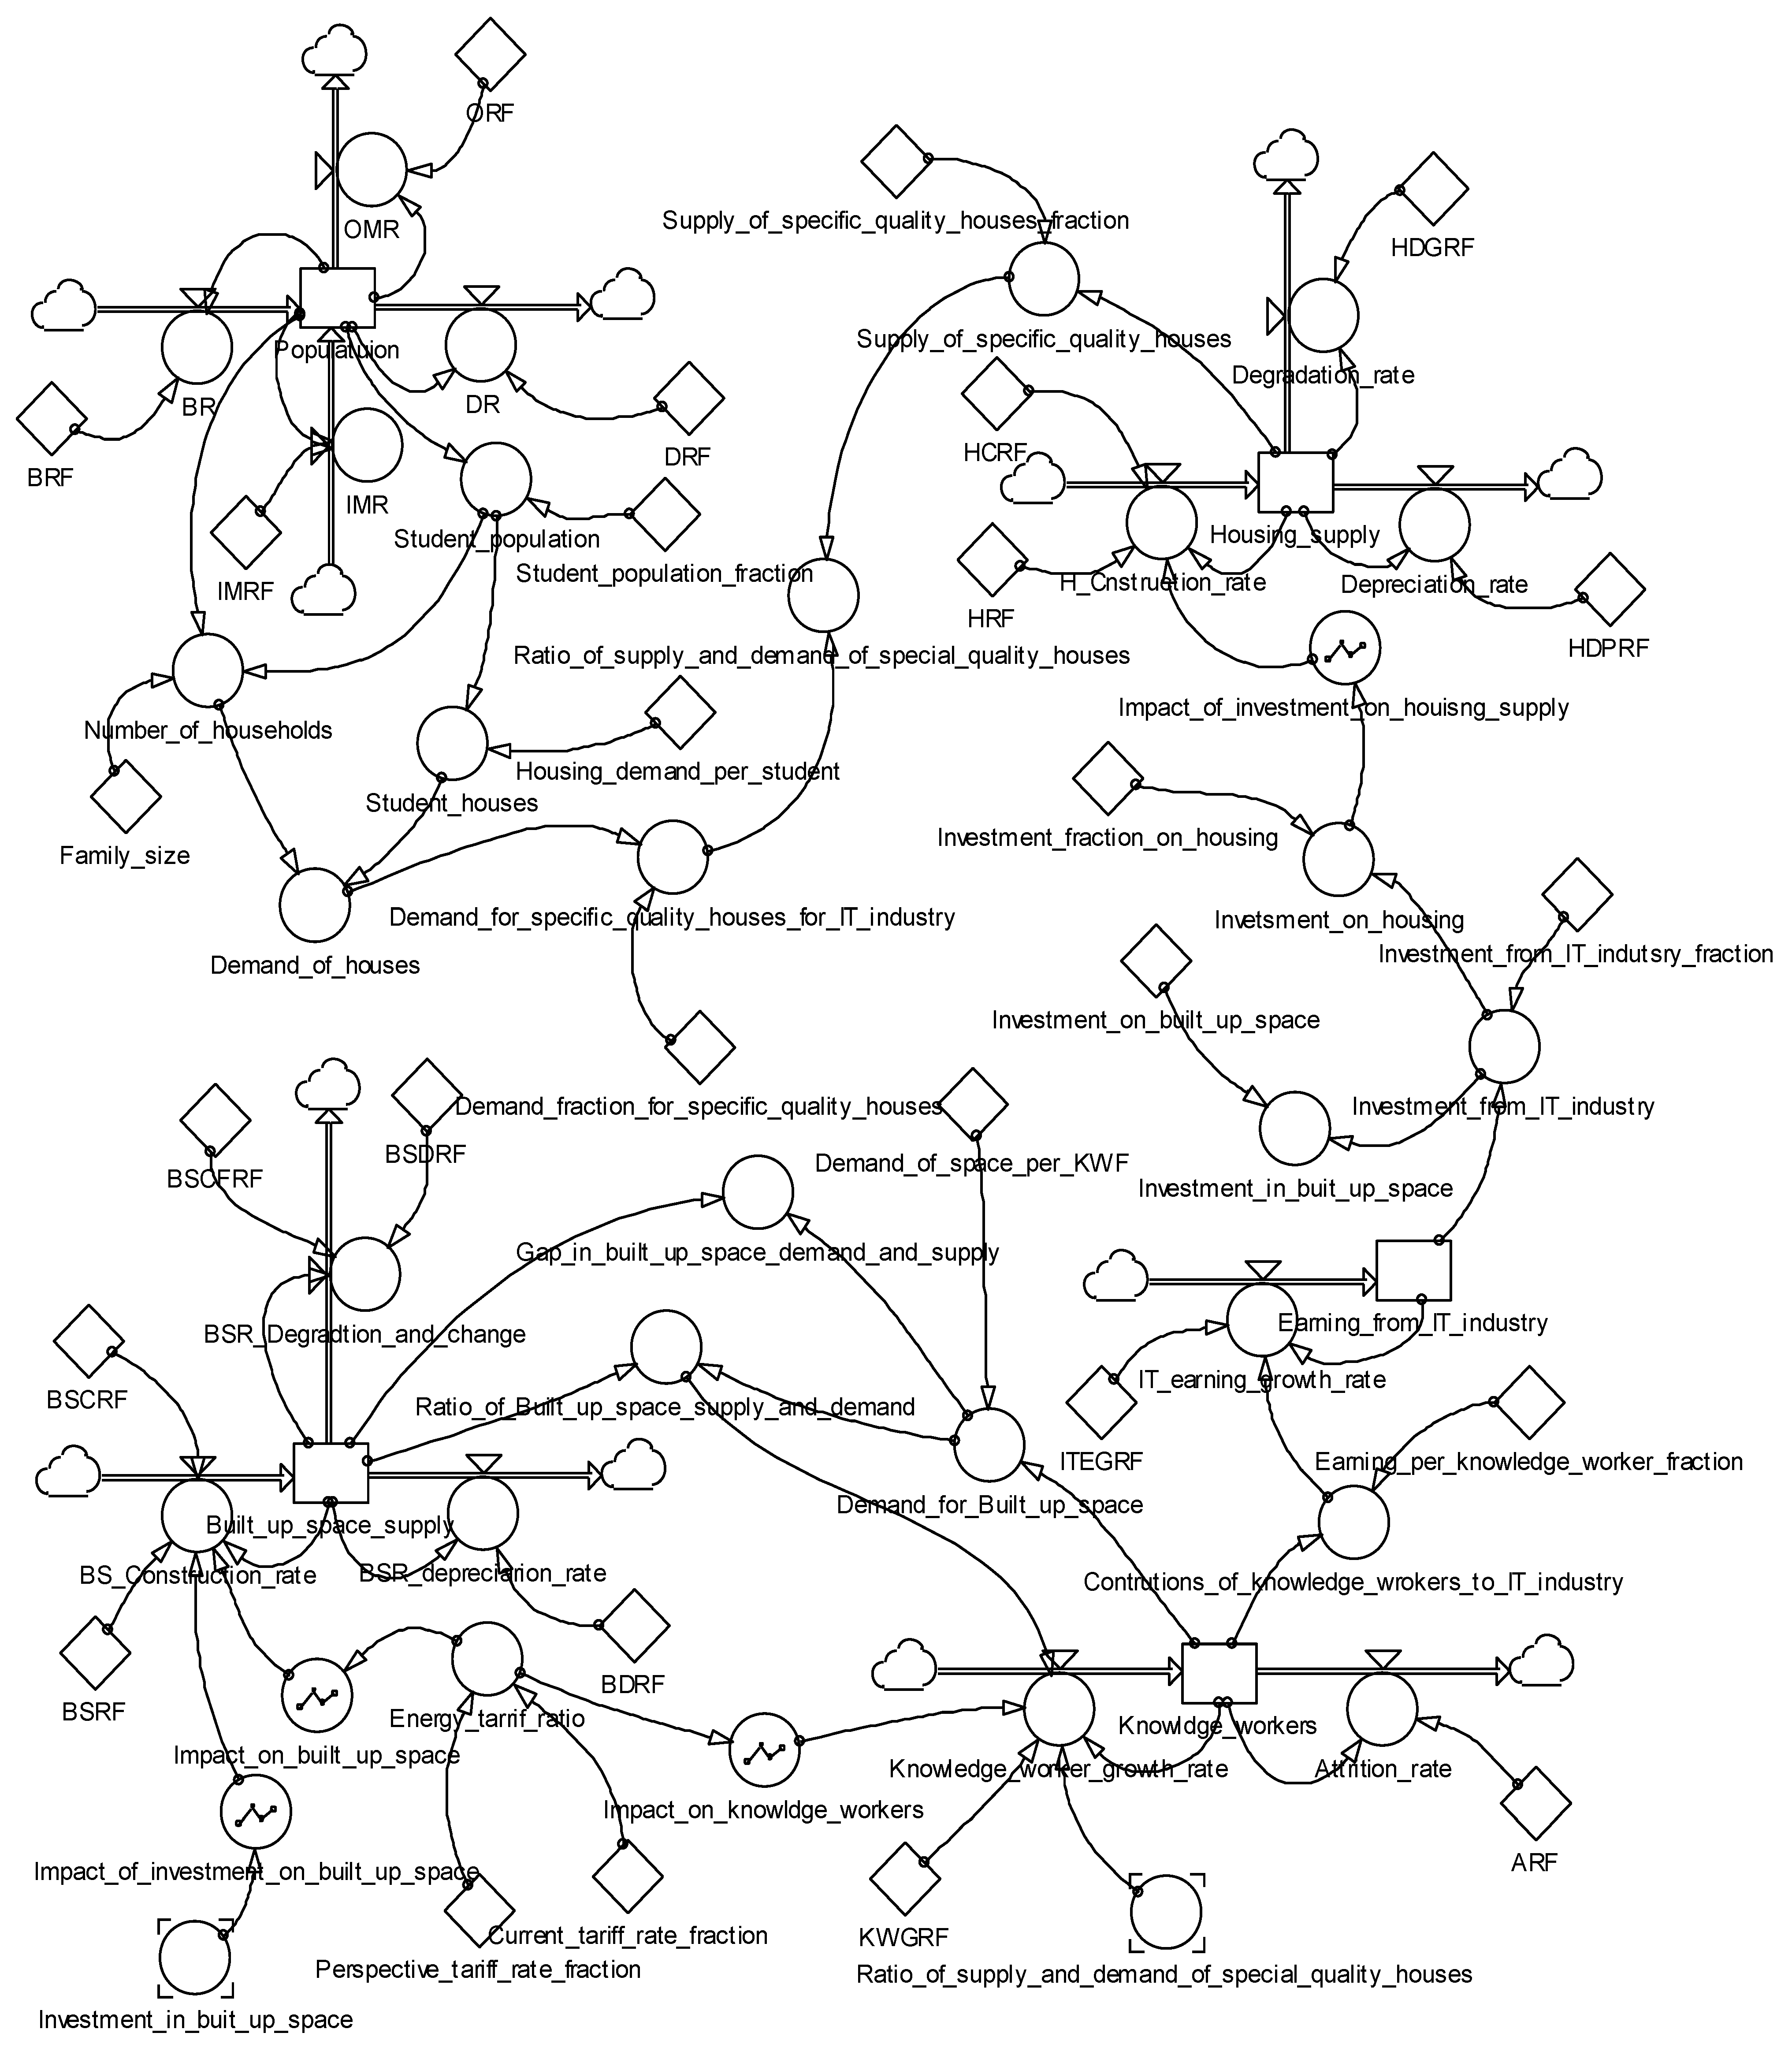
References
- Das, D.; Sonar, S.G. Perspective Impacts of Information Technology Industry in Development of Pune City in India. J. New Gener. Sci. 2013, 11, 1–17. [Google Scholar]
- De Wet, W.; Koekemoer, E.; Nel, J.A. Exploring the impact of information and communication technology on employees’ work and personal lives. SA J. Ind. Psychol. 2016, 42, 1–11. [Google Scholar] [CrossRef]
- Dickey, J. Urban Impacts of Information Technology, the Future of Urban Form; Nicolas Publishing Company: New York, NY, USA, 1985. [Google Scholar]
- Jae-pyo, H. Causal relationship between ICT R&D investment and economic growth in Korea. Technol. Forecast. Soc. Chang. 2017, 116, 70–75. [Google Scholar]
- Pradhan, R.P.; Arvin, M.B.; Norman, N.R.; Bele, S.K. Economic growth and the developmentof telecommunications infrastructure in the G-20 countries: A panel-VARapproach. Telecommun. Policy 2014, 38, 634–649. [Google Scholar] [CrossRef]
- Talvitie, J. Incorporating the Impact of ICT into Urban and Regional Planning European. J. Spat. Dev. 2004, 10, 2–32. [Google Scholar]
- Townsend, A. Smart Cities: Big Data, Civic Hackers, and the Quest for a New Utopia; W. W. Norton & Company: New York, NY, USA, 2013; ISBN 9780393349788. [Google Scholar]
- Das, D. Engendering image of creative cities by use of Information and Communication Technology in developing countries. Urban Plan. 2016, 1, 1–12. [Google Scholar] [CrossRef]
- Florida, R. The Rise of the Creative Class and How It’s Transforming Work, Leisure, Community, and Everyday Life; Basic Books: New York, NY, USA, 2002. [Google Scholar]
- Florida, R. Cities and the creative class. City Community 2003, 2, 3–19. [Google Scholar] [CrossRef]
- Florida, R. Cities and the Creative Class; Routledge: London, UK, 2005. [Google Scholar]
- Latifa, Z.; Mengkec, Y.; Danish, L.S.; Ximeia, L.; Pathana, Z.H.; Shafaq, S.; Jianqiu, Z. The dynamics of ICT, foreign direct investment, globalization and economic growth: Panel estimation robust to heterogeneity and cross-sectional dependence. Telemat. Inform. 2018, 35, 318–328. [Google Scholar] [CrossRef]
- Su, K.; Li, J.; Fu, H. Smart city and the applications. In Proceedings of the 2011 International Conference on Electronics, Communications and Control (ICECC), Ningbo, China, 9–11 September 2011; pp. 1028–1031. Available online: http://ieeexplore.ieee.org/stamp/stamp.jsp?tp=&arnumber=6066743 (accessed on 13 April 2016).
- Yigitcanlar, T.; Lee, S.H. Korean ubiquitous-eco-city: A smart-sustainable urban form or a branding hoax? Technol. Forecast. Soc. Chang. 2014, 89, 100–114. [Google Scholar] [CrossRef]
- Yigitcanlar, T. Technology and the City: Systems, Applications and Implications; Routledge: New York, NY, USA, 2016. [Google Scholar]
- Miller, E.J.; Hunt, J.D.; Abraham, J.E.; Salvini, P.A. Micro Simulating Urban Systems. Computer. Environ. Urban Syst. 2004, 28, 9–44. [Google Scholar] [CrossRef]
- Yigitcanlar, T.; Baum, S.; Horton, S. Attracting and retaining knowledge workers in knowledge cities. J. Knowl. Manag. 2007, 11, 6–17. [Google Scholar] [CrossRef]
- Yigitcanlar, T.; O’Connor, K.; Westerman, C. The making of knowledge cities: Melbourne’s knowledge-based urban development experience. Cities 2008, 25, 63–72. [Google Scholar] [CrossRef]
- Das, D. The Influence of urban infrastructure on the Information Communication Technology (ICT) industry: A case of an Indian City. In Proceedings of the 1st International Conference on Entrepreneurship Development (ICED) 2017, Bloemfontein, South Africa, 5–7 April 2017; pp. 227–234, ISBN 978-0-9946995-0-3. [Google Scholar]
- Abraham, G.V.; Mario, M. Evaluating Users’ Perceptions of the Digital Doorway: A Narrative Analysis. Inf. Technol. Dev. 2015, 21, 99–112. [Google Scholar] [CrossRef]
- De Silva, D.G.; McComb, R.P. Geographic concentration and high-tech firm survival. Reg. Sci. Urban Econ. 2012, 42, 691–701. [Google Scholar] [CrossRef]
- Francis, K.A.; Babajide, O.; Niki, K. KICT Capacity as the Investment and Use of ICT: Exploring its Antecedents in Africa. Inf. Technol. Dev. 2014, 20, 44–59. [Google Scholar] [CrossRef]
- Young, D.; Keil, R. Reconnecting the disconnected: The politics of infrastructure in the in-between city. Cities 2010, 27, 87–95. [Google Scholar] [CrossRef]
- Das, D. Developing enterprising cities in South Africa. Afr. J. Hosp. Tour. Leis. 2019, 8, 1–14. [Google Scholar]
- Envision a New Africa with This Enterprising Collective. Available online: https://city-press.news24.com/Trending/envision-a-new-africa-with-this-enterprising-collective-20190701 (accessed on 1 July 2019).
- Colecchia, A.; Schreyer, P. ICT Investment and economic growth in the 1990s: Is the United States a unique case? A comparative study of nine OECD countries. Rev. Econ. Dyn. 2002, 5, 408–442. [Google Scholar] [CrossRef]
- Datta, A.; Agarwal, S. Telecommunication and economic growth: A panel data approach. Appl. Econ. 2004, 36, 1649–1654. [Google Scholar] [CrossRef]
- Jalava, J.; Pohjola, M. The roles of electricity and ICT in economic growth: Case Finland. Explor. Econ. Hist. 2008, 45, 270–287. [Google Scholar] [CrossRef]
- James, L.; Lissy, M. Employee Retention Strategies: IT Industry. SCMS J. Indian Manag. 2012, 9, 79–88. [Google Scholar]
- Jorgenson, D. Information technology and the US economy. Am. Econ. Rev 2001, 91, 1–32. [Google Scholar] [CrossRef]
- Jorgenson, D. Information technology and the G7 economies. World Econ. 2005, 4, 139–169. [Google Scholar]
- Jorgenson, D.W.; Motohashi, K. Information technology and the Japanese economy. J. Jpn. Int. Econ. 2005, 19, 460–481. [Google Scholar] [CrossRef]
- Koutroumpis, P. The economic impact of broadband on growth: A simultaneous approach. Telecommun. Policy 2009, 33, 471–485. [Google Scholar] [CrossRef]
- Martínez, D.; Rodríguez, J.; Torres, J. ICT-specific technological change and productivity growth in the US: 1980–2004. Inf. Econ. Policy 2010, 22, 121–129. [Google Scholar] [CrossRef][Green Version]
- Oliner, S.; Sichel, D. The resurgence of growth in the late 1990s: In information technology the story? J. Econ. Perspect. 2000, 14, 3–22. [Google Scholar] [CrossRef]
- Plepys, A. The grey side of ICT. Environ. Impact Assess 2002, 22, 509–523. [Google Scholar] [CrossRef]
- Sassi, S.; Goaied, M. Financial development, ICT diffusion and economic growth: Lessons from MENA region. Telecommun. Policy 2013, 37, 252–261. [Google Scholar] [CrossRef]
- Vu, M.K. ICT as a source of economic Growth in the information Age: Empirical evidence from the 1996-2005 period. Telecommun. Policy 2011, 35, 357–372. [Google Scholar] [CrossRef]
- Vu, M.K. Information and communication technology (ICT) and Singapore’s economic growth. Inf. Econ. Policy 2013, 25, 284–300. [Google Scholar] [CrossRef]
- Asongu, S.A.; Le Roux, S. Enhancing ICT for inclusive human development in Sub-Saharan Africa. Technol. Forecast. Soc. Chang. 2017, 118, 44–54. [Google Scholar] [CrossRef]
- Kuada, J. Private Enterprise-Led Economic Development. In Sub-Saharan Africa, the Human Side of Growth; Kuada, J., Ed.; Palgrave Macmillan: New York, NY, USA, 2015. [Google Scholar]
- Tchamyou, V.S. The role of knowledge economy in African business. J. Knowl. Econ. 2017, 8, 1189–1228. [Google Scholar] [CrossRef]
- Lasi, H.; Fettke, P.; Kemper, H.G.; Feld, T.; Hoffmann, M. Industry 4.0. Bus. Inf. Syst. Eng. 2014, 6, 239–242. [Google Scholar] [CrossRef]
- Alkemade, F.; Surrs, R.A.A. Patterns of expectations for emerging sustainable technologies. Technol. Forecast. Soc. Chang. 2012, 79, 448–456. [Google Scholar] [CrossRef]
- Mishra, V.; Bisht, S.S. Mobile banking in a developing economy: A customer-centric model for policy formulation. Telecommun. Policy 2013, 37, 503–514. [Google Scholar] [CrossRef]
- Komninos, N.; Pallot, M.; Schaffers, H. Smart cities and the future internet in Europe. J. Knowl. Econ. 2013, 4, 119–134. [Google Scholar] [CrossRef]
- VanWinden, W.; van Den Berg, L.; Pol, P. European cities in the knowledge economy. Urban Stud. 2007, 44, 525–549. [Google Scholar] [CrossRef]
- Yigitcanlar, T.; Velibeyoglu, K.; Baum, S. Knowledge Based Urban Development: Planning and Applications in the Information Era; Yigitcanlar, T., Velibeyoglu, K., Baum, S., Eds.; IGI Global: Hershey, PA, USA, 2008. [Google Scholar]
- Navarro, J.L.A.; Ruiz, V.R.L.; Peña, D.N. The effect of ICT use and capability on knowledge-based cities. Cities 2017, 60, 272–280. [Google Scholar] [CrossRef]
- Poelhekke, S. Do Amenities and Diversity Encourage City Growth? A Link through Skilled Labor; Economics working papers ECO2006/10; San Domenico di Fiesole, European University Institute: Fiesole, Italy, 2006. [Google Scholar]
- Agarwal, R.; Ferratt, T.W. Enduring Practices for Managing IT Professionals. Commun. ACM 2002, 45, 73–79. [Google Scholar] [CrossRef]
- Upadhya, C. Employment, exclusion and ‘merit’ in the Indian IT industry. Econ. Political Wkly. 2007, 42, 1863–1868. [Google Scholar]
- Gaan, N.A. Revisit on Impact of Job Attitudes on Employee Turnover: An Empirical Study in Indian IT Industry. Vilakshan XIMB J. Manag. 2011, 8, 33–42. [Google Scholar]
- Achoui, M.; Mansour, M. Employee Turnover and Retention Strategies: Evidence from Saudi Companies. Int. Rev. Res. Pap. 2007, 33, 116. [Google Scholar]
- Arthur, D. The Employee Recruitment and Retention Handbook, 1st ed.; AMACOM/American Management Association: New York, NY, USA, 2001. [Google Scholar]
- Singh, P.; Loncar, N. Pay Satisfaction, Job Satisfaction and Turnover Intent. Département des Relations Industrielles. Université Laval 2010, 65, 470–490. [Google Scholar] [CrossRef]
- Güngör, H.; Katircioglu, S.; Mercan, M. Revisiting the nexus between financial development, FDI, and growth: New evidence from second generation econometric procedures in the Turkish context. Acta Oecon. 2014, 64, 73–89. [Google Scholar] [CrossRef]
- Rahaman, A.; Chakraborty, S. Effects of foreign direct investment on GDP: Empirical evidence from developing country. Adv. Econ. Bus. 2015, 3, 587–592. [Google Scholar]
- Feng, Z.; Dahui, L. Regional ICT access and entrepreneurship: Evidence from China. Inf. Manag. 2018, 55, 188–198. [Google Scholar] [CrossRef]
- Giudice, M.D.; Straub, D. IT and entrepreneurism: An on-again, off-again love affair or a marriage? MIS Q. 2011, 35, 3–7. [Google Scholar]
- Goolsbee, A.; Klenow, P.J. Evidence on learning and network externalities in the diffusion of home computers. J. Law Econ. 2002, 45, 317–343. [Google Scholar] [CrossRef]
- Asokan, P. Foreign direct investment in developing countries-a study with reference to the South Asian Countries. J. Int. Econ. 2014, 5, 65. [Google Scholar]
- Büthe, T.; Milner, H.V. Foreign direct investment and institutional diversity in trade agreements: Credibility, commitment, and economic flows in the developing world, 1971–2007. World Politics 2014, 66, 88–122. [Google Scholar] [CrossRef]
- Ergazakis, K.; Metaxiotis, K.; Psarras, J. Knowledge cities: The answer to the needs of knowledge-based development. J. Inf. Knowl. Manag. Syst. 2006, 36, 67–81. [Google Scholar] [CrossRef]
- Deakin, M.; Allwinkle, S. Urban regeneration and sustainable communities: The role of networks, innovation and creativity in building successful partnerships. J. Urban Technol. 2007, 14, 77–91. [Google Scholar] [CrossRef]
- Caragliu, A.; Del Bo, C.; Nijkamp, P. Smart cities in Europe. J. Urban Technol. 2011, 18, 65–82. [Google Scholar] [CrossRef]
- Giffinger, R.; Fertner, C.; Kramar, H.; Kalasek, R.; Pichler-Milanović, N.; Meijers, E. Smart Cities: Ranking of European Medium-Sized Cities; Vienna University of Technology: Wien, Austria, 2007; Available online: http://www.smart-cities.eu/ (accessed on 13 October 2017).
- Green IT: The New Industry Shock Wave. Available online: http://www.ictliteracy.info/rf.pdf/Gartner_on_Green_IT.pdf (accessed on 23 September 2019).
- Hollands, R.G. Will the real smart city please stand up? City Analysis of Urban Trends, Culture, Theory. Policy Action 2008, 12, 303–320. [Google Scholar]
- Kramers, A.; Höjer, M.; Lövehagen, N.; Wangel, J. Smart sustainable cities–Exploring ICT solutions for reduced energy use in cities. Environ. Model. Softw. 2014, 56, 52–62. [Google Scholar] [CrossRef]
- Pradhan, R.; Mallik, G.; Bagchi, T.P. Information communication technology (ICT) infrastructure and economic growth: A causality evinced by cross-country panel data. IIMB Manag. Rev. 2018, 30, 91–103. [Google Scholar] [CrossRef]
- Sonar, S.G. Planning for Information Technology Cities in India. Ph.D. Thesis, IIT Roorkee, Roorkee, India, 2007, unpublished. [Google Scholar]
- Yigitcanlar, T.; Velibeyoglu, K.; Baum, S. Creative Urban Regions: Harnessing Urban Technologies to Support Knowledge City Initiatives; The Making of Knowledge Cities: Melbourne’s Knowledge-Based Urban Development Experience; Yigitcanlar, T., Velibeyoglu, K., Baum, S., Eds.; IGI Global: Hershey, PA, USA, 2008. [Google Scholar]
- Statistics South Africa. Available online: http://www.statssa.gov.za/ (accessed on 11 July 2018).
- Saunders, M.; Lewis, P.; Thornhill, A. Research Methods for Business Students; Pearson Education Limited: Essex, UK, 2016; ISBN 978-1-292-01662-7. [Google Scholar]
- Cabrera, D.; Colosi, L.; Lobdell, C. Systems thinking. Eval. Progr. Plan 2008, 31, 299–310. [Google Scholar] [CrossRef]
- Forrester, J.W. Confidence in Models of Social Behaviour with Emphasis on Systems Dynamics Models; MIT System Dynamics Group: Cambridge, MA, USA, 1973. [Google Scholar]
- Forrester, J.W. Lessons from systems dynamics modelling. SystDyn Rev. 1987, 3, 136–149. [Google Scholar]
- Forrester, J.W. System dynamics and the lessons of 35 years. A system-based approach to policymaking. SystDyn Rev. 1991, 3, 1–35. [Google Scholar]
- Vennix, J.A.M. Group model-building: Tackling messy problems. Syst. Dyn. Rev. 1999, 15, 379–401. [Google Scholar] [CrossRef]
- Sterman, J.D. A Skeptic’s Guide to Computer Models; Barney, G.O., Kreutzer, W.B., Garett, M.J., Eds.; Westview Press: Boulder, CO, USA, 1991; pp. 209–229. [Google Scholar]
- Mutanga, S.S.; de Vries, M.; Mbohwa, C.; Das, D.K.; Rogner, H. An integrated approach for modelling the electricity value of a sugarcane production system. Appl. Energy 2016, 177, 823–838. [Google Scholar] [CrossRef][Green Version]
- Forrester, J.W. System dynamics, systems thinking, and soft OR. SystDyn Rev. 1994, 10, 1–14. [Google Scholar] [CrossRef]
- Kirkwood, C.W. System Dynamics Methods: A Quick Introduction. Available online: http://www.public.asu.edu/~kirkwood/sysdyn/SDIntro/SDIntro.htm (accessed on 16 October 2017).
- Amigun, B.; Musango, J.K.; Stafford, W. Biofuels and sustainability in Africa. Renew. Sustain. Energy Rev. 2011, 15, 1360–1372. [Google Scholar] [CrossRef]
- Coyle, R.G. System Dynamics Modelling: A Practical Approach; Chapman & Hall: London, UK, 1996. [Google Scholar]
- Forrester, J.W. Principles of Systems; Productivity Press: Cambridge, MA, USA, 1968. [Google Scholar]
- Sterman, J.D.; Forrester, J.W.; Graham, A.K.; Senge, P.M. An Integrated Approach to the Economic Long Wave. Available online: https://www.sciencedirect.com/science/article/abs/pii/0016328785900023#aep-article-footnote-id1 (accessed on 17 December 2015).


| Parameters | Number of Responses | Percent | Sources | Remarks |
|---|---|---|---|---|
| Infrastructure | ||||
| Housing | 212 | 88.33 | HH survey | Corroborated real estate by experts and IT industry professionals |
| Energy (electrical power) | 192 | 80.41 | HH survey | Corroborated by Energy experts and IT professionals |
| Build up space for IT industry | 176 | 73.33 | HH survey | Corroborated by Urban planners and IT professionals |
| Water supply and sanitation | 82 | 34.16 | HH survey | |
| Local transportation | 73 | 30.41 | HH survey | |
| Environment and Image | ||||
| Local environment | 112 | 46.67 | HH survey | |
| Economic image | 162 | 67.5 | HH survey | IT professionals |
| Policy | ||||
| IT policy of the county | 8 | 53.33 | IT industry survey | |
| IT policy of the city | 10 | 66.67 | IT industry survey | |
| Incentives for location of IT industry | 8 | 53.33 | IT industry survey | |
| Investment | ||||
| Investment in IT industry | 9 | 60.0 | IT industry survey | |
| Investment in general industry | 8 | 53.33 | IT industry survey | |
| Investment in infrastructure | 7 | 46.67 | HH survey | Corroborated by experts |
| Human Resources | ||||
| Availability of skilled human resources | 8 | 53.33 | IT industry survey | |
| Attrition rate of human resource | 11 | 73.33 | IT industry survey | |
| Potential availability of human resources | 7 | 46.67 | IT industry survey | |
| Variables | Current Status | Remarks |
|---|---|---|
| Earnings from the IT industry | Stock | Per year |
| No of houses | stock | Per year |
| Population | stock | Per year |
| Build up space for the IT industry | stock | Per year |
| Knowledge workers (Human resource) | Stock | Per year |
| Housing construction rate | Rate | + |
| Housing depreciation rate | Rate | − |
| Housing degradation rate | Rate | − |
| Housing refurbishment rate | Rate | + |
| Built up space construction rate | Rate | + |
| Built up space depreciation rate | Rate | − |
| Built up space degradation rate | Rate | − |
| Built up space refurbishment rate | Rate | + |
| Built up space change of function rate | Rate | − |
| Knowledge worker’s inflow growth rate | Rate | + |
| Attrition rate | Rate | − |
| Population Birth rate | Rate | + |
| Population Death rate | Rate | − |
| Population immigration rate | Rate | + |
| Population outmigration rate | Rate | − |
| Energy (tariff) | auxiliary | |
| Investment | auxiliary | |
| Demand for houses | auxiliary | |
| Supply of houses | auxiliary | |
| Demand for specific quality houses | auxiliary | |
| Supply of specific quality houses | auxiliary | |
| Ratio of supply and demand of specific quality houses | auxiliary | |
| Supply of built up space | auxiliary | |
| Demand for built up space | auxiliary | |
| Ratio of supply and demand of built up space | auxiliary | |
| Ratio of perspective and current energy tariff | auxiliary |
| Sl No. | Scenario | Variation in Conditions in the Feedback Mechanisms |
|---|---|---|
| 1 | Normal scenario | Business as usual and current growth rate of all the rate variables remain unchanged during the projected period. |
| 2 | Houses | Increase of special quality houses for knowledge workers by minimum 0% to maximum 30% of the current level. |
| 3 | Energy | Energy tariff varies between maximum reduction of 30% to maximum increase of 50% of the current level. |
| 4 | Built up space for IT industry | Increase of built up space for the IT industry from minimum 0% to maximum 30% of the current level. |
| 5 | Investment from IT industry | Increase in investment from the IT industry in infrastructure development from minimum 0% to maximum 30% of the current level. |
© 2019 by the author. Licensee MDPI, Basel, Switzerland. This article is an open access article distributed under the terms and conditions of the Creative Commons Attribution (CC BY) license (http://creativecommons.org/licenses/by/4.0/).
Share and Cite
Das, D.K. Exploring Perspectives of the Information Technology Industry in a South African City. Sustainability 2019, 11, 6520. https://doi.org/10.3390/su11226520
Das DK. Exploring Perspectives of the Information Technology Industry in a South African City. Sustainability. 2019; 11(22):6520. https://doi.org/10.3390/su11226520
Chicago/Turabian StyleDas, Dillip Kumar. 2019. "Exploring Perspectives of the Information Technology Industry in a South African City" Sustainability 11, no. 22: 6520. https://doi.org/10.3390/su11226520
APA StyleDas, D. K. (2019). Exploring Perspectives of the Information Technology Industry in a South African City. Sustainability, 11(22), 6520. https://doi.org/10.3390/su11226520


