Abstract
Extraction of underground minerals causes subsidence of the ground surface due to gravitational forces. The subsidence rate depends on the type of extracted ore, as well as its shape, thickness, and depth. Additionally, the embedding and overburden rock properties influence the time needed for the deformations to reach the surface. Using the results of geodetic deformation monitoring, which supply the information on pattern and magnitude of surface deformation, the performance of the mine may be evaluated. The monitoring can supply information on the actual rock mass behaviour during the operation and in many cases during the years after the mining operations have ceased. Geodetic methods of deformation monitoring supply information on the absolute and relative displacements (changes in position in a selected coordinate system) from which displacement and strain fields for the monitored object may be derived. Thus, geodetic measurements provide global information on absolute and relative displacements over large areas, either at discrete points or continuous in the space domain. The geodetic methods are affected by errors caused by atmospheric refraction and delay of electromagnetic signal. Since geodetic measurements allow for redundancy and statistical evaluation of the quality of the data, they generally provide reliable results. Usually, the designed accuracy of deformation measurements should allow for the detection of at least one third of the expected maximum deformations over the desired time span at the 95% probability level. In ground subsidence studies in mining areas, 10 mm accuracy at 95% level in both vertical and horizontal displacements is typically required. In the case of salt mines, the process of ground subsidence in viscous rock is slow; therefore, subsidence monitoring surveys may be performed once a year. In subsidence determination, two techniques are commonly used: leveling and satellite positioning. The satellite positioning technique is used to determine the 3D (horizontal coordinates and height) or 2D position of monitored points (only horizontal coordinates). When comparing the heights determined from satellite and leveling surveys, it has to be noted that the leveling heights are referred with respect to the geoid (orthometric heights), while heights determined from satellite surveys are referred with respect to the ellipsoid (ellipsoidal height). In the case of satellite surveys, the accuracy of horizontal position is typically 2–3 times better than vertical. The analysis of the optimal session duration lead to the conclusion that in order to achieve the sub-cm accuracy of horizontal coordinates at 95% confidence level, the satellite positioning session length using Global Positioning System (GPS) should be at least three hours long. In order to achieve the sub-cm accuracy of height coordinate at 95% confidence level in a single observation session, the GPS session length should be at least twelve hours long.
1. Deformation Monitoring Requirements
Geodetic methods of deformation monitoring supply information on the absolute and relative displacements (changes in position in a selected coordinate system), from which displacement and strain fields for the monitored object may be derived. Thus, geodetic measurements provide global information on absolute and relative displacements over large areas, either at discrete points or continuously in the spatial domain. The geodetic methods are affected by errors caused by atmospheric refraction and delay of electromagnetic signal. Since geodetic measurements allow for redundancy and statistical evaluation of the quality of the data, they generally provide reliable results. The design of the monitoring network should allow for a sufficient redundancy of measurements, as well as for the self-checking of the scheme through geometrical closures of loops of independent measurements. It is sufficient to say that usually, the designed accuracy of deformation measurements should allow for the detection of at least one third of the expected maximum deformations over the desired time span at the 95% probability level [1]. Among the currently available geodetic and remote sensing techniques that are applicable to ground deformation monitoring, one may consider the following techniques: geometric leveling, trigonometric leveling, traversing, global navigation satellite systems (GNSS), satellite-borne and ground-based radar interferometry, airborne LiDAR, and aerial photogrammetry.
With the development of new monitoring technologies and new concepts concerning the integrated analysis of rock mass deformation in mining areas, the role of monitoring surveys has significantly increased over time to provide [2]:
- Verification that the behaviour of the structure follows the predicted pattern.
- Better understanding of the structure’s deformation mechanism for improving the safety and economy of mining production.
- Information for enhanced environmental protection.
- Identification and separation of various causes of deformation.
- Information for legal disputes concerning effects of mining on surface infrastructure.
The accuracy of the monitored surface deformations should allow for the detection of at least one third of the expected maximum deformations over the desired time span at the 95% probability level. In surface deformation studies in mining areas, typically 10 mm accuracy at 95% level in both vertical and horizontal displacements is required. To achieve a good reliability, the design of the monitoring system must have redundancy of observables and must be based on a good understanding of sources of errors and their mitigation. There is no single technique that can satisfy all of the listed ground deformation monitoring requirements as a stand-alone system—a combination of various monitoring methods which complement each other is recommended.
2. Use of GPS in Deformation Monitoring
Pioneering use of GPS in ground subsidence studies dates back to the early 1980s. In 1987, in monitoring of oil fields in Venezuela, GPS was added to the monitoring leveling scheme to gain information on the horizontal movements and to connect the local leveling network to faraway reference points [3]. It was a pioneering and challenging application of GPS in surface deformation studies, with only eight GPS satellites available for civilian use at that time and with inadequate modeling of atmospheric effects. The GNSS technique in surface deformation surveys has been widely used [4,5,6,7,8], and it requires minimal user interaction (and therefore can be cost-effective). GPS makes it possible to obtain millimeter level position information for short baselines (<10 km). In order to achieve the desired sub-cm accuracy, the location of the GPS receiver should ensure full sky visibility. The main problems in GPS surveys are multipath error, tropospheric delay, and limited visibility to the satellites.
The double-differenced (DD) ambiguity-fixed carrier-phase observation is the most commonly used GPS measurement for high -precision applications [9]. DD is the differencing between receivers followed by differencing between satellites or vice versa. This observation type allows for quick convergence on a solution once the ambiguity term has been resolved. However, the ambiguity term is always present, which leaves the possibility of false alarms caused by poorly handled cycle slips. The triple-differenced (TD) observable, despite introducing another level of differencing which increases the observation noise, offers several advantages over the DD [5]. After removing the error terms for receiver clocks and satellite clocks (which should be eliminated through DD processing when observation simultaneity criteria are met), the TD, carrier-phase observable between times t1 and t2 can be written as:
where:
- ij
- single-difference (SD) operator between satellites i and j
- ΔAB
- SD operator between receivers A and B
- SD operator between times t1 and t2
- carrier-phase observable (cycles)
- N
- ambiguity (cycles)
- M
- multipath (cycles)
- I
- ionospheric delay of the L1 carrier phase (m)
- T
- tropospheric delay (m)
- f
- carrier wave frequency (Hz)
- c
- speed of light in a vacuum (m/s)
- etrop
- residual tropospheric delay bias (present over large height differences)
- random carrier-phase measurement noise.
Errors and biases such as ionospheric delay, satellite clock errors, and orbital errors are assumed to be mitigated through differencing of the observables. Limitations of use and sources of errors in GPS surveys are presented in [8,10,11,12]. The multipath effect can be mitigated by carefully selecting the antenna site to avoid reflective objects, using the receiver that filters multipath effects, using the antenna that is multipath-resistant, masking signals from low-elevation satellites, or using longer session lengths [6,13,14,15].
In surface deformation studies, the satellite positioning technique can commonly be used to determine the 3D (horizontal coordinates and height) or 2D position of monitored points (only horizontal coordinates). When comparing the heights determined from satellite and leveling surveys, one has to keep in mind that the leveling heights are referred with respect to the geoid (orthometric height), while heights determined from satellite surveys are referred with respect to the ellipsoid (ellipsoidal height). The difference between the ellipsoidal and orthometric height is called undulation (Figure 1); the relationship between ellipsoidal and orthometric heights can be written as:
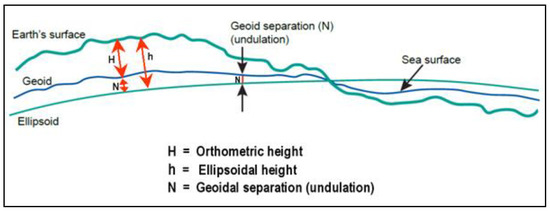
Figure 1.
Relation between undulation, orthometric heights, and ellipsoidal heights (after http://mathscinotes.com).
In positioning surveys, in order to determine the orthometric height from GPS measurements, one has to know the value of undulation.
In deformation surveys, one is interested in the height difference between consecutive monitoring campaigns. The orthometric height difference between the second and first monitoring epochs can be written as:
and ellipsoidal height difference can be expressed as:
If undulation is constant between campaigns:
This means that in deformation surveys, the ellipsoidal and orthometric height differences between monitoring epochs are equal if the undulation stays constant.
3. Description of the Study Area
Excavation of any underground deposit creates openings and disturbs equilibrium of forces in the surrounding rock mass. Due to gravitational forces, the rock strata surrounding the openings is deformed and starts moving towards the opening. The rock movement propagates to the surface and creates a subsidence bowl. The depth and horizontal dimensions of the subsidence bowl depend on the geometry and dimensions of the underground excavation, the mechanical properties and behaviour model of the rock mass, the depth of the mining operation, and the mining method. The time lapse between the time of underground excavation and full development of the subsidence on the surface may take from a few days to several months or even years (in the case of salt and potash mining), depending on the geology and properties of the rock strata.
In an undisturbed state of stress, salt rock is under isotropic lithostatic conditions. Under loading conditions, the redistribution of stress causes the deformation in salt rock. The developed stresses σij can be divided into two parts: the hydrostatic and non-hydrostatic (deviatoric) stress. The hydrostatic part of stress results in elastic deformations. The deviatoric part of stress causes creep with time.
Mining of a large deposit of high-grade sylvinite in New Brunswick has been carried out since the mid-1980s. Potash and salt mining takes place at depths between 400 and 700 m within a 25 km long dome-shaped salt pillow in which the potash is preserved in steeply dipping flanks. The potash deposit is structurally complex with a variable dip and width. A strong arch-shaped cap rock provides a natural support for the overlain brittle rocks. Salt mining is done using a multi-level room-and-pillar method with unsupported openings up to 25 m wide.
Monitoring surveys are performed annually and consist of first-order leveling and static GPS observations in the 3 by 8 km area above the extraction. The leveling surveys are performed using a Leica DNA03 digital level to measure the subsidence, and GPS observations are performed using NovAtel dual frequency receivers to measure the horizontal displacement of survey monuments. The monitoring network consists of approximately 150 survey monuments.
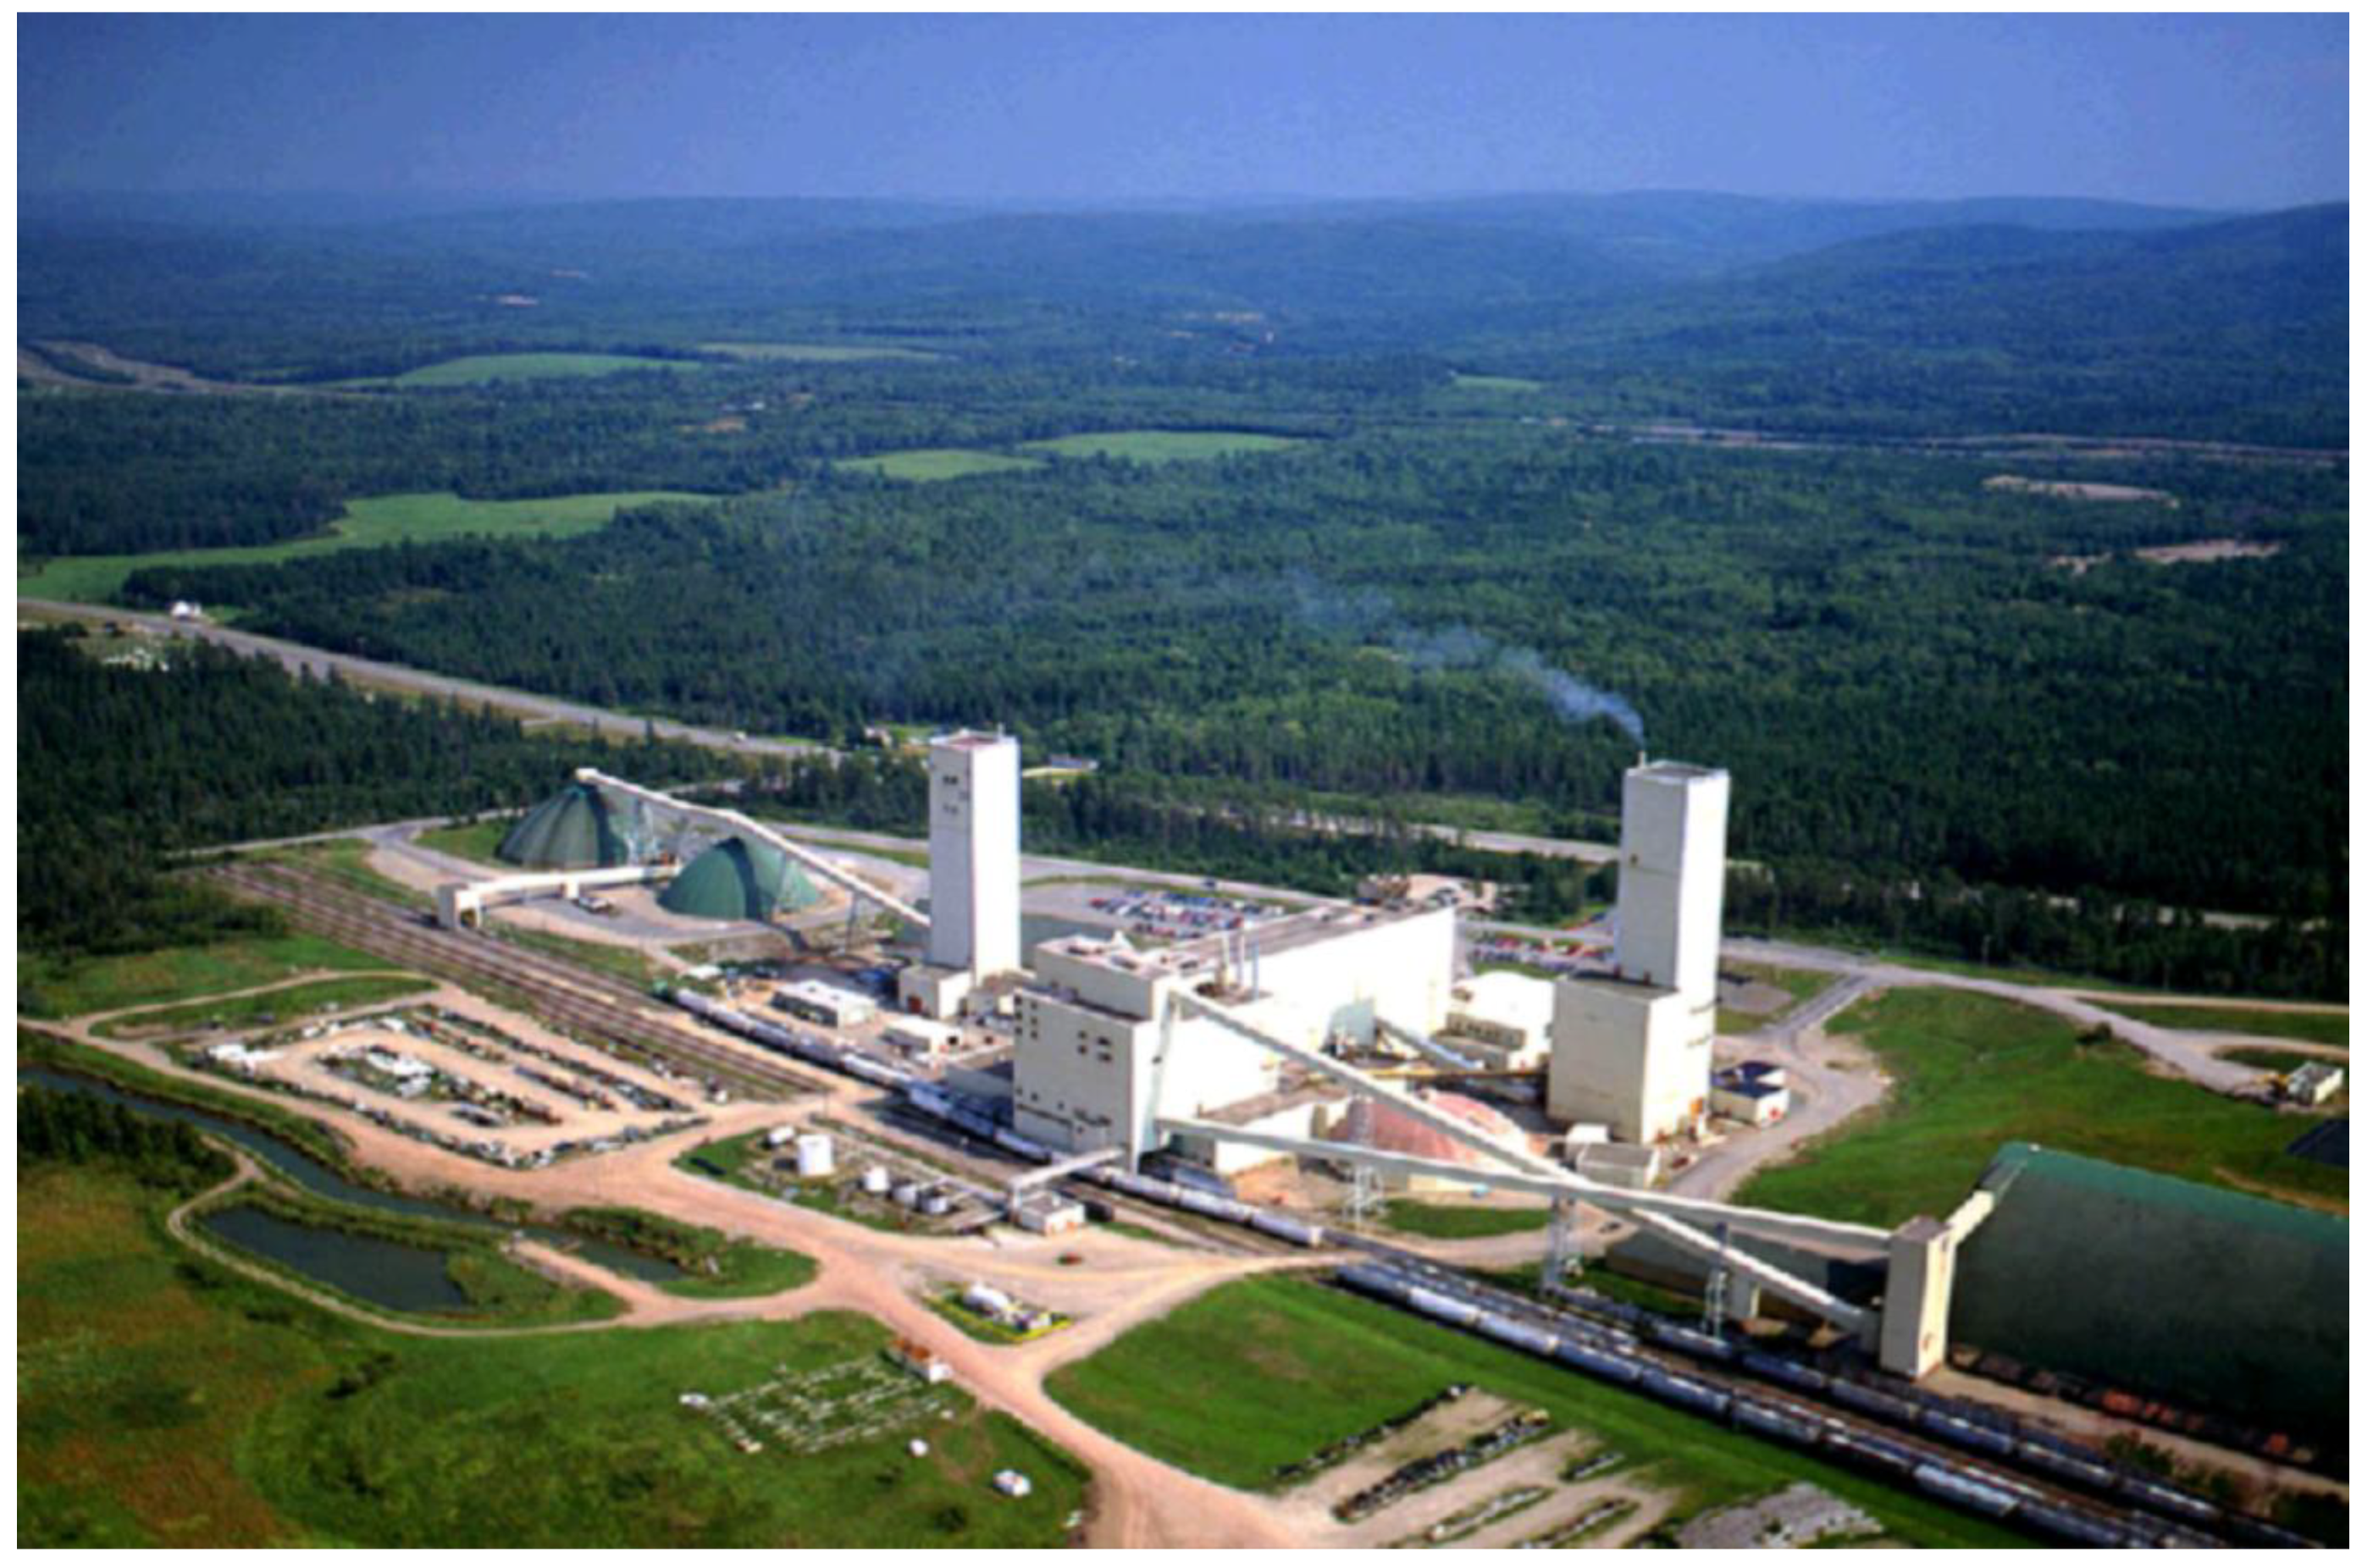
The leveling monitoring network with distances between leveling monuments of approximately 200–300 m has a necessary density to determine the surface subsidence. The aerial view of the investigated area is shown in Figure 2.
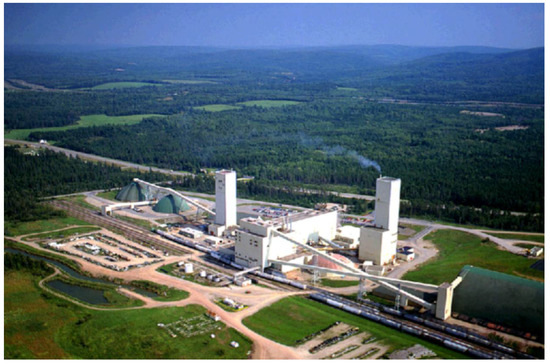
Figure 2.
Aerial view of the investigated area.
Mining extraction of halite was done at two levels. In 1996, the extraction of halite in the upper level was completed. The mining of the lower level started in 2013. Locations of the GPS monuments selected for the analysis of session duration were not affected by the extraction effects, since they are located outside of the deformation zone.
4. GPS Session Duration
GPS session duration in deformation studies is still underestimated and is usually too short in practice. The optimal session duration improves the economy of the deformation surveys while ensuring the required accuracy. Over the last few decades, the investigation of the influence of GPS session duration, baseline length, and seasonal variations on the accuracy of coordinates has been performed by many researchers; examples can be found in [16,17,18,19]. In 2005, a study of evaluation of session duration was performed in open pit mines by [20]. The findings of the study showed that a longer session length improves the quality of results, especially for the baselines with height differences larger than 100 m. The results indicated that the quality of GPS solutions deteriorates with the increase in height difference between the baseline stations and that the tropospheric delay is one of the dominant error sources. In the areas of open pit mines, where the height difference between the GPS reference station and the rover receiver can reach up to several hundred meters, the main limiting factor of the accuracy of height determination is the tropospheric delay [4].
In the presented results, in order to satisfy the requirement of achieving an accuracy of 10 mm in the determination of horizontal displacements, the optimal duration of GPS observation sessions has been determined. The main concern in the choosing of the optimal session duration was the determination of the horizontal coordinates with accuracy better than 10 mm at 95% confidence level. The evaluation has been performed on GPS sessions of different durations, ranging from two to twenty-four hours, in the area affected by underground extraction of salt and potash. The investigated GPS site was 3 km wide and 8 km long in a rural area with a high density of forestation of conifer and leaf trees (Figure 2). The terrain in the investigated area was practically flat with maximum height elevation changes of approximately 40 m. The GPS monitoring network consisted of 90 deformation monuments and 10 control monuments. The shortest GPS baseline was approximately 300 m long, while the longest baseline was 9000 m long. GPS baselines from the 2013 monitoring campaign are shown in Figure 3.
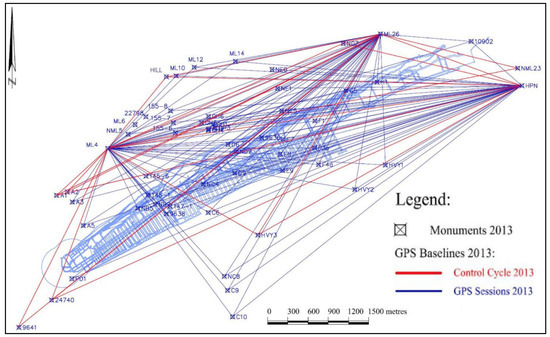
Figure 3.
2013 GPS control and GPS deformation networks.
4.1. Determination of the Optimal Duration of GPS Session
The analysis of GPS session duration for surface deformation monitoring above the underground salt extraction was performed using GPS sessions with durations of twenty-four hours on control network monuments. The GPS data were collected by Novatel DL-4 and DLV3 L1/L2 receivers, with continuous data acquisition over the time of 18 days. The observations were collected with 10 s intervals. The height differences between receivers were no greater than 40 m. An elevation mask of 15 degrees was used. This is a standard elevation cutoff commonly used to avoid multipath errors and errors caused by poor satellite geometry [21].
In order to determine the optimal observation time for GPS sessions, a baseline between control points HPN and ML4 was selected for the analysis. The GPS observations on points HPN and ML4 were collected in sessions with durations of twenty-four hours. Point HPN serves as the main control point, located outside the deformation zone. The twenty-four-hour sessions of the HPN-ML4 baseline were divided into segments of two, three, four, six, eight, and twelve hours duration. In the two-hour segment, the spread of coordinates from 73 sessions was analyzed. In the three-hour segment, the spread of coordinates from 58 sessions was analyzed. In the four-hour segment, the spread of coordinates from 29 sessions was analyzed. In the six-hour segment, the spread of coordinates from 24 sessions was analyzed. In the twelve-hour segment, the spread of coordinates from 13 sessions was analyzed. In the twenty-four-hour segment, the spread of coordinates from 18 sessions was analyzed. Figure 3 shows the GPS monitoring network for 2013. Baselines marked in red belong to the GPS Control Network. Baselines marked in blue represent the observations from GPS Control Network points to GPS Deformation Network points.
All processed solutions have used the L1 and L2 frequency. The tropospheric model used was the Saastamoinen model [22] after Bond [4] findings that the Hopfield and Saastamoinen tropospheric models perform the best and are very similar. The Saastamonien model can be written as:
where:
ε—elevation angle, T—surface temperature (Kelvin), and e—partial water vapor pressure (millibars).
Table 1 shows the HPN-ML4 baseline characteristics.

Table 1.
GPS baseline HPN-ML4.
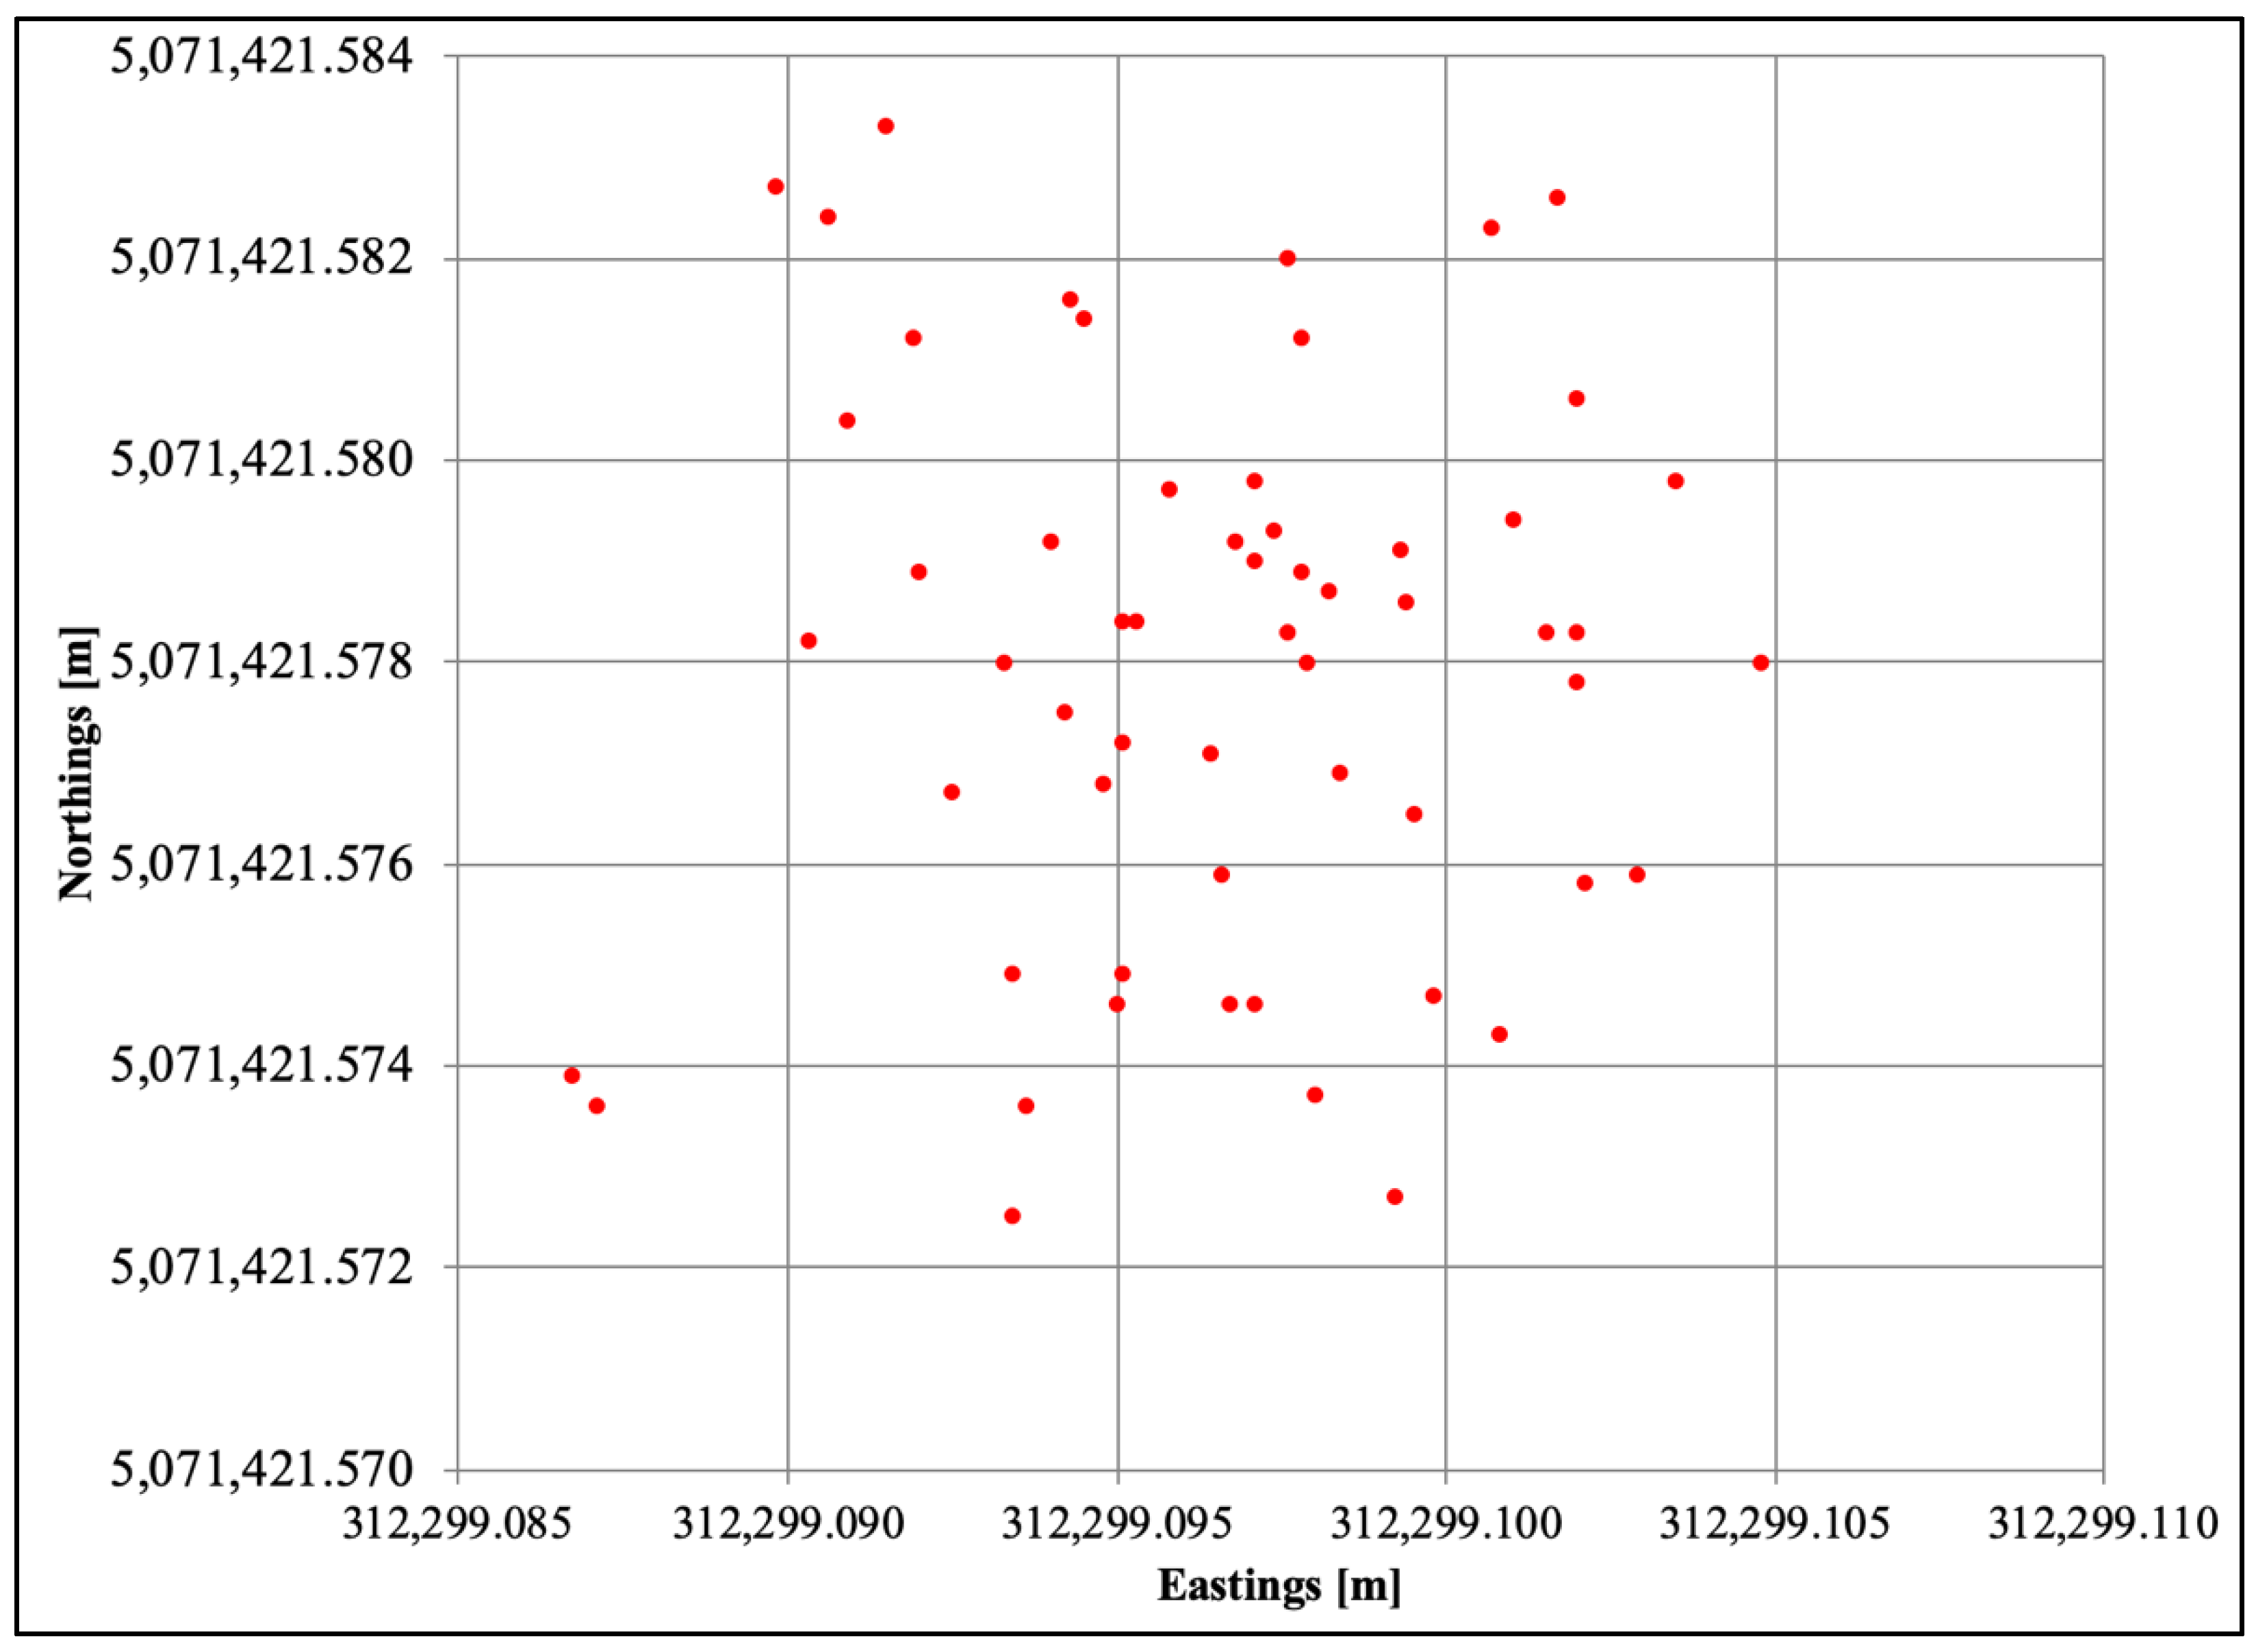
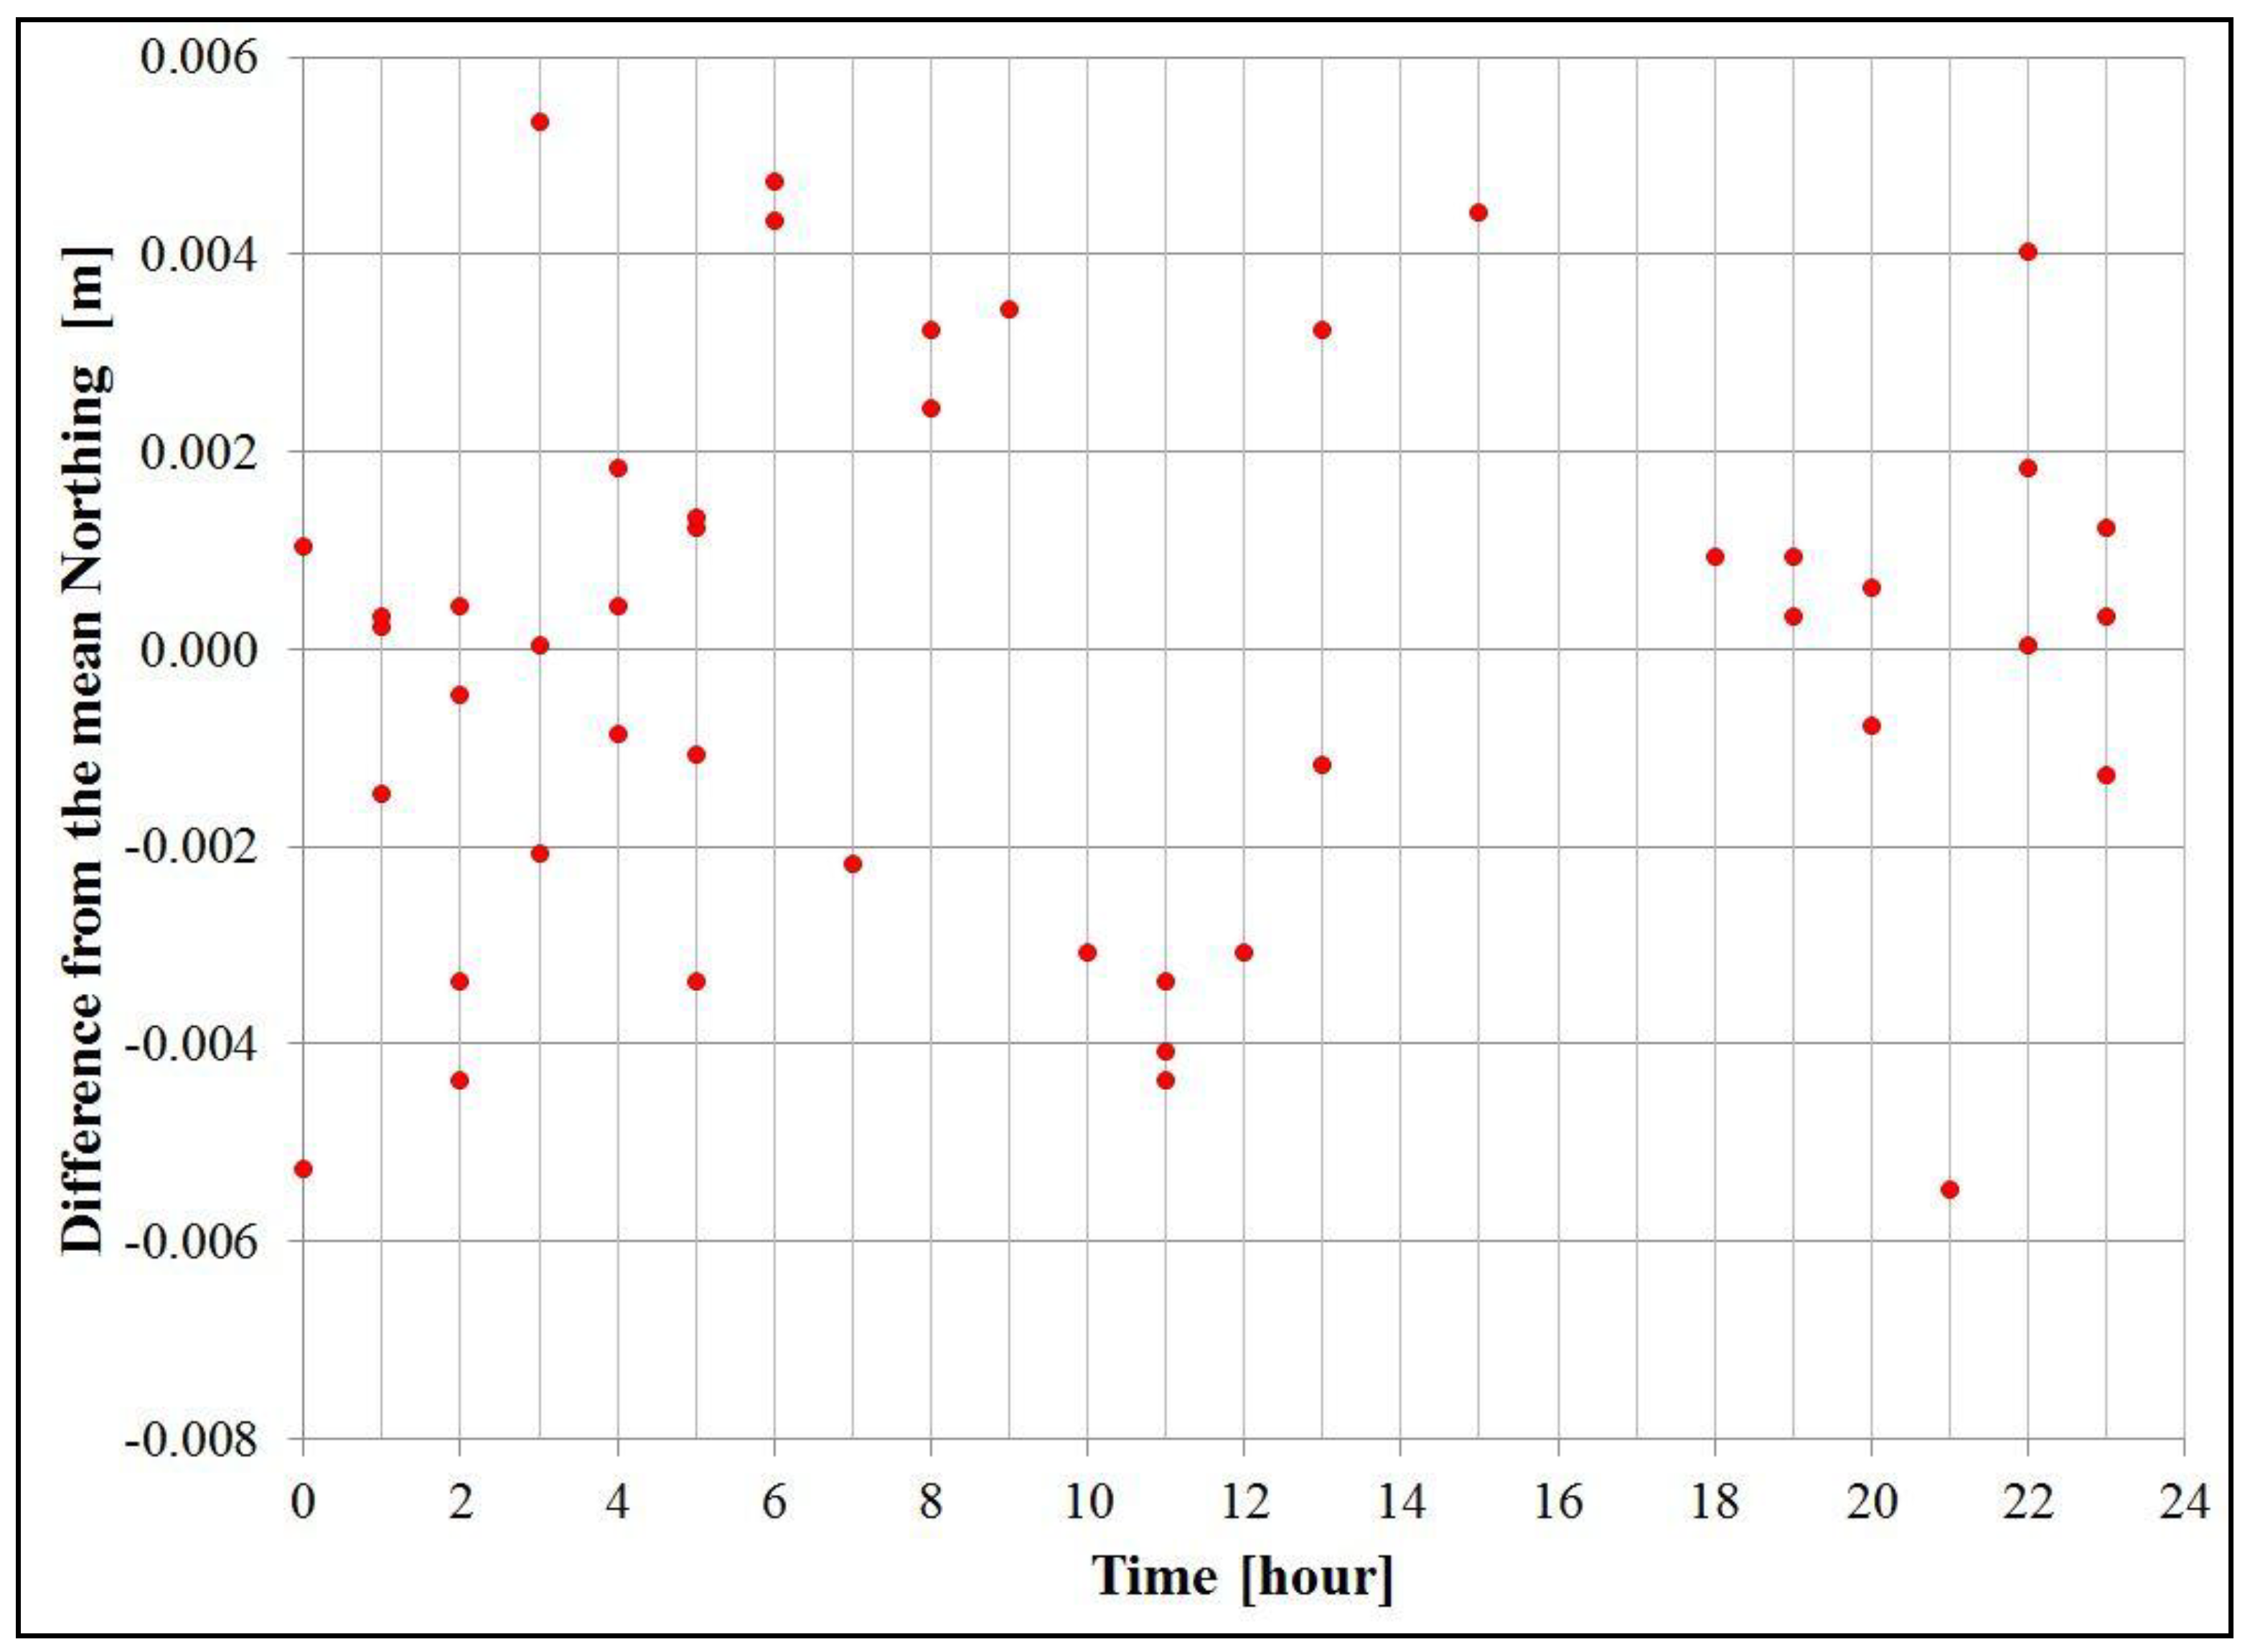
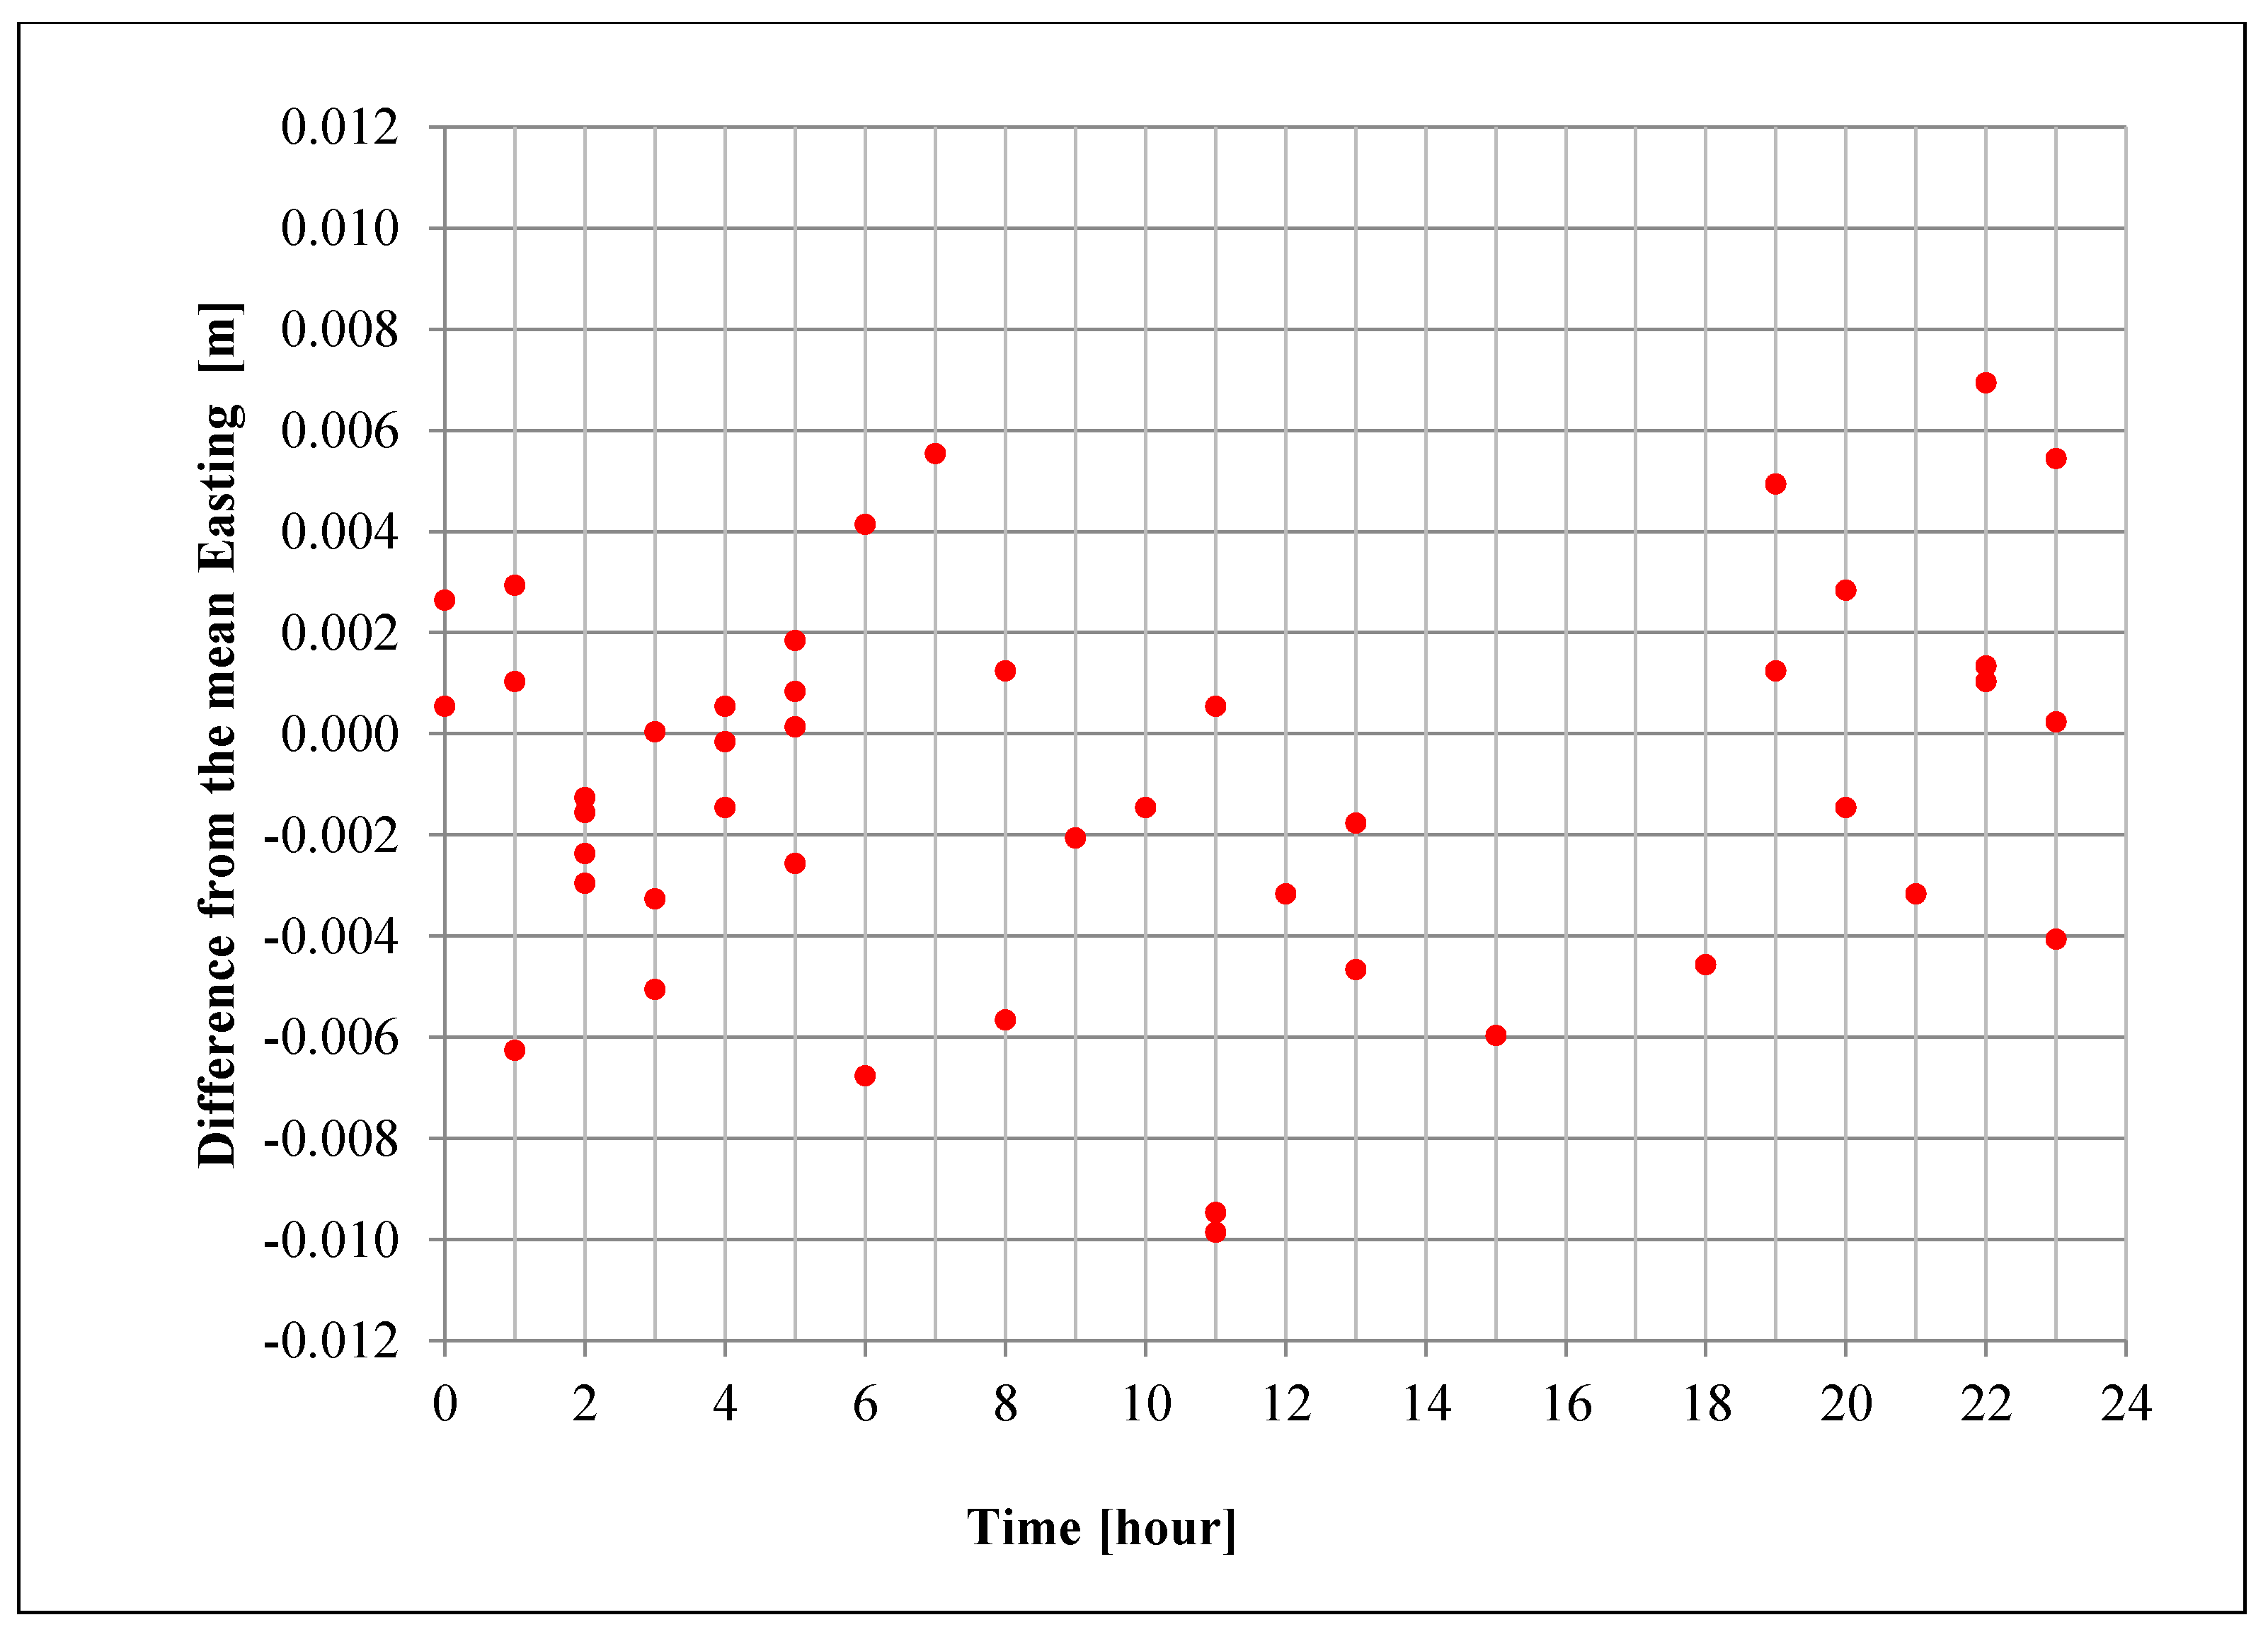
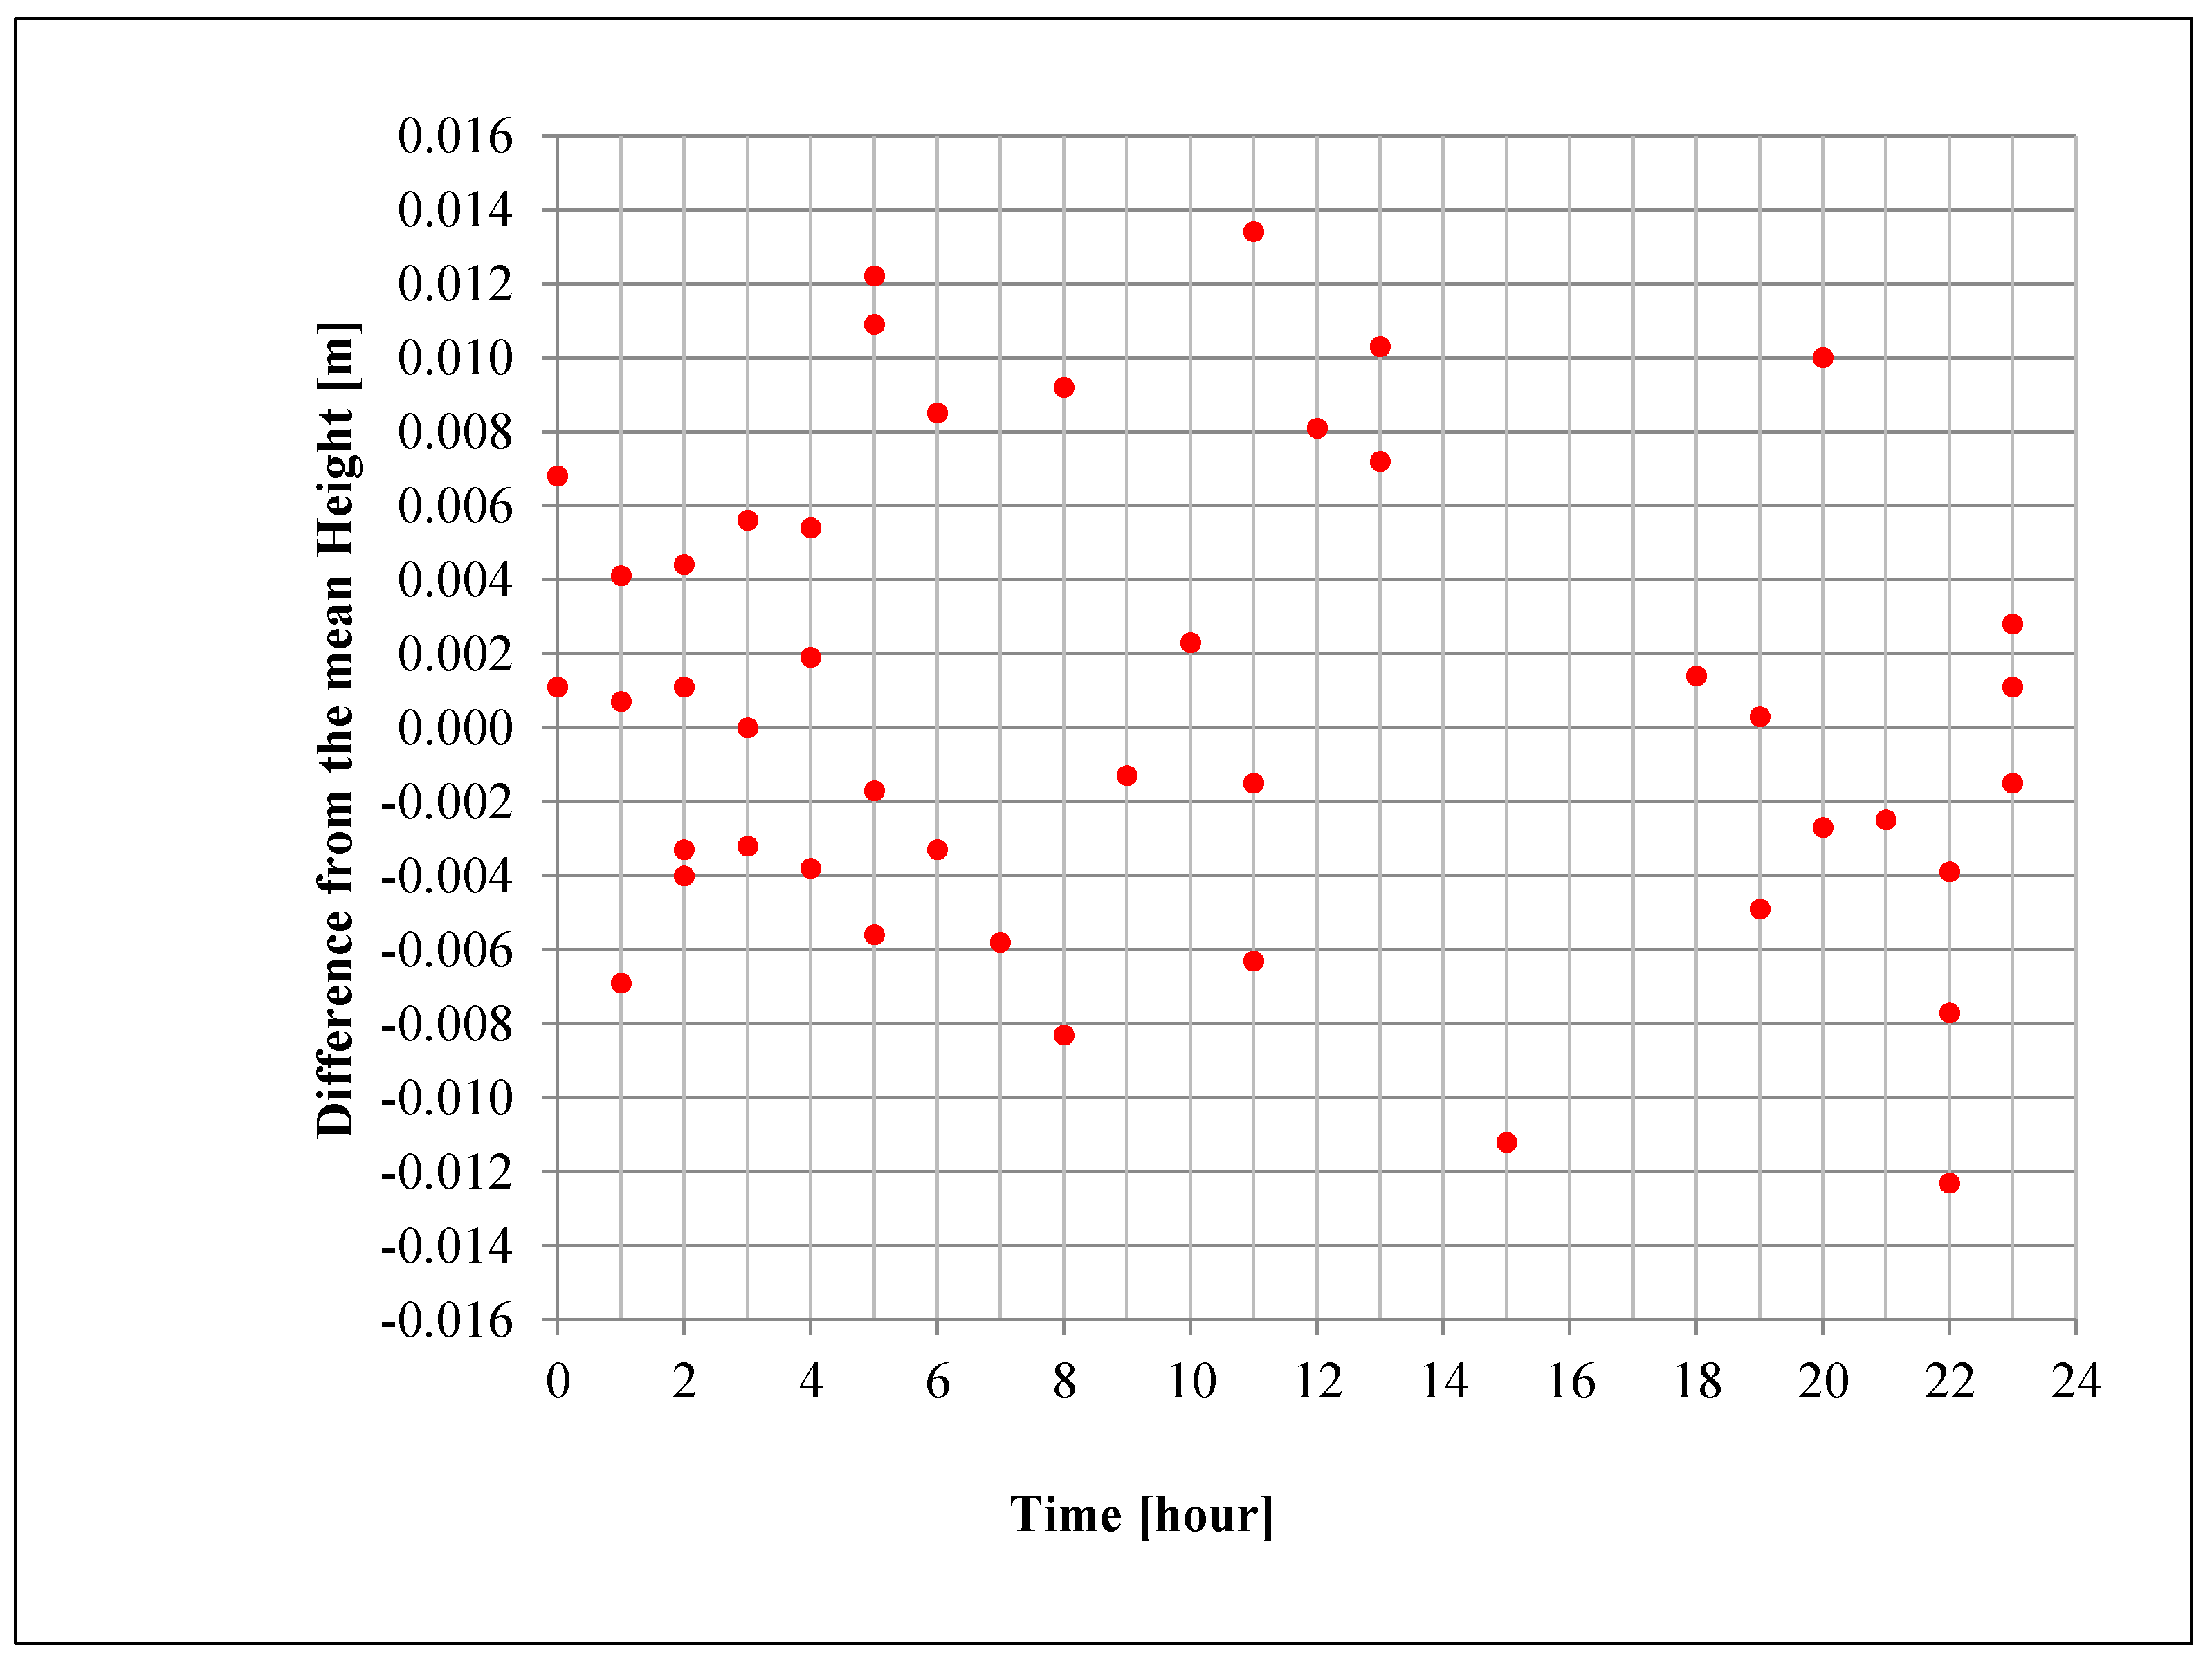
The Northing and Easting coordinates of point ML4 from the three-hour long sessions are shown in Figure 4. In total, 58 three-hour long sessions were analyzed. The spread of Northing coordinates from the mean value is shown in Figure 5. The spread of Easting coordinates from the mean value is shown in Figure 6. The spread of Height coordinates from the mean value is shown in Figure 7. The spread between the maximum and minimum Northing coordinates is 11 mm. The spread between the maximum and minimum Easting coordinates is 18 mm. The spread between the maximum and minimum Height coordinates is 28 mm. The accuracies of coordinates at the 95% level are listed in Table 2.

Figure 4.
Coordinates of point ML4—three-hours long sessions.
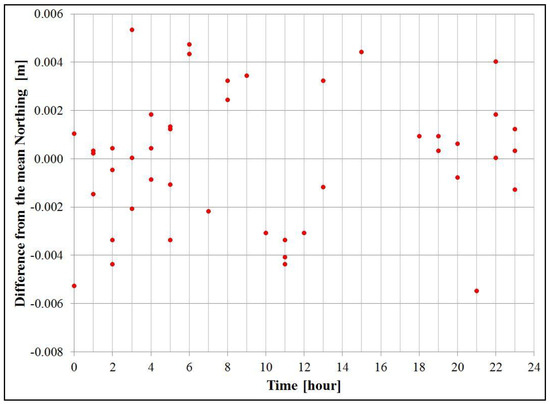
Figure 5.
Point ML4—Spread of the Northing coordinates from the mean value—three-hour long sessions.
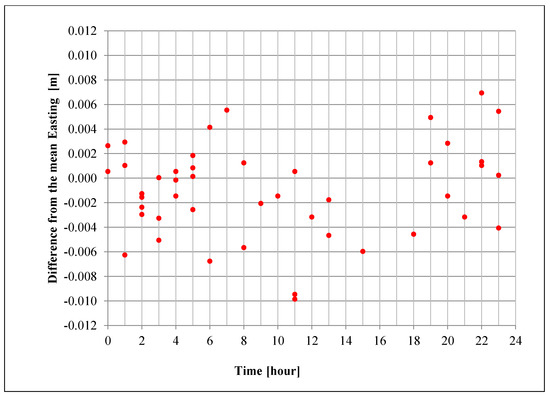
Figure 6.
Point ML4—Spread of the Easting coordinates from the mean value—three-hour long sessions.
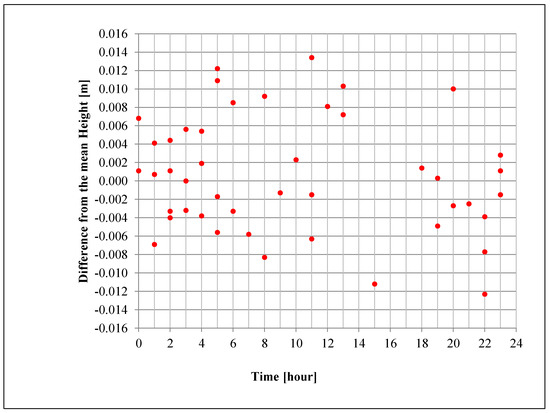
Figure 7.
Point ML4—Spread of the Height coordinates from the mean value—three-hour long sessions.
Table 2.
Comparison of session lengths and respective accuracies at 95% level.
Table 2 shows the comparison of achievable accuracies of single point positioning of point ML4 using GPS surveys with respect to session length. The Northing, Easting, and Height accuracies are at 95% confidence level.
The analysis of the optimal session duration leads to the conclusion that in order to achieve the sub-cm accuracy of horizontal coordinates at 95% confidence level, the GPS session length should be at least three hours long. In order to achieve the sub-cm accuracy of the height coordinate at 95% confidence level, the GPS session length should be at least twelve hours long.
4.2. Verification of Session Duration
In order to verify the GPS session duration, 29 GPS sessions of three-hour duration of baseline HPN-ML26 were analyzed, as seen in Figure 8. Table 3 shows the characteristics of the analyzed GPS baselines. Figure 2 shows the HPN-ML26 baseline. Table 4 shows the average coordinates of point ML26 from 29 observation sessions with the corresponding standard deviations. In conclusion, the three-hour long GPS session is long enough to determine the horizontal coordinates of points with an accuracy of 10 mm or better at 95% confidence level.
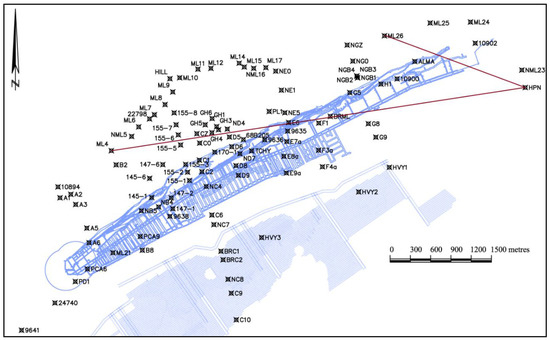
Figure 8.
HPN-ML4 and HPN-ML26 baselines.
Table 3.
GPS baseline HPN-ML26.
Table 4.
Coordinates and respective accuracies at 95% level of point ML26.
5. Conclusions
The accuracy of the monitored surface deformations should allow for the detection of at least one third of the expected maximum deformations over the desired time span at the 95% probability level. In surface deformation studies in mining areas, 10 mm accuracy at 95% level in both vertical and horizontal displacements is typically required. The analysis of 58 three-hour long sessions of baseline HPN-ML4 indicated the accuracy of Northing and Easting coordinates of point ML4 as 6 and 8 mm, respectively. The achieved horizontal accuracy of Northings and Eastings of point ML26 after analysis of 29 three-hour long sessions of HPN-ML26 baseline was 4 and 4 mm, respectively. The accuracy of 8 mm for the height component of point ML4 was achieved in twelve-hour long GPS sessions of HPN-ML4 baseline. The analysis of the optimal session duration leads to the conclusion that in order to achieve the sub-cm accuracy of horizontal coordinates at 95% confidence level, the GPS session length should be at least three hours long. In order to achieve the sub-cm accuracy of the height coordinate at 95% confidence level in a single observation session, the GPS session length should be at least twelve hours long.
Author Contributions
Equal contributions by all authors.
Funding
Publication of this research is possible by grant nr 049u/0098/19 from the Faculty of Geoengineering, Mining and Geology, Wrocław University of Science and Technology, Wrocław, Poland
Conflicts of Interest
The authors declare no conflict of interest.
References
- Chrzanowski, A. Interdisciplinary Approach to Deformation Monitoring and Analysis. In Presented Papers of the Working Group Sessions, International Union of Surveying and Mapping; Int. Soc. for Photogrammetry and Remote Sensing: Washington, DC, USA, 1993; pp. 9–19. [Google Scholar]
- Chrzanowski, A.; Bazanowski, M. Design and Implementation of Ground Monitoring Scheme at PCS Picadilly Mine in New Brunswick, Report submitted to Potash Corporation of Saskatchewan - New Brunswick Division. Internal report, unpublished. 2011. [Google Scholar]
- Chrzanowski, A.; Chen, Y.Q.; Leeman, R.; Leal, J. Integration of the Global Positioning System with geodetic leveling surveys in ground subsidence studies. In Proceedings of the 5th International (FIG) Symposium on Deformation Measurements and 5th Canadian Symposium on Mining Surveying and Rock Deformation Measurements, Fredericton, NB, Canada, 6–9 June 1988; Chrzanowski, A., Wells, W., Eds.; pp. 142–155. [Google Scholar]
- Bond, J. An Investigation on the Use of GPS for Deformation Monitoring in Open Pit Mines; Department of Geodesy and Geomatics Engineering Technical Report No. 222; University of New Brunswick: Fredericton, NB, Canada, 2004; p. 140. [Google Scholar]
- Bond, D.J. Bringing GPS into Harsh Environments for Deformation Monitoring; Department of Geodesy and Geomatics Engineering Technical Report No. 253; University of New Brunswick: Fredericton, NB, Canada, 2007. [Google Scholar]
- Rizos, C. Principles and Practice of GPS Surveying. 2001. Available online: http://www.gmat.unsw.edu.au/snap/gps/gps_survey/principles_gps.htm (accessed on 20 February 2014).
- Khan, F.A.; Rizos, C.; Dempster, A.G. Locata Performance Evaluation in the Presence of Wide-and Narrow-Band Interference. J. Navig. 2010, 63, 52. [Google Scholar] [CrossRef]
- Teunissen, P.J.G.; Montenbruck, O. (Eds.) Springer Handbook of Global Navigation Satellite Systems; Springer: New York, NY, USA, 2017; ISBN 978-3-319-42926-7. [Google Scholar]
- Bond, J.; Chrzanowski, A.; Kim, D. Bringing GPS into Harsh Environments for Deformation Monitoring. GPS Solut. 2008, 12, 1–11. [Google Scholar] [CrossRef]
- Kleusberg, A.; Langley, R.B. The Limitations of GPS. GPS World, Vol.1, No.2. March/April 1990; 50–52. [Google Scholar]
- Seeber, G. Satellite Geodesy, Foundations, Methods, and Applications; Walter de Gruyter: Berlin, Germany, 1993. [Google Scholar]
- Hofmann-Wellenhof, B.; Lichtenegger, H.; Collins, J. Global Positioning System: Theory and Practice, 5th ed.; Springer: New York, NY, USA, 2001. [Google Scholar]
- Satirapod, C.; Rizos, C. Multipath Mitigation by Wavelet Analysis of GPS Base Station Applications. Surv. Rev. 2005, 38, 2–10. [Google Scholar] [CrossRef]
- Bazanowski, M.; Szostak-Chrzanowski, A. Salt Rock Deformations Caused by Mining Activity; Faculty of Geoengineering, Mining and Geology, Wrocław University of Science and Technology: Wrocław, Poland, 2016; p. 157. ISBN 978-83-942205-6-3. [Google Scholar]
- Strode, P.R.R.; Groves, P.D. GNSS Multipath Detection using Three-frequency Signal-to-noise Measurements. GPS Solut. 2016, 20, 399–412. [Google Scholar] [CrossRef]
- Eckl, M.C.; Snay, R.A.; Sole, T.; Cline, M.W.; Mader, G.L. Accuracy of GPS-derived Relative Positions as a Function of Interstation Distance and Observing-Session Duration. J Geod. 2001, 75, 633–640. [Google Scholar] [CrossRef]
- Berber, M.; Ustun, A.; Yetkin, M. Comparison of Accuracy of GPS Techniques. Measurement 2012, 45, 1742–1746. [Google Scholar] [CrossRef]
- Firuzabadi, D.; King, R.W. GPS Precision as a Function of Session Duration and Reference Frame Using Multi-Point Software. GPS Solut. 2012, 16, 191–196. [Google Scholar] [CrossRef]
- Dogan, U.; Uludag, M.; Demir, D.O. Investigation of GPS Positioning Accuracy During the Seasonal Variation. Measurement 2014, 53, 91–100. [Google Scholar] [CrossRef]
- Bond, J.; Chrzanowski, A.; Wilkins, R. Using GPS for Augmenting Deformation Monitoring System in Open Pit Mines–Problems and Solutions. Geomatica 2015, 59, 73–82. [Google Scholar]
- Wells, D.E.; Beck, N.; Delikaraoglou, D.; Kleusberg, A.; Krakiwsky, E.J.; Lachapelle, G.; Langley, R.B.; Nakiboglu, M.; Schwarz, K.P.; Tranquilla, J.M.; et al. Guide to GPS Positioning; Canadian GPS Associates: Fredericton, NB, Canada, 1987; ISBN 0-920-114-73-3. [Google Scholar]
- Saastamoinen, J. Atmospheric correction for the troposphere and stratosphere in radio ranging of satellites. Use of artificial satellites for geodesy. In Geophysical Monograph 15; American Geophysical Union: Washington, DC, USA, 1972. [Google Scholar]


© 2019 by the authors. Licensee MDPI, Basel, Switzerland. This article is an open access article distributed under the terms and conditions of the Creative Commons Attribution (CC BY) license (http://creativecommons.org/licenses/by/4.0/).