1. Introduction
Nowadays, the development of renewable energy has been attracting increasing global attention. It has become the consensus of all countries to adopt certain renewable energy incentive mechanisms to guide and promote the development of renewable energy sources (RES) [
1]. Feed-in tariff (FIT) has been adopted in China for many years, which has greatly promoted the development of RES [
2,
3,
4]. However, there are still some problems in FIT, of which the most worrying one is the heavy subsidy burden on the government. In order to solve this problem, the Chinese government has been actively exploring new incentive mechanisms to further boost the development of RES, in recent years. Feed-in premium (FIP) and renewable portfolio standard (RPS) have gradually gained attention from the perspective of the government, as well as scholars, both of which are regarded as potential future policy instruments for the power sector in China [
5]. Compared to FIT, FIP introduces a certain degree of market competition, which is a transitional mode through which to gradually encourage renewable energy to join the market. Under the typical RPS rules, on the other hand, electricity retailers are required to meet a minimum level for the consumption of renewable energy [
6,
7]. The implementation of RPS is closely combined with the Renewable Energy Certificate (REC), which serves as an effective tool to record the production, actual consumption, and transaction of renewable energy power [
8]. Both FIP and RPS are regarded as effective mechanisms to control costs and promote the sustainable development of renewable energy [
9].
FIT has been adopted in China since 2006, and it has brought rapid development in the promotion of the renewable-generation capacity. However, developing renewable energy by subsidy policies like FIT has caused heavy financial burdens for the Chinese government and mandatory RPS seems to be the more feasible option [
8]. As a result, China has oriented towards the revolution for a renewable incentive mechanism from FIT to RPS. The policy paper of RPS issued by China’s National Energy Administration on 15 May 2019 indicated that RPS is the ultimate renewable-energy incentive mechanism [
10]. The implementation of RPS could make a significant impact on the market structure, market behaviour, and economic performance of China’s electricity market [
11]. However, the abrupt transformation from FIT to RPS without any transitions might cause problems including lack of incentives for market participants and a high market risk, and could consequently introduce potential unstable factors to the power market. FIP, which is one of the market mechanisms based on FIT, could increase the flexibility of the mechanism and could play an important role in the transitional period. It also has great advantages in providing incentives to investors for an optimal choice of renewable technologies and locations.
At present, FIT and RPS still remain the two most popular policies for fostering electricity generated from renewable energy sources (RES) [
12,
13]. FIT originated in Germany while RPS has been widely adopted in various states in the United States, with different detailed rules [
14]. It is generally believed that FIT and RPS play different roles in promoting the development of RES. For instance, in [
14] and [
15], a linear dynamic programming model and fixed-effects regression model were employed, respectively, demonstrating that FIT is more effective in the stimulation deployment capacity of RES for electricity. Additionally, it was illustrated through an empirical analysis in [
16,
17,
18] that FIT performs better than RPS in the impact of cumulative development for wind capacity and has better long-term effects in promoting wind capacity. On the other hand, it has been suggested in [
19] that the RPS appears to have a better performance over FIT in strengthening the market growth of RES, particularly biomass and solar photovoltaic (PV), despite its higher market risks for smaller suppliers. In South Korea, particularly, with the introduction of RPS, PV capacity increased dramatically from 359.4 MW in 2011 to 727.1 MW in 2013. Furthermore, in [
20] and [
21], system dynamics (SD) and scenario analysis were applied to establish long-term development models for the development of the wind and the biomass industry, respectively, in the perfect competitive market, demonstrating that the implementation of RPS could better promote long-term and rapid development of the biomass power industry in China, as compared to FIT. Moreover, it was illustrated in [
22] that FIT was more efficient than RPS in increasing the installed capacity of renewable energy and in reducing costs. On the other hand, RPS is more efficient in reducing carbon emissions and in improving the consumer surplus.
It is obvious that the implementation of both FIT and RPS has their own advantages, and many countries have also made a policy transition either from FIT to RPS or from RPS to FIT [
23]. For instance, South Korea experienced a drastic shift from FIT to RPS in 2012, with increased technical change of most renewable-energy types [
24,
25]. However, Japan made an official evolution from RPS to FIT in 2012, to ensure that renewable-energy generation is carried out in a cost-effective manner [
26,
27]. Moreover, in order to produce the complementary effect, some scholars have also jointly studied the two mechanisms and explored the design for a joint FIT-RPS renewable energy incentive mechanism. It is demonstrated in [
28] that a consolidated “RPS-FIT” can offer many benefits, including reaching a broader segment of the market, offering more robust planning, as well as sending a stronger signal of public endorsement for renewable energy. It is also indicated in [
29] that a combined mechanism of RPS and FIT can promote the fast development for the wind industry in China by establishing a SD model for long-term wind power development. A complementary mode of FIT and RPS is established in [
30], which is aimed to provide a stable environment of allowing FIT and RPS to work corporately. Besides, it is proposed in [
31] that the interaction of FIT and RPS can help meet certain RES development targets, such as supporting new project financing, focusing on “reasonable-cost” renewables and hedging against project delays.
Over the years, the significant role which FIT played in promoting the global development of RES should not be neglected. However, due to its disadvantage in lacking a response to market competition as well as insufficient contribution to technological progress and cost reduction, some countries have begun to consider adopting FIP. In 1998, a dual-track renewable energy incentive mechanism was introduced in Spain, with options between FIT and FIP for renewable energy power producers. Besides, FIP was adopted early in the German market from 2012 and has successfully increased participation in direct marketing and established incentives for demand-oriented production [
32,
33,
34]. It is pointed out in [
35] that the main advantage of the FIP, in comparison to FIT, is that it is integrated in the electricity market system; therefore, it follows the demand pattern and encourages RES production during peak hours. It is also illustrated in [
36] that FIP can provide incentives to investors for an optimal choice of renewable technologies and locations, while FIT cannot. An optimization framework is introduced in [
37], which simulated and analyzed the impact of implementing different FIP (generation- or capacity-based) wind support schemes on the development of an offshore grid. In summary, numerous studies are embarked on the mechanism design and effect of FIT and RPS which are implemented respectively or jointly. However, up to now, there are limited researches which explore the effect of implementing FIP-RPS to the development of renewable energy in China. It is still not clear how this transition can be carried out smoothly. Therefore, this research is aimed to devise a joint FIP-RPS mechanism and further develop the optimal combination ratio of the two, so as to obtain a socially optimal design.
Based on the above analysis, a comparison between FIP and RPS is presented in this paper, demonstrating their differences in mechanism design and social welfare. Next, according to the pros and cons of both FIP and RPS, a power market equilibrium model with the joint FIP-RPS mechanism is proposed, which provides reference for the design of a renewable energy incentive mechanism in the transitional period of China’s electricity market. Then, the genetic algorithm is applied to solve the model, further obtaining the optimal power generation decision and mixed ratio of the two joint mechanisms. Finally, the model is verified by actual market data, analyzing the implementation effect of the FIP-RPS joint mechanism, which provides a reference for the design of the renewable energy incentive mechanism in China.
The simulation results show that FIP and RPS should be implemented in different development stages for renewable energy according to individual characteristic. Compared with FIP, RPS has better performance in promoting renewable energy generation as well as boosting the total social welfare. As for the market equilibrium price, both FIP and RPS have their advantages during different development stages of renewable energy. On this basis, a power market equilibrium model under the joint FIP-RPS mechanism is proposed, in an attempt to acquire the optimal ratio of the two mechanisms to maximize the total social welfare under different renewable energy quota requirement. The results also indicate that, at different stages of renewable energy development, the joint FIP-RPS mechanism should be combined with different ratios. At the initial development stage, only FIP should be implemented, which can promote the development of renewable energy installed capacity quickly and provide stable price subsidies. With the development of renewable energy sped up, more proportion of RPS should be introduced into the joint FIP-RPS mechanism, so as to better stimulate the vitality of the renewable energy market. The certain degree of FIP-RPS implementations to this energy transition, in the future, would be one of the preferable methods to be implemented to make considerable influences on China’s national energy plan, for the combination of the two mechanisms not only reduces the financial burden of the government, but also plays an active role in the renewable energy market.
2. The Foundation of Market Equilibrium Model under FIP and RPS
According to the plan drafted by the Chinese government for the overall renewable energy development, renewable energy power generation should account for a required quota obligation of
K in the total electricity generation. Whatever kind of renewable energy incentive policy is adopted by the government, its ultimate goal is to make the proportion of renewable electricity generation reach the required quota
K. The quota
K indicates the ultimate goal of renewable energy generation, which is proportional to the total energy generation, and should be set carefully in accordance with the pace of renewable energy development in the whole society. That is, if
K is set too large, too much pressure will be put on the thermal power producers to complete their obligations. On the other hand, if
K is set too small, the incentive mechanism cannot play the role in promoting renewable generation as originally planned. Assuming that there are only two types of power producers in the market, i.e., thermal power producers and renewable energy power producers, the constraints for the renewable energy generation against total energy generation in the power market under both FIP and RPS can be presented as:
where
a and
b represent the number of thermal power producers and renewable energy power producers respectively;
represents the power generated by thermal power producer
i (
i = 1, 2, …,
a);
represents the power generated by renewable energy power producer
j (
j = 1, 2, …,
b). It can be implied from Equation (1) that when the required quota
K reaches 1, i.e., only renewable energy generation is considered, provided that the development of renewable generation reaches a relatively high level. This is consistent with the development goal of renewable energy generation in some developed countries. For example, the Danish government sets the goal of reaching 100% of renewable energy generation by 2050. The principle to determine the optimal required quota
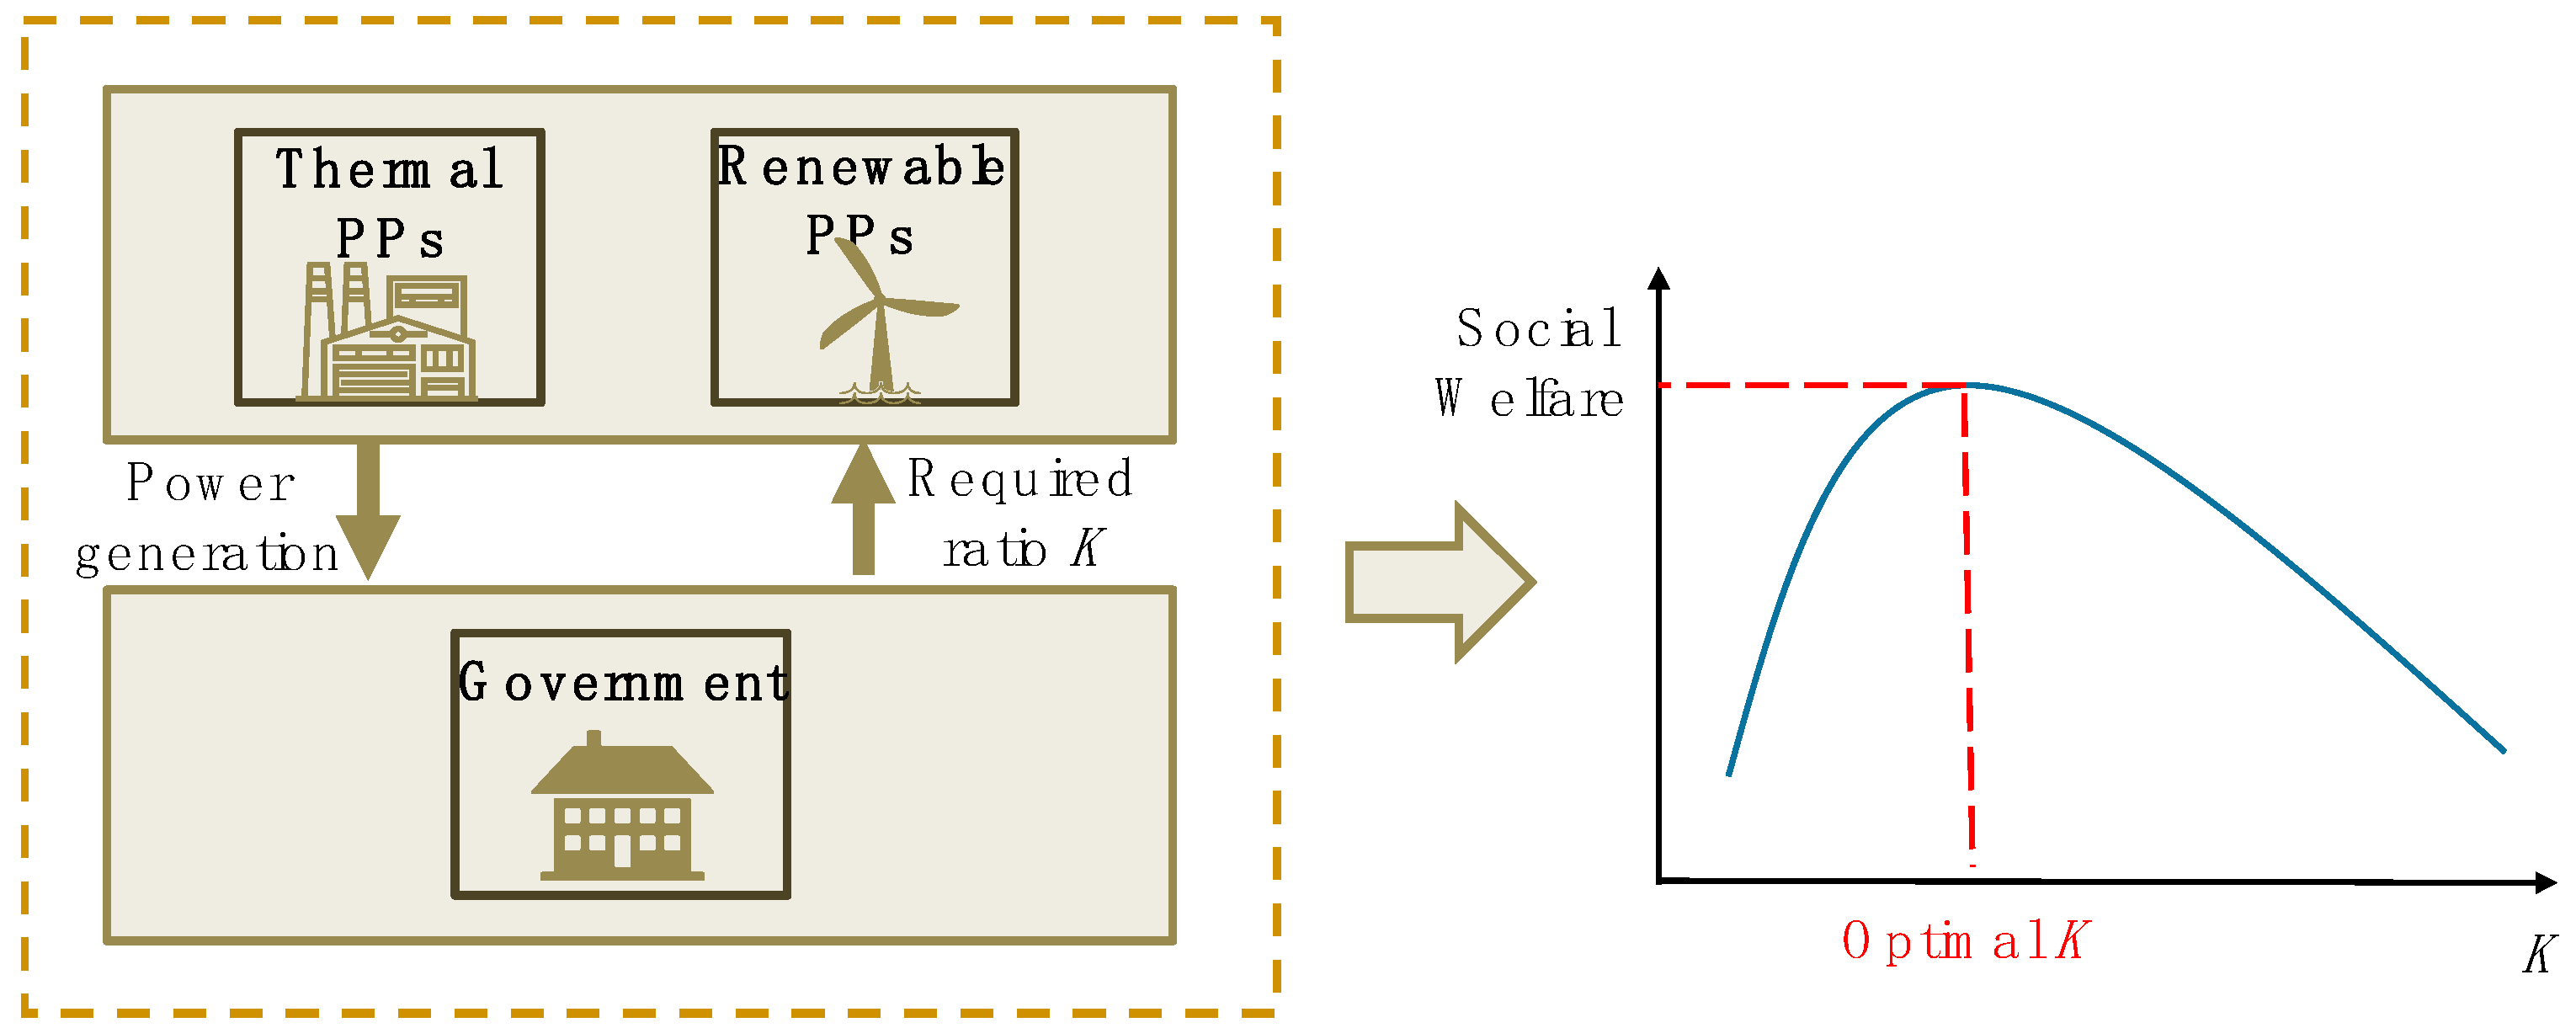
K is shown in
Figure 1, where the PP refers to power producers. It can be indicated that
K is determined by maximizing total social welfare while taking into consideration power generation from both kinds of power producers.
In order to simplify the model, it is assumed that the electricity market is an oligopoly market, where each power producer gains its market share for power generation through market competition. The electricity price is assumed as a linear function with the negative slope of the total power generation. This is in accordance with the fact that when power supply increases, and exceeds power demand, then there will be an imbalance between supply and demand and the electricity price has an intension to drop. Therefore, the electricity price equilibrium can be expressed as:
where
pe is the electricity price when market equilibrium is reached, commonly known as the market clearing price (MCP);
f and
g respectively represent the intercept and slop in the linear electricity price function, which are positive parameters publicly known from historical data [
38].
Assuming that the generation cost is a quadratic function for thermal power producers [
39,
40], while it is a linear function for renewable energy power producers [
41], the costs of the two kinds of producers can be respectively expressed as:
where
Ccoal,i and
Cgreen,j represent the generation costs of thermal power producer
i and renewable energy power producer
j respectively;
dcoal,i,
mcoal,i and
ncoal,i are its cost determination parameters for thermal power producers;
dgreen,j is the fixed cost of renewable energy power producer
j, while
mgreen,j, is its marginal cost for renewable power generation.
Each of the thermal power producers and renewable energy power producers has its own upper and lower output limits, especially for renewable energy power producer. Despite the large installed capacity of the renewable energy generation, due to the uncertainty and fluctuation of renewable energy generation, the maximum output is normally lower than the total installed capacity. The generation output constraints are given as:
where
and
represent the minimum and maximum power generation for thermal power producer
i, respectively;
and
represent the minimum and maximum power generation for renewable energy power producer
j, respectively.
4. Case Studies
In this paper, the actual situation of both power market and green certificate market is considered, and the model is verified based on the following case. In this case, there are four power plants in the electricity market, namely thermal power plants (Q1, Q2) and renewable energy plants (G1, G2), the cost coefficients and upper and lower limits of installed capacity of each power plant are shown in
Table 1. The premium coefficient set by the government under FIP is 0.8, and other parameters related to market prices and social benefits are shown in
Table 2. When using the GA toolbox of MATLAB to obtain the optimized solution, four parameters need to be set in advance, which can usually be set as: population size
N (20~100), termination algebra
m (100~500), crossover probability
pc (0.4~0.99) and mutation probability
pm (0.0001~0.1).
In order to obtain the optimal solution, the above four parameters should be adjusted in advance, namely N, m, pc, and pm. First, when selecting population size N, it can be seen that the larger N is, the faster the convergence rate of the objective function presents, and the better the global performance of the optimal solution can be obtained. On the other hand, the larger N is, the longer the computation time will be. Based on this analysis, N is set as 50 for a compromising selection. Next, when choosing termination algebra m, it can be seen that when GA evolves for about 300 times, the difference of the objective function between the previous and subsequent generations under various parameters is less than 1, and the increase of the number of iterations has an insignificant effect on the reduction of relative error. Therefore, to ensure the accuracy for solution, m is set as 500.
Next, when choosing crossover probability pc, it can be found that a larger pc is conducive to seeking the globally optimal solution, but when the value of pc reaches 0.9 or higher, the structure with high adaptive value will be destroyed quickly and the convergence rate will slow down. As a result, it is possible that only the locally optimal solution can be obtained. On the other hand, when the value of pc is less than 0.7, the search for the optimal solution will come to a stop. Based on the above analysis, the value of pc is eventually set as 0.8. Finally, the mutation probability pm is determined as a minimum value. When pm is too small, it is difficult to obtain the globally optimal solution by finite random selection; therefore pm, is set as 0.1. In conclusion, population size N, termination algebra m, crossover probability pc, and mutation probability pm for the GA optimization are set as 50, 500, 0.8, and 0.1, respectively.
4.1. Validation of Algorithm Rationality
PSO, SA, DE, and GA are all common methods applied in solving complex optimization problems. In order to verify the advantages of GA in solving the model in this paper, the above methods are adopted to solve the market equilibrium model under FIP when
K is set as 0.2. In the process of using different methods to solve the model, the parameters of each model adopted are constantly adjusted according to different solutions. The parameters of GA are given previously, and the parameters of other solving methods are listed as follows: for PSO,
w = 0.9,
c1 =
c2 = 0.1,
dim = 8,
swarmsize = 100,
maxiter = 500,
minfit = 0.001,
vmax = 0.01,
vmin = −0.01,
ub = [0.2, 0.2, 0.2, 0.2, 0.2, 0.2],
lb = [0.01, 0.01, 0.01, 0.01, 0.01, 0.01]; for SA
, N = 2000,
T = 2500,
a = 0.99815,
t0 = 1500; for DE,
Gm = 10000,
F0 = 0.5,
Np = 100,
CR = 0.9,
G = 1,
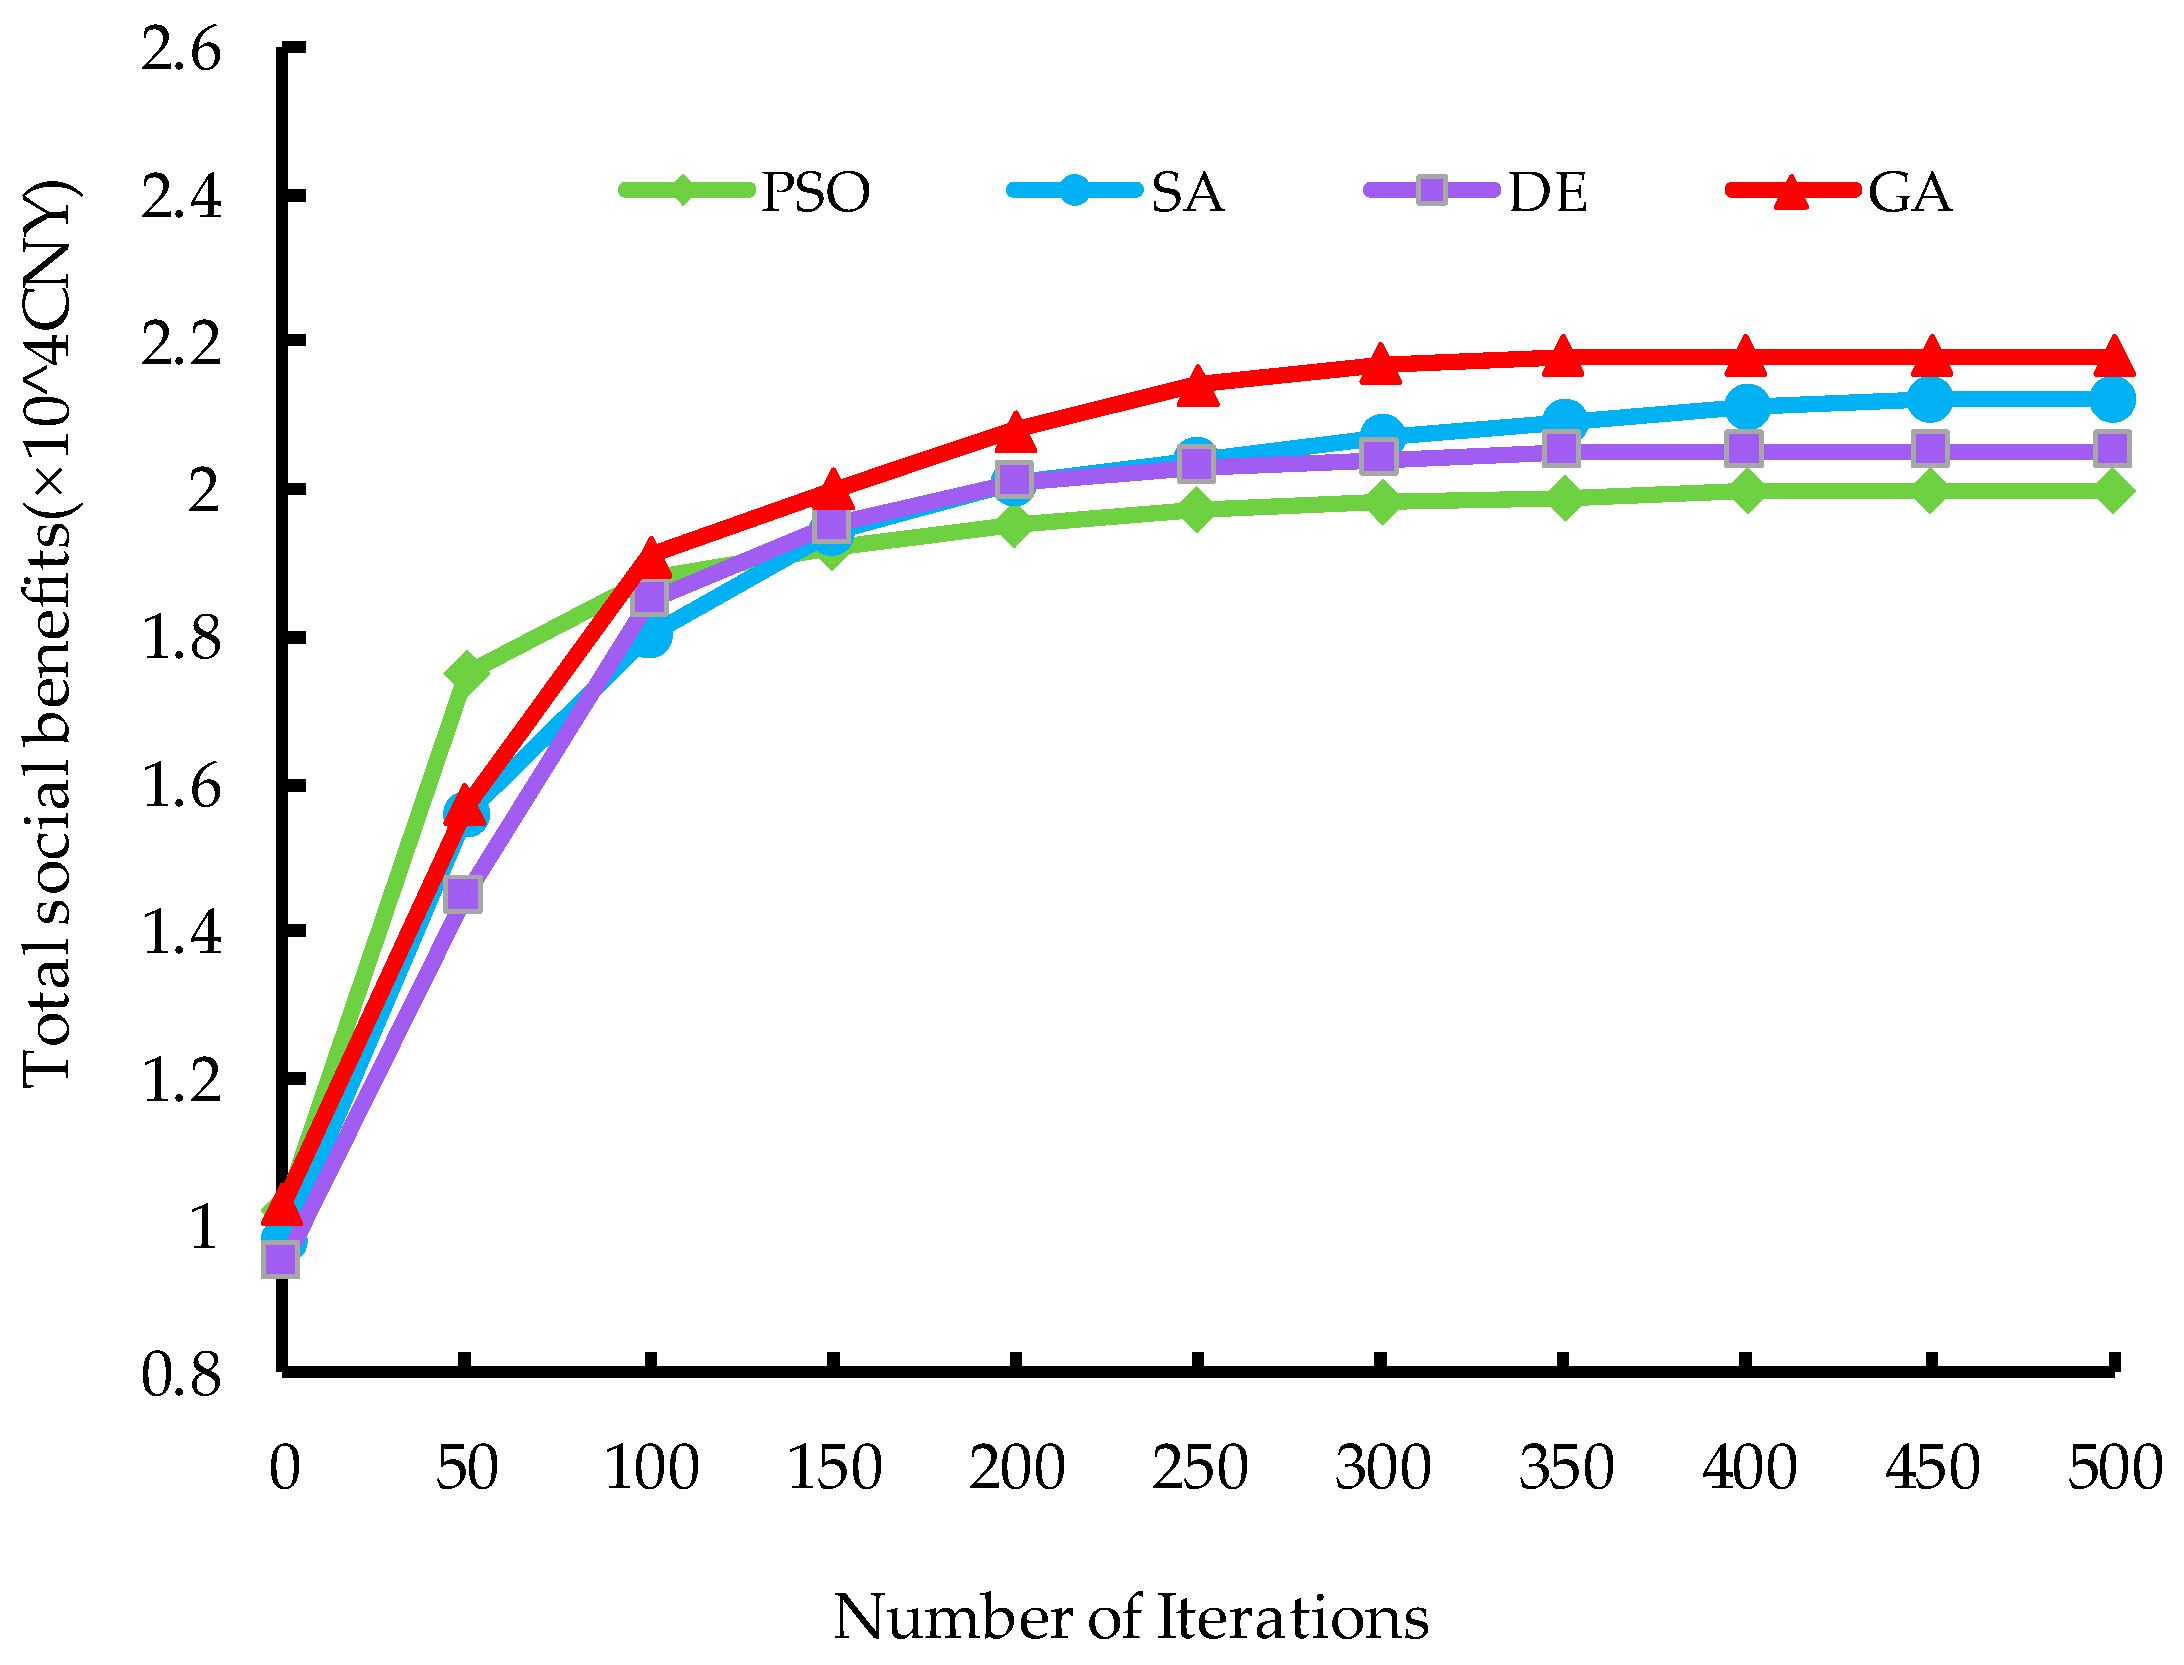
D = 10. Based on the above parameters, the number of iterations and optimization results of each algorithm are obtained. By comparing the optimization results, it can be found that when
m increases from 400 to 500, the optimization results of each solution method are almost constant, and the trend almost remains constant when
m is larger than 500. Therefore, the result of the first 500 iterations is used to make a detailed comparison, as shown in
Figure 2, and the comparison of the performance between each algorithm is presented simultaneously, as shown in
Table 3.
When different solving methods are adopted, the running time required by each method to reach different iteration times is calculated. By testing the calculation time of each solution method, it can be found that the calculation time required by each method is basically the same under the same number of iterations; therefore, the number of iterations can reflect the convergence rate, which expressed in proportion of optimization results at different operation times to final optimization results. As can be seen from
Figure 1 and
Table 3, PSO algorithm has the fastest convergence for the market equilibrium model in this paper, but is inclined only to obtain a locally optimal solution. The optimization result (i.e., total social benefits) of DE algorithm is higher than that of PSO, but still not as high as that of GA. The optimization result of SA is close to GA, but the convergence rate is slower than GA. Through the above comprehensive comparisons of several methods, it can be seen that the convergence speed of GA is higher and it is also better at obtaining the globally optimal solution of this optimization problem. Since the exact analytic solution cannot be obtained by analytic methods, it is difficult to compare the solutions of the four algorithms with the precise solutions to provide error analysis. Besides, the main focus of this article is the market equilibrium model, and GA is the relatively optimal algorithm according to the above comparisons to solve this market equilibrium model. Therefore, GA is selected as the ideal optimization tool to solve the market equilibrium model in the following market simulations.
4.2. The Impact of FIP and RPS on Power Generation under Market Equilibrium
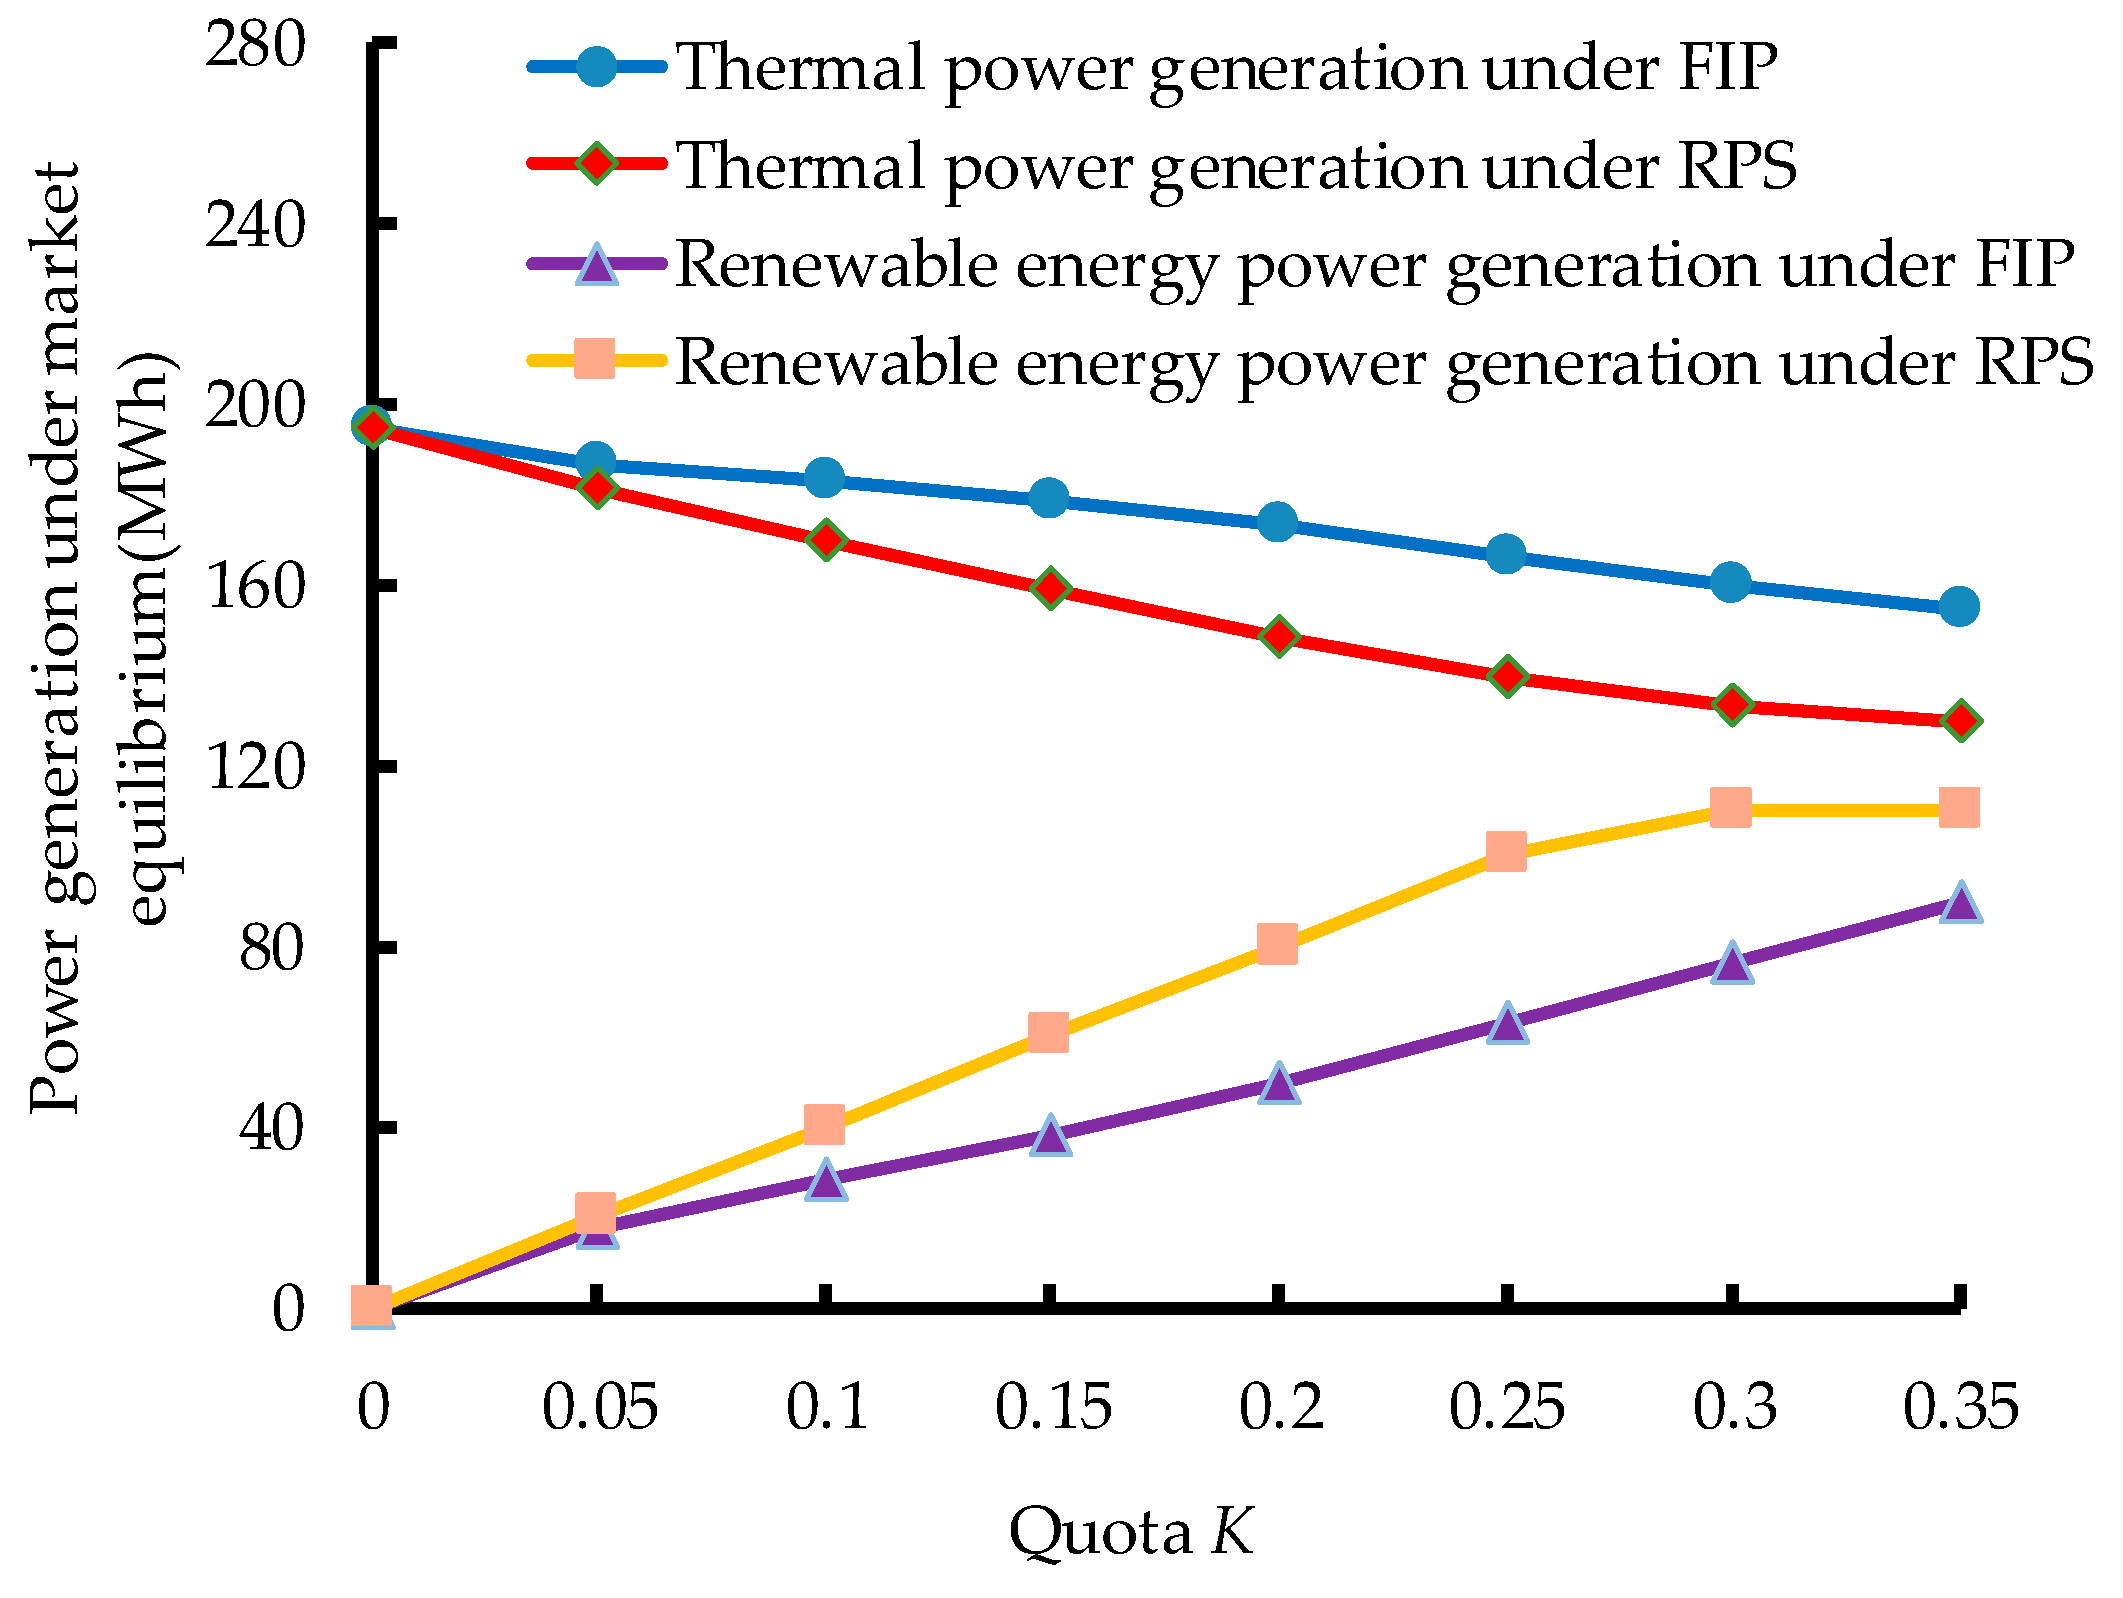
FIP and RPS have different incentive effects on power generation of thermal power plants and renewable power plants. When only FIP or RPS is implemented by the government, the changes of power generation under market equilibrium of different quota
K are shown in
Figure 3.
As can be seen from
Figure 3, under the implementation of FIP or RPS, with the increase of quota
K, thermal power generation decreases nonlinearly, and renewable energy generation increases nonlinearly. When
K < 0.1, the difference of influence between the two mechanisms is not obvious. When
K < 0.05, the impact of the two mechanisms on a power producer’s decision-making is almost the same. When
K is large, the reduction of thermal power generation under RPS is more obvious, i.e., the increase/decrease of renewable energy and thermal power generation under RPS is significantly faster than that under FIP. The simulation results show that both FIP and RPS can improve the renewable energy power generation and reduce the thermal power generation, but the effect of RPS is more obvious than that of FIP. This result implies that, when acting alone, RPS would be a more preferable choice for China’s long-term energy plan compared to FIP, based on its better performance in promoting renewable energy generation and controlling thermal power generation.
4.3. The Impact of FIP and RPS on Market Equilibrium Price
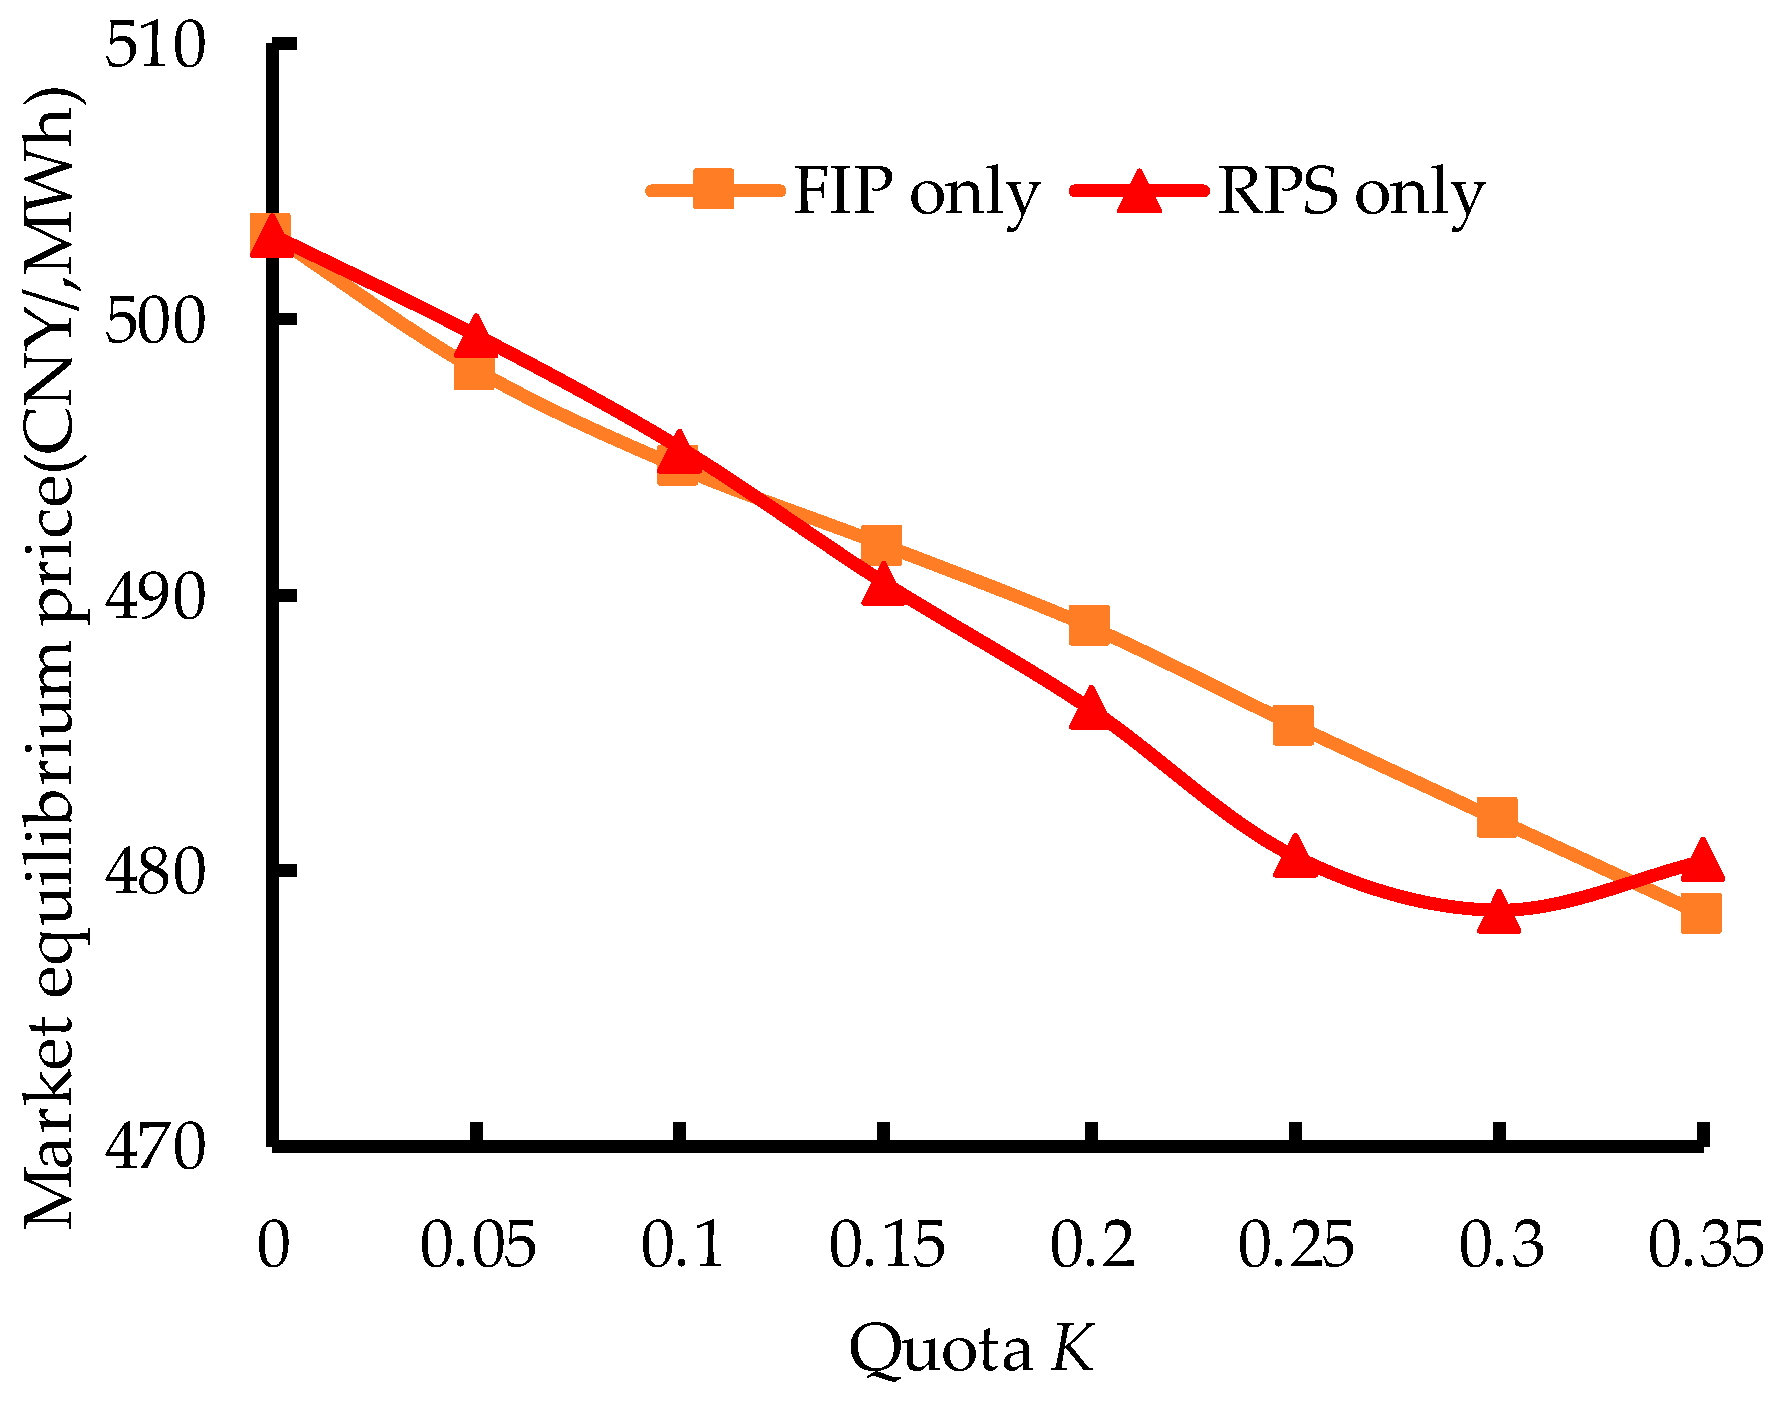
The implementation of FIP and RPS can change the power generation under market equilibrium to a certain extent, which also has an impact on the market equilibrium price. When only FIP or RPS is implemented by the government, the change of market equilibrium price under different quota
K is shown in
Figure 4.
It can be seen from
Figure 4 that, with the increase of quota
K under government requirement, the market equilibrium price decreases. Meanwhile, the market equilibrium price under RPS changes from higher than that under FIP to lower than that under FIP, and when
K turns to around 0.1, the market prices under the two mechanisms reach equal value. The results show that, in the early stage of renewable energy development, FIP is more conducive to reducing market power generation costs quickly; and when renewable energy power generation reaches a certain proportion and renewable energy power industry tends to mature, RPS is more conducive to introducing market competition, achieving less market power generation costs and lower market equilibrium price level. This result implies that, when implementing staged policy to incentivize renewable energy generation, it is more desirable for the government to transform from FIP to RPS gradually with the quota ratio increased, in order to keep market prices down.
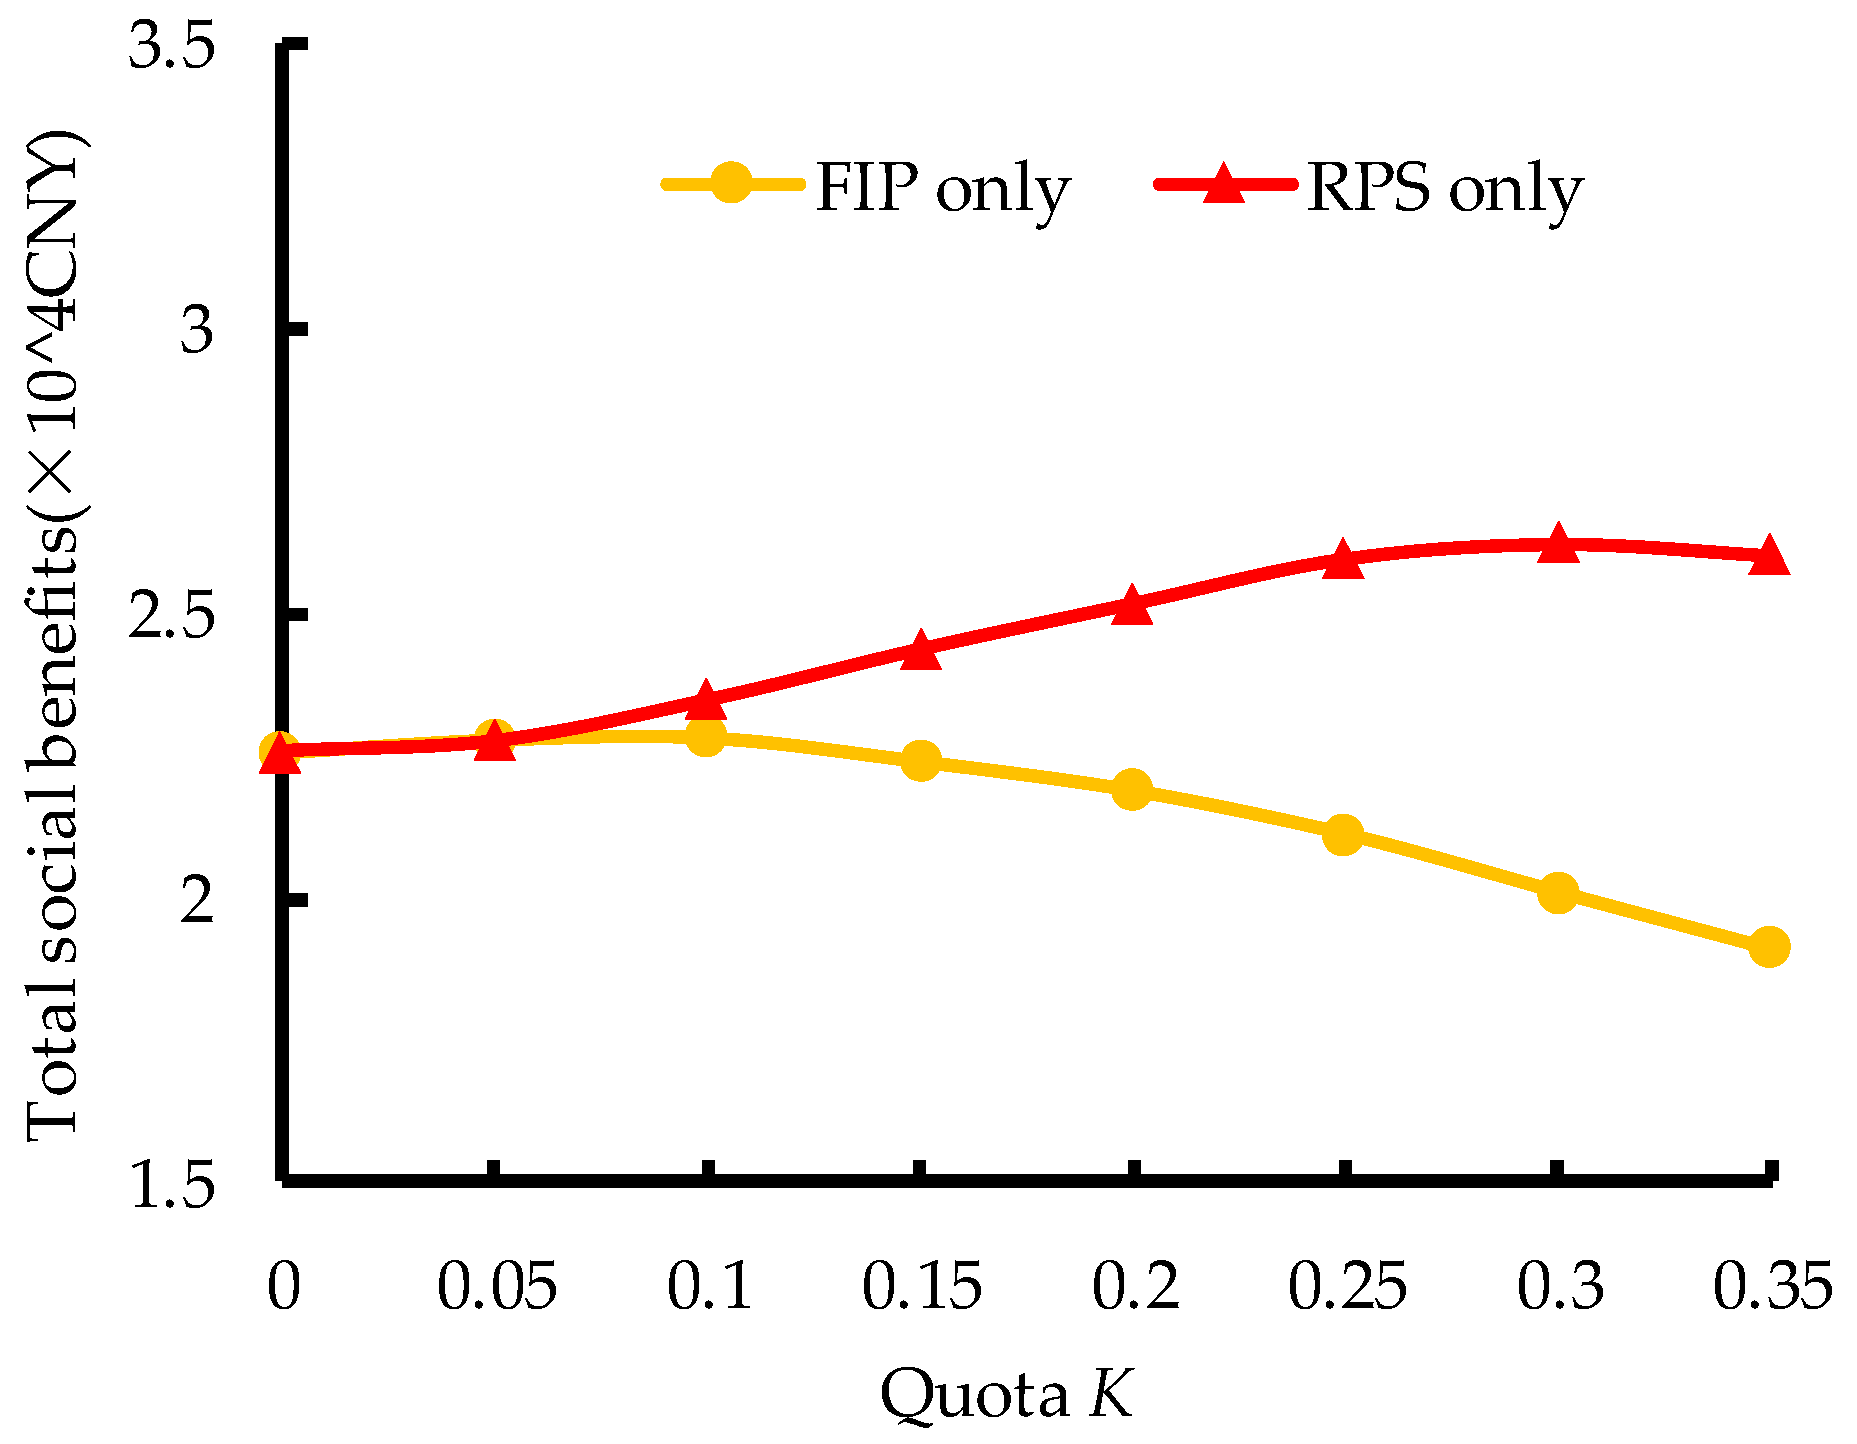
4.4. The Impact of FIP and RPS on the Total Social Benefit
Under FIP and RPS, there are differences between the revenue structure of thermal power producers and renewable energy power producers, government subsidies and the impact of power generation on the environment, which determines the difference of the total social benefits brought by the two mechanisms. Under different quota
K, the change of total social benefit is shown in
Figure 4.
It can be seen from
Figure 5 that, under the two mechanisms, with the increase of quota
K, the total social benefit under FIP tends to decrease, while the total social benefit under RPS tends to increase on the whole, and there is a peak value around
K = 0.3. The results show that FIP will lead to partial losses of social benefits. It is mainly caused by the participation of the government in premium subsidy and market supervision under FIP, resulting in certain management costs. The implementation of RPS is more conducive to improving efficiency and better realizing the development demand of renewable energy. The main reason is that part of the power generation cost of renewable energy under RPS is paid by thermal power producers, acting as a kind of compensation for its influence on the environment. Meanwhile, after the implementation of RPS, the government pressure of renewable subsidy as well as the management cost decrease, so the total social benefit under RPS is higher. Besides, it is not appropriate to set the quota
K too high, since renewable energy power technology is still immature. Under this context, if the quota
K is set too high, it will distort market incentive signals and exert more pressure on thermal power producers. Ultimately, it will lead to the decline of the total social benefit.
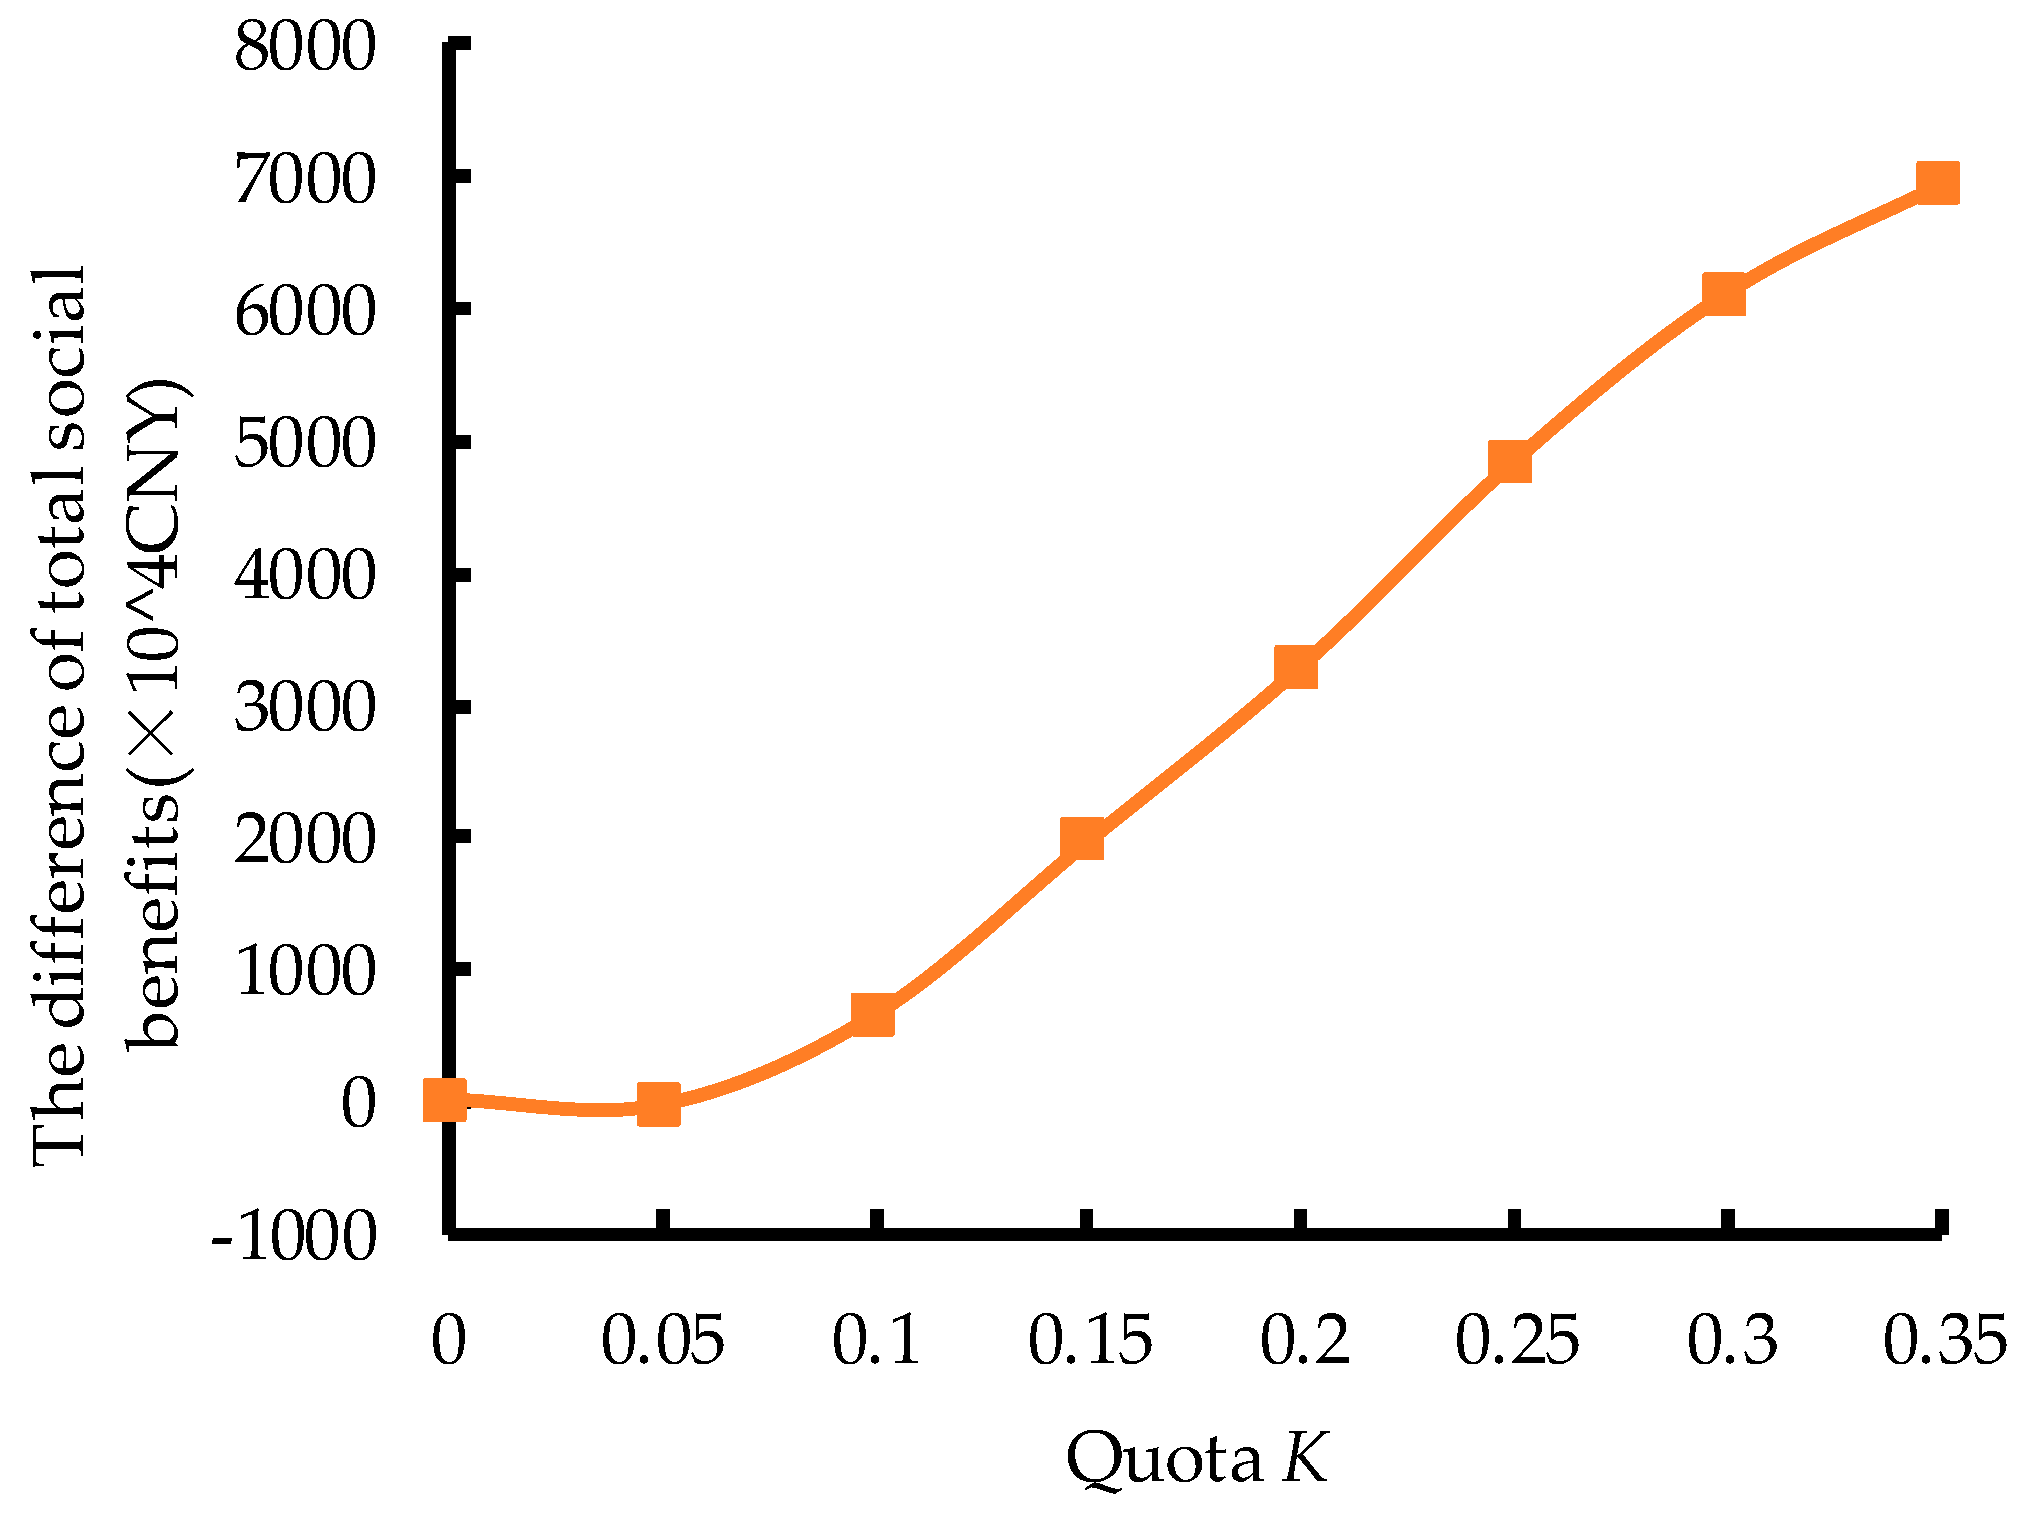
The difference of total social benefit between the implementation of FIP and RPS is shown in
Figure 6. From the change of the total social benefits, it can be seen that the transition from FIP to RPS satisfies the economic rules of the Kaldor–Hicks improvement. When
K is relatively small, the difference of the total social benefits between the two mechanisms is not obvious, and the self-regulating ability of the power market can stabilize the market itself. With the increase of the quota
K, the total revenue under RPS is larger, but since the fluctuation of electricity price under RPS is much larger than that under FIP, the risk for imbalance of the power market increases. Therefore, when implementing RPS, this tendency should be taken into consideration comprehensively. This result implies that, when acting alone, RPS would be a more preferable choice for China’s long-term energy plan compared to FIP, regarding the performance of maintaining total social benefits as well as improving market efficiency.
4.5. Market Equilibrium Result under Joint FIP-RPS Mechanism
In the process of transition of renewable energy incentive mechanism in China, the government gradually introduces RPS based on FIP, and two mechanisms coexist. Under the joint FIP-RPS mechanism, the synergy of the two mechanisms determines the power generation under market equilibrium, the electricity price, and the total social benefit in the power market. The market equilibrium of FIP, RPS, and synergy of the FIP and RPS (i.e.,
x =
y = 0.5) under
K = 0.15, is studied in scenarios 1 to 3 respectively, and the simulation results are shown in
Table 4.
It can be seen from
Table 4 that, compared with FIP, adopting RPS alone will achieve higher renewable energy power generation, lower market price, and higher social benefits. Furthermore, compared with adopting RPS alone, under the synergy of the two mechanisms, the output of thermal power producers will be guaranteed to a greater extent while a higher renewable energy generation power will be ensured, and the market clearing price is lower than that under the implementation of FIP or RPS alone. The results show that, the synergy of the FIP and RPS not only improves the social benefits, but also reduces the electricity price under market equilibrium. By reducing the thermal power generation gradually, the implementation effect will not be excessively radical; thus, a smooth transition of the two mechanisms can be achieved. This result implies that the proposed joint FIP-RPS mechanism not only excels at promoting renewable energy generation, but is also capable of maintaining desirable market prices and social welfare in this transitional period, compared to either FIP or RPS implemented alone. Therefore, the certain degree of joint FIP-RPS mechanism to this energy transition, in the future, would be one of the preferable methods to be implemented to make significant influences on China’s renewable energy development.
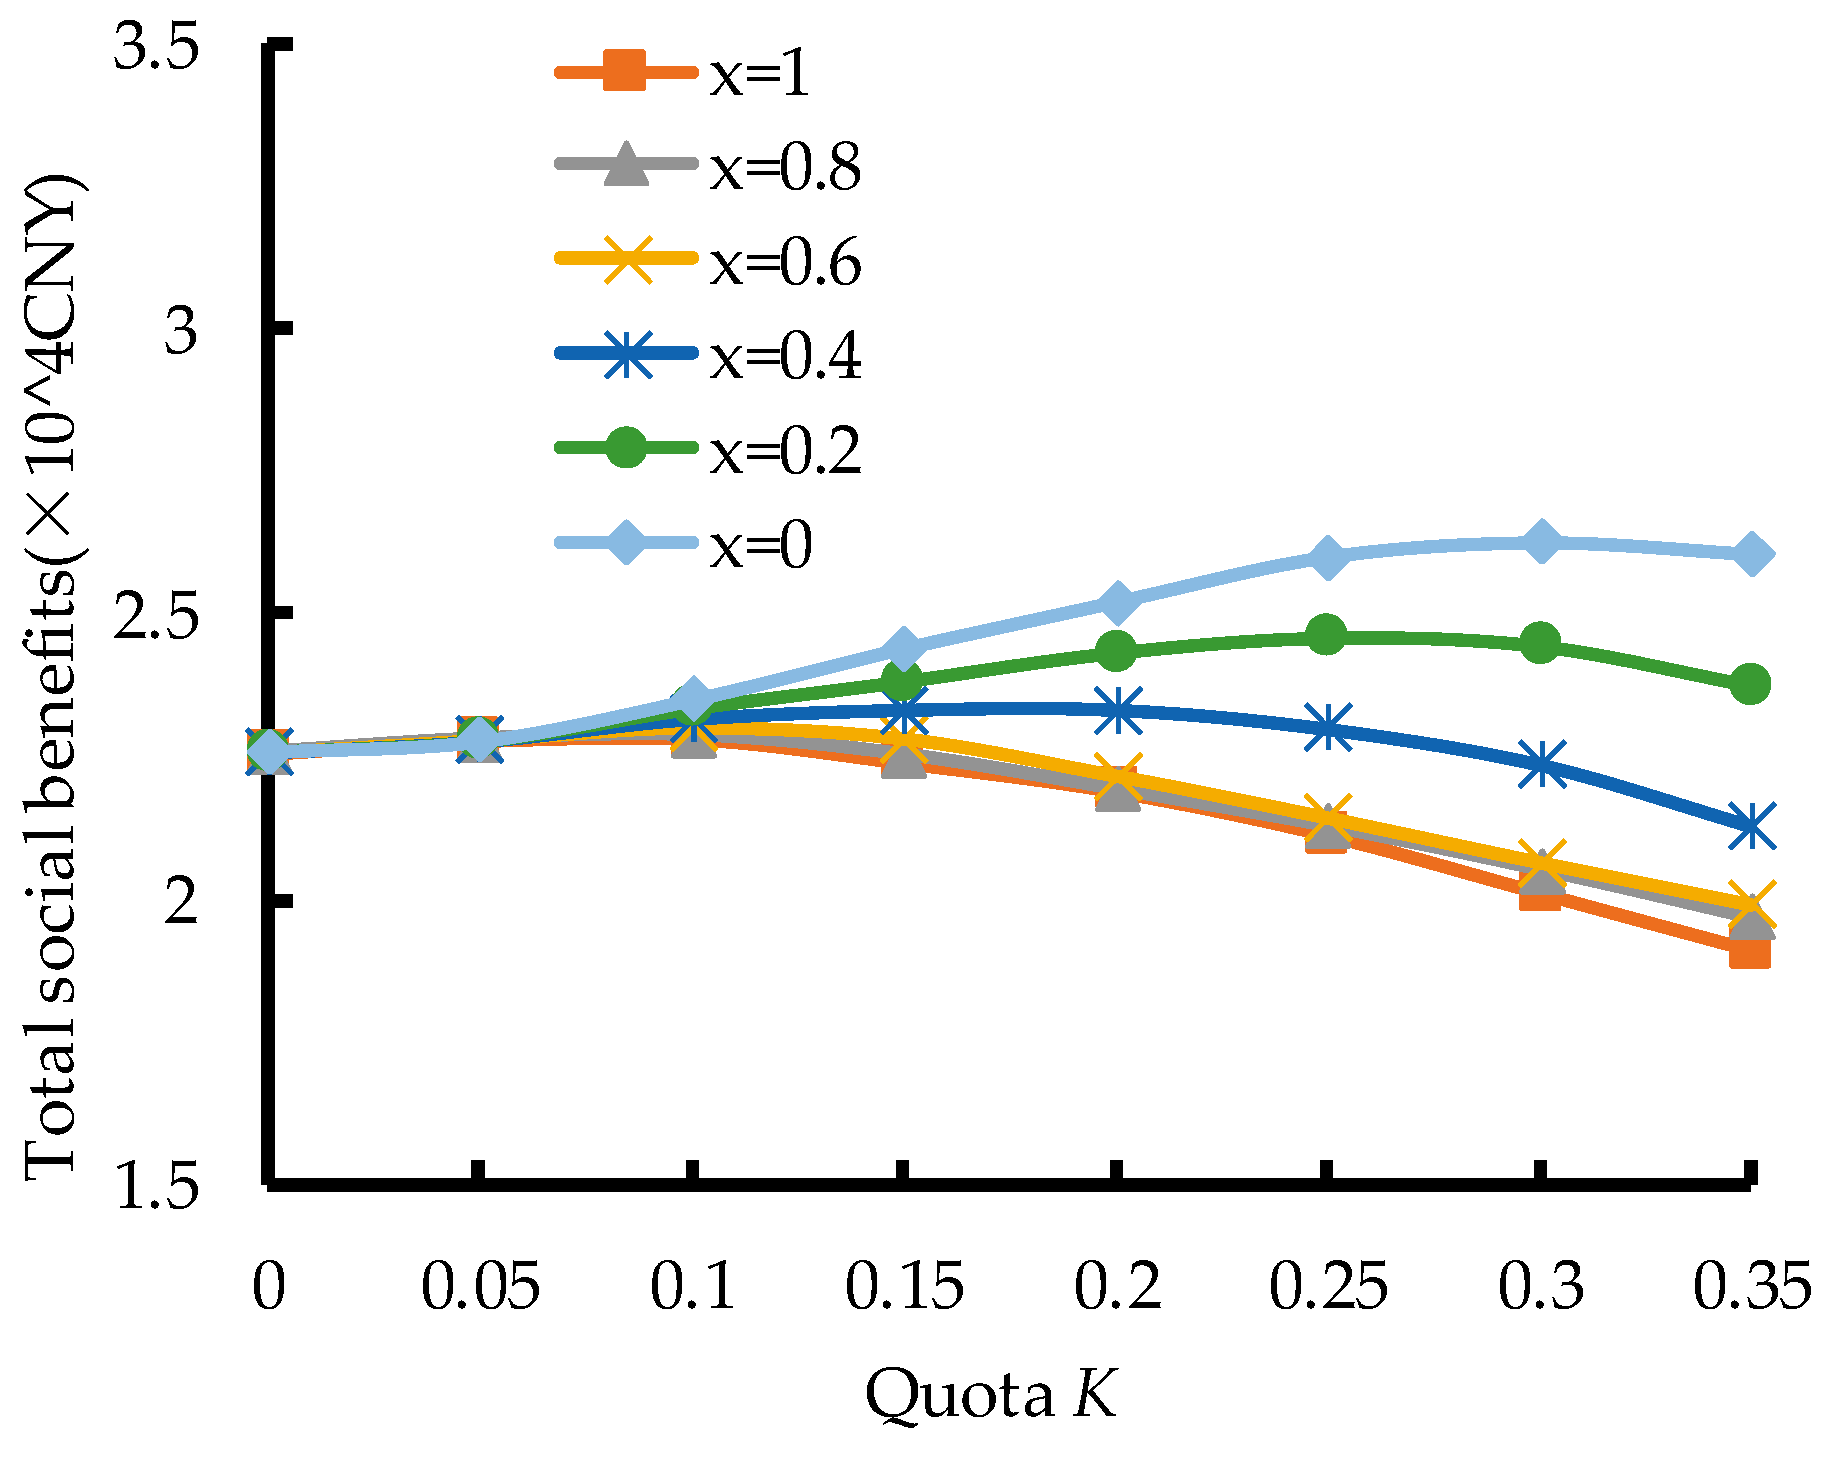
4.6. Optimum Ratio of FIP and RPS in the Joint Mechanism
The synergy of FIP and RPS can help realize the complementary advantages of the two mechanisms. However, it is important for decision-makers to determine the optimal ratio of the two mechanisms so as to maximize the total social benefit. From the analysis of
Section 4.5, it can be seen that the different ratio of FIT and RPS will affect the total social benefit. Through several times of optimization, the changing trend of the total social benefit under different ratio of FIP and RPS is shown in
Figure 7, where the curve
x = 1 indicates that FIT alone be implemented, and the curve
x = 0 indicates that RPS alone be implemented.
It can be seen from
Figure 7 that, with the increase of the ratio of RPS under the joint FIP-RPS mechanism, the total social benefit increases. At the same time, under the circumstances that the proportion of RPS in the joint mechanism exceeds a certain value, if
K continues to increase, the total social benefit will decline until it reaches the peak value. When the proportion of RPS is high, the quota
K should be maintained at a medium level, since the high technical cost of renewable energy power generation has not been reduced.
From the analysis of
Figure 7, how to determine the optimal proportion of FIP and RPS in the joint mechanism can also be obtained. In fact, the quota
K in most countries is still at a relatively low level. When the government adopts incentive mechanisms to increase the quota
K gradually, if RPS is not introduced, the total social benefit will be reduced. Therefore, the government should introduce RPS and increase its proportion gradually. In order to avoid the risk caused by the radical introduction of RPS, according to
Figure 7, when the total social benefit reaches the peak value under a certain quota ratio
K, the corresponding ratio of FIP and RPS determines the optimal combination of the joint mechanism. The optimal proportion of FIP and RPS under different quota
K is shown in
Table 5.
As can be seen from
Table 5, when
K = 0, there is no government mandatory requirement for renewable energy generation, and the implementation of FIP can achieve the goal of both fast development in renewable energy generation as well as maximizing the total social benefit. When a certain incentive mechanism is adopted to increase the quota
K gradually, the optimal proportion of RPS in the joint FIP-RPS mechanism also increases, but still much lower than that of FIP. Meanwhile, the total social benefit also increases gradually with the increase of quota ratio
K. This indicates that, although the implementation of RPS is helpful to promote the development of renewable energy power generation, when renewable energy power generation has not become mature enough, the transition from FIP to RPS still takes a long period. During this transitional period, a renewable energy incentive mechanism which is dominated by FIP while supplemented by RPS should be implemented. When the market mechanism for renewable energy generation gradually becomes more mature, a higher proportion of RPS in the joint mechanism should be adopted in order to obtain the maximized social benefit.
In summary, FIP and RPS should be implemented in the different stages of renewable energy development according to their distinct characteristics. According to the market environment for renewable energy in China currently, the development of renewable energy can be divided into three stages. In the first stage, only FIP should be implemented, which can promote the development of renewable energy installed capacity quickly and provide stable price subsidies. In the second stage, a renewable energy incentive mechanism dominated by FIP and supplemented by RPS should be implemented, since the perfect market mechanism has not fully developed and the development for various kinds of RES still needs support from government. However, during this stage, as the market for renewable energy generation gradually matures, a higher proportion of RPS in the joint mechanism should be adopted in order to obtain the maximized social benefit. In the last stage, as the development of renewable energy has sped up, the technology of multiple renewable energy generation becomes quite mature; RPS alone should be adopted by government to keep up with the trend of development for the renewable energy power market.
Besides, different energy incentive mechanisms should be adopted according to the development of different types of renewable energy. At present, wind power and photovoltaic power generation technology have developed rapidly; therefore, it is appropriate for them to fully participate in the market competition, while compensating by the green certificate mechanism offered by RPS. As for some kinds of renewable energy generation which have not yet been developed, such as geothermal and biomass power generation, a higher proportion of FIP in the joint mechanism should be adopted, in order to guarantee renewable subsidies from the government to support their development. In the transitional stage, flexible renewable energy incentive mechanisms should be adopted to reduce the fluctuation of clearing price and ensure the total social benefits.
5. Conclusions
China is going through the energy transformation from traditional fossil energy to renewable energy. However, developing renewable energy by the original subsidy policies as FIT has caused heavy financial burdens on governments, and it is under government’s long-term plan to replace FIT by mandatory policies as RPS. Obviously, implementing RPS in China requires a tradeoff of the interests of different market participants including power producers, government, and consumers. Therefore, devising a fair and economic method to make a smooth transition from FIT towards RPS is necessary. Given this background, a power market equilibrium model under the joint FIP-RPS mechanism is proposed, in an attempt to acquire the optimal ratio of the two joint mechanisms to maximize the total social welfare under the requirements for the renewable energy quota obligation. The result shows that FIP and RPS should be implemented in the different stages of renewable energy development according to their distinct characteristics. At the initial stage of development, FIP alone should be implemented, which can promote the development of renewable energy power installed capacity quickly and provide stable renewable subsidies. With the development of renewable energy sped up, more proportion of RPS should be introduced into the joint FIP-RPS mechanism, so as to better stimulate the vitality of the renewable energy market.
It can be concluded that the proposed joint FIP-RPS mechanism not only excels at promoting renewable energy generation, but is also capable of maintaining desirable market prices and social welfare during this transitional period, compared to either FIP or RPS which is implemented alone. Therefore, the certain degree of joint FIP-RPS mechanism to this energy transition, in the future, would be one of the preferable methods to be implemented to make significant influences on China’s renewable energy development, for the combination of the two mechanisms not only reduces the financial burden of the government, but also plays an active role in the renewable energy market. Moreover, with different development stages going on, the joint mechanism can be adjusted with different combination ratios in order to meet the need of renewable energy development.
The presented market equilibrium model can be employed to determine a certain ratio of combining RPS and FIP accordingly under the required quota ratio. By applying this method, policy makers can obtain important insights required for promoting a smooth transition from FIT towards RPS. As part of our future work, more researches will be embarked on determining the optimal premium coefficient for FIP under the design framework of the overall joint incentive mechanism.


