Abstract
The Chinese main air transport network (CMATN) is the framework for air passenger transport in the country. This study uses complex networks and an econometric model to analyze CMATN’s evolution and determinants. In terms of overall network structure, the network has always shown small-world properties, with smaller average path lengths (2.06–2.15) and larger clustering coefficients (0.68–0.77), while its cumulative degree distribution follows an exponential function. City passenger volumes conform to the degree power law function, which means that the more destinations a city connects to, the higher its passenger traffic will be. In major hub cities, such as Beijing, Shanghai, and Guangzhou, control power decreases, while Chengdu, Kunming, Chongqing, Xi’an, Urumqi, and other cities play an increasingly important role in CMATN. In terms of main route passenger volumes and formation, increases in GDP and tourism have had a promoting effect, while high-speed rail (HSR) poses a threat to overlapping routes. CMATN is primarily located in the central and eastern regions, focusing on China’s economy, tourism, and efficient HSR development. Although the competition from HSR affects the overall network structure of CMATN based on its influence on specific routes, we believe that the impact is limited due to the different transport attributes of the two networks. The research results of this study can become an information source for decision makers and provide a reference for air transport to seek sustainable development.
1. Introduction
Recently, the development of complex network theory has led to many studies being published in the traffic field [1], including research on the network structure of high-speed passenger transport systems, such as high-speed rail [2,3] and air transport [4,5,6,7,8,9,10]. As a complex man-made network, the air transport network plays an important role in human social and economic development. In the study of air transport networks, scholars not only pay attention to the statistical characteristics and categories of networks (e.g., small-world, scale-free networks), but also to the attributes of node cities and passenger flows.
From the analyses of complex networks, scholars consider that air transport networks are mainly divided into small-world and scale-free networks. Guimerá et al. [11] and Wandelt et al. [12] observed that the world air transport network is a scale-free small-world network, which means that the cities with the most routes are not the central cities. The Italian air transport network, as studied by Guida and Maria [13], also exhibits a scale-free, small-world property. Bagler [4] studied the properties of weighted networks and compared them with their topological features. This also led to the finding that the Indian air transport network is a small-world network, with large clustering coefficients and a small average number of shortest path edges between all pairs of nodes [14]. Many countries’ air transport networks exhibit the small world property, e.g., Xu and Harriss’s [15] study of the US, Wang et al.’s [1] and Du et al.’s [16] study of China, and Hossain and Alam’s [6] study of Australia. The above studies lend support for using the complex network approach for the analysis of topological structures [17,18,19]. Most research also focused on the evolution of air transport networks. Azzam et al. [20] examined the evolution of the world air transport network from 1979 to 2007, and found that the clustering coefficient of a network decreases with the increase in node degree. Gautreau et al. [21] found that many routes appear or disappear with the evolution of the United States air transport network. Jia et al. [22] and Lin and Ban [23] found that the United States air transport network efficiency decreased as the network grew from 1990 to 2010. Burghouwt and Hakfoort [24] found that a hub-and-spoke system has been developed by studying the evolution of the European air transport network from 1990 to 1998. Papatheodorou and Arvanitis [25] found that the spatial concentration of Greece’s air transport network remains high. Analyzing the Portuguese air transport network from 2001 to 2010, Jimenez et al. [26] observed that the Portuguese air transport network is less concentrated. Wang et al. [27] analyzed the evolution of the air transport network from 1930 to 2012, indicating that connectivity has improved significantly. Some studies also considered socio-economic factors when analyzing the evolution and properties of air transport networks. Wandelt and Sun [12] analyzed the air transport networks of the United States, Great Britain, France, and South Africa, and found that topological and functional criticality are closely correlated to a country’s GDP. Wang et al. [1] found that Chinese air transport network centralities are correlated with both cities’ population and GDP. Jun [28] observed that the topology of the Chinese air transport network has remained steady and found that cargo and passenger traffic continue to grow with GDP. Based on the calculation of clustering coefficients, average path length, and centrality and degree distribution, extant studies measure the topological structure of air transport networks. They also analyze the effect of socio-economic factors on cities’ centrality. However, this study addresses a gap in the literature and specifically analyzes the impact of tourism and outside competition from high speed rail (HSR) on the evolution of air transport networks. Currently, the extant studies on the relationship between HSR and air transport focus on three aspects: passenger travel choice, air-rail cooperation, and air-rail competition. Regarding passenger travel choice, the impacts of passenger and travel attributes are studied based on survey data [29,30,31,32,33,34,35]. For cooperation, the advantages and disadvantages of air-rail intermodal transport are studied using various models [36,37,38,39]. In terms of competition, the content and scope of research are wide. Specifically, scholars have analyzed the impact of HSR competition in terms of passenger volume [40,41,42], service supply [43,44,45], and fares [46,47,48,49]. In those studies, socio-economic and tourism factors are often involved as important variables. However, to the best of our knowledge, the literature on the impact of HSR on the evolution of the air transport network is still limited. With respect to China’s air transport network, GDP, tourism and HSR have developed rapidly. Thus, examining the Chinese main air transport network (CMATN) allows us the possibility to fill this gap in the literature and provides a reference for the sustainable development of civil aviation.
China, as the second largest economy in the world, has the largest population and the third largest territory. The country has developed rapidly in terms of GDP, tourism, HSR and civil aviation. In recent years, its economy has developed rapidly, and its GDP has grown from 10 trillion yuan in 2000 to 90 trillion yuan in 2018. Living standards and tourism have improved significantly as well. Chinese domestic tourists and tourism income are developing rapidly (as shown in Figure 1 and Figure 2), which brings about huge population flows and transportation consumption. China’s HSR has also achieved tremendous success. Since 2008, China’s HSR has evolved significantly in terms of mileage and passenger volume (Figure 3), becoming an important part of China’s high-speed passenger transport system. In 2016, China’s HSR transported 1221.28 million passengers, 2.8 times as many as air transport (which transported 436.34 million domestic passengers). The rapid development of China’s economy, tourism, and HSR will certainly have an impact on the development of its air transport network.
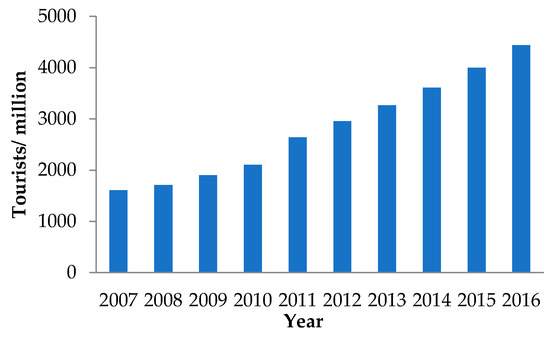
Figure 1.
Chinese domestic tourists.
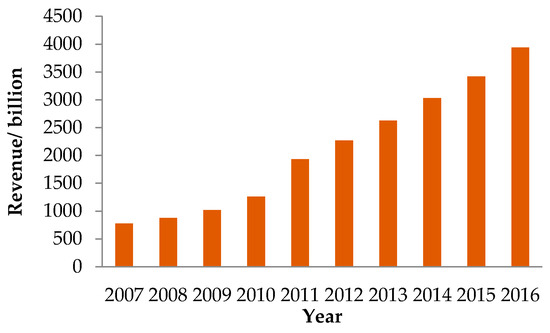
Figure 2.
Chinese domestic tourism revenue.
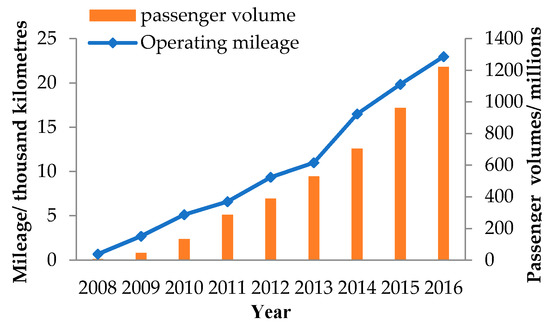
Figure 3.
Operating mileage and passenger volume of high-speed rail (HSR).
China’s air transport network is also developing rapidly given that the civil aviation industry has undergone a series of reforms in the past three decades [50]. Since the 1980s, China’s air transport network has attained a relatively large scale [28] and evolved as a complex network [51]. Further, in recent years, China’s air transport market has maintained a relatively rapid development rate. The “Annual Review 2017” issued by the International Air Transport Association (IATA) mentioned that “once again, the domestic China passenger market saw the biggest incremental change in journey numbers, with 37 million more passenger journeys.” [52]. Nowadays, China is the second largest air passenger market after the United States [53]. The largest contribution to air transport volumes comes from cities in CMATN.
According to the statistical standards of “Statistical Data on Civil Aviation of China 2017,” passenger volume is above 300,000 per year for main routes in China. The air transport network consisting of these routes and city-pairs is called CMATN in this paper. CMATN is primarily located in the eastern and central regions, where the economy and tourism have developed rapidly. From 2007 to 2010, CMATN accounted for more than 70% of China’s domestic total passenger volume, showing an upward trend (Figure 4). However, since 2011, the passenger volume ratio of CMATN has begun to decline. This is because of the continuous development of China’s regional airlines. China has invested in the construction of new regional airports and regional flights have flourished (Figure 5), which has promoted the increase in total air passenger volume. HSR competition has also led to tremendous changes in public travel [54]. However, the impact of HSR on CMATN’s passenger volume is significant. China’s HSR operation areas overlap with those of CMATN’s, and the impact on CMATN’s passenger volume is significant. Both are concentrated in the densely populated, economically developed, and tourism inclined central and eastern regions, as shown in Figure 6.
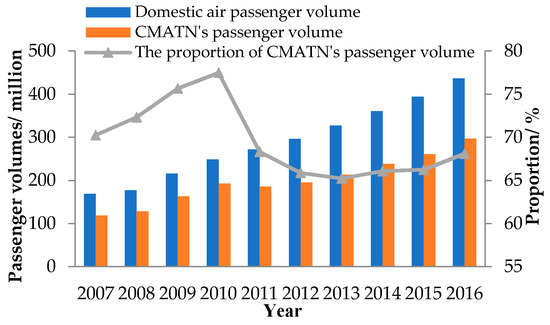
Figure 4.
Domestic and Chinese main air transport network (CMATN) passenger volume.
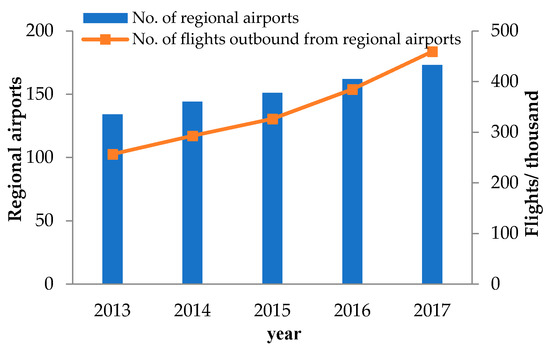
Figure 5.
No. of regional airports and outbound flights.
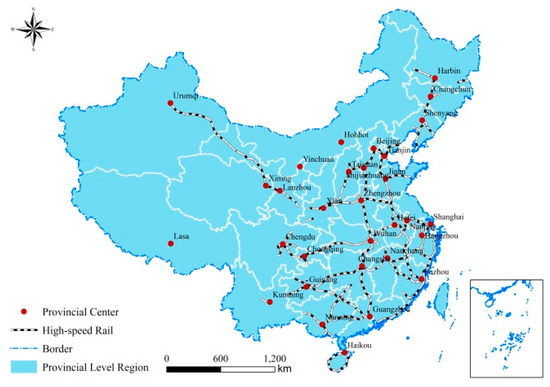
Figure 6.
Current situation of HSR construction in China.
In order to examine the evolution and determinants of the air transport network, this study considers the case of CMATN and analyzes CMATN’s evolution from the point of view of overall network structure and centrality from 2007 to 2016. Complex network theory and econometric models are used to illustrate the impacts of GDP, tourism, and HSR competition on the main routes of CMATN. As such, the research results of this study can become an information source for decision makers and provide a reference for air transport practitioners seeking the sustainable development of their industry.
2. Study Area and Data
The study area of this study is mainland China (excluding Hong Kong, Macao, and Taiwan). The study object is the undirected network formed by the routes with a volume above 300,000 air passengers during 2007–2016. For each year, cities are nodes and the routes are edges, and an annual passenger volume above 300,000 is the criterion for selecting nodes and edges. Figure 7 shows the number of cities and routes in the network from 2007 to 2016. CMATN shows remarkable improvements in both the number of routes and cities: the number of routes in 2016 was 2.13 times that of 2007, and the number of cities also increased.
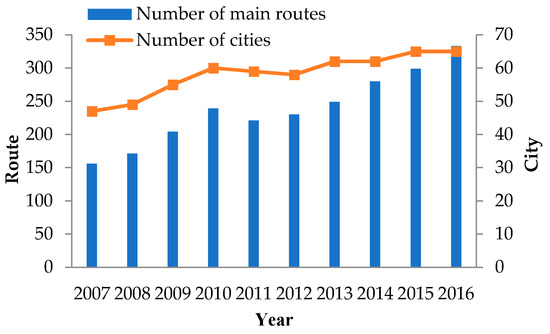
Figure 7.
Number of CMATN cities and routes from 2007 to 2016.
This study uses three data sources:
1. Passenger volume of air transport comes from the “Statistical Data on Civil Aviation of China,” published annually by the Development Planning Division of China Civil Aviation Administration. Over the past few years, standards have changed. From 2007 to 2012, passenger volumes above 50,000 were recorded. In 2013, volumes above 100,000 were considered and, since 2014, volumes above 300,000 were taken into consideration. Therefore, we consider the statistical caliber of 2014–2016 with routes of annual passenger volumes of over 300,000 as the main routes in China.
2. Socio-economic and tourist data are derived from the annual “China Urban Statistics Yearbook,” published by the China Statistical Bureau, and the “Statistical Bulletin of National Economic and Social Development,” issued by various cities.
3. The opening times of HSR on all lines come from the “China Railway Yearbook,” published by the Archives History Center of the Ministry of Railway, Archives History Center of China Railway Corporation (on 14 March 2013, the Ministry of Railways was dissolved and a separation between the government and transport company was implemented. The administrative responsibility of the Ministry of Railways for formulating railway development plans and policies was assigned to the Ministry of Transport. On March 17, the China Railway Corporation was officially listed. Therefore, the Archives History Center of the Ministry of Railways was renamed the Archives History Center of China Railway Corporation), and information from the official website.
3. Methods
The main purpose of this study is to examine the evolution of CMATN and the impact of GDP, tourism, and HSR, an external competitive factor, on air passenger volumes and network structure. To this end, we use the complex network method to analyze the changes in network structure and an econometric model to analyze the impact of GDP, tourism, and HSR on air passenger volumes and formation of routes.
3.1. Network Analysis
Network analysis emphasizes the key guiding principle of structural relationships, in which the composition of social structure is the regularity of the relationship between tangible entities [55]. Thereby, entities can be natural persons, small groups, organizations, or countries. The primary purpose of network analysis is to accurately measure and display network structures, while also explaining the reasons behind the results. Obviously, the air transport network can also be regarded as a complex network.
The CMATN can be regarded as network with nodes , edges , node set , and edge set . The adjacency matrix represents the connectivity of the network and indicates that node is directly connected to node ; otherwise, . The weight matrix represents passenger volume from node to node . Table 1 presents the indicators used to analyze the overall network topology and city centrality.

Table 1.
Network analysis indicators.
3.2. Econometric Model
To analyze the impact of GDP, tourism, and HSR on CMATN’s routes, we adopt an econometric model (1) and a binary logit model (2), which respectively calculate passenger volumes and route dummy variables using GDP, tourism, and competition (HSR), with population as a control variable. GDP, HSR, and population, as independent variables, are widely used in empirical studies of air passenger volume changes [43,60,61,62], with some studies analyzing the role of tourism as well [63,64]. Model (1) is mainly used to measure the impact of GDP, tourism, and HSR on CMATN from the perspective of passenger volume (network weight). Passenger volume panel data of 281 routes with or without HSR competition from 2007 to 2016 are used. Model (2) is used to analyze the impact of GDP, tourism, and HSR on routes (network edges) entering or exiting CMATN. The panel data of 148 routes with entry or exit CMATN are used.
The dependent variable in model (1) is the passenger volume from city to city in year . Dependent variable in model (2) is a dummy taking 1 if air passenger volumes from city to city are more than 300,000 in year , and 0 otherwise. The independent variables are explained as follows.
is a dummy variable, taking 1 if the route has HSR competition, and 0 otherwise. Its sign is expected to be negative.
is an economic attribute of city-pairs. To reflect the different economic attributes of each route, we process this independent variable as . Its sign is expected to be positive.
represents the tourism attributes of a route, that is, the proportion of tourism revenue to GDP [65], and the treatment method is . Its sign is expected to be positive.
is the city-pairs’ population size. Similarly, to reflect the population characteristics of different routes more objectively and comprehensively, we process the population as . The sign of this coefficient is also expected to be positive.
4. Results and Analysis
4.1. Network Evolution Analysis
In this section, we analyze the current situation of CMATN using original data, and the overall network structure and centrality of CMATN using the complex network approach. The results reflect the evolution and determinants of CMATN.
4.1.1. Original Data Analysis
Recently, China’s economy has exhibited rapid development. The air transport industry has also developed vigorously, and new routes have become members of CMATN on a regular basis. Figure 8 shows CMATN in 2007, 2010, 2013 and 2016, and we determine its changing process in the following.
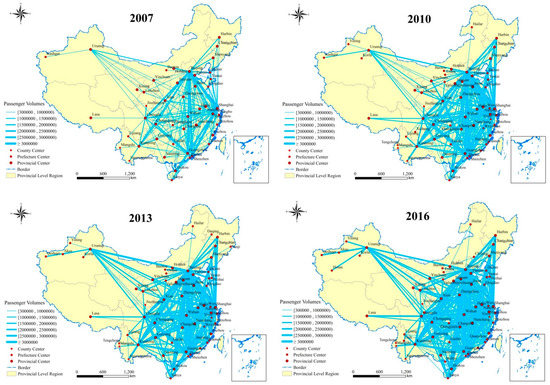
Figure 8.
CMATN’s structure in 2007, 2010, 2013, and 2016.
1. Overall, regarding the increasing density of the network, the network has made tremendous progress in terms of both the number of routes and total passenger volume, being concentrated in the eastern part of the Hu Line (this line is virtually a straight line from Heihe to Tengchong and it exhibits an overwhelming high-density of economic and social functions). The Center and the East are the most prosperous regions of China in terms of social and economic development. In this area, the evolution of CMATN has progressed from being simple to complex. It can be said that social and economic factors have played an important role in the development of CMATN. For this reason, we consider the factors of GDP and population in this paper.
2. In terms of network nodes, there are several core cities in the network. Throughout the development process of CMATN, Beijing, Shanghai, Guangzhou, Shenzhen, and Chengdu are important cities in terms of the number of routes and passenger volume. Kunming, Xi’an, and Chongqing have also become important transit cities due to the subsequent development. There are six routes for which passenger volumes always exceed all other routes, as shown in Figure 9. Compared with Chengdu–Shanghai and Chengdu–Guangzhou, which ranked seventh and eighth, the other six routes had larger passenger volumes. Among them, Beijing–Shanghai has always registered the largest passenger volume. Despite the opening of the Beijing–Shanghai HSR on June 30, 2011, it has had a limited impact, and air passenger volume on the Beijing–Shanghai route continues to exceed that of Shanghai–Shenzhen by nearly 3 million people. This gap is significant. Beijing, Shanghai, and Guangzhou are China’s economic and cultural centers, as well as China’s international hubs. They have played an important supporting role in the development of CMATN. Kunming, Xi’an, and Chongqing attract tourists from domestic and foreign locations with their unique tourism characteristics. The development of economy and tourism has promoted the development of China’s air transport network and made CMATN more prosperous.
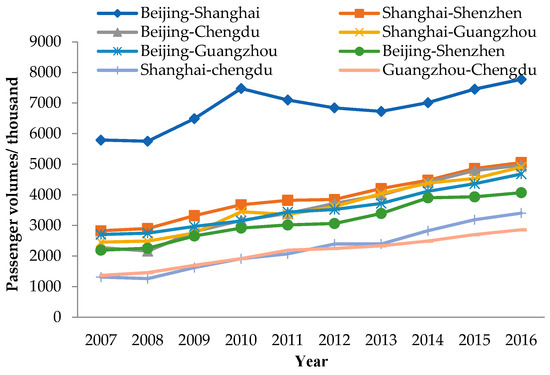
Figure 9.
Routes of China’s top flights during 2007–2016.
3. Some cities have always been a part of CMATN due to their own specificities: 31 provincial cities, 15 cities with fast economic and tourism development, and a world-renowned tourism resort—Xishuangbanna. Some cities have become members of the CMATN due to strong tourism development, such as Chifeng, Dali, Beihai, among others. Of course, a few cities have been removed from the network, such as Shantou, Wuyishan, and Yanji. As per Figure 8, Urumqi developed into a hub, with Korla, Hotan, Kashgar, Aksu, and Yining as its spokes. It is worth mentioning that only Hotan is a prefecture-level city, while the other four cities are county-level ones. To stand out from more than 600 cities in China and become a part of CMATN by registering rapid growth in passenger volumes, cities must have defining characteristics (e.g., Urumqi-Kashgar, whose volume increased from 488,400 in 2007 to 1,535,100 in 2016). We consider that the rapid development of tourism is the key to the formation of the regional hub-and-spoke system. Finally, we can also see from Figure 8 that Kunming and Chengdu also connect many cities famous for tourism. Therefore, tourism can promote the development of CMATN.
4.1.2. Overall Network Structure Analysis
1. Network density
Table 2 shows the results of the various indicators for the overall network structure. In the 10 analyzed years, overall network density reflects the overall distribution and tightness of the network, with a downward trend followed by an upward trend. During 2009–2013, network density was relatively low compared with the other five years. These five years coincide with the launch and rapid development of HSR (For example, on 1 August 2008, the first meaningful HSR was created in China: the Beijing–Tianjin inter-city HSR. In 2009, the Wuhan–Guangzhou HSR became operational. In 2010, the HSR for Zhengzhou–Xian, Shanghai–Nanjing, Nanchang–Jiujiang, and Shanghai–Hangzhou routes were opened. In 2011, Beijing–Shanghai and Guangzhou–Shenzhen HSR opened. In 2012, the HSR for Zhengzhou–Wuhan, Beijing–Hefei, Harbin–Dalian, and Beijing–Guangzhou became functional. In 2013, the HSR for Nanjing–Hangzhou, Hangzhou–Ningbo, Xi’an–Baoji, Xiamen–Shenzhen, Chongqing–Lichuan, and Beijing–Guilin opened). During this time, it seems that air transport did not seem ready to deal with the impact of HSR. Subsequently, the passenger volume of some air routes began to pick up, meaning air transport has begun to adapt to the existence of HSR. From 2014 to 2016, network density increased, mainly because of the growth in the number of routes. Almost all new routes in the CMATN have had no HSR competition or have had routes with long running times on HSR, which may indicate that air transport is trying to avoid HSR competition in its development. The increase in network density indicates the rapid growth of CMATN’s routes and reflects the improvement of network connectivity.

Table 2.
Indicators of overall network structure analysis during 2007–2016.
2. Average path length, average degree, and clustering coefficient
As a travel convenience indicator, average path length measures the transmission capacity and efficiency of a network [66]. Table 3 shows the distribution of minimum connections for all city-pairs. In 2007, around 80% of city-pairs could be connected directly or in one transit. In 2016, this percentage has fallen by around 6% primarily due to some cities that have entered CMATN being connected with only one regional hub. For example, in Xinjiang, six CMATN cities are only connected with Urumqi. Nevertheless, the change in average path length is not significant (it is a slight overall increase). During these 10 years, the average path length in CMATN remained around 2.10. That is, passengers can shuttle between major cities by changing one flight on average. This is slightly lower than the average path length (2.23) calculated by [1] and not significantly different from Italy’s at 1.98–2.14 [13], but slightly higher than the United States’ at 1.84–1.93 [15]. Generally, there is still room for improvement in terms of interconnectedness. However, combined with the network changes in Figure 8, this seems to imply the improvement of China’s regional hub-and-spoke system, as well as an increase in the connectivity between major regional hub cities. In terms of network connectivity, air transport can offset the impact of HSR because of its flexible network design. In other words, although the development of HSR has influenced some air routes, it has generally not caused any substantial changes in air network accessibility.

Table 3.
Distribution of CMATN’s routes by number of connection flights in 2007 and 2016.
The average node degree reflects the average number of edges connected by each node in the network. As Table 2 shows, the average degree increased sharply (6.64–10.25), which means that the average number of routes connecting each city in CMATN has increased significantly. The increase in the average degree does not result in a greater fluctuation of the average path length, which is usually the result of strengthening regional hub-city linkages and the emergence of cities with one degree. Generally, the cities with one degree are generally connected with a regional hub city. This has led to improved local hub-and-spoke structures being formed. We can conclude that China is building a more efficient local hub-and-spoke system and is constantly strengthening the links between local hub cities. The development of Urumqi and Kunming in CMATN shows this phenomenon. Through centrality analysis, this idea can be further verified.
The clustering coefficient measures the overall density of interconnected nodes in a network, which obviously decreased, and the clustering coefficient is much larger than that of a same-scale random network (as Table 2 shows). The decrease in average clustering coefficient implies a decrease in the probability of travelling with fewer transfers in the network and confirms the result derived from Table 3. The calculations for the results of average clustering coefficients and average path length are similar to Wang et al.’s [1] research, so we argue that CMATN always presents small-world properties, with small average path length and large clustering coefficients.
Viewed from the overall network structure, the development of CMATN, with the increase in network density and average degree, the decrease in clustering coefficient and the stabilization of average path length, is becoming more and more balanced. This suggests that the connectivity between major regional hub cities and China’s regional hub-and-spoke system is improving.
3. Degree distribution and relationship between average strength and degree
The cumulative degree distribution follows an exponential distribution, while the relationship between average strength and degree is subject to the power-law. According to the cumulative degree distribution function in Table 2, and have increased, which reflects that is increasing to the same degree, as shown in Figure 10. This indicates that the number of cities with a high degree is increasing. According to the function of the relationship between average strength and degree in Table 2, has decreased and has increased. Further, the strength and degree show a strong correlation, indicating that the more routes a city connects, the higher its passenger volume is, as shown in Figure 11. From Figure 11, we also find that the numbers of cities that are responsible for sending large numbers of passengers has increased. Based on a comprehensive analysis of the changes in these two functions, the trend of CMATN is to distribute large changes in passenger volumes from few to multiple cities. This also more intuitively explains the clustering coefficients’ decrease and proves that the hub-and-spoke system is being optimized.
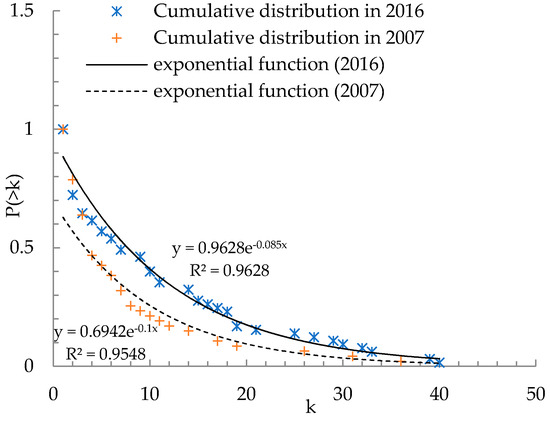
Figure 10.
Cumulative degree distribution in 2007 and 2016.
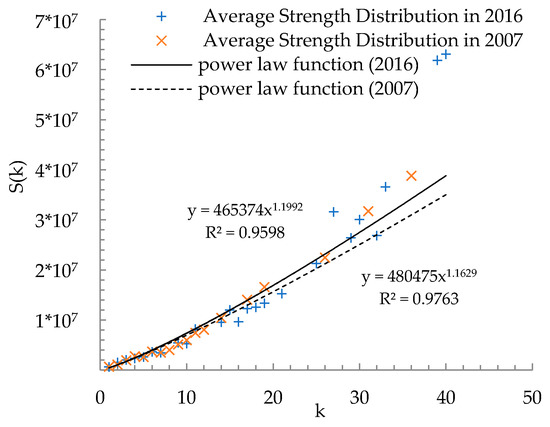
Figure 11.
Strength distribution in 2007 and 2016.
Table 4 shows the degree and strength of CMATN’s major cities. Obviously, the degree and strength of Beijing, Shanghai and Guangzhou are always in the top three, and growth is relatively small, while other cities grow rapidly in both degree and strength. Those cities that have benefited from the development of CMATN are quietly changing the network structure. Except for Beijing, Shanghai and Guangzhou (which are also central cities of the HSR network), other cities are playing an increasingly important role in CMATN. In order to further analyze the role of cities in CMATN, we analyzed the centrality.

Table 4.
The degree and strength of CMATN’s major cities during 2007–2016.
4.1.3. Centrality Analysis
Table 5 shows the top 20 cities’ centralities in 2007 and 2016. Over time, Beijing, Shanghai, and Guangzhou ranked as the top three in terms of normalized degree centrality and normalized closeness centrality, but their centralities registered a downward trend. As the three major hubs of China, these cities have high control over the entire network, but the control level has declined with the evolution of the network. Normalized degree centrality measures the communication ability between a single node and other nodes, which reflects the degree to which the former node is in a relative central position in the network. As the ranking has changed, the normalized degree centrality of other cities has shown an upward trend, with cities such as Chengdu, Kunming, Chongqing, Xi’an, Nanjing, among others, having increased their roles significantly. Overall, in CMATN, the ability of many cities to have direct contact with other cities has increased.

Table 5.
Top 20 cities in terms of centrality in 2007 and 2016.
The normalized closeness centrality examines the degree to which a node does not depend on other nodes to reach another node. In terms of normalized closeness centrality, except for Shenzhen’s decline and Chongqing’s rise, the top 10 cities fluctuated little, while the bottom 10 cities fluctuate greatly. Overall, after 10 years of development, the normalized closeness centrality of these cities improved greatly (except for Beijing, Shanghai, Guangzhou, Shenzhen, and Changsha). This shows that the average shortest distance from many big cities to all other cities decreased. In other words, the increase in the normalized closeness centrality of major cities reflects the increase in the ability of cities to reach each other easily.
The normalized betweenness centrality reflects the extent to which a node is an intermediary between other nodes. In terms of normalized betweenness centrality, the top seven cities have always played an important role, being intermediaries of passenger flows between other cities. Shanghai, in particular, has reached the top of the list. Chongqing and Urumqi have improved greatly, which can be attributed to the rapid development of regional networks, making them regional hubs. The normalized closeness centrality of other cities has also increased.
Combined with the results from Table 4, we can conclude that Beijing, Shanghai, and Guangzhou are still the largest hubs in China’s domestic air passenger transport market, followed by Chengdu, Kunming, Chongqing, and Xi’an. Although Shenzhen has a high centrality, it has a limited role as an intermediary of high passenger flows between other cities. The central positions of Beijing, Shanghai, Guangzhou, and Shenzhen have declined, meaning that the creation of routes with more than 300,000 passengers no longer depends entirely on these four cities, but tends to rely on several large cities with developed tourism sectors.
4.2. Impact of GDP, Tourism and HSR
This section analyzes the impact of GDP, tourism, and HSR on air passenger volume and the formation of CMATN routes. We estimated the parameters of the passenger volume impact model (1) using data on 281 routes from 2007 to 2016, while the parameters of the route formation model (2) were estimated using data on 148 routes that entered or exited CMATN from 2007 to 2016. We use panel data and the Hausman test results to reject the null hypothesis that the random effect estimates are consistent and superior to the fixed effect ones. Therefore, we use the fixed effect model of clustering robust standard errors and the fixed effect logit model of the self-help method to estimate standard errors in models (1) and (2).
The regression results are given in Table 6 and Table 7. In Table 6, the coefficient of HSR estimates the competition effects of HSR on air passenger volumes, and the coefficients of GDP, tourism and population also estimate the average effects of these variables on air passenger volumes. In Table 7, the coefficient of HSR estimates the effect of HSR on the odds ratio of a route becoming a member of CMATN.

Table 6.
Regression results of model (1).

Table 7.
Regression results of model (2).
According to these results, HSR has a significant negative effect on passenger volume and the formation of CMATN routes, which indicates that competition from HSR not only puts pressure on air passenger volumes, but also affects CMATN structure by increasing the probability of routes exiting CMATN. When HSR exists on a certain route, the average air passenger volumes are 14.973 thousand lower than those without HSR, and the odds ratio of a route exiting CMATN increases 93.59% [exp(−2.747) − 1 = −0.9359] as compared to those without HSR under the same conditions of other factors. Base on the original data, it can be said that the competition from HSR affects some routes, not only inhibiting their growth in terms of passenger volume (e.g., Jinan–Hangzhou, Guiyang–Changsha, Wuhan–Guiyang, Jinan–Dalian, Guangzhou–Zhengzhou, Beijing–Shenyang, Beijing–Yantai, Beijing–Nanjing, Wuhan–Guangzhou, Shenzhen–Wuhan, Shanghai–Wenzhou, and Nanchang–Shanghai) but also increasing their probability of withdrawing from CMATN (e.g., Wuxi–Beijing, Guangzhou–Nanning, Guangzhou–Changsha, Changsha–Shenzhen, Shanghai–Jinan, Beijing–Jinan, Shenzhen–Xiamen, and Beijing–Zhengzhou). Most routes entering CMATN do not overlap with HSR or overlap with HSR routes with long running times (e.g., Nanjing–Jinan, Hefei–Chongqing, Hefei–Chengdu, Nanchang–Chengdu, Haikou–Chengdu, Lanzhou–Chengdu, and many other routes). HSR development will thus affect air passenger volumes and network structure.
The GDPs of city-pairs have a significant positive effect on passenger volume and the formation of CMATN routes, which indicates that GDP increases promote the increase in air passenger volumes and the likelihood of a route becoming a main one. The nodes in Figure 9 are cities with high GDP. These cities not only have growing passenger volumes among them, but have also formed many new main routes.
The tourism attributes of city-pairs also have a significant positive effect on passenger volume and the formation of CMATN routes, which indicates that tourism will promote the increase in air passenger volumes and the creation of major routes. Figure 8 shows that the local hub-and-spoke system of Urumqi and Kunming is the result of the development of tourism.
Models (1) and (2) analyze the impact of GDP, tourism, and HSR on the network from the perspective of weight (passenger volume) and edges (main routes). The results validate the results of the complex network analysis. Combining both results, we can conclude that although the competition from HSR will affect the structure of CMATN, the impact is limited because the HSR line is already established, while the geographical limitation of air transport is relatively small [17] and setting air routes is relatively flexible.
5. Discussion and Conclusions
In order to study the evolution and determinants of the air transport network, this study considers the case of CMATN and discusses the evolution of CMATN and the influence of GDP, tourism, and HSR on the network structure. Routes with an annual passenger volume of more than 300,000 are the backbone of the air transport network. Therefore, this paper uses this as the criterion for the selection of routes, using complex networks and an econometric model to analyze the evolution of CMATN from 2007 to 2016. Based on the use of complex networks and an econometric model, we draw the following main conclusions:
1. CMATN is mainly located in economically developed and densely populated regions in central and eastern China. In recent years, in terms of both network structure and passenger volume, CMATN improved significantly. In terms of population density, city-pair GDP is the main determinant of the change in network structure, while tourism is the main determinant of the continuous outward expansion of the network.
2. Since 2011, the competition from HSR has led to a decline in CMATN passenger volumes, thus changing the network structure. However, the route design of HSR is not as flexible as that of air transport, so the impact of HSR is rather limited. With the increasing adaptability of air transport to HSR, the network structure of air transport has been continuously optimized. In other words, China is establishing a more effective regional hub-and-spoke system.
3. CMATN changed from having a few cities as main nodes to many cities playing the same role together. Beijing, Shanghai, and Guangzhou have always been important hubs, but their network control power is declining. Conversely, Chengdu, Kunming, Chongqing, Xi’an, Urumqi, and other cities play an increasingly important role in the network. Generally, the formation of routes with passenger volumes above 300,000 does not solely rely on Beijing, Shanghai, and Guangzhou, and the competition from HSR has contributed to this phenomenon. This is not a negative phenomenon and is conducive to the development of Beijing, Shanghai, and Guangzhou as international hub cities. It also promotes the construction of the local hub-and-spoke system.
4. Beijing, Shanghai, Guangzhou, Kunming, Chongqing, Chengdu, and Xi’an are the seven most important hub cities, forming an O shape on the map. Each city has a relatively broad “spoke” space. This type of distribution of cities is becoming increasingly important in CMATN, as the entire network structure is becoming increasingly complex and the hub-and-spoke system increasingly efficient.
5. CMATN is a typical small-world network. The cumulative degree distribution always follows the exponential function, and the strength of cities is positively correlated with their degree. Although the average path length does not change significantly, the increase in the average degree and decrease in the average clustering coefficient further illustrate that the network is becoming more complex and the role of each city is constantly changing. All these results indicate that CMATN is developing from transporting a large numbers of passengers through a few cities to channeling transportation through many cities, which also proves the optimization of the system.
As we could not obtain passenger data for all air routes in China over the past 10 years, we were unable to study the evolution process of the entire air transport network of China. However, as the backbone of the air transport network, CMATN is the busiest passenger transport network in China. Certain reference values for identifying the changing rules of the air transport network and analyzing its determinants that are helpful for civil aviation’s sustainable development have been identified and discussed in this paper.
Author Contributions
W.L. contributed to all aspects of this work; M.S. wrote the main manuscript text, conducted the experiment, and analyzed the data; and Z.L., S.W. and Z.Z. revised the paper. All the authors have reviewed the manuscript.
Funding
This research study was supported by the National Natural Science Foundation of China (Grant No. 41671117), the National Natural Science Foundation for Young Scholars of China (Grant No. 41701134) and the Fundamental Research Funds for The Central Universities (Grant No. 3132019363; Grant No. 3132018159).
Acknowledgments
This research study was supported by the National Natural Science Foundation of China (Grant No. 41671117), the National Natural Science Foundation for Young Scholars of China (Grant No. 41701134) and the Fundamental Research Funds for The Central Universities (Grant No. 3132019363; Grant No. 3132018159). The authors would like to acknowledge all experts’ contributions in the building of the model and the formulation of the strategies in this study.
Conflicts of Interest
The authors declare no conflict of interest.
References
- Wang, J.; Mo, H.; Wang, F.; Jin, F. Exploring the network structure and nodal centrality of China’s air transport network: A complex network approach. J. Transp. Geogr. 2011, 19, 712–721. [Google Scholar] [CrossRef]
- Jiao, J.; Wang, J.; Jin, F. Impacts of high-speed rail lines on the city network in China. J. Transp. Geogr. 2017, 60, 257–266. [Google Scholar] [CrossRef]
- Yang, H.; Dijst, M.; Witte, P.; Ginkel, H.; Wang, J. Comparing passenger flow and time schedule data to analyse High-Speed Railways and urban networks in China. Urban Stud. 2018, 56, 1267–1287. [Google Scholar] [CrossRef]
- Bagler, G. Analysis of the airport network of India as a complex weighted network. Phys. A Stat. Mech. Appl. 2008, 387, 2972–2980. [Google Scholar] [CrossRef]
- Dunn, S.; Wilkinson, S.M. Increasing the resilience of air traffic networks using a network graph theory approach. Transp. Res. Part E Logist. Transp. Rev. 2016, 90, 39–50. [Google Scholar] [CrossRef]
- Hossain, M.M.; Alam, S. A complex network approach towards modeling and analysis of the Australian Airport Network. J. Air Transp. Manag. 2017, 60, 1–9. [Google Scholar] [CrossRef]
- Jiang, X.; Wen, X.; Wu, M.; Song, M.; Tu, C. A complex network analysis approach for identifying air traffic congestion based on independent component analysis. Phys. A Stat. Mech. Appl. 2019, 523, 364–381. [Google Scholar] [CrossRef]
- Klophaus, R.; Lordan, O. Code sharing network vulnerability of global airline alliances. Transp. Res. Part A Policy Pract. 2018, 111, 1–10. [Google Scholar] [CrossRef]
- Song, M.G.; Yeo, G.T. Analysis of the Air Transport Network Characteristics of Major Airports. Asian J. Shipp. Logist. 2017, 33, 117–125. [Google Scholar] [CrossRef]
- Yang, H.; Dobruszkes, F.; Wang, J.; Dijst, M.; Witte, P. Comparing China’s urban systems in high-speed railway and airline networks. J. Transp. Geogr. 2018, 68, 233–244. [Google Scholar] [CrossRef]
- Guimerà, R.; Mossa, S.; Turtschi, A.; Amaral, L. The worldwide air transportation network: Anomalous centrality, community structure, and cities’ global roles. Proc. Natl. Acad. Sci. USA 2005, 102, 7794–7799. [Google Scholar] [CrossRef] [PubMed]
- Wandelt, S.; Sun, X. Evolution of the international air transportation country network from 2002 to 2013. Transp. Res. Part E Logist. Transp. Rev. 2015, 82, 55–78. [Google Scholar] [CrossRef]
- Guida, M.; Maria, F. Topology of the Italian airport network: A scale-free small-world network with a fractal structure? Chaos Solit. Fractals 2007, 31, 527–536. [Google Scholar] [CrossRef]
- Watts, D.J.; Strogatz, S.H. Collective dynamics of ‘small-world’ networks. Nature 1998, 393, 440–442. [Google Scholar] [CrossRef] [PubMed]
- Xu, Z.; Harriss, R. Exploring the structure of the U.S. intercity passenger air transportation network: A weighted complex network approach. GeoJournal 2008, 73, 87–102. [Google Scholar]
- Du, W.; Liang, B.; Hong, C.; Lordan, O. Analysis of the Chinese provincial air transportation network. Phys. A Stat. Mech. Appl. 2017, 465, 579–586. [Google Scholar] [CrossRef]
- Lin, J. Network analysis of China’s aviation system, statistical and spatial structure. J. Transp. Geogr. 2012, 22, 109–117. [Google Scholar] [CrossRef]
- Zhang, J.; Cao, X.; Du, W.; Cai, K. Evolution of Chinese airport network. Phys. A Stat. Mech. Appl. 2010, 389, 3922–3931. [Google Scholar] [CrossRef]
- Zhang, X.; Tang, X.; Jiang, K. Empirical Study of Chinese Airline Network Structure Based on Complex Network Theory. J. Transp. Syst. Eng. Inf. Technol. 2011, 11, 175–181. [Google Scholar]
- Azzam, M.; Klingauf, U.; Zock, A. The accelerated growth of the worldwide air transportation network. Eur. Phys. J. Spec. Top. 2013, 212, 35–48. [Google Scholar] [CrossRef]
- Gautreau, A.; Barrat, A.; Barthlemy, M. Microdynamics in stationary complex networks. Proc. Natl. Acad. Sci. USA 2009, 106, 8847–8852. [Google Scholar] [CrossRef]
- Jia, T.; Qin, K.; Shan, J. An exploratory analysis on the evolution of the US airport network. Phys. A Stat. Mech. Appl. 2014, 413, 266–279. [Google Scholar] [CrossRef]
- Lin, J.; Ban, Y. The evolving network structure of US airline system during 1990–2010. Phys. A Stat. Mech. Appl. 2014, 410, 302–312. [Google Scholar] [CrossRef]
- Burghouwt, G.; Hakfoort, J. The evolution of the European aviation network. J. Air Transp. Manag. 2001, 7, 311–318. [Google Scholar] [CrossRef]
- Papatheodorou, A.; Arvanitis, P. Spatial evolution of airport traffic and air transport liberalisation: The case of Greece. J. Transp. Geogr. 2009, 17, 402–412. [Google Scholar] [CrossRef]
- Jimenez, E.; Claro, J.; de Sousa, J.P. Spatial and commercial evolution of aviation networks: A case study in mainland Portugal. J. Transp. Geogr. 2012, 24, 383–395. [Google Scholar] [CrossRef]
- Wang, J.; Mo, H.; Wang, F. Evolution of air transport network of China 1930–2012. J. Transp. Geogr. 2014, 40, 145–158. [Google Scholar] [CrossRef]
- Jin, F.; Wang, F.; Liu, Y. Geographic Patterns of Air Passenger Transport in China 1980–1998: Imprints of Economic Growth, Regional Inequality, and Network Development. Prof. Geogr. 2004, 56, 471–487. [Google Scholar]
- Dargay, J.M.; Clark, S. The determinants of long distance travel in Great Britain. Transp. Res. Part A Policy Pract. 2012, 46, 576–587. [Google Scholar] [CrossRef]
- Lee, J.; Yoo, K.; Song, K. A study on travelers’ transport mode choice behavior using the mixed logit model: A case study of the Seoul-Jeju route. J. Air Transp. Manag. 2016, 56, 131–137. [Google Scholar] [CrossRef]
- Park, Y.; Ha, H.K. Analysis of the impact of high-speed railroad service on air transport demand. Transp. Res. Part E Logist. Transp. Rev. 2006, 42, 95–104. [Google Scholar] [CrossRef]
- Román, C.; Martín, J.C.; Espino, R.; Cherchi, E.; Ortúzar, J.D.D.; Rizzi, L.I.; González, R.M.; Amador, F.J. Valuation of travel time savings for intercity travel: The Madrid-Barcelona corridor. Transp. Policy 2014, 36, 105–117. [Google Scholar] [CrossRef]
- Socorro, M.P.; Viecens, M.F. The effects of airline and high speed train integration. Transp. Res. Part A Policy Pract. 2013, 49, 160–177. [Google Scholar] [CrossRef]
- Kim, J.J.; Kim, I. Entrepreneurial Marketing and Airline-Cause Sponsorship Congruence: Passenger Sponsorship Response to US-Based Full-Service Airlines. Sustainability 2018, 7, 2359. [Google Scholar] [CrossRef]
- Wang, Y.; Yan, X.; Zhou, Y. Influencing Mechanism of Potential Factors on Passengers’ Long-Distance Travel Mode Choices Based on Structural Equation Modeling. Sustainability 2017, 11, 1943. [Google Scholar] [CrossRef]
- Givoni, M.; Banister, D. Airline and railway integration. Transp. Policy 2006, 13, 386–397. [Google Scholar] [CrossRef]
- Jiang, C.; Zhang, A. Effects of high-speed rail and airline cooperation under hub airport capacity constraint. Transp. Res. Part B Methodol. 2014, 60, 33–49. [Google Scholar] [CrossRef]
- Jiang, C.; D’Alfonso, T.; Wan, Y. Air-rail cooperation: Partnership level, market structure and welfare implications. Transp. Res. Part B Methodol. 2017, 104, 461–482. [Google Scholar] [CrossRef]
- Xia, W.; Jiang, C.; Wang, K.; Zhang, A. Air-rail revenue sharing in a multi-airport system: Effects on traffic and social welfare. Transp. Res. Part B Methodol. 2019, 121, 304–319. [Google Scholar] [CrossRef]
- Dobruszkes, F. High-speed rail and air transport competition in Western Europe: A supply-oriented perspective. Transp. Policy 2011, 18, 870–879. [Google Scholar] [CrossRef]
- Dobruszkes, F.; Dehon, C.; Givoni, M. Does European high-speed rail affect the current level of air services? An EU-wide analysis. Transp. Res. Part A Policy Pract. 2014, 69, 461–475. [Google Scholar] [CrossRef]
- Yang, H.; Burghouwt, G.; Wang, J.; Boonekamp, T.; Dijst, M. The implications of high-speed railways on air passenger flows in China. Appl. Geogr. 2018, 97, 1–9. [Google Scholar] [CrossRef]
- Albalate, D.; Bel, G.; Fageda, X. Competition and cooperation between high-speed rail and air transportation services in Europe. J. Transp. Geogr. 2015, 42, 166–174. [Google Scholar] [CrossRef]
- Wan, Y.; Ha, H.; Yoshida, Y.; Zhang, A. Airlines’ reaction to high-speed rail entries: Empirical study of the Northeast Asian market. Transp. Res. Part A Policy Pract. 2016, 94, 532–557. [Google Scholar] [CrossRef]
- Zhang, R.; Johnson, D.; Zhao, W.; Nash, C. Competition of airline and high-speed rail in terms of price and frequency: Empirical study from China. Transp. Policy 2019, 78, 8–18. [Google Scholar] [CrossRef]
- Bergantino, A.S.; Capozza, C. One price for all? Price discrimination and market captivity: Evidence from the Italian city-pair markets. Transp. Res. Part A Policy Pract. 2015, 75, 231–244. [Google Scholar] [CrossRef]
- Bergantino, A.S.; Capozza, C.; Capurso, M. The impact of open access on intra- and inter-modal rail competition. A national level analysis in Italy. Transp. Policy 2015, 39, 77–86. [Google Scholar] [CrossRef]
- Capozza, C. The effect of rail travel time on airline fares: First evidence from the Italian passenger market. Econ. Transp. 2016, 6, 18–24. [Google Scholar] [CrossRef]
- Yang, H.; Zhang, A. Effects of high-speed rail and air transport competition on prices, profits and welfare. Transp. Res. Part B Methodol. 2012, 46, 1322–1333. [Google Scholar] [CrossRef]
- Wang, J.; Bonilla, D.; Banister, D. Air deregulation in China and its impact on airline competition 1994–2012. J. Transp. Geogr. 2016, 50, 12–23. [Google Scholar] [CrossRef]
- Li, W.; Cai, X. Statistical analysis of airport network of China. Phys. Rev. E Stat. Nonlinear Soft Matter Phys. 2004, 69, 46106. [Google Scholar] [CrossRef]
- IATA. IATA Annual Review 2017; IATA: Montreal, QC, Canada, 2017; p. 12. [Google Scholar]
- Fu, X.; Zhang, A.; Lei, Z. Will China’s airline industry survive the entry of high-speed rail? Res. Transp. Econ. 2012, 35, 13–25. [Google Scholar] [CrossRef]
- Su, M.; Luan, W.; Yuan, L.; Zhang, R.; Zhang, Z. Sustainability Development of High-Speed Rail and Airline—Understanding Passengers’ Preferences: A Case Study of the Beijing–Shanghai Corridor. Sustainability 2019, 11, 1352. [Google Scholar] [CrossRef]
- Boorman, S.A.; White, H.C. Social Structure from Multiple Networks. II. Role Structures. Am. J. Sociol. 1976, 81, 1384–1446. [Google Scholar] [CrossRef]
- Barabási, A.; Albert, R. Emergence of Scaling in Random Networks. Science 1999, 286, 509–512. [Google Scholar] [PubMed]
- Freeman, L.C. A Set of Measures of Centrality Based on Betweenness. Sociometry 1977, 40, 35–41. [Google Scholar] [CrossRef]
- Freeman, L.C. Centrality in social networks conceptual clarification. Soc. Netw. 1978, 1, 215–239. [Google Scholar] [CrossRef]
- Bagler, G. Complex Network view of performance and risks on Airport Networks. arXiv 2008, arXiv:0805.0924. [Google Scholar]
- Zhang, Q.; Yang, H.; Wang, Q.; Zhang, A. Market power and its determinants of the Chinese airline industry. Transp. Res. Part A Policy Pract. 2014, 64, 1–13. [Google Scholar] [CrossRef]
- Zhang, F.; Graham, D.J.; Wong, M.S.C. Quantifying the substitutability and complementarity between high-speed rail and air transport. Transp. Res. Part A Policy Pract. 2018, 118, 191–215. [Google Scholar] [CrossRef]
- Su, M.; Luan, W.; Sun, T. Effect of High-speed Rail Competition on Airlines’ Intertemporal Price Strategies. J. Air Transp. Manag. 2019, 101694. [Google Scholar]
- Fageda, X.; Villadangos, L.F. Triggering competition in the Spanish airline market: The role of airport capacity and low-cost carriers. J. Air Transp. Manag. 2009, 15, 36–40. [Google Scholar] [CrossRef]
- Zhang, Q.; Yang, H.; Wang, Q. Impact of high-speed rail on China’s Big Three airlines. Transp. Res. Part A Policy Pract. 2017, 98, 77–85. [Google Scholar] [CrossRef]
- Yuan, Z.; Wei, F. Research on optimal intertemporal pricing of airline tickets. China Ind. Econ. 2014, 7, 148–160. [Google Scholar]
- Costa, L.; Rodrigues, F.; Travieso, G.; Boas, P. Characterization of complex networks: A survey of measurements. Adv. Phys. 2007, 56, 167–242. [Google Scholar] [CrossRef]
© 2019 by the authors. Licensee MDPI, Basel, Switzerland. This article is an open access article distributed under the terms and conditions of the Creative Commons Attribution (CC BY) license (http://creativecommons.org/licenses/by/4.0/).