Abstract
This research presents a combined qualitative and quantitative method focused on determining the level of importance that users place on different attributes of a railway service. The identification of these preferences will allow the establishment of policies that could increase the quality and demand of this mode. The qualitative analysis is based on a participation process through focus groups and in-depth interviews. From these sources, a diagnosis of the system and the main attributes that may influence the demand have been obtained. The quantitative part of the methodology is grounded on the realization of a stated preference survey using Best–Worst case 1 scaling. This method has made it possible to determine that the attributes related to the fare system, travel time, and intermodality are the most important to increase the quality of rail transport. Instead, the least important attributes were those related to very specific additional services. At the same time, it has been observed that the importance varies depending on the frequency of railway use. Thus, less frequent and nonusers considered the connections with other transport modes and user information more important. Therefore, improving intermodality could be a cost-effective way to attract new users.
1. Introduction and Objectives
Current transport policies are focusing on promoting more efficient and environmentally friendly travel modes. The railway has proven to be a transportation alternative that meets this criterion. The roadmap of transport of the European Commission [1] advocates for a promotion of this mode to the detriment of road transport, given its greater sustainability both environmentally and in terms of safety.
In order to encourage the use of the railway and to increase its future demand, it is necessary to establish which aspects are more appealing to the different types of transport users, i.e., which aspects are more important to determine service quality. In this research, a methodology is proposed to understand what are the key aspects of a railway service and how important are they for users.
Service quality studies have highlighted the importance of considering the perceptions of the users, trying to improve those aspects in which they are more interested in order to increase the demand of public transport [2]. In addition, the railway sector is now more open to competition both within the sector, given the liberalization measures promoted by the European Union [3,4], and with other transport modes [5,6,7] which implies that it must pay more attention to users’ satisfaction.
Several authors have developed service quality studies in the field of railways using satisfaction or Stated Preference (SP) surveys. Satisfaction surveys can contain questions about the perception or the importance of each service attribute as well as the overall service. These satisfaction surveys allow for users’ opinions to be taken into account and avoids evaluating public transports services only from the point of view of the managers. The first satisfaction surveys were carried out in the air and urban transport sector [8,9] and have been much more rarely applied in the land interurban transport, including the railway sector. Givoni and Rietveld [10] and Brons et al. [11] performed a customer satisfaction survey highlighting the importance of considering the access and the quality of the facilities present in the stations to increase the demand of the railway mode. They argued that measures focused on improving these aspects can be more cost-effective than increasing the number or the quality of the railway services. In another case study, Nandan [12] tried to collect evidence of the determinants of customer satisfaction with service quality of railway platforms at stations. The authors considered five determinants of customer satisfaction: information, behavioural factors, basic facilities, refreshments, and safety/security. The results achieved, using a sample of 700 railway users collected at 12 platforms of one station, showed how refreshments and behavioural factors (behaviour of railway staff) were the most important attributes for passengers. Considering the quality of the service, Nathanail [13] studied the Hellenic Railways with the aim of measuring the level of quality of the different aspects and their importance to the users. Using 22 indicators, it was established that the service was performing high in safety, accuracy, and additional services but low in cleanliness and provision of information to users. In addition, the research found that the most important attributes for users were safety during the trip, itinerary accuracy, and train and station cleanness. In another case study in Italy, Eboli and Mazzulla [14], using a satisfaction survey and a structural equation model, concluded that information, cleanliness, punctuality, and frequency of the services were the key aspects that should receive new investments according to the preferences of the users. Finally, Aydin et al. [15] studied the situation of the rail transit systems of Istanbul through a customer satisfaction survey. Additionally, the authors conducted a questionnaire to professionals and academics in order to calculate the importance of the different criteria using a pairwise comparison. The results showed that safety, total journey time (waiting time, in-vehicle time, and itinerary accuracy) and accessibility were the most important criteria according to the experts.
SP surveys can also be applied to know the importance of different attributes in the quality of service (stated importance) in addition to its common application in explaining travel choices, making forecasts about the market share of different transport modes or estimating the value of time of users [16,17]. In the field of railways, Ahern and Tapley [18] used a SP survey to simulate the choice between bus and train in intercity trips in Ireland. The authors concluded that the cost and travel time were the most important variables when explaining the modal choice. Park and Ha [19] applied a similar methodology for intercity travel with competition between the high-speed train and the airplane using the fare, frequency, and access/destination time as attributes. The authors estimated that the discrete choice model based on SP data presented an error of 14% compared to the real demand of travellers who finally use the train and the airplane. Román et al. [20] analysed the competition between the high-speed train and other modes available in the Madrid–Zaragoza–Barcelona (Spain) corridor using a mixture of SP data and revealed preference data (RP). The forecasts made by the authors were based on variables such as travel cost (fare), travel time, access time/destination time, frequency, comfort, and reliability. In this case, the demand was more responsive to travel time than to the fare or access/destination time. In Liu et al. [21], the most influential variables were analysed when increasing the use of Maryland rail modes. These authors observed that the importance of the variables changed according to the type of transport analysed (metro, light rail, and commuter rail). For light rail stations, employment nearby, service level, feeder bus connectivity, stations located in the Central Business District (CBD), and terminal stations were significant factors affecting ridership, while for commuter rail, only feeder bus connections turned out to be significant. The studies presented above infer the relative importance of service attributes based on modelling results. However, the recent study developed by Cao and Cao [22] shows that the importance levels can vary depending on if they are inferred from a modelling technique or directly asked to the users via a traditional rating.
The methodology proposed in this research is based on the combination of qualitative and quantitative techniques. Among the qualitative techniques, Focus Groups (FGs) and the in-depth interviews were chosen. Through this information, a diagnosis of the railway mode was made, obtaining a list of the variables that may influence the choice of railway by transport users. A similar procedure was applied in dell’Olio et al. [23] to establish the variables that affect the behaviour of individuals in railway incidents and accidents. Among the quantitative methods, the use of an SP survey is proposed to elaborate a complete ranking of the importance of the variables related to the railway service, based on a Best–Worst (BW) case 1 scaling [24].
The main contribution of this research is to develop and test a complete methodology for determining the most important attributes of the railway service to different types of transport users. In addition, it has been decided to use a BW survey technique [24], which, as far as the authors’ knowledge, has not been directly applied before to the railway field or to define the importance of the different attributes belonging to the railway service. However, this method has been successfully used to analyse the importance of the different attributes belonging to a bus-based urban transport service. This was the case of the study made by Beck and Rose [25], where the authors carried out a comparison between the satisfaction and the importance of the different attributes of the public transport service. These authors concluded that, in their case, the BW surveys allowed respondents to be more committed to conducting the questionnaire. In addition, it was possible to capture the difference given to different attributes between importance and satisfaction and its correlation structure, unlike when using traditional rating methods.
In the following section, the proposed methodology is detailed, making use of both qualitative and quantitative techniques. In Section 3, this methodology is applied to a practical case study. The aim of this case study is to determine the importance of different attributes of the railway mode for users. This section will summarize the results obtained in the qualitative research, mainly through a SWOT (Strengths, Weaknesses, Opportunities, and Threats) analysis, as well as the results of the quantitative research based on the data collected by the BW survey. Finally, Section 4 summarizes the main conclusions derived from this study.
2. Proposed Methodology
The methodology applied in the study has been divided into two main phases (see Figure 1). The first phase, consultation or the qualitative phase, aims to obtain information from the agents involved on the railway system. The objective is to determine what are the main attributes that affect the choice of the railways compared to other modes. This first phase was based on the use of FGs and in-depth interview techniques. Different stakeholders were involved in this phase such as passengers, railway crew, and railway scholars/experts.
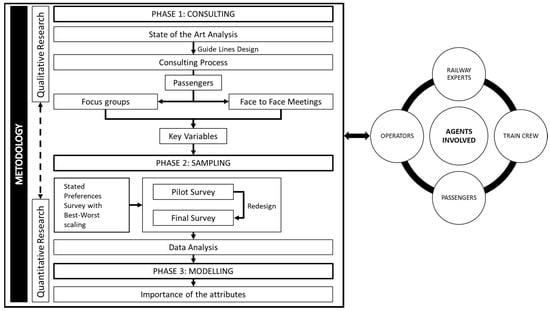
Figure 1.
Methodology proposed for studying the needs of transport users.
The second block of the methodology is based on the design and implementation of a SP survey based on a BW case 1 type responses. Using the data obtained from this survey, it is possible to order the attributes obtained in the qualitative phase according to their level of importance. These attributes were selected as key factors to enhance the quality and demand of the railway mode. In Figure 1, a complete scheme of the proposed methodology is presented.
2.1. Qualitative Research
The qualitative research consists mainly of a consultation phase with the main agents involved in the railway sector. Prior to the consultation stage, a review of the existing literature was made. After that, the consultation process is developed by using two well-known techniques such as FGs and in-depth interviews.
A FG is a research method designed to explore a particular topic by gathering the experiences and perceptions of selected target populations [26], where a moderator leads the group and guides the conversation [27]. Krueger and Casey [28] define an FG as a carefully designed discussion providing people’s perceptions on a particular area of interest. For example, Ibeas et al. [29] used FGs and Mega Focus Groups (MFG) to find out people’s opinions and perceptions on mobility within an urban environment. The methods for carrying out these in-depth interviews and FGs are fundamentally three [30]: (i) Face to face, gathering groups of people to carry out FGs (of a minimum of 8 people) or through face-to-face interviews; (ii) by telephone or video-call; and (iii) via web through an online platform.
These three methods can be used to extract relevant information. However, each method has its own advantages and disadvantages that need to be considered. The face-to-face method is, among the three exposed, the one that allows gathering more direct information from the agents. Both the interviews and the FGs should be conducted by a skilled person in order to ensure that the quantity and quality of the information obtained is the highest possible. However, the realization of face-to-face interviews and FGs also implies additional costs derived from the need to travel and the use of facilities and additional material (recording tools and so on). The interview/FG format via telephone or video-call has its main advantage in allowing remote interaction with the respondent, although it is likely that it does not allow for the collection of as much information as the face-to-face method. Finally, online web formats have the advantage of being cheap to apply, although achieving the participation of agents through online platforms can be more complicated than through direct interview methods.
The choice of method for conducting the interviews and FGs therefore depends on the resources available and the advantages associated with each method. In general, the use of face-to-face methods is the most advisable to capture all possible information. In addition, it must be kept in mind that these techniques must be applied to all agents with significant relevance in the field of study. In the case of railway mobility, it would be advisable to have the information provided by passengers, experts (academics, operators, and entrepreneurs) and workers of the sector. Based on the above, the face-to-face interview format was chosen for this study.
The information collected through these qualitative techniques can be synthesized using different procedures. In this case, the application of the SWOT analysis is proposed [31] to make a general diagnosis of the railway sector. From the analysis of the consultation process, a selection of relevant attributes for the improvement of railway transport is obtained.
2.2. Quantitative Research
The quantitative research consists of the sampling and modelling phases (see Figure 1). Once the qualitative research is carried out, enough information is available to proceed with the design of the survey. This survey allows us to define what the most relevant attributes for users are. Therefore, the qualitative information is an essential requirement to carry out the qualitative analysis.
The survey serves to determine the order of importance of all the attributes indicated by the users. SP surveys are based on presenting hypothetical scenarios shown to different users in which they have to choose the best alternative according to their preferences [32]. The use of the SP technique is necessary in this case, as traditional RP rating surveys are insufficient to capture the information and variability of the importance given to such a high number of attributes. SP surveys aim to capture the preferences of users regarding these attributes, being a quasi-experiment based on hypothetical situations established by the researcher and therefore being an approximation to a controlled experiment [33].
The SP survey can be accompanied by a user characterization survey if it is required to differentiate between the preferences of different sociodemographic groups. Before carrying out the final characterization/SP survey, it is advisable to make a pilot survey to refine the questionnaire and to ensure the best design possible.
However, a large evidence shows that the assignment of attributes in an SP survey can have an impact on the responses and hence on the results of the models derived from them [32]. Therefore, this assignment of attributes cannot be done randomly but must be applied using a systematic method that provides the best possible results according to the established objectives. Among the currently available methods, efficient techniques stand out which allow obtaining parameters in the models with the lowest possible standard error [34,35]. Efficient designs are based on minimizing an efficiency indicator, the best known being the D-error:
where Ω is the variance-covariance matrix, are prior parameters, and k is the number of parameters to be estimated in the model. This technique allows for the selection of, among all hypothetical scenarios, those that reproduce more robust parameters for the model that is intended to be estimated. The efficient design is useful to eliminate the problems related to classic factorial or orthogonal designs, presenting the advantage of reproducing robust models even when the respondents do not answer to all the scenarios presented (a relatively frequent case). To calculate the experimental design, specific software such as NGene can be used [36].
If the D-Error type of design is selected, the required sample is determined by the parameter of the model with the highest standard error:
where N is the required sample, is the standard error of a parameter, and tα is the value of the T test for a given level of confidence.
The questionnaire should be designed to be answered by a sample of the target population, ensuring that the parameters obtained are representative. This type of surveys can be done through the following methods [2]: interception, telephone, online, or by ordinary mail. Each method has its advantages and disadvantages, although the online survey is the only feasible strategy with moderate costs in the case of a very broad geographical scope of people to be surveyed.
The data obtained from this SP survey can be later used in the analysis and modelling phase. In this case, a model based on BW (case 1) responses is proposed, where respondents have to indicate the most important and least important attributes for them from a predefine set of options. This type of choice allows to obtain more information than the traditional simple choice, and at the same time, it does not require as much cognitive load for the respondent as to make a complete ranking of all the attributes presented [37]. In this way, BW scaling can be considered a mid-point between the single choice and a complete ranking, balancing the main strengths and weaknesses of both kinds of responses.
The modelling of the data can be done following the Multinomial Logit (MNL) method, the most popular discrete choice model used in transport. In this model, random residuals are considered to be distributed according to a Gumbel distribution [38]. The probability of choice is given by the following expression:
where the probability of choosing the option as best and the option as worst from among a set is based on the differences on utilities between all the alternatives . These utilities are defined generally by a vector of parameters to be estimated . Thus, the parameter estimate can be interpreted as the importance level of attribute k relative to the reference/base attribute which has .
3. Case Study and Results
3.1. Case Study Description
The methodology presented in the previous section has been applied to the case study of the NEAR2050 project (Shift2Rail Programme). The aim of the study has been to determine the importance that different attributes have for transport users when choosing the railway to make their trips. The action on the most relevant attributes should be preferential to increase the railway quality and demand. The project has focused on studying the European railway environment, considering all the distances covered by the railway transport (urban, intercity and long distance, understanding as urban railways metro, light rails, and tram services).
3.2. Qualitative Analysis Results
In the consultation phase of qualitative research, it was decided to carry out a total of 3 FGs and 7 in-depth interviews with various agents involved in the railway sector. The interviews were conducted exclusively with experts (academics, managers, presidents of railway organizations, etc.). Given that the perceptions of users and the crew may be different, it was decided to carry out separate FGs, two with 8 users each and one more with 8 railway workers. Both in the interviews and in the FGs, those involved were asked to present their opinions considering a European scope. All the consultation phase was carried out from December 2016 to February 2017. From this qualitative research, two results were obtained:
- On the one hand, an analysis of Weaknesses, Threats, Strengths, and Opportunities of the railway sector (SWOT analysis).
- On the other hand, a list of attributes that can influence the choice of the railway mode by transport users. This list was also complemented with the results of the literature analysed.
3.2.1. SWOT Analysis
The results of the SWOT analysis conducted jointly from both interviews and FGs are shown in Table 1 (strengths and weaknesses internal to the railway sector) and Table 2 (opportunities and threats external to the railway sector). The SWOT analysis allows to obtain a preliminary diagnosis about the status of the railway sector according to the agents involved. The information shown in the SWOT represents the main aspect in which the different agents had a consensus about the different characteristics of the railway sector. This information was obtained through the analysis of the transcripts of the FGs and in-depth interviews.

Table 1.
SWOT (Strengths, Weaknesses, Opportunities, and Threats) Analysis: Strengths and weaknesses extracted from focus groups (FGs) and in-depth interviews.
Table 2.
SWOT Analysis: Opportunities and threats extracted from FGs and in-depth interviews.
Among the strengths of the system, aspects related to information, accessibility, or auxiliary services and comfort stand out, especially those related to the main station and services. Weaknesses, on the other hand, are more related to the tariff system and deficiencies in certain services, such as low frequencies, lack of services in non-main stations, and growing obsolescence in lines that are not adapted to high speed.
The opportunities mentioned in the rail system are the possibility of technological improvements in areas such as ticket acquisition systems, user access systems to trains, augmented reality services to improve information, or new systems that allow the prevention of delays or incidents. The possibility of introducing improvements to the fare system, such as new low-cost services, improvements in intermodality through parking and public transport, and more specialized on-board services, were also cited.
Within the threats are the competition with other current transport modes such as the bus, given its higher frequencies, and a possible future competition with new transport modes based on vacuum (i.e., Hyperloop) technology. The excessive use of technology was also mentioned as a threat in case of leading to an excessively impersonal customer treatment. Finally, the lack of interoperability between railway systems in different countries was also considered as a relevant threat.
3.2.2. Influential Attributes
A list of attributes was selected based on the interviews and FGs carried out. These attributes can affect, in a greater or a lesser extent, the choice of the railway mode when making a trip. These will be the attributes that will subsequently be ordered according to their importance by the users through the SP survey. Thirty attributes where defined and can be classified into the following groups (see the meaning of the acronyms in Table 3):
Table 3.
Attributes obtained from FGs and in-depth interviews.
- Attributes related with the available information to passengers: IA, UT, IUT, OBI, LAN, and IAD.
- Attributes related with the total travel time of the trip: AT, TFT, TVT, NUM, ST, and LOC.
- Attributes related with the fare system and policy: PR and TICK.
- Attributes related with the comfort, security and additional services: COM, SERV, SEG, SOB, SPO, OBB, OBP, OBL, ACC, RE, and PUR.
- Attributes related with intermodality: CP, BP, CONU, and CONI.
- Attributes related with the environment: ENV.
3.3. Quantitative Analysis Results
Based on the information obtained in the qualitative research phase, in this section, we proceeded to design the SP survey. The later analysis and modelling of the gathered data allows to order the attributes according to their importance.
3.3.1. Survey Design
The final survey carried out by transport users consisted of four sections. In the first one, a general introduction was presented, explaining the main objectives of the study. In section two, the respondents were asked about their sociodemographic characteristics (gender, age, city of residence, possession of driving license, if they suffer from reduced mobility or not, work status, and income level). In the third section, information was asked about railway use: frequency of use, distance to the nearest station, modes used to get to and from the stations, mode of transport most commonly used, and in case of not using the train, the reason not to do so.
The last section of the survey corresponds to the SP scenarios. Given that a complete ranking of the 30 attributes obtained in qualitative research would require a lot of cognitive effort for the respondents, the SP methodology allowed them to compare only 4 attributes each time. In each SP scenario, the respondent decided which one of the four attributes was the most important attribute (Best option) and which one was the least important (Worst option). This kind of choice is commonly known as BW. The efficient experimental design obtained after carrying out the pilot survey with the minimum D-Error can be consulted in Table 4. The design was divided into 6 blocks; that is, each respondent had to answer only one block consisting of 5 BW scenarios, choosing through 4 attributes in each.
Table 4.
Experimental design of the definitive Stated Preference (SP) survey (the codes of the attributes can be consulted in Table 3).
The survey was conducted through an online platform in order to obtain greater heterogeneity in the responses and to have a much wider sample.
Figure 2 shows an example of a BW choice scenario between four attributes.
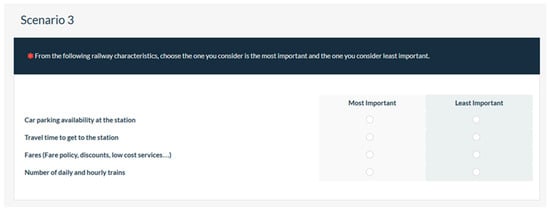
Figure 2.
Example of a Best–Worst experiment.
3.3.2. Sociodemographic Information of Respondents
The final survey was carried out in May 2017, obtaining 316 complete answers from a total of 609 participants, that is, a 52% of complete answers from European countries. The survey was developed on an online platform and disseminated via different social networks, where people all over Europe were invited to participate. No incentive was offered to participate in the survey. Responses from over 24 countries were obtained related to more than 180 cities. The respondents turned out to be mostly men (79%) who reside in medium-sized cities (30%), of young age, with a majority between 25 and 34 years. Almost all respondents had a driver’s license, but not all (70% of those with a license) had their own vehicle. In addition, respondents were mainly employees (55%) with an average salary. Regarding the use of the railway, a great number of the respondents used the railway at least a few times a month and most of them had a station near to their home or place of residence. The complete breakdown of the data is shown in Table 5. Despite the sample not being representative of the European population, the observations were weighted considering sex and age strata in order to assure its validity. In this way, the sample was adapted to represent the population structure of the European Union: 49% males and 51% females; 26% of the population of less than 25 years, 42% between 25 and 54 years, 13% between 55 and 64 years, and 19% older than 65 years [39].
Table 5.
Sociodemographic characteristics of respondents.
3.3.3. Modelling
With the BW data collected, an MNL model has been specified, which allows the establishment of the order of importance of the attributes based on the coefficient estimated. The higher the coefficient of an attribute, the greater the importance that respondents have given to it. For the model to be estimable, it is necessary to establish an attribute as a base, to which the coefficient value of 0 is given. In this case, the attribute OBP (Possibility of carrying pets on board) was chosen given that it was considered the least important. Hence, the coefficients of all the remaining attributes will have positive values. Table 6 shows the parameters estimated.
Table 6.
Multinomial Logit (MNL) model derived from the Best–Worst exercise.
The difference between the values of the parameters is associated with how much an attribute is more important compared to another. To make it easier to understand, the coefficients have been normalized with values between 0 and 100, giving the value 100 to the highest coefficient (TVT) and 0 to the lowest (OBP). Figure 3 shows the result of that normalization, ordering the attributes from the most important to the least important.
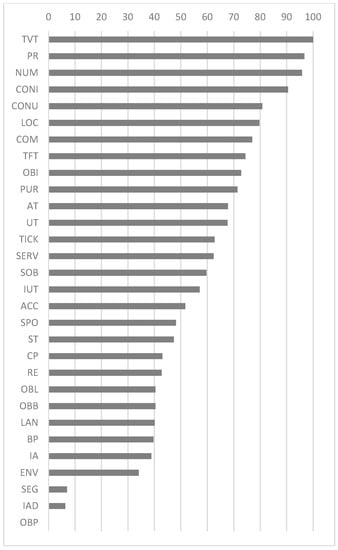
Figure 3.
Importance of the attributes according to their normalized coefficient.
The most important attribute turned out to be the travel time (TVT), followed closely by the price (PR) and frequency of services (NUM). In a second level are the attributes associated with accessibility to railway service, considering both interurban and urban connections of the stations (CONI and CONU, respectively) and the good location of these (LOC), often near city centres.
The least important attributes turned out to be those attributes that are very specific and purely additional services, such as the segregation of the service in different classes (SEG), the information about activities at the destination (IAD), and the possibility of taking pets on board (OBP). Furthermore, it can be seen that there is a considerable difference between these three less important attributes and the group of immediately important attributes, where the respondents grant a level of relevance more or less similar to a set of 7 attributes related to additional rail services: Seat reservation (RE), possibility of carrying luggage with no weight limitation (OBL), possibility of carrying bikes on board (OBB), information and services available in multiple languages (LAN), bicycle parking availability at the station (BP), information to access the station (IA), and the environmental policy of the company (ENV).
Another way to analyse the results is to perform the Best minus Worst operation. That is, subtract the number of times an attribute has been chosen as the least important option to the number of times it has been chosen as the most important one. In Figure 4, it can be seen that there is a clear correlation between the Best minus Worst operation and the parameters obtained by the MNL Model with an R2 = 0.94. This method was used to analyse the attributes in a grouped form, according to the classification defined in Table 3.
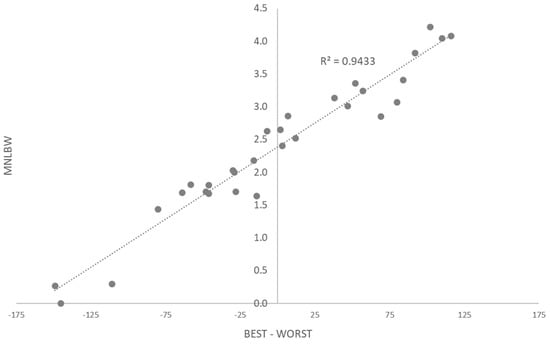
Figure 4.
Correlation between the parameters obtained in the MNL model and the Best–Worst operation.
Figure 5 shows the level of importance given to each one of the six groups. The groups are defined by three data: (i) the maximum Best minus Worst value (best rated attribute within the group), (ii) the minimum Best minus Worst values (worst rated attribute), and (iii) the average value of Best minus Worst of all the attributes within each group. A group that has a high Best minus Worst average shows that the attributes that are part of that group are very important for users. In contrast, the maximum and minimum values give a view of the dispersion on the importance of the attributes within each group.
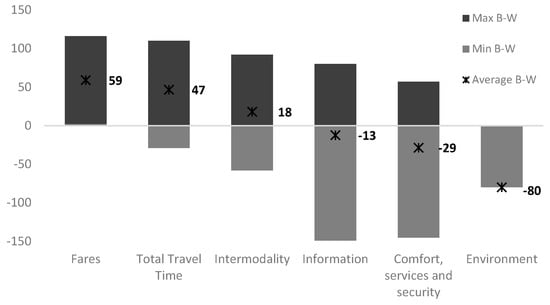
Figure 5.
Average Best–Worst values and maximum and minimum given by the respondents by type of attribute.
The fare and the fare policy in general turned out to be the most important group of attributes. However, although the price of the trip is the most important attribute, a competitive price must be accompanied by a good ticket purchasing system with the possibility of using different types of tickets such as physical, electronic, and preferably combined with other modes of transport.
The attributes belonging to total travel time also showed to be very important for users. In addition, even though the level of importance changes, all the times associated with a trip are important for the user. Therefore, any effort to avoid wasted time along the full journey will have a very positive effect on the perception of the transport users. The only time attribute that was not important for the respondents was the duration of the security controls, probably because the time used for these purposes increases the security sensation of the users that see the controls as necessary.
Intermodality was considered important when combining with other public transport systems, while car parking at stations are not really important for users. Having parking space for bicycles is less important than being able to take the bicycle on the train, so it can be said that the people who make a trip combining the bicycle and railway prefer to travel taking the bike with them inside the train, instead of, for example, taking a public bicycle for the first and last miles.
In the case of information, the respondents consider information regarding the connections of the stations with other public transport systems and information on-board important, while the possibility of having information in several languages and information about the activities available at the destination received very low scores.
The comfort and auxiliary services are generally considered quite insignificant. The only attributes associated with this group that are considered important are on-board comfort and on-board safety against accidents. The rest, although different in level, are initially not significantly important for users.
Finally, the environmental policy is not considered too important for the overall population, although certain segments of the population can show greater interest in this aspect.
Therefore, it can be said that the desired service for transport users consists of a railway system with competitive prices and travel times. In addition, the railway must be comfortable and well-connected with other transport modes, especially with public ones, and users must have all this information easily accessible and clearly explained in all possible points and sources (stations, on-board, mobile, etc.). Once those needs are met, investing efforts can focus on other types of additional services that complement the passenger’s trip.
The socioeconomic variables obtained in the survey have allowed an analysis considering different types of user to be carried out. The most interesting results are those related with railway usage levels since they allow the differentiation of the importance given to the attributes by railway users and nonusers. For modelling, the different usage levels have been coded using the effect coding technique. Unlike dummy coding, in this type of coding, the reference group is identified by a −1 value. Therefore, the constant term obtained in the model represents the grand mean of the importance of each attribute for the sample as a whole. Thus, the coefficients associated with each level show the deviation of that group from the mean. The advantage of this type of coding is that it is possible to calculate the coefficient associated with the reference group. The value of this coefficient is calculated as the sum of the negative values of the coefficients of the rest of the groups. The effect coded variables have been introduced in the model as interactions with each attribute. Occasional/nonuser group have been defined as the base group. Table 7 shows the estimated model, where those interactions that have turned out not to be statistically significant have been omitted.
Table 7.
MNL model with interactions by railway usage level.
The model coefficients show the differences of each group for every particular attribute. In order to facilitate the visualization, the following graphs (Figure 6, Figure 7 and Figure 8) show the comparisons of each group with respect to the model estimated with the complete sample (Table 6). The graphs are sorted from highest to lowest frequency of railway use.
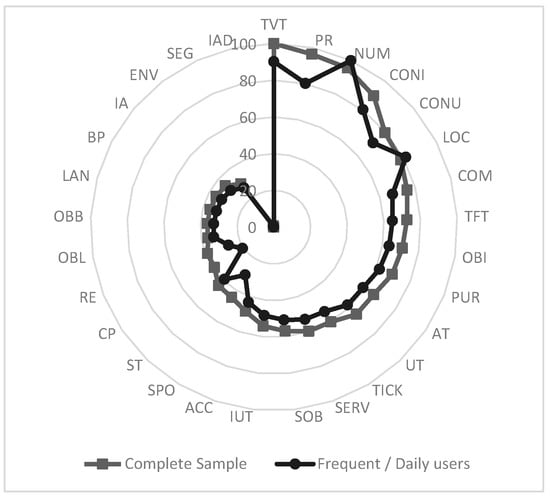
Figure 6.
Comparison of the difference in importance given to the attributes by the complete sample and frequent users.
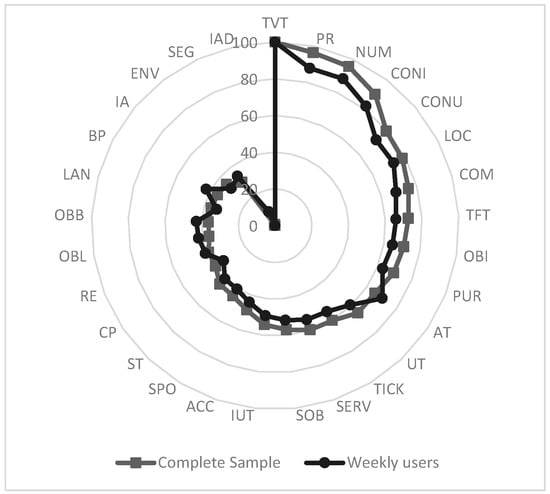
Figure 7.
Comparison of the difference in importance given to the attributes by the complete sample and weekly users.
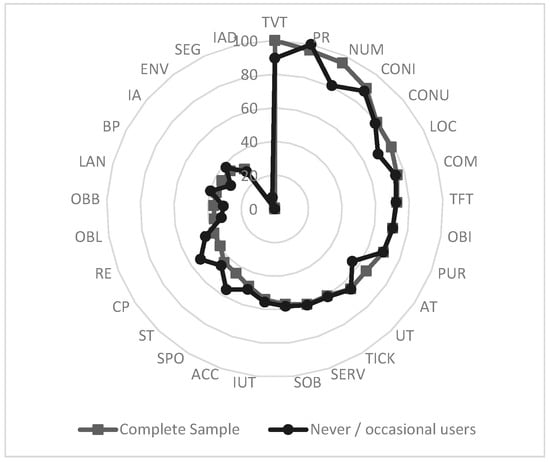
Figure 8.
Comparison of the difference in importance given to the attributes by the complete sample and occasional users/nonusers.
The main difference between frequent users and the rest (Figure 6) is the clear reduction in the importance of ticket prices (attribute PR). In the same way, the travel time slightly reduces its importance, while the service frequency becomes the most important variable. In terms of accessibility and connections with other means of transport, whether urban or interurban, the importance is slightly more reduce, while the location of stations becomes more important. At the bottom of the list, there is a clear reduction in the importance associated with police security, the availability of car parking at stations, and the reservation of seats. Through these variations, we can deduce that regular rail users are those that use the railway for daily commuting. Therefore, the importance of the attributes focuses mainly on having a good frequency of services and that the stations are accessible to their origins and/or destinations.
Users who use the rail weekly (Figure 7) show a clear preference for total journey time, i.e., travel time by train and access time to it. In relation to additional services, a greater importance is observed for services related to intermodality with cycling and the possibility of carrying large volume luggage on board. We can include in this group those people who make their daily trips usually by bicycle but who combine it with the railway for different reasons such as a longer travel distance. On the other hand, this group can also include those people who make medium long-distance journeys and who choose the railway if it is competitive with the other modes in terms of travel and access time.
Finally, for those people who never or hardly ever use the railway (Figure 8), the price takes the greatest importance. In addition, the frequency, the location of the stations, and the access time considerably reduce their importance. In contrast, urban and interurban connections with other means of transport and the availability of car parking at the stations (CP) increase their importance. Additional services focused on unusual users are also considered more important, such as the availability of information in different languages, information to access stations, or information of activities at the destination. Within this group, we can include passengers who use the railway if it is economically better than the rest of the alternatives. In addition, these users appreciate the additional services that provide access to the necessary information of the service.
4. Conclusions
In this study, a methodology based on both qualitative and quantitative techniques has been applied in order to obtain which attributes are most relevant for transport users when choosing the railway mode. This information can be useful to increase the demand of this transport mode in the future compared to other less sustainable alternatives.
By using FGs and in-depth interviews, it has been possible to see how the perception of rail transport is quite different depending on the type of service. Users and experts generally perceive that high-speed services at main stations are reliable and have sufficient frequencies, auxiliary services, and information. However, in local services or in non-main stations, frequency and auxiliary services are perceived as deficient. The remarkable automation of the service, which could increase in the coming years, generates a certain level of distrust in some users when perceiving the customer care as too impersonal. This could become a barrier in increasing demand in the future. The current fare system is perceived as too rigid and not very sensitive to the differences between the types of users and trips, without the possibility to make transfers with other companies or trips in an easy and connected way. An improvement in fare flexibility and giving the possibility of buying tickets to cover a complete trip (door-to-door and mobility as a service paradigm) and in combination with low-cost services could therefore attract more users.
When ordering attributes after the application of the Best–Worst scaling, it can be concluded that the total travel time is a key aspect for choosing rail transport. In second place are the price or fare policy and the frequency of the services, which show a similar importance and clearly, due to their great relevance, must accompany a good travel time. The accessibility to the railway service shows a great significance, focusing especially on the intermodality that the stations have with other public urban and interurban services, besides having a good location within the cities. Auxiliary services during the trip show very varied levels of importance, with, for example, the information on board or the comfort of the seats being important aspects, while the information regarding the destination, the possibility of acquiring tickets in different categories, or the possibility of travelling with pets on board show much lower levels of importance. The results obtained show that to improve the quality of rail transport, it is necessary to invest mainly in the infrastructure/services and to act on pricing, leaving aside all those auxiliary services that are very appreciated by some users but do not fulfil the need of the general users.
The analysis according to frequency of railway use show some differences in the importance given to the attributes. Frequent users, i.e., those who use it for daily commuting, do not consider price as such an important variable, while frequency of services and location of stations gains much more importance. Users who use it sporadically consider travel time as a key variable, this one being the most important attribute with a considerable difference from the rest. In the same way, access time to stations also shows a greater importance than for the rest of users. As for less frequent users and nonusers, price becomes the most important variable as well as urban and intercity connections with the stations and the availability of car parking in them. In addition, nonusers considered additional services (access information, information on activities at the destination, and information in different languages) to be more important than average.
To apply policies focused on less frequent and nonusers could be the easiest way to increase railway usage in Europe. In addition, these policies will highly unlikely discourage current passengers to continue using railways. In this way, the most cost-effective way to attract new users would be to improve intermodality, both with public and private modes, and information about the railway services. This result supports the conclusions obtained by Givoni and Rietveld [10] and Brons, Givoni, and Rietveld [11], who argued that better access to the stations, intermodality, and information could attract new users.
To sum up, the combination of qualitative and quantitative methods has made it possible to emphasize the importance of focusing on aspects such as travel time, the flexibilization of the fare system, and the improvement of intermodality, especially to attract new users. Although the experience carried out in this study has focused on establishing the importance of attributes for the railway field, the methodology used can be applied to other public and private transport systems.
Author Contributions
Conceptualization, R.S., E.E., and R.C.; methodology, E.E. and R.C.; validation, R.S., B.A., and R.C.; formal analysis, E.E.; investigation, R.S., E.E., and R.C.; resources, B.A.; data curation, R.S. and E.E.; writing—original draft preparation, E.E. and R.C.; writing—review and editing, R.S. and B.A.; visualization, E.E. and R.C.; supervision, B.A.; project administration, R.S.; funding acquisition, R.S. and B.A.
Funding
This research was supported by the Shift2Rail initiative through the financing of the NEAR2050 project (Project Reference: 730838, Call Reference S2R-OC-CCA-01-2015); the Spanish Ministry of Economy and Industry through the Project TRA2015-69903-R (co-funded by ERDF funds); and the Spanish Ministry of Education, Culture, and Sports through the training grant FPU15/02990.
Acknowledgments
The authors would like to show their gratitude to Angel Ibeas of the University of Cantabria for his support during this research.
Conflicts of Interest
The authors declare no conflict of interest.
References
- European Commission. Roadmap to a Single European Transport Area: Towards a Competitive and Resource Efficient Transport System: White Paper; Publications Office of the European Union: Luxembourg, 2011. [Google Scholar]
- Dell’olio, L.; Ibeas, A.; de Oña, J.; de Oña, R. Public Transportation Quality of Service: Factors, Models, and Applications; Elsevier: Cambridge, MA, USA, 2017; p. 242. [Google Scholar]
- Kleinová, E. Does liberalization of the railway industry lead to higher technical effectiveness? J. Rail Transp. Plan. Manag. 2016, 6, 67–76. [Google Scholar] [CrossRef]
- Bošković, B.; Bugarinović, M. Why and how to manage the process of liberalization of a regional railway market: South-Eastern European case study. Transp. Policy 2015, 41, 50–59. [Google Scholar] [CrossRef]
- Albalate, D.; Bel, G.; Fageda, X. Competition and cooperation between high-speed rail and air transportation services in Europe. J. Transp. Geogr. 2015, 42, 166–174. [Google Scholar] [CrossRef]
- D’Alfonso, T.; Jiang, C.; Bracaglia, V. Would competition between air transport and high-speed rail benefit environment and social welfare? Transp. Res. B-Methodol. 2015, 74, 118–137. [Google Scholar] [CrossRef]
- Sun, X.; Zhang, Y.; Wandelt, S. Air Transport versus High-Speed Rail: An Overview and Research Agenda. J. Adv. Transp. 2017, 2017, 1–18. [Google Scholar] [CrossRef]
- Ritchie, J.R.B.; Johnston, E.E.; Jones, V.J. Competition, Fares and Fences—Perspective of the Air Traveler. J. Travel Res. 1980, 18, 17–25. [Google Scholar] [CrossRef]
- Andreassen, T.W. (Dis)satisfaction with public services: the case of public transportation. J. Serv. Mark. 1995, 9, 30–41. [Google Scholar] [CrossRef]
- Givoni, M.; Rietveld, P. The access journey to the railway station and its role in passengers’ satisfaction with rail travel. Transp. Policy 2007, 14, 357–365. [Google Scholar] [CrossRef]
- Brons, M.; Givoni, M.; Rietveld, P. Access to railway stations and its potential in increasing rail use. Transp. Res. A Policy Pract. 2009, 43, 136–149. [Google Scholar] [CrossRef]
- Nandan, S. Determinants of customer satisfaction on service quality: A study of railway platforms in India. J. Public Transp. 2010, 13, 97–113. [Google Scholar]
- Nathanail, E. Measuring the quality of service for passengers on the hellenic railways. Transp. Res. A Policy Pract. 2008, 42, 48–66. [Google Scholar] [CrossRef]
- Eboli, L.; Mazzulla, G. Relationships between rail passengers’ satisfaction and service quality: A framework for identifying key service factors. Public Transp. 2015, 7, 185–201. [Google Scholar] [CrossRef]
- Aydin, N.; Celik, E.; Gumus, A.T. A hierarchical customer satisfaction framework for evaluating rail transit systems of Istanbul. Transp. Res. A Policy Pract. 2015, 77, 61–81. [Google Scholar] [CrossRef]
- Hensher, D.A. Revealing differences in willingness to pay due to the dimensionality of stated choice designs: An initial assessment. Environ. Resour. Econ. 2006, 34, 7–44. [Google Scholar] [CrossRef]
- Román, C.; Espino, R.; Martín, J.C. Competition of high-speed train with air transport: The case of Madrid–Barcelona. J. Air Transp. Manag. 2007, 13, 277–284. [Google Scholar] [CrossRef]
- Ahern, A.A.; Tapley, N. The use of stated preference techniques to model modal choices on interurban trips in Ireland. Transp. Res. A Policy Pract. 2008, 42, 15–27. [Google Scholar] [CrossRef]
- Park, Y.; Ha, H.-K. Analysis of the impact of high-speed railroad service on air transport demand. Transp. Res. E Log. Transp. Rev. 2006, 42, 95–104. [Google Scholar] [CrossRef]
- Román, C.; Espino, R.; Martín, J.C. Analyzing Competition between the High Speed Train and Alternative Modes. The Case of the Madrid-Zaragoza-Barcelona Corridor. J. Choice Model. 2010, 3, 84–108. [Google Scholar] [CrossRef]
- Liu, C.; Erdogan, S.; Ma, T.; Ducca, F.W. How to Increase Rail Ridership in Maryland: Direct Ridership Models for Policy Guidance. J. Urban Plan. Dev. 2016, 142, 04016017. [Google Scholar] [CrossRef]
- Cao, J.; Cao, X. Comparing importance-performance analysis and three-factor theory in assessing rider satisfaction with transit. J. Transp. Land Use 2017, 10, 837–854. [Google Scholar] [CrossRef]
- Dell’olio, L.; Ibeas, A.; Barreda, R.; Sañudo, R. Passenger behavior in trains during emergency situations. J. Saf. Res. 2013, 46, 157–166. [Google Scholar] [CrossRef]
- Louviere, J.; Lings, I.; Islam, T.; Gudergan, S.; Flynn, T. An introduction to the application of (case 1) best–worst scaling in marketing research. Int. J. Res. Mark. 2013, 30, 292–303. [Google Scholar] [CrossRef]
- Beck, M.J.; Rose, J.M. The best of times and the worst of times: A new best–worst measure of attitudes toward public transport experiences. Transp. Res. A Policy Pract. 2016, 86, 108–123. [Google Scholar] [CrossRef]
- Ward, H.; Atkins, J. From Their Lives: A Manual on How to Conduct Focus Groups of Low-Income Parents; Institute for Child and Family Policy, University of Southern Maine: Portland, ME, USA, 2002; p. 91. [Google Scholar]
- Bruseberg, A.; McDonagh-Philp, D. Focus groups to support the industrial/product designer: A review based on current literature and designers’ feedback. Appl. Ergon. 2002, 33, 27–38. [Google Scholar] [CrossRef]
- Krueger, R.; Casey, M.A. Focus Groups: A Practical Guide for Applied Research; SAGE Publications, Inc: Singapore, 2000; p. 240. [Google Scholar]
- Ibeas, A.; dell’Olio, L.; Montequín, R.B. Citizen involvement in promoting sustainable mobility. J. Transp. Geogr. 2011, 19, 475–487. [Google Scholar] [CrossRef]
- Rea, L.M.; Parker, R.A. Designing and Conducting Survey Research: A Comprehensive Guide; John Wiley & Sons: San Francisco, CA, USA, 2014; p. 360. [Google Scholar]
- Hill, T.; Westbrook, R. SWOT analysis: It’s time for a product recall. Long Range Plan. 1997, 30, 46–52. [Google Scholar] [CrossRef]
- Rose, J.M.; Bliemer, M.C. Stated choice experimental design theory: The who, the what and the why. In Handbook of Choice Modelling; Hess, S., Daly, A., Eds.; Edward Elgar Publishing: Cheltenham, UK, 2014; pp. 152–177. [Google Scholar]
- Sanko, N. Guidelines for Stated Preference Experiment Design. Master’s Thesis, Ecole Nationale des Ponts et Chaussées, Paris, France, 2001. [Google Scholar]
- Huber, J.; Zwerina, K. The importance of utility balance in efficient choice designs. J. Mark. Res. 1996, 33, 307–317. [Google Scholar] [CrossRef]
- Rose, J.M.; Bliemer, M.C. Constructing efficient stated choice experimental designs. Transp. Rev. 2009, 29, 587–617. [Google Scholar] [CrossRef]
- Rose, J.; Collins, A.; Bliemer, M.; Hensher, D. Ngene 1.0 Stated Choice Experiment Design Software; University of Sydney: Sydney, Australia, 2009. [Google Scholar]
- Louviere, J.J.; Flynn, T.N.; Marley, A.A. Best-Worst Scaling: Theory, Methods and Applications; Cambridge University Press: Cambridge, UK, 2015; p. 364. [Google Scholar]
- Domencich, T.A.; McFadden, D. Urban Travel Demand: A Behavioral Analysis; North-Holland Pub. Co.: Amsterdam, The Netherlands; American Elsevier: New York, NY, USA, 1975; p. 215. [Google Scholar]
- Central Intelligence Agency. The World Factbook 2017; Central Intelligence Agency: Washington, DC, USA, 2017.
© 2019 by the authors. Licensee MDPI, Basel, Switzerland. This article is an open access article distributed under the terms and conditions of the Creative Commons Attribution (CC BY) license (http://creativecommons.org/licenses/by/4.0/).