Article

Traffic Crash Evolution Characteristic Analysis and Spatiotemporal Hotspot Identification of Urban Road Intersections

1
Jiangsu Key Laboratory of Urban ITS, Southeast University, Nanjing 211189, China
2
Jiangsu Province Collaborative Innovation Center of Modern Urban Traffic Technologies, Southeast University, Nanjing 211189, China
3
School of Transportation, Southeast University, Nanjing 211189, China
4
Traffic Police Brigade of Wujiang Public Security Bureau, Suzhou 215200, China
*
Author to whom correspondence should be addressed.
Sustainability 2019, 11(1), 160; https://doi.org/10.3390/su11010160
Submission received: 6 December 2018 / Revised: 10 December 2018 / Accepted: 25 December 2018 / Published: 29 December 2018
(This article belongs to the Section Sustainable Transportation)

Abstract

:
Road traffic safety is a key concern of transport management as it has severely restricted Chinese economic and social development. With the objective to prevent and reduce road traffic crashes, this study proposes a comprehensive spatiotemporal analysis method that integrates the time-space cube analysis, spatial autocorrelation analysis, and emerging hot spot analysis for exploring the traffic crash evolution characteristics and identifying crash hot spots. These analyses are all conducted by the corresponding toolbox of ArcGIS 10.5. Then, a small sized-city of China (i.e., Wujiang) is selected as the case study, and the historical traffic crash data occurring at the road intersections of Wujiang for the year 2016 are analyzed by the proposed method. The analysis process identifies the high incidence locations of traffic crashes, then presents the spatial change trend and statistical significance of the crash locations. Finally, different types of crash hotspots, as well as their evolution patterns over time, are determined. The results illustrate that the traffic crash hotspots of road intersections are primarily distributed in the Northeast area of Wujiang’s major urban area, while the crash cold spots are concentrated in the Southwest of Wujiang, which points out the direction for crash prevention. In addition, the finding has a potential engineering application value, and it is of great significance to the sustainable development of Wujiang.

1. Introduction

Traffic crashes usually increase as the economy grows, because fast economy growth in developing countries fosters the purchasing power of motor vehicles, resulting in the increasing of crash likelihood between motor vehicles. With the rapid development of Chinese economy, the number of motor vehicles has also continued to grow, and up to now, the motor vehicle holdings in China is the first in the world (i.e., it is about 325 million vehicles) [1]. Economic and motor vehicle holdings growth have increased the road safety issue in China. Specifically, road traffic crashes have become more frequent, resulting in a high number of casualties and property damage. The deaths caused by traffic crash in China accounted for about one fifth of the global traffic deaths according to the World Health Organization [2], and motor vehicle crashes resulted in 3.6 out of 18.8 deaths per 100,000 people in China in 2013 [2], then this trend was increasingly growing in the subsequent years.
Generally, most of the traffic crashes can be avoided by human interventions. Thus, exploring the effective intervention countermeasures of traffic crashes is essential to the sustainable development of transportation and society. Recently, preventing and resolving major traffic crashes have been included in the work report of Chinese government. As the key of traffic safety management, identifying the traffic crash hotspots and understanding the crash evolution characteristic are important for the resource allocation and policy-making, which is beneficial for preventing traffic crashes and mitigating crash losses.
Recent years have witnessed a repaid concentration and transference of urban traffic crashes from metropolis to small-sized cities. A small-sized city of China (i.e., Wujiang) is selected as a case study, as the traffic crashes, especially those that occurred at the urban road intersections, are serious in Wujiang. Wujiang’s economic, as well as the motor vehicle holdings, are all increasingly growing. According to official statistics, the per capita GDP of Wujiang reached 73,106 RMB (11,623 USD), and the level of economic development was top ten among the similar-level cities of China in 2017. Then the motor vehicle number was more than 338,800 in 2016 [3]. Under this situation, Wujiang’s traffic safety issue has also become more prominent, and traffic crashes, especially those that occurred at the urban road intersections continue to happen and caused a lot of losses. Based on the statistics, from January to October 2016, the road traffic crashes in Wujiang have caused a total of 158 deaths, 602 injuries, and direct property losses of 2.1638 million RMB (about 0.346 million USD). Analysis of traffic crash contributors show that the unreasonable road intersection design, driver’s improper operation and lack of observation when driving are the main reasons for the crashes of Wujiang’s road intersections [3]. Furthermore, the increasing traffic violations among pedestrians, motor vehicle drivers, and non-motor vehicle drivers worsens the traffic safety condition of Wujiang. The above unharmonious phenomenon seriously obstructs Wu Jiang’s sustainable development, and in this case, the local government has taken some measures such as road intersection improvement, traffic law enforcement, and road traffic safety publicity to ease the traffic crash. However, these measures are less useful to some road intersections with few crashes, which results in a waste of resources. Therefore, based on this analysis, this study is approved by Traffic Police Brigade of Wujiang Public Security Bureau, and aims to explore the traffic crash evolution characteristic and to identify the crash hotspots, which can make a better allocation of limited resources and is recognized as a basis in taking effective strategies for the reduction of high-density areas of crashes.

2. Literature Review

Road traffic crash hotspot analysis requires a comprehensive understanding of the crash forming process. In turn, an effective analysis about the traffic crash evolution process helps to identify the hot spots. Accordingly, the traffic crash evolution characteristic analysis and the hot spots identification are complementary in the study of road traffic crashes. The literature review of the current study revolves around two major aspects: Two-dimensional spatial analysis and three-dimensional spatiotemporal analysis.

2.1. Two-Dimensional Spatial Analysis

Scheiner and Holz-Rau [4] explored the connection between the spatial distribution of road crashes and the place of residence in Germany. The results indicated that the risk of being killed or seriously injured in a road accident was significantly lower for the residences of high-density cores than for the suburban and rural inhabitants. The spatial pattern of traffic crashes in Baltimore declared that the traffic crash density in the central area and neighboring districts was high, and they were primarily distributed along the major arterial roads and intersections [5]. Some scholars have also analyzed non-motorized crash data (i.e., bicycle and pedestrian crashes) in the entire state of Florida. Then, the effect of spatial autocorrelation was found to be statistically significant in macro-level bicycle crash frequency models [6].
When considering the traffic crash contributors’ analysis, Saha [7] investigated the relationship between bicycle crash frequency and their contributing factors using conditional autoregressive models. Useche et al. [8] studied the infrastructural and human factors that affect cyclist safety by logistic regression models, and the results showed that self-reported road crashes of cyclists could be predicted through variables such as age, riding intensity, risky behaviors, and infrastructure interactions. Shi et al. [9] assessed the influence factors of Chinese rural road safety during the traffic crash evolution process. By identifying dangerous sections and key impact factors from fuzzy and cask theory and weighted analysis, the factors such as missing traffic signs, unreasonable alignment, and poor roadside conditions were determined. Cioca and Ivascu [10] assessed a number of traffic and road accidents depending on a series of variables (i.e., collision mode, road configuration, conditions of occurrence, etc.) in Romania from 2012–2016. Then, the analysis of road accident trend identified the combination of vehicles and personal factors influences the number of traffic and road accidents.
Geographic information tools based on GIS is also a commonly used method to analyze the traffic crash characteristic. The most straightforward use of GIS for crash analysis is the examination of spatial characteristics of crash locations [11]. Several studies have analyzed the traffic crash characteristics from spatial perspectives, and primarily by analyzing the road network density through kernel density estimation in 2D space [12,13,14,15]. In addition, numerous studies have also used spatial autocorrelation functions based on GIS to identify the traffic crash hotspot [16,17,18,19,20].

2.2. Three-Dimensional Spatiotemporal Analysis

The above studies related to the two-dimensional spatial analysis about the traffic crash characteristic was performed without considering the time dimension. In recent years, the three-dimensional spatiotemporal analysis methods based on GIS have increasingly been used to study the characteristics of traffic crashes. These methods solved the restriction of time dimension as it can describe both the spatial and temporal patterns.
Fox et al. [21] proposed a spatiotemporal analysis towards the pedestrian fatality crashes using Bayesian maximum entropy methods. The results determined the pedestrian mortality hotspots and then provided the intervention strategies for the high pedestrian mortality rate areas. Youngok et al. [22] analyzed the spatiotemporal characteristic of elderly population’s traffic crashes using space-time and kernel density estimation, in which the elderly people were divided into elderly drivers and victims. The findings showed that the traffic crash hotspots of elderly drivers were some specific areas North of the Han River from morning to afternoon. In contrast, the hotspots for elderly victims were distributed over a wide area from daytime to evening. Soltaniand and Askari [23] have studied the potential temporal and spatial patterns of road crashes aggregated at traffic analysis zonal (TAZ) level in urban environments. Localization pattern and hotspot distribution were examined to find out the impact of spatial and temporal dimensions on the emergence of such patterns. Li et al. [24] conducted a GIS-based Bayesian analysis to discover the spatiotemporal pattern of motor vehicle crashes occurred in Harris County, Texas, and they found stability in high-risk segments using the data of four years. Fan [25] explored the traffic collision characteristics of Jianghan District of Wuhan, and detected how the collision hotspots evolve over time from a spatiotemporal perspective. The relationship between features of imported second-hand cars and likelihood of traffic crashes was evaluated by Reference [26], in which the spatiotemporal visualization of data was performed using Geographic Information System (GIS), while the statistical analysis was conducted by regression models. The analysis suggested that a significant traffic crashes numbers can be explained by the volume of imported second-hand cars at the county level.

2.3. Objective of the Study

The aforementioned studies have provided a detailed introduction about the research of traffic crash evolution characteristic and hot spot analysis. Most previous studies were primarily focused on the single spatial analysis (i.e., only analyze the crash location change using the spatial autocorrelation method) and simple spatiotemporal analysis (i.e., analyzed the changes of traffic crash from spatial and temporal perspectives but without considering the internal evolution characteristics of the crashes), and only few literatures (i.e., literature in References [22,23]) have involved in the internal evolution characteristics of the crash hot spots. To fill this gap, this study proposes a comprehensive crash hotspot analysis method that integrated the spatial analysis and spatiotemporal pattern analysis. Firstly, under spatial joint conditions (i.e., the urban road intersections and the corresponding number of traffic crash are matched in the map), the time-space cube model (this model was also used by the literature in Reference [22]) is performed to display the basic crash information such as the crash location ID, crash numbers, and crash occurrence time. Then, an analysis including the “global spatial autocorrelation analysis” and “local spatial autocorrelation analysis” is conducted to analyze the spatial change trends of crash hot spots. Finally, the emerging hot spot analysis is used to classify Wujiang’s crash hot spots, as well as to analyze the spatiotemporal pattern of these hot spots, which is relatively less studied in previous literatures. The research idea that integrates the above three methods is never proposed before, and thus it is the research focus of the current study.

3. Study Area and Data

3.1. Study Area

The study area is Wujiang, which administratively affiliates with Suzhou, China, and it has a population of approximately 824,500, and the motor vehicle number was more than 338,800 in 2016 [3]. The administrative areas of Wujiang include Songling town (i.e., the major urban area), Lili town, Shengze town, Tongli town, Qidu town, Pingwang town, Zhenze town, and Taoyuan town. The current study area may only be involved in the major urban area of Wujiang (i.e., Songling town), because Songling town is the urban center of Wujiang, and the population, economic strength, vehicles and intersections are more than other areas, thereby the intersection crashes of Songling are also more prominent than other areas [27]. Thus, this study aims to analyze the characteristics of traffic crashes at road intersections of Songling, then to find the evolutions of these crashes from spatiotemporal aspects. From the analysis, the crash hot spots can be identified, which will provide a basic support for preventing traffic crashes.

3.2. Data Source

The traffic crash samples were taken from traffic crash database of Wujiang Public Security Bureau, and after processing of the raw data, the valid sample is determined (i.e., N=3934). The traffic crashes were primarily those occurring at the road intersections of Songling town in 2016, and they were recorded by traffic police, and then these records were registered into the traffic crash database. The data contains several labels: Time of crash, crash handling unit (i.e., Songling traffic police detachment), crash type, crash location ID (i.e., the road intersections), longitude and latitude. The study area (i.e., Songling town) covers 117 road intersections, and the boundary is: North to Jiangling Road, South to Yunlong Road, West to S30 (i.e., the provincial highway), and East to S227 (i.e., provincial highway). For the analysis, the traffic crash data provided by the police office was transformed into GIS data by geocoding the longitude and latitude coordinate information of the location where the traffic crashes occurred, then these crash locations can be displayed in the map (see Figure 1).

4. Method and Results

This section mainly introduces the methods used in this paper. First of all, the spatial join analysis between the road intersections (i.e., locations) and the crashes are performed to visualize the crash number at each intersection. Then, the space-time cube analysis is conducted to display the distributions of traffic crashes over time and space. Afterwards, the spatial autocorrelation analysis is proposed to analyze the intrinsic characteristics (include the spatial aggregation characteristic and statistical significance) of the crashes. Finally, the emerging hot spot analysis method is generated to explore the classification of the traffic crash hotspots and to evaluate the spatiotemporal change trends (include the changes over locations and time) of these hotspots.

4.1. Spatial Join Analysis

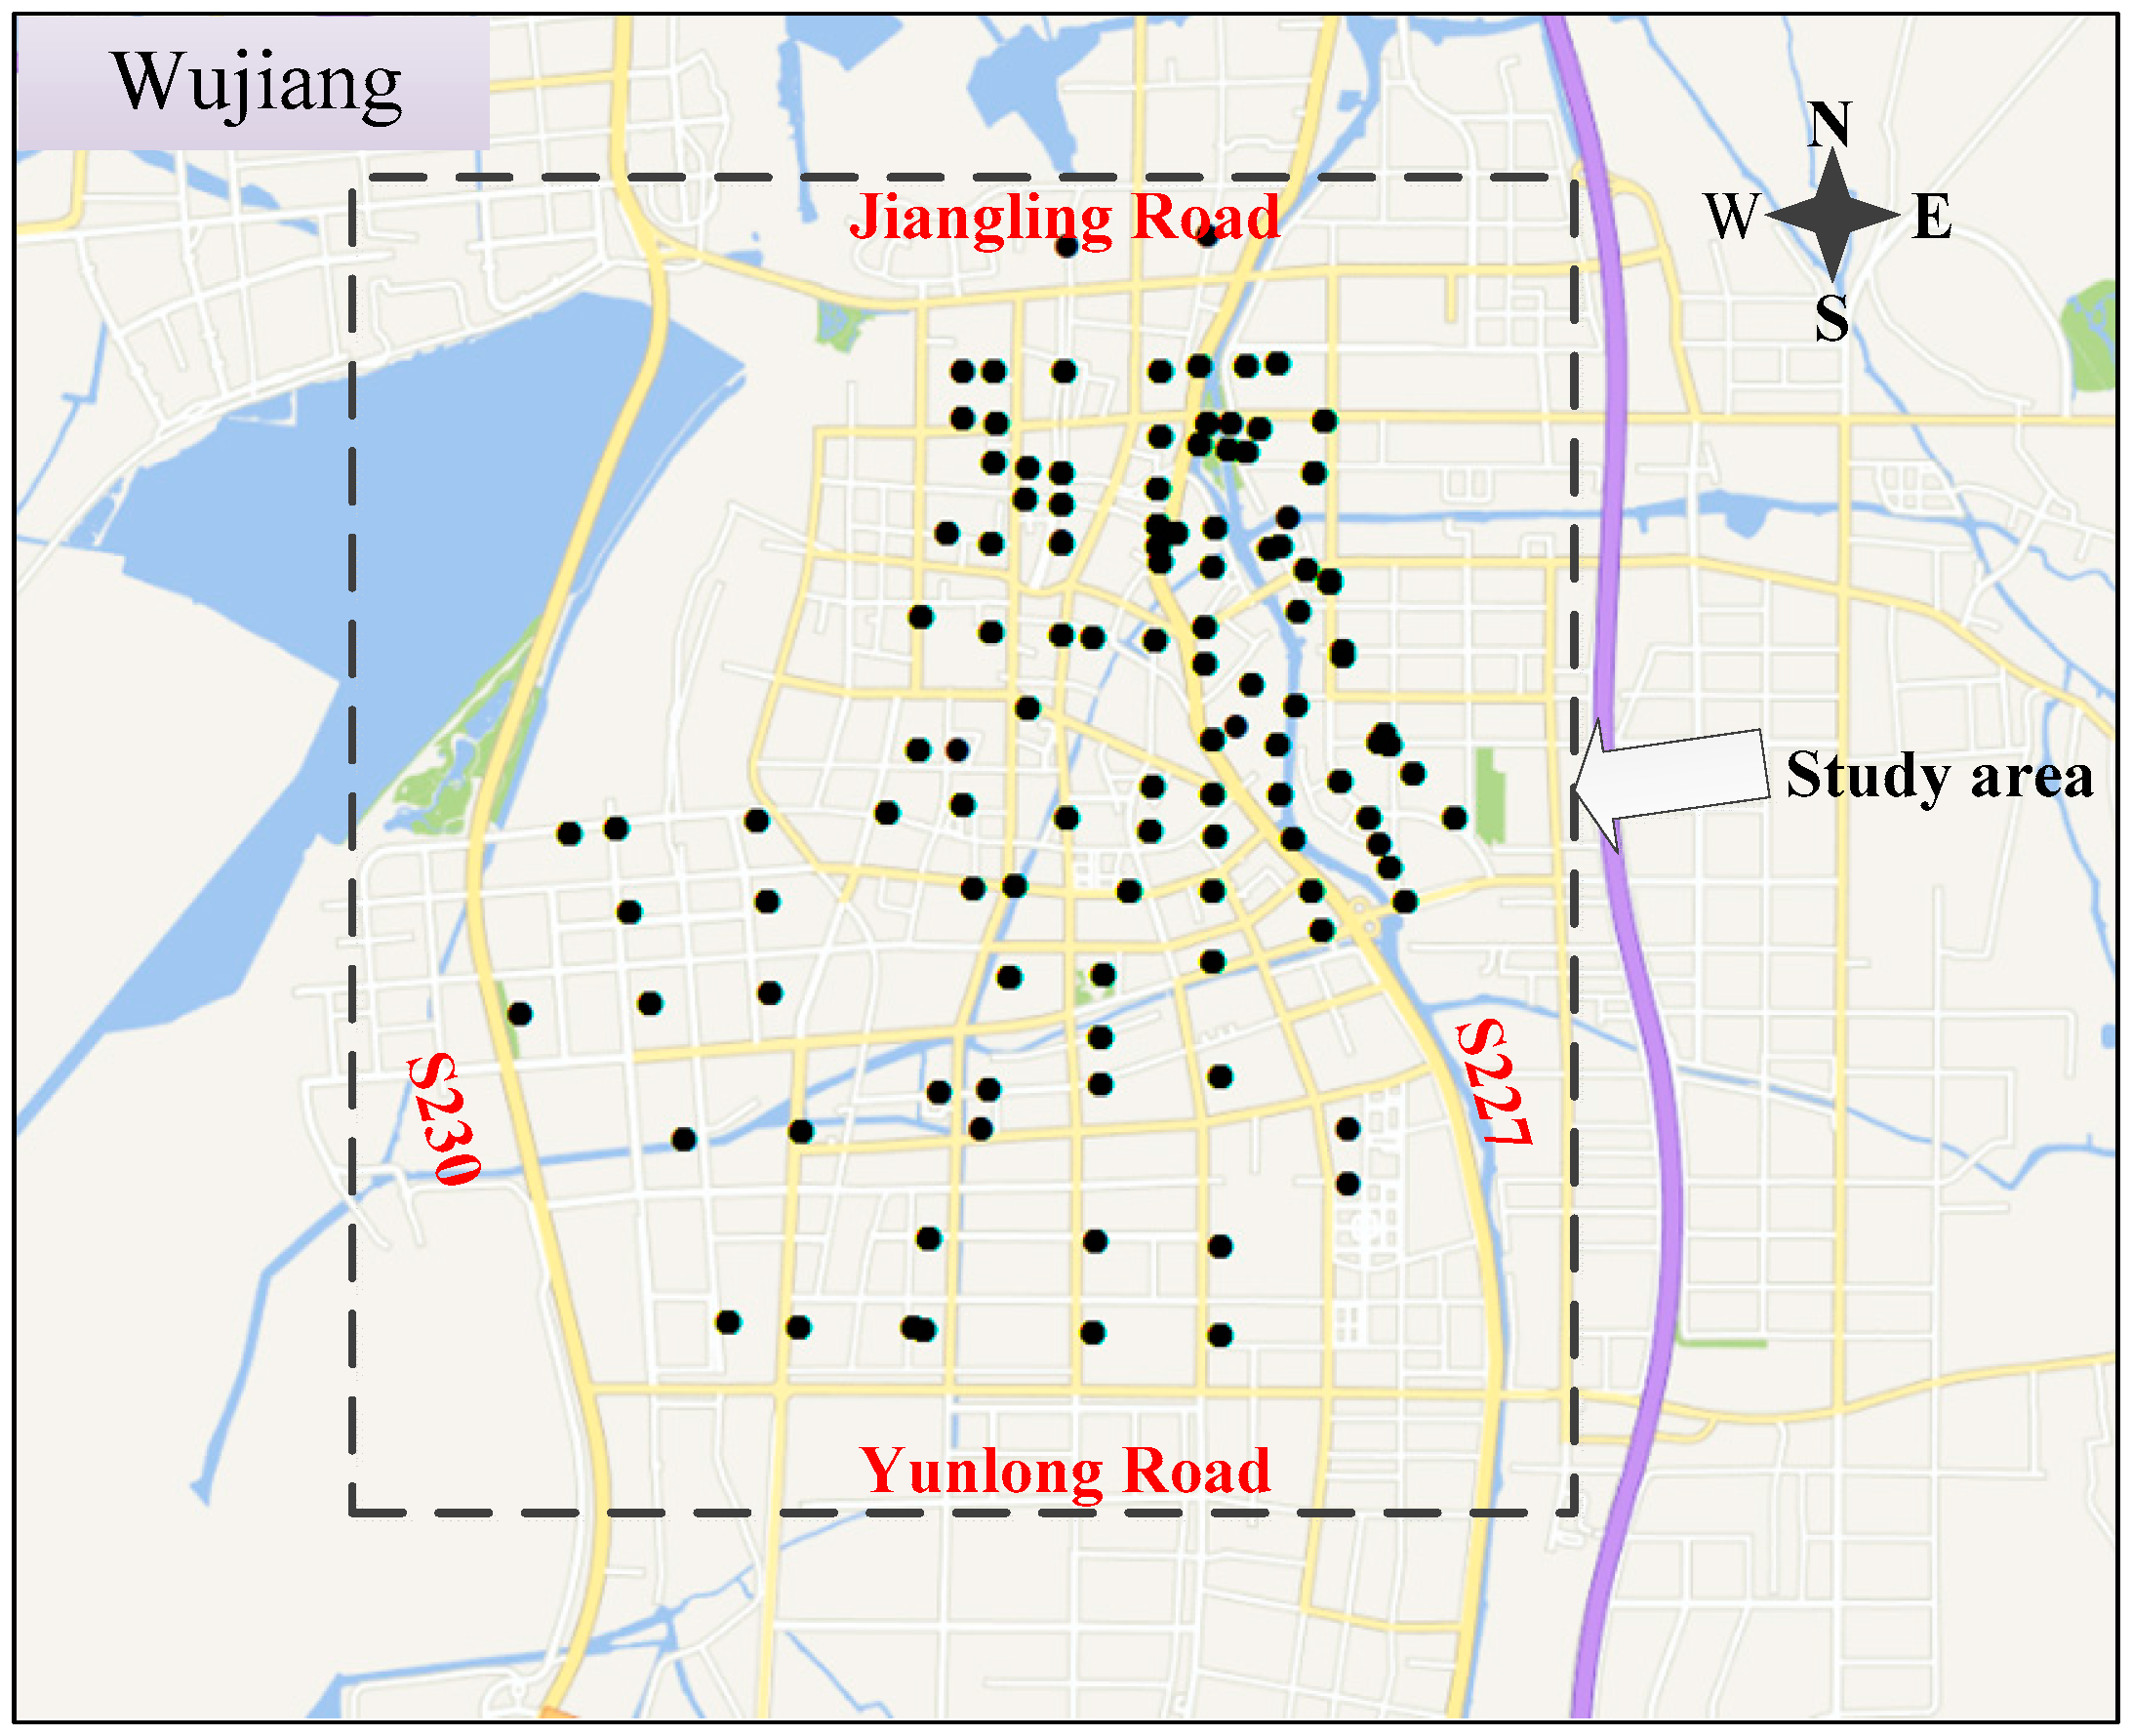
The crash locations have been labeled in Figure 1, from which the crash distributions were dense along both sides of S227 but they are irregular. To explore the spatial distribution characteristic of these crashes, an accurate quantity of these crashes at each road intersection need to be counted. Thereby, a “spatial join” toolbox based on ArcGIS 10.5 is used to join the road intersections and crashes. After the “spatial join”, a new list (i.e., the join count) is added to the data list. Join count represents the accurate crash number at each road intersection, and it is counted and visualized by different colors (see Figure 2).
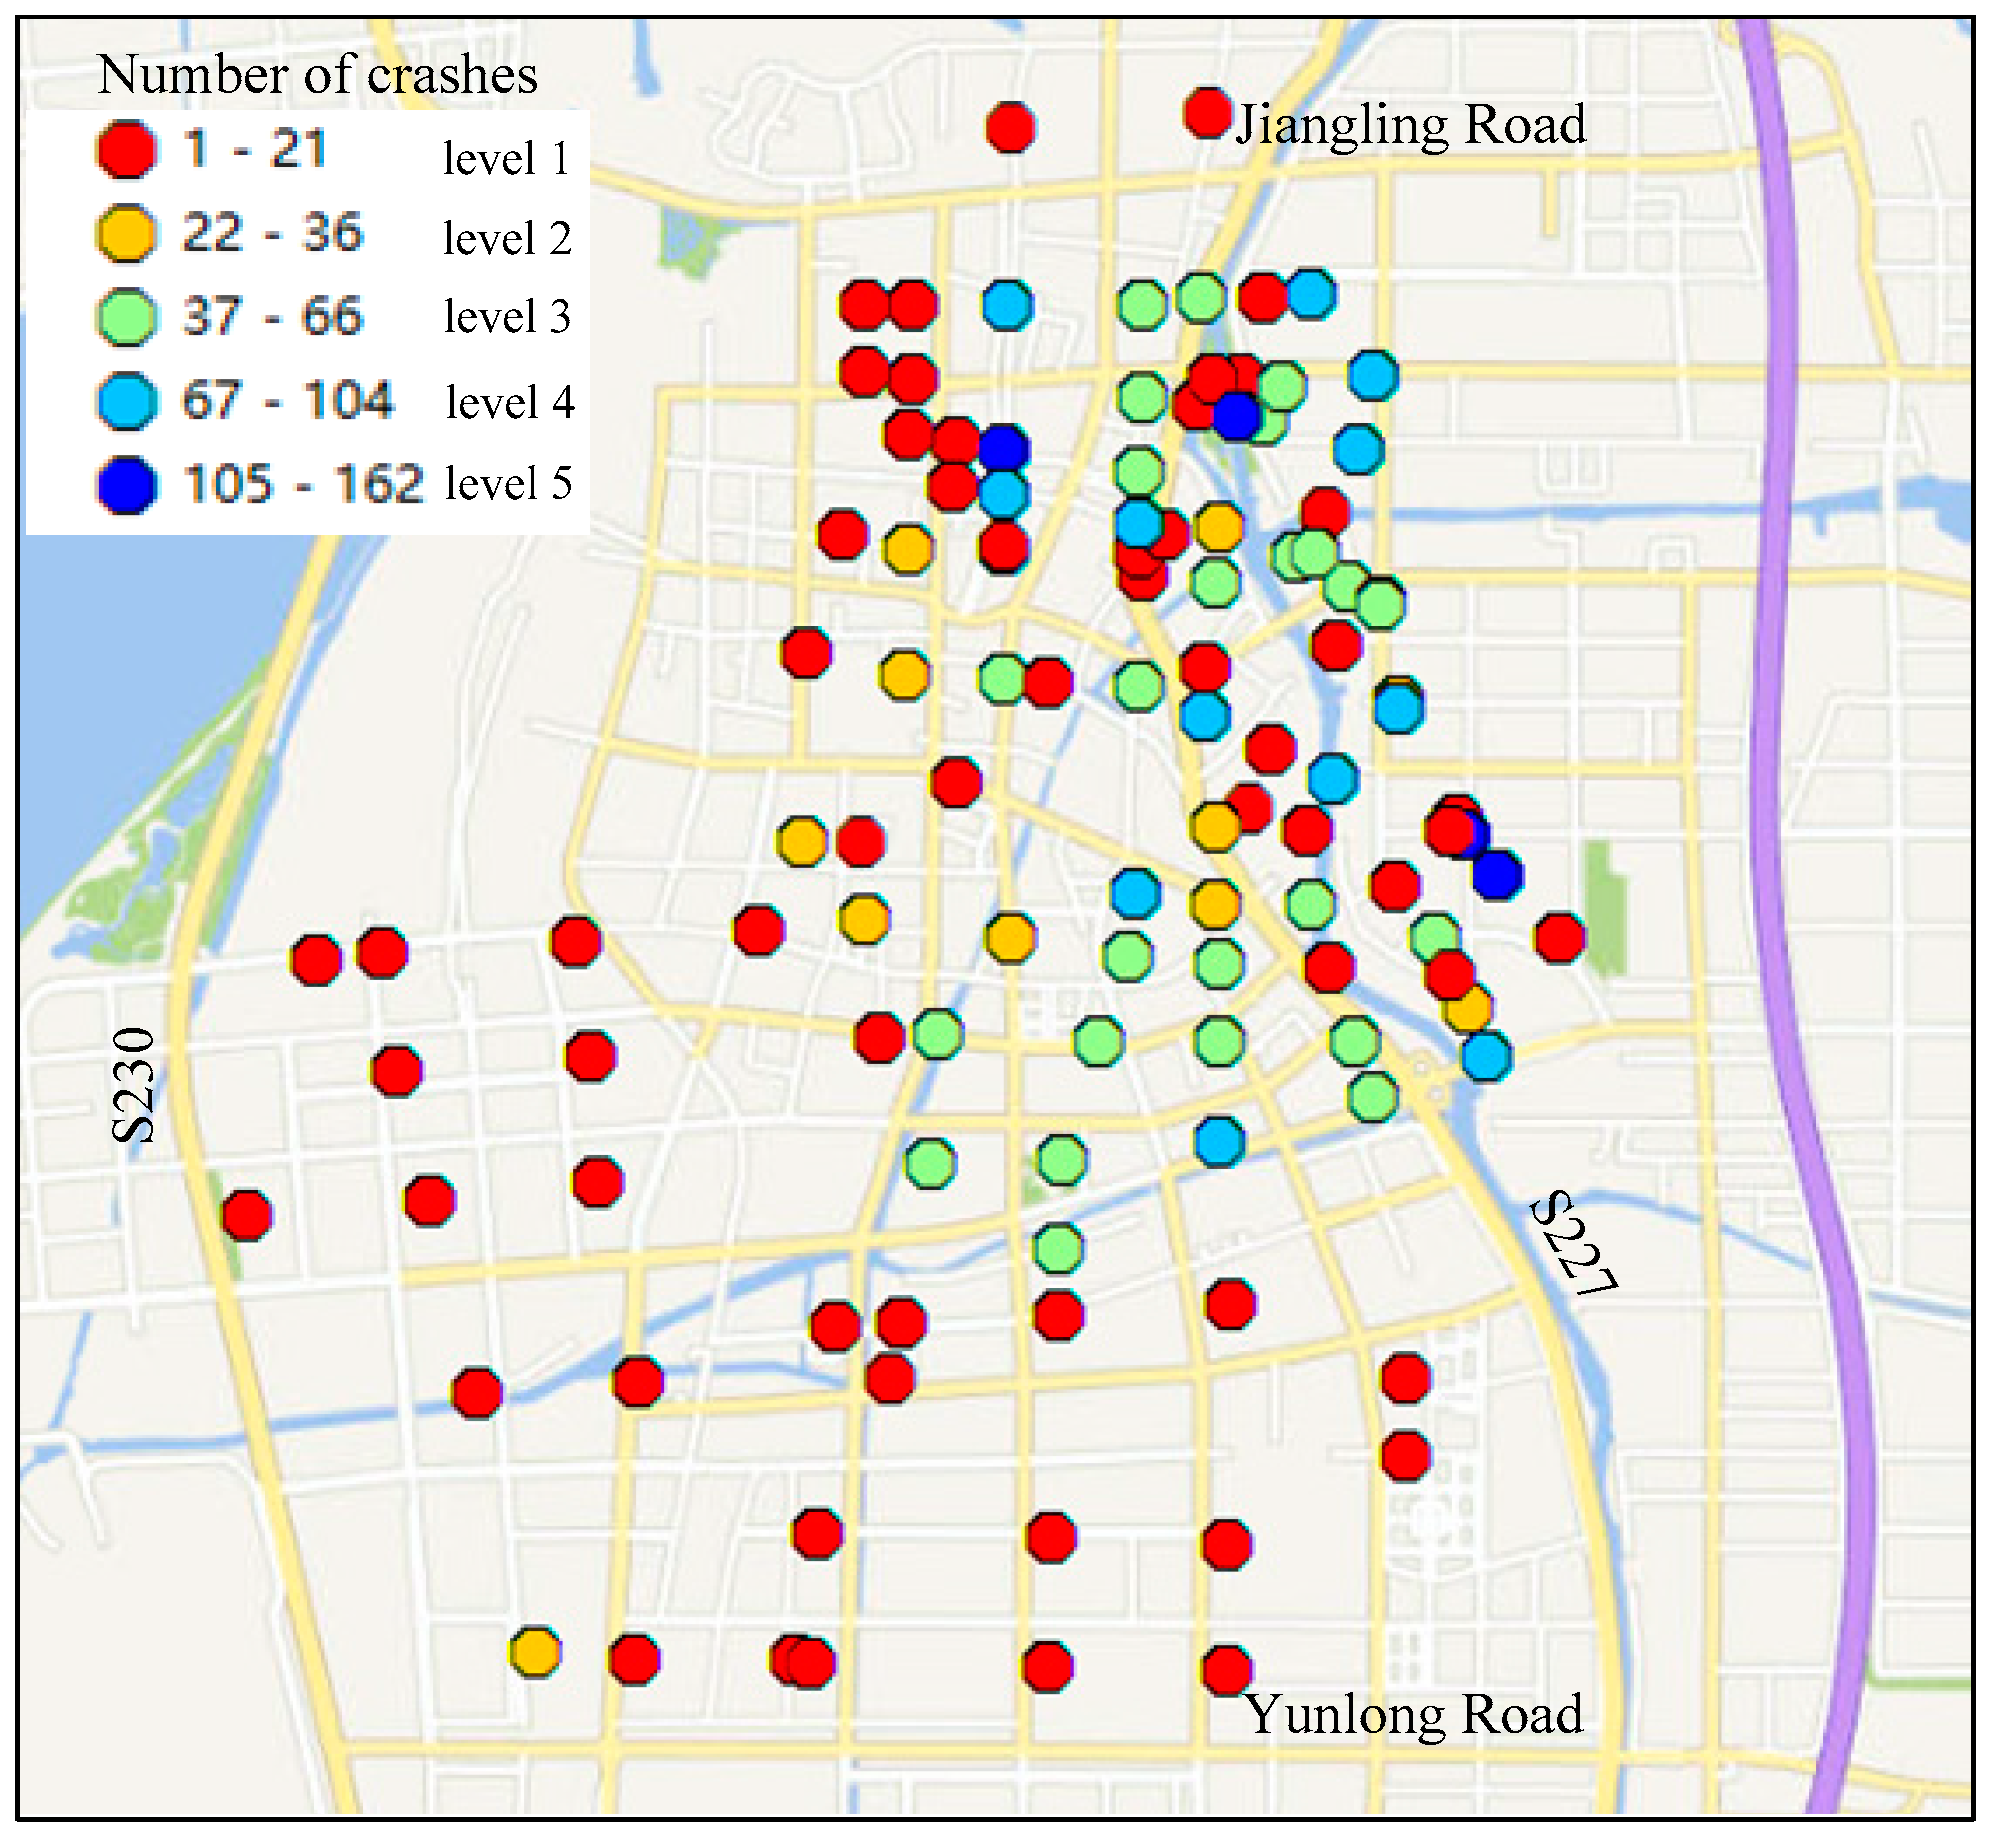
The natural breakpoint classification method provided by ArcGIS 10.5 is used to classify the crashes. This classification method divides the data into several categories and the sum of the variance of each classification method is calculated, then the variance and the smallest result are selected as the optimal classification result. The advantage of this classification method is that it can find the maximum difference in data distribution status and divide it into multiple categories. Finally, the crashes are classified into five categories by the “natural breaks method” (i.e., level 1 is from 1 to 21, which denotes the crash quantity of one year belongs to this range; similarly, level 2 is from 22 to 36, level 3 is from 37 to 66, level 4 is from 67 to 104, and level 5 is from 105 to 162), as shown in Figure 2.
In Figure 2, the blue areas are the areas with the highest number of crashes (i.e., level 5) and the red areas show the lowest number of crashes (i.e., level 1). What can be seen is that the crashes occurred near Yunlong Road and S230 are less, and the high crash occurrence areas are distributed along S227. For example, Wujiang’s crash statistics showed that 162 traffic crashes at the intersection of S227-Yunli Road occurred, 116 crashes at the intersection of S227-Lize Road, and 108 crashes at the intersection of S227-Gaoxin Road for the year of 2016. The traffic crashes along S227 were severe, and this may be attributed to several aspects. First, S227 is a main road of Wujiang directly connected to Suzhou city, and the annual average daily traffic (AADT) in 2016 was 38105veh/day, the traffic volume was rather high, and the traffic congestion was serious at morning and evening peak hours. Under this condition, the vehicles present a “stop and go” phenomenon, which may easily lead to scraping and collisions between motor vehicles. Then, a widening and renovation project was performed on S227 in 2016, which has greatly affected the road traffic capacity. Especially at the road intersections, because part of the lanes was occupied by the construction project, the vehicles have to slow down and change lanes at upstream of the intersections, this can lead to the horizontal and vertical conflicts between the motor vehicles and motor vehicles, motor vehicles and non-motor vehicles. As a result, these conflicts were prone to traffic crashes. Finally, the large truck proportion is high on S227, and these trucks can block the view of the cars. In that case, the car drivers cannot see the signal or traffic signs clearly at road intersections, resulting in crashes.
The above analyses illustrate the high occurrence of crashes at the road intersections that distributed along S227, but it does not mean that these locations are the crash hot spots.

4.2. Time-Space Cube Analysis

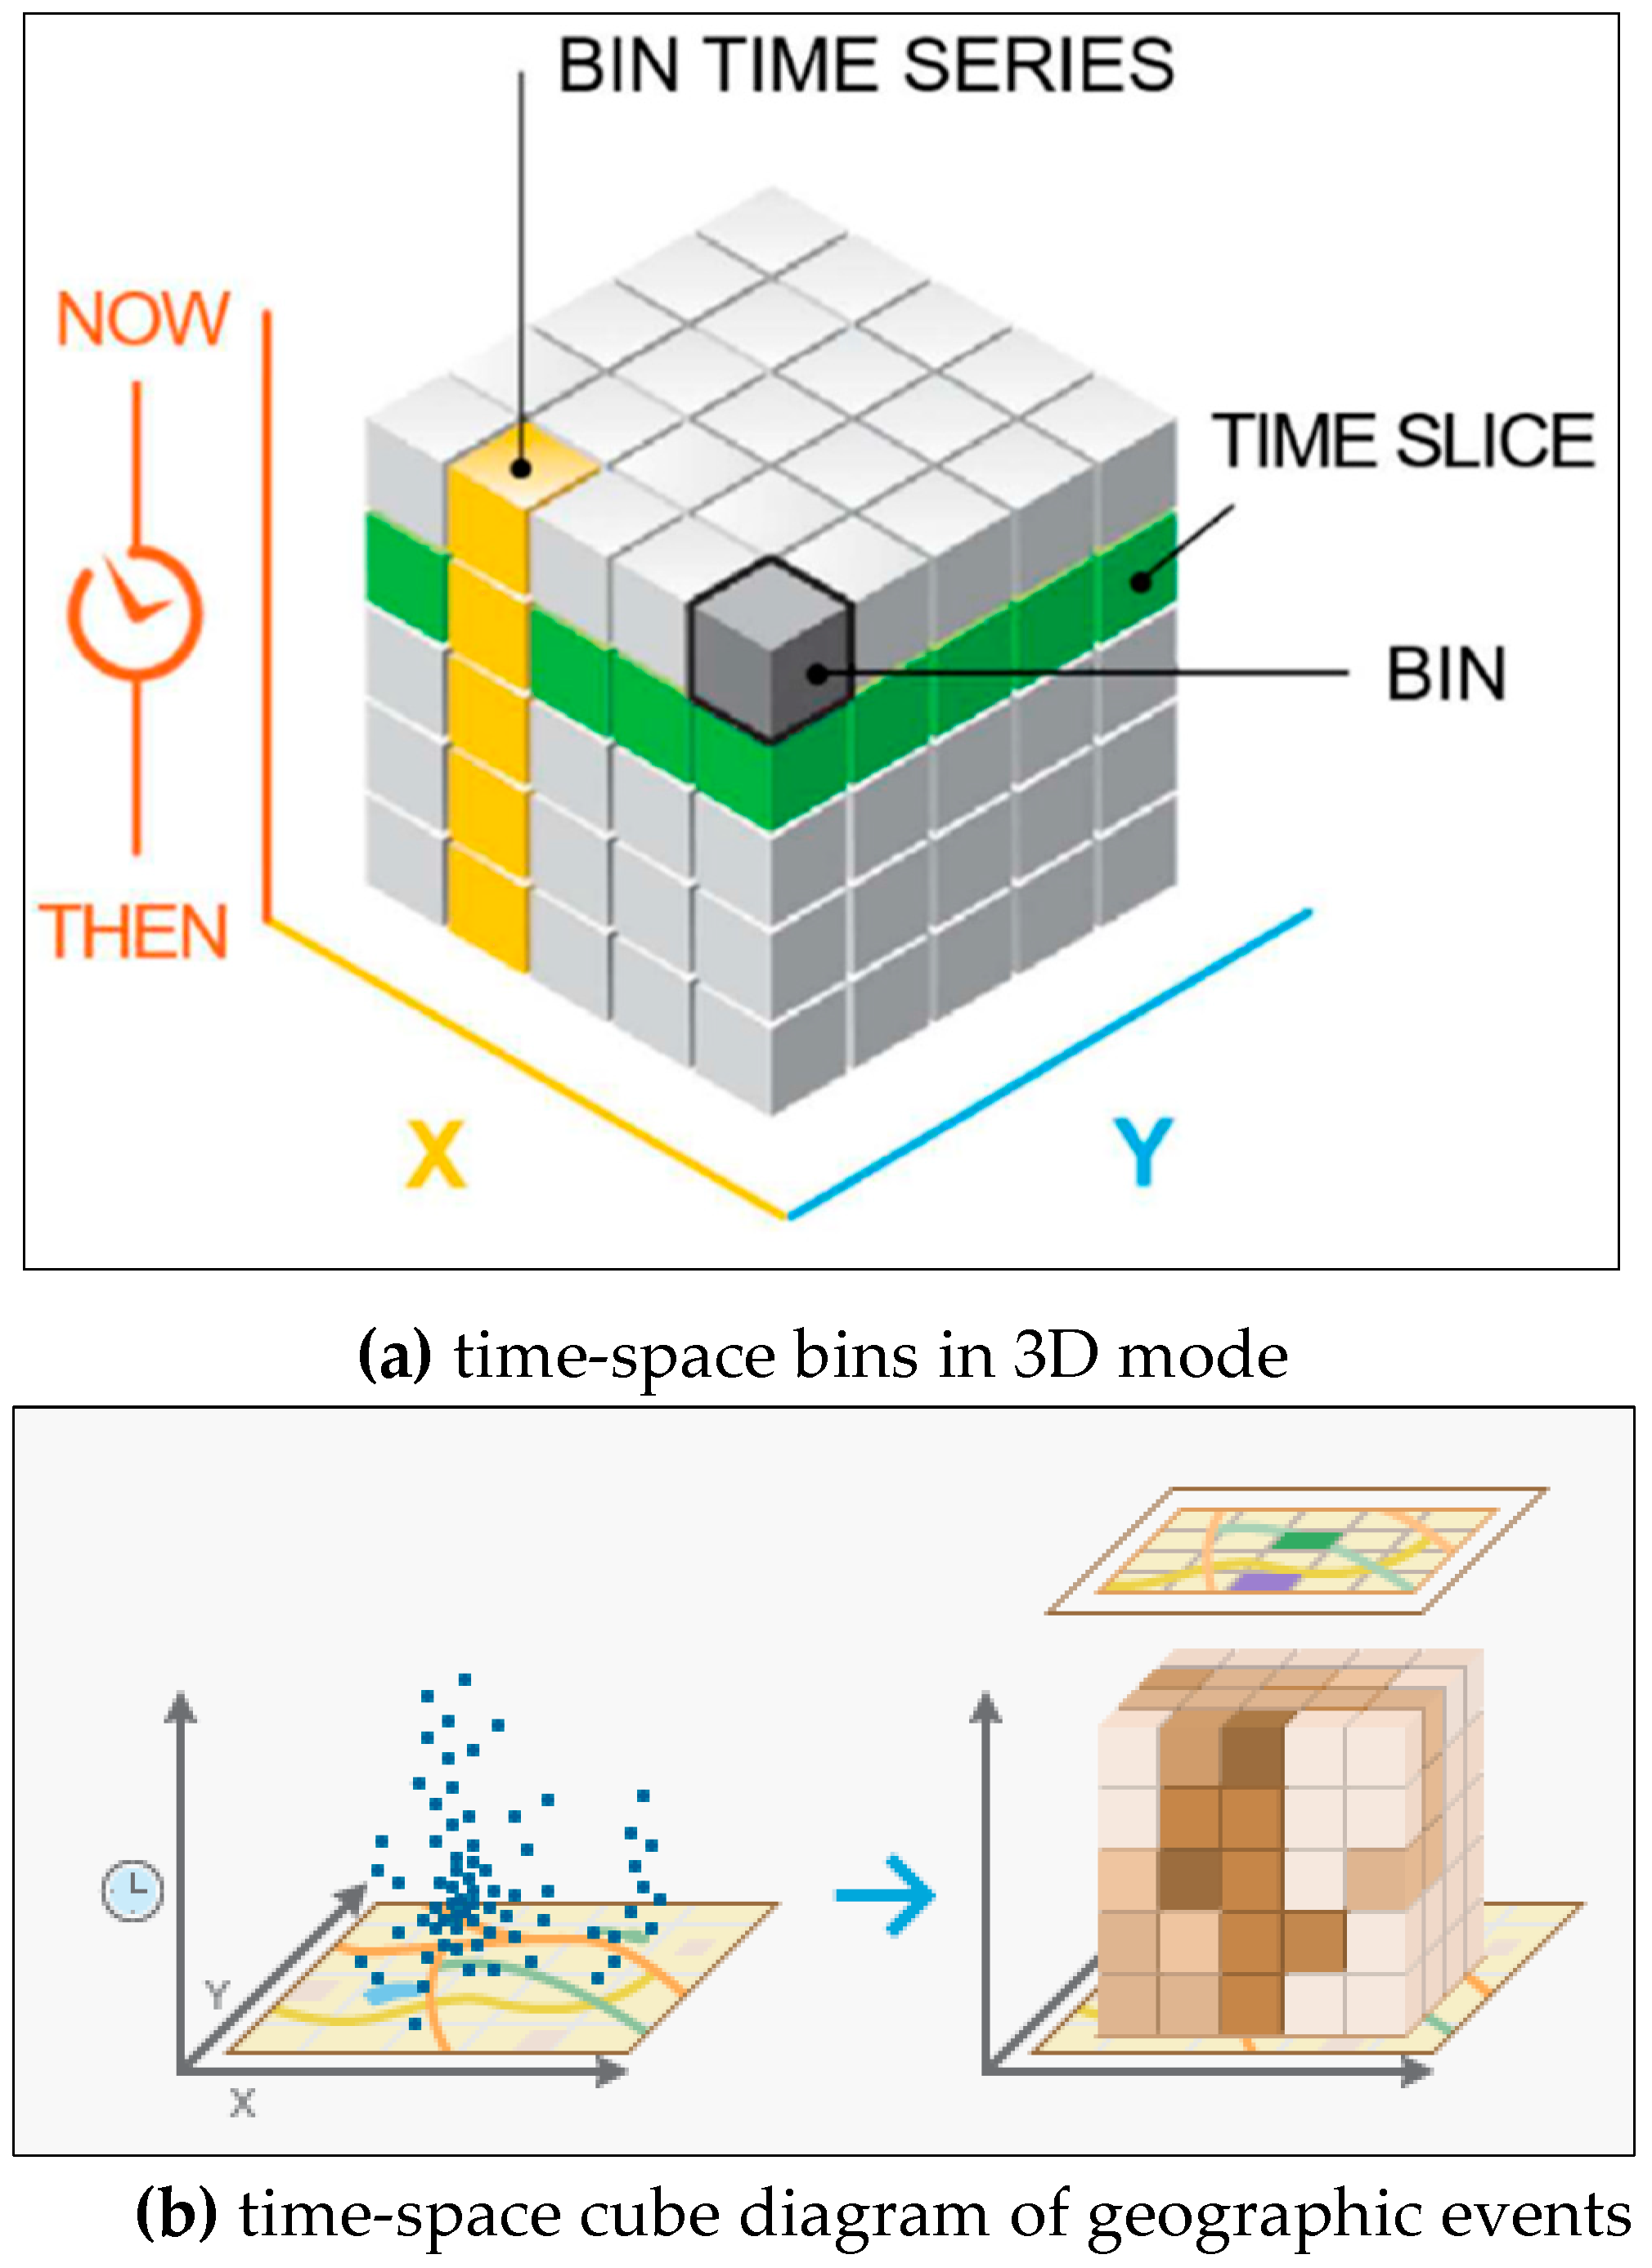
Spatial joint analysis shows the spatial distributions of the crashes at road intersections of Wujiang, but it is unable to show the temporal characteristics of the crashes. Thus, the time-space cube model based on ArcGIS 10.5 is employed to analyze the temporal characteristics of the crashes. Space-time cube analysis is a 3D geo-visualization technique that maps spatiotemporal data in a cube and is useful for finding spatiotemporal patterns. In the time-space cube, x-axis and y-axis denotes the two-dimensional spatial range, respectively, and z-axis represents time. Through spatial positioning, a bin time series will be obtained, and the bin time sequence will be a longitudinal column consisting of a unit cube (column). The number of data points contained in each column is the number of geographic events that occur within the unit time step. Thus, the bin time series can visually show the change of geographic events over time. The time-space cube structure [28] is shown in Figure 3a,b.
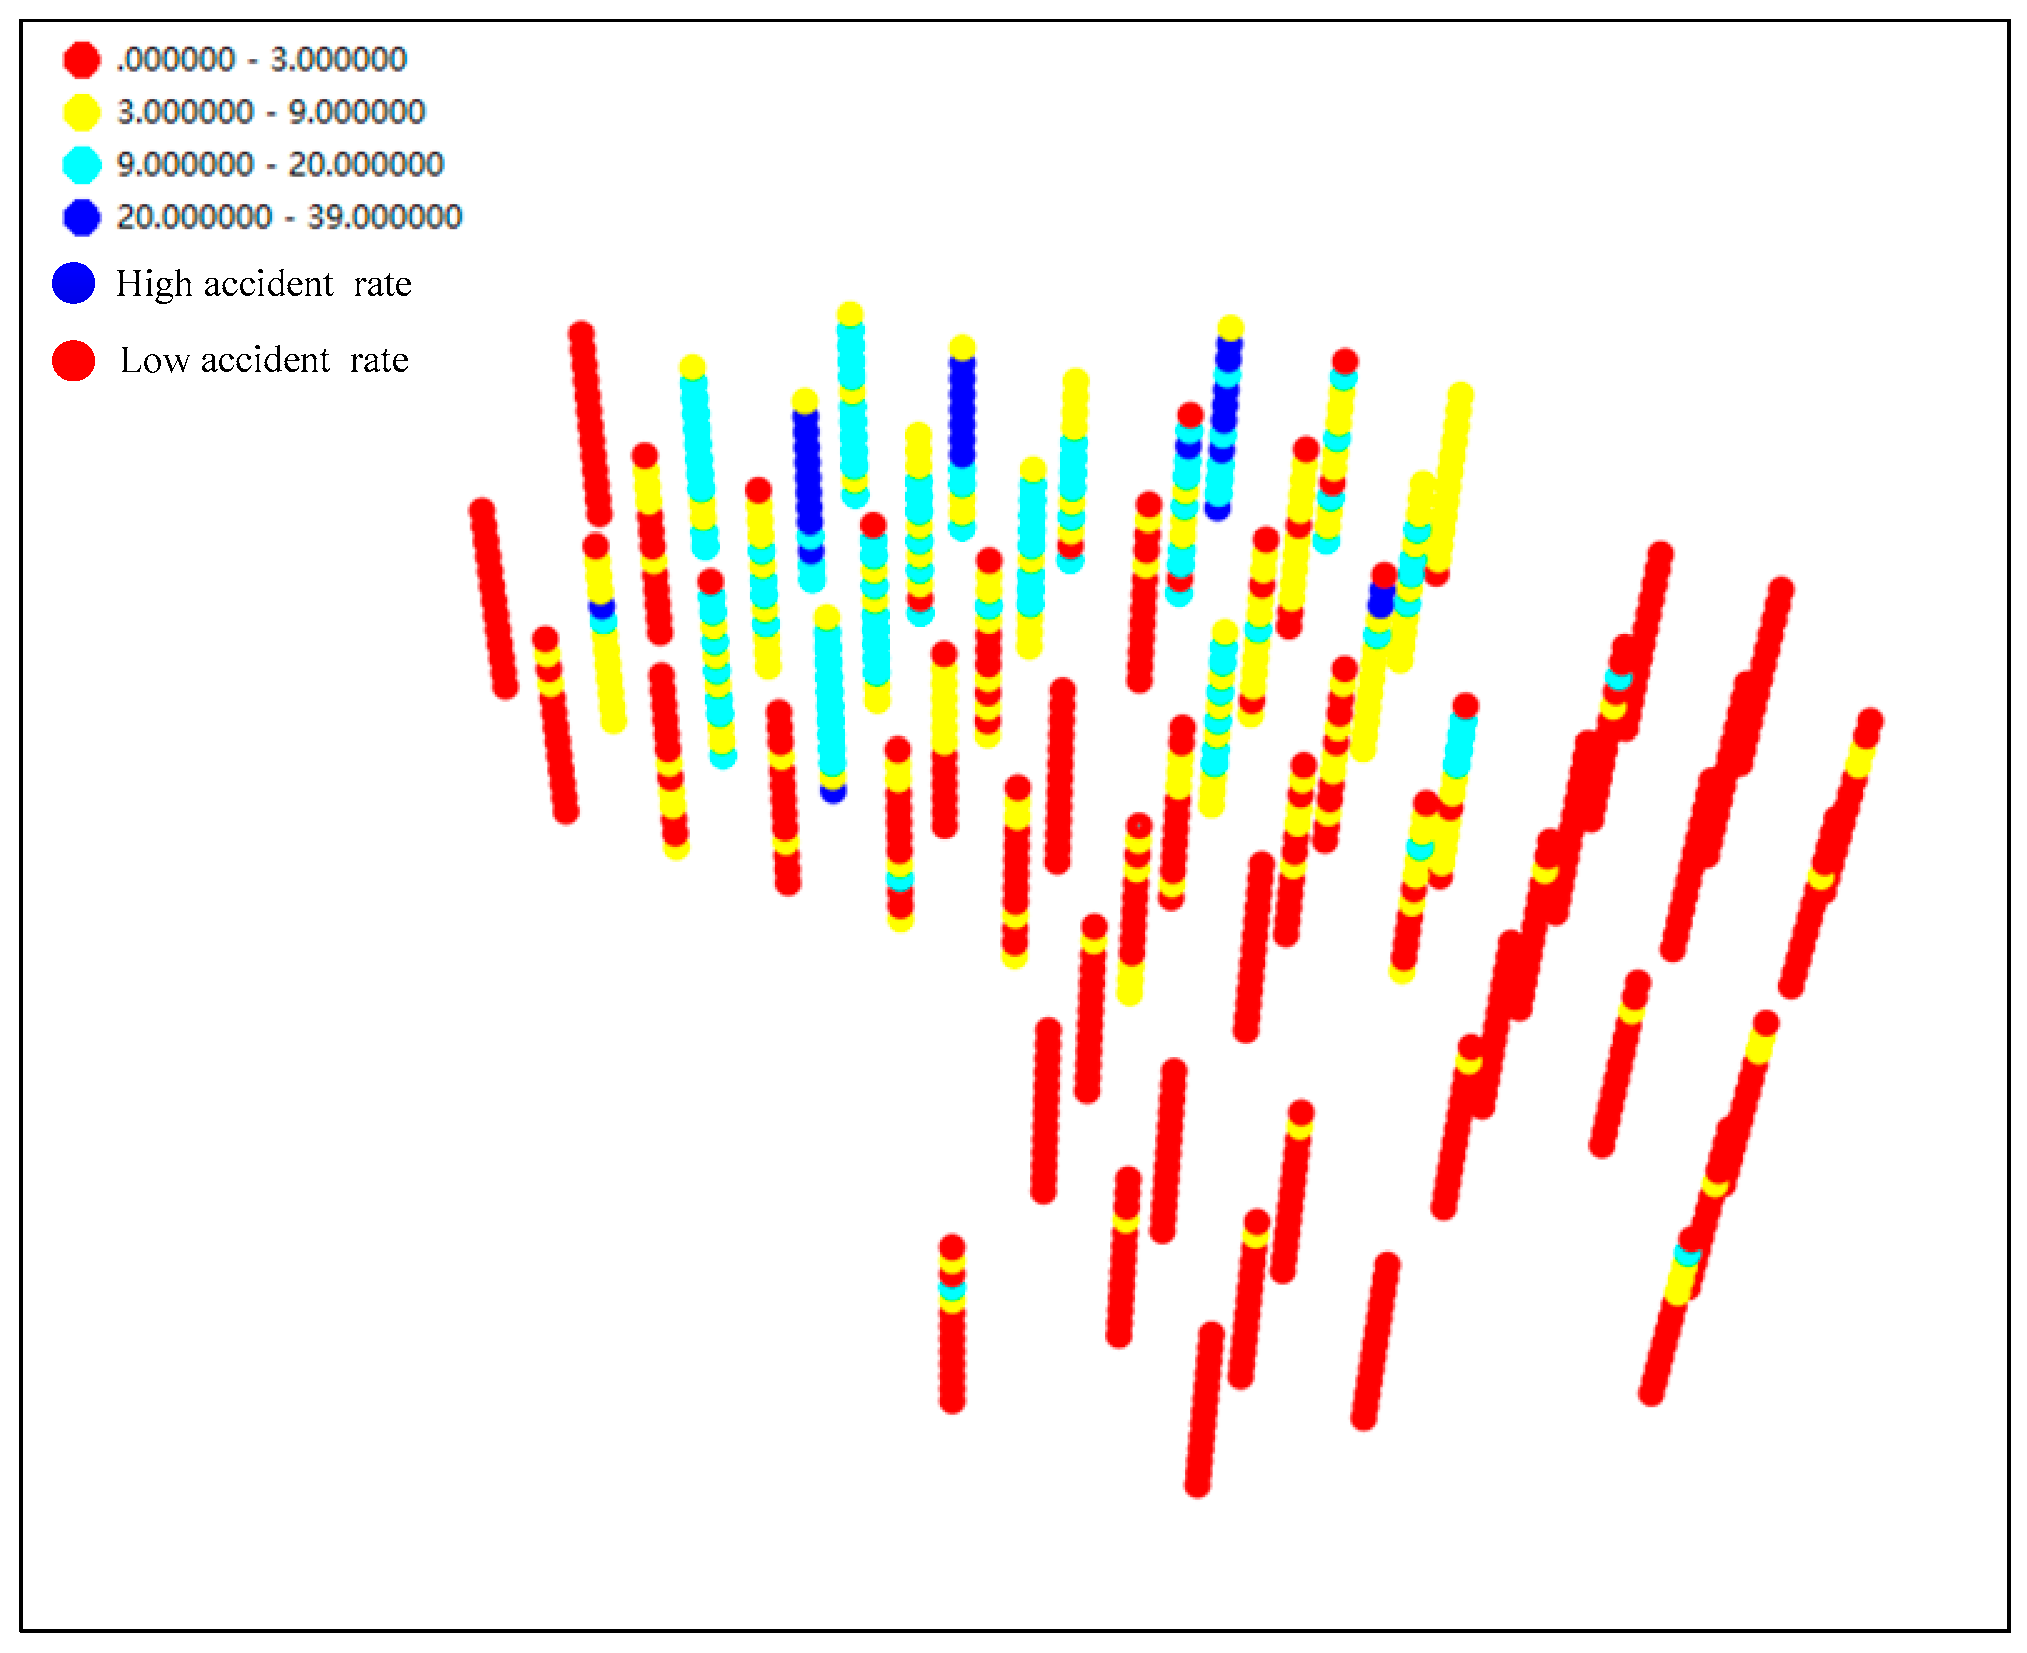
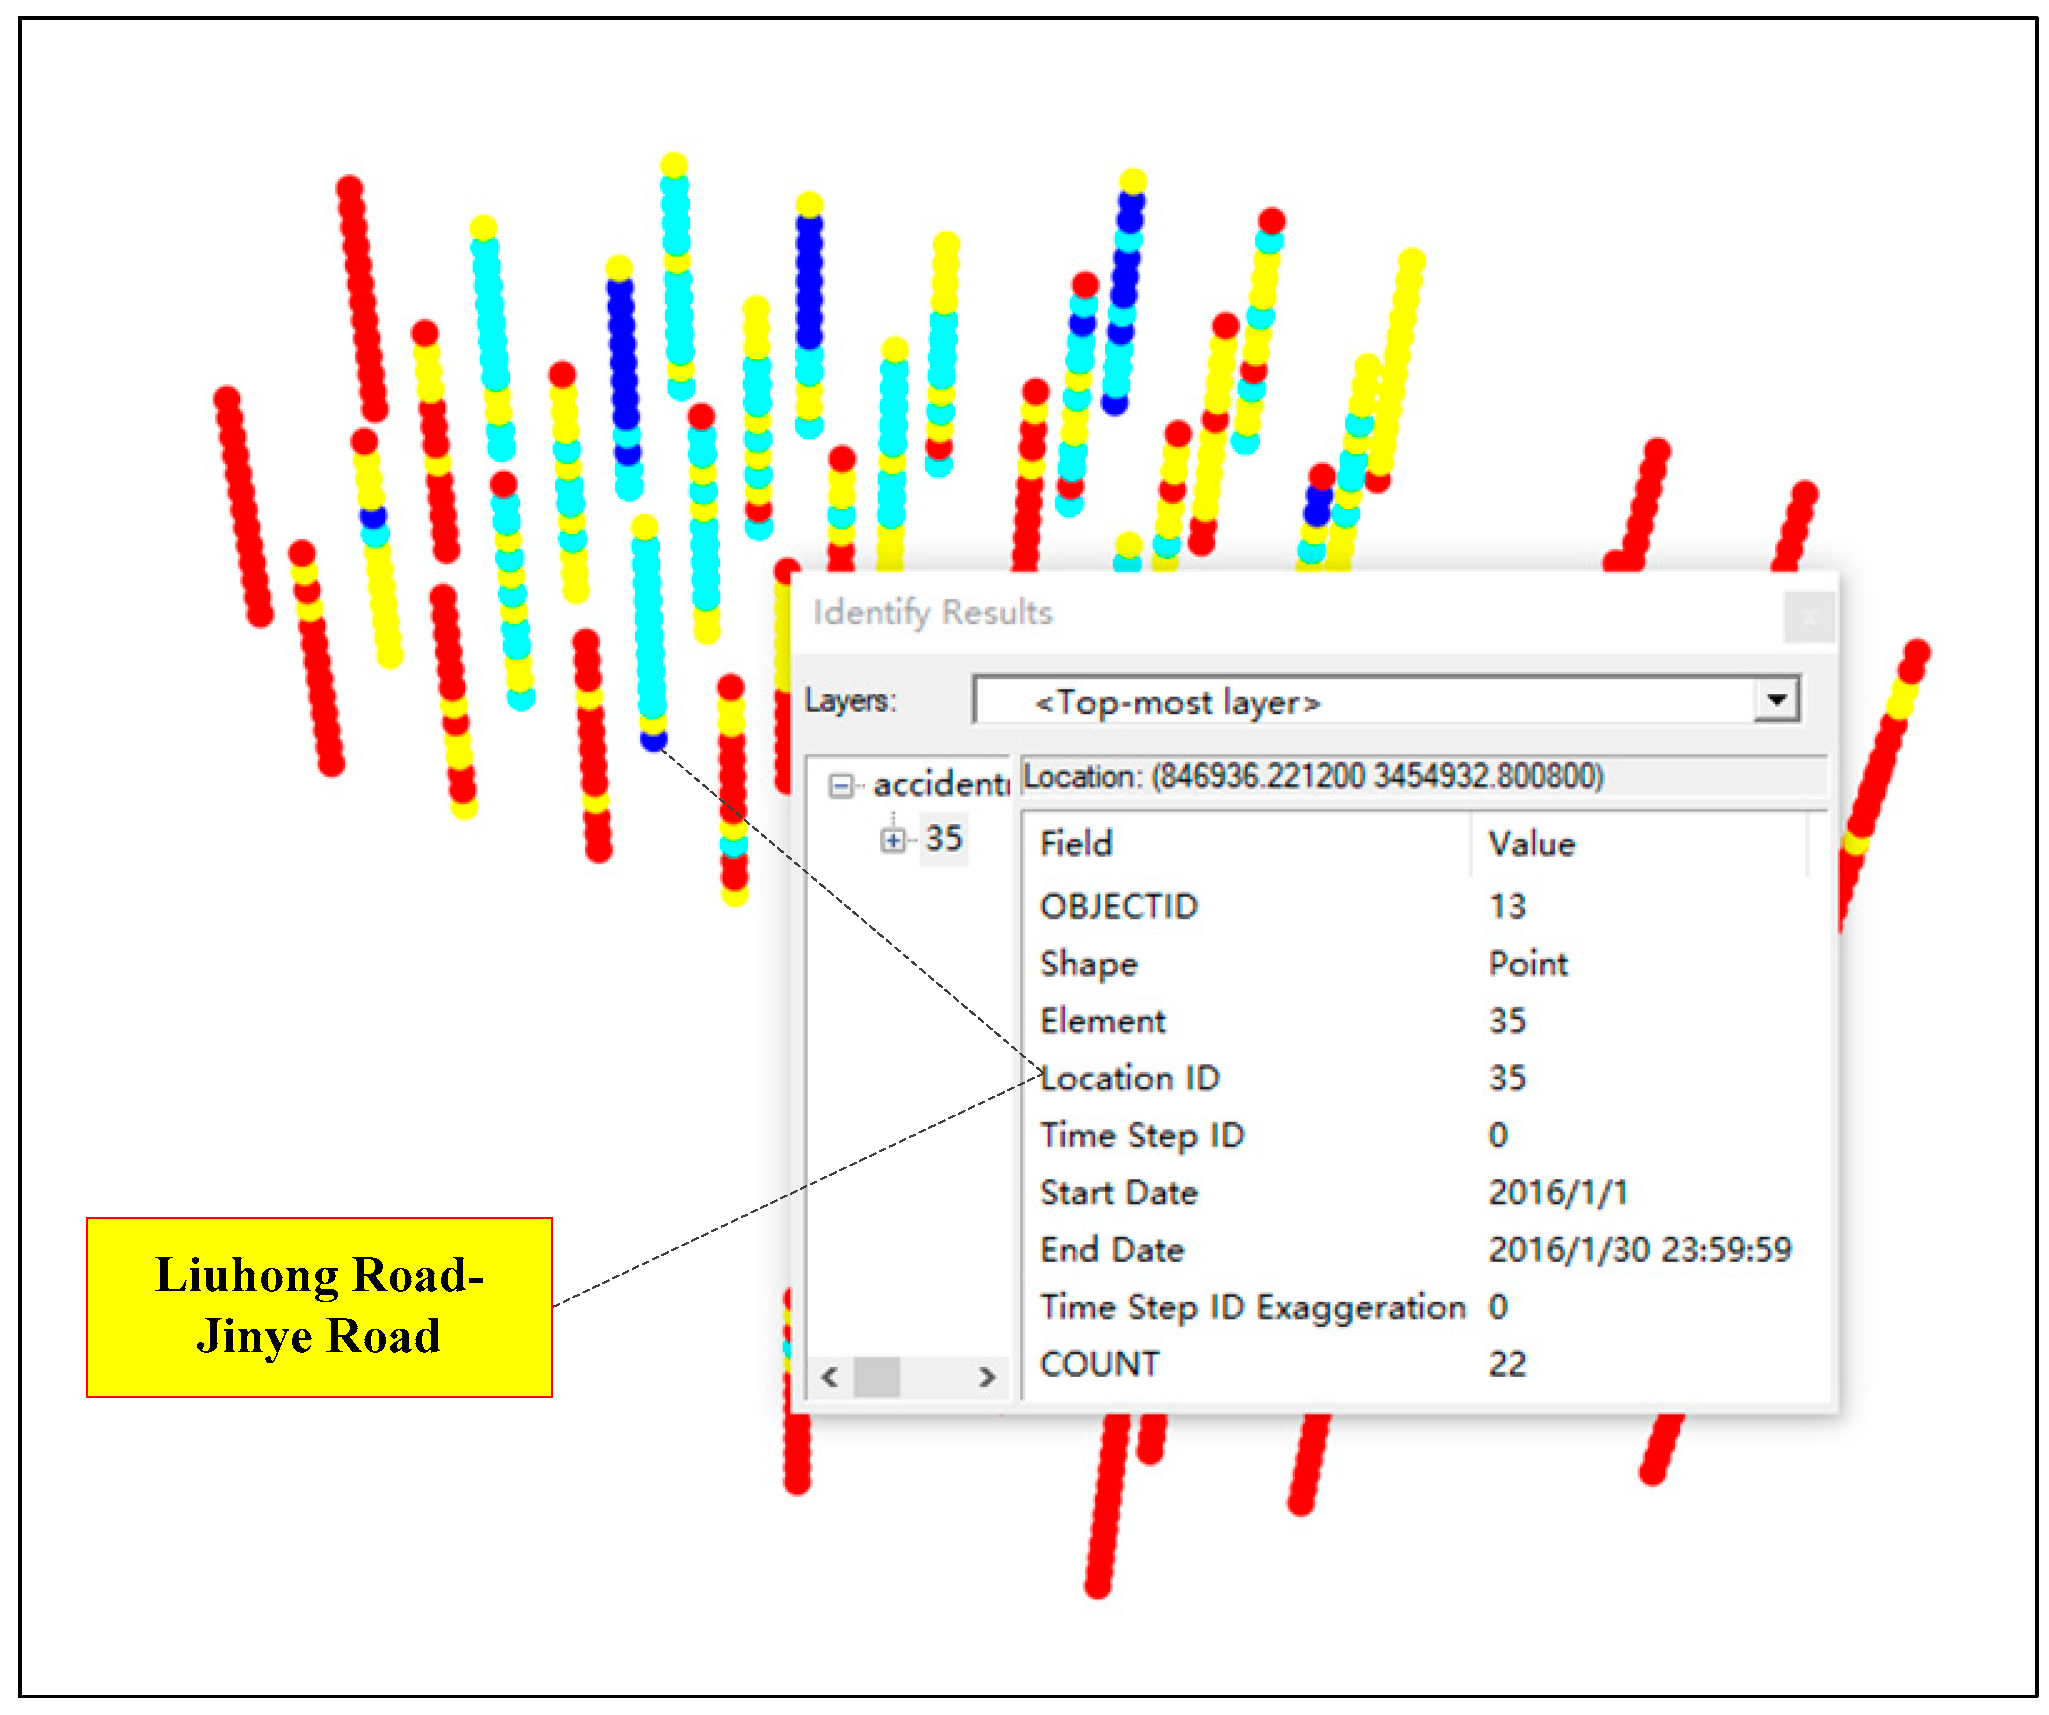
In this study, the space-time cube model is created to display the spatiotemporal distributions of traffic crashes of Wujiang’s road intersections. The time step is one month, so z axis bin includes twelve time steps, then the bin time series of crashes from bottom to top for the year 2016 is “January 1 to 30”, “January 31 to February 29”, “March 1 to 30”, “March 31 to April 29”, “April 30 to May 29”, “May 30 to June 28”, “June 29 to July 28”, “July 29 to August 27”, “August 28 to September 26”, “September 27 to October 26”, “October 27 to November 25”, and “November 26 to December 25”, respectively. These time steps can denote the 12 months of 2016. Then, the natural breakpoint classifies the crash frequency as four categories: From 0 to 3 times/month, from 3 to 9 times/month, from 9 to 20 times/month, and from 20 to 39 times/month. These four types of crash frequency are labeled by different colors (i.e., red, yellow, cyan and blue, see Figure 4), and blue and red represents the high and low crash locations respectively. Finally, the time-space cube visualization result is shown in Figure 4.
In addition, based on the “identify” toolbox of time-space cube, the geographic feature can be identified by clicking the bins of the cube. As a result, the high crash occurrence locations from spatiotemporal aspect can be identified by this toolbox. For example, we click on a bin at random, and then the crash location and time series can be displayed. Figure 5 shows spatiotemporal distribution of the road intersection “Liuhong Road-Jinye Road”, and it indicates that there occurred 22 traffic crashes at location ID 35 (i.e., the road intersection of Liuhong Road-Jinye Road) from 1 to 30 January 2016, and this road intersection corresponds to the high crash rate area (i.e., the fourth crash category, see Figure 4). The crash spatiotemporal situation of other locations can also be identified by this way.
Notably, the high crash rate not necessarily the crash hot spot. The following sections will excavate the crash hot spot by analyzing the spatiotemporal features and trends of the high crash rate locations.

4.3. Spatial Autocorrelation Analysis

The time-space cube analysis qualitatively characterizes the crash situation of each location (i.e., each intersection) from spatiotemporal aspect, but failed to characterize the intrinsic spatial pattern of the crash. In other words, the spatial change features of these crashes (i.e., the spatial aggregation characteristics and the statistical significance) are not explored. Actually, the locations with high crash rate may not necessarily be the hot spot. As the spatiotemporal crash hot spot requests not only have the high crash rate of the current location, but also the high crash rate of its proximity locations. That is to say, the crash point has a significant agglomeration trend in the spatial range. Based on this analysis, the quantitative method (i.e., the spatial autocorrelation analysis) to analyze the spatial features of the crashes is proposed.
Spatial autocorrelation analysis is the action of determining consistent groups of objects according to the amounts of their attributes [29]. Two types of spatial autocorrelation analysis methods are generally known: Global spatial autocorrelation analysis and local spatial autocorrelation analysis [30]. ArcGIS 10.5 can provide the two kinds of spatial autocorrelation analysis toolbox, and with these toolboxes, the spatial autocorrelation analysis of Wujiang’s traffic crashes can be realized.

4.3.1. Global Spatial Autocorrelation Analysis

The global autocorrelation analysis method is used to describe the overall distribution of a certain phenomenon and determine whether this phenomenon has spatial agglomeration characteristics as a whole, and this can be conducted using global Moran’s I statistical analysis. The global Moran’s I method is based on the covariance relationship of the statistical correlation coefficient. Moran’s I index can be described as following.
I = n S 0 · i n j = 1 n w i j ( x i x ¯ ) ( x j x ¯ ) i n ( x i x ¯ ) 2
where, x i , x j denote the ith and jth spatial observed value, respectively, x ¯ = 1 n i = 1 n x i , wij represents the elements of a spatial binary contiguity matrix and weights are the neighborhood relationships exist between location i and its adjacent location j, S0 refers to the summation of all elements of wij.
The Moran’s I value must be between -1 and 1, and Moran’s I value greater than 0 denotes a positive correlation at spatial distribution. The value approaches 0, which represents the random distribution at spatial aspect. Then, the value less than 0 indicates that the same area has a large difference in attributes, and the data space distribution shows a state of high and low interval distribution. The Moran’s I index is usually transformed to the z score with a standard normal distribution, and a positive z score means that the adjacent features have similar values, while a negative z score shows that the adjacent feature have dissimilar values [31]. Correlation between the significant level, confidence, and z score is shown in Table 1.
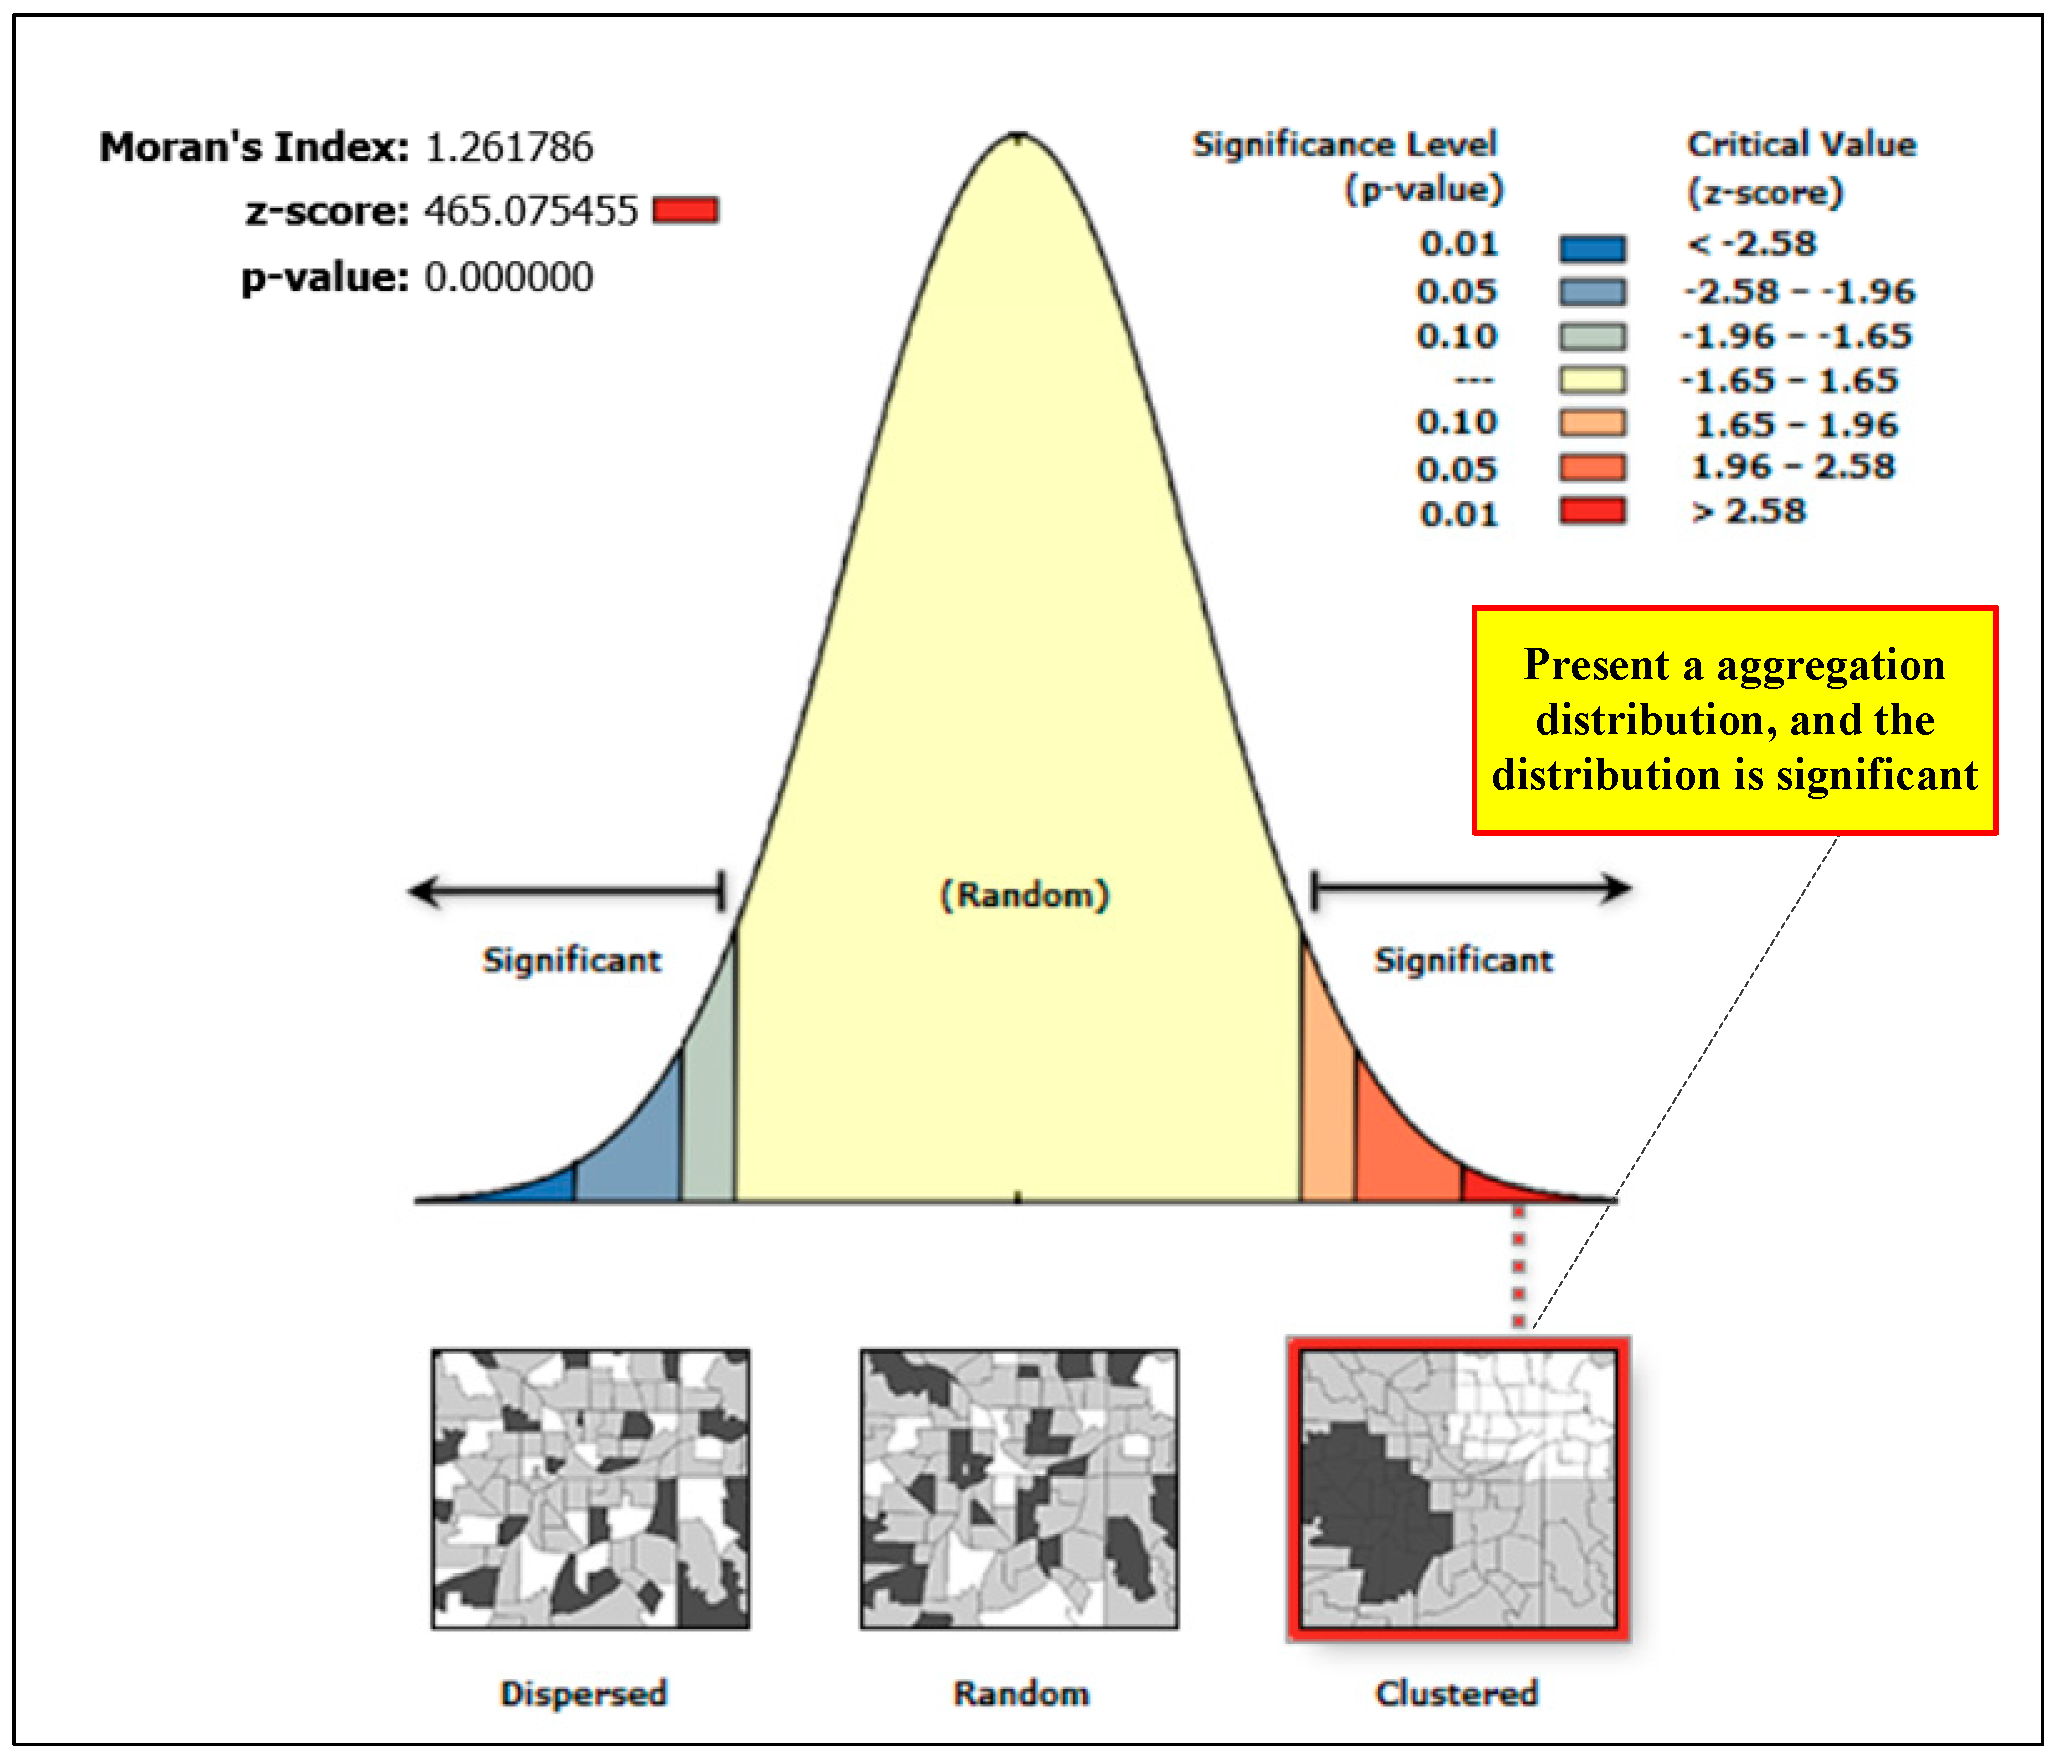
Therefore, this study performs the global spatial autocorrelation analysis of traffic crashes in Wujiang’s road intersections, with an expectation to determine the spatial crash characteristics (i.e., to judge if it is the agglomeration distribution, discrete distribution, or random distribution, at spatial aspect) the whole study area. The spatial autocorrelation toolbox provided by ArcGIS 10.5 is performed to guide this analysis. The results are shown as Figure 6.
Figure 6 shows that Moran’s I value is 1.261786 (it is greater than 0), which suggests that the traffic crashes present a positive correlation at a spatial distribution. P-value is 0.000 (it is lower than 0.01), which denotes the random distribution probability of the traffic crashes is less than 1%. Conversely, the spatial aggregation distribution (i.e., the clustered status in Figure 6) probability is more than 99%. Furthermore, z score is higher than 2.58, which demonstrates that the spatial aggregation trend of the crashes at global distribution is significant.

4.3.2. Local Spatial Autocorrelation Analysis

Global autocorrelation analysis proves that the traffic crashes at road intersections of the study area are aggregated from the spatial aspect, and this aggregation phenomenon is significant. However, the global autocorrelation analysis does not indicate exactly where the crashes gathered (i.e., the specific aggregated locations). The local spatial autocorrelation analysis method can provide the specific aggregation ranges of the crashes and preliminarily identify the hotspots. Getis-Ord Gi* is a technique for local spatial autocorrelation analysis [32], and the equation is as follows [33].
G i * = j = 1 n w i , j X j = 1 n w i , j S n j = 1 n w i , j 2 ( j = 1 n w i , j ) 2 n 1
where x j is the property value of jth element, w i , j is the spatial weight of ith element and jth element, and n is the total number of element.
X = j = 1 n x j n
S = j = 1 n x j 2 n ( X ) 2
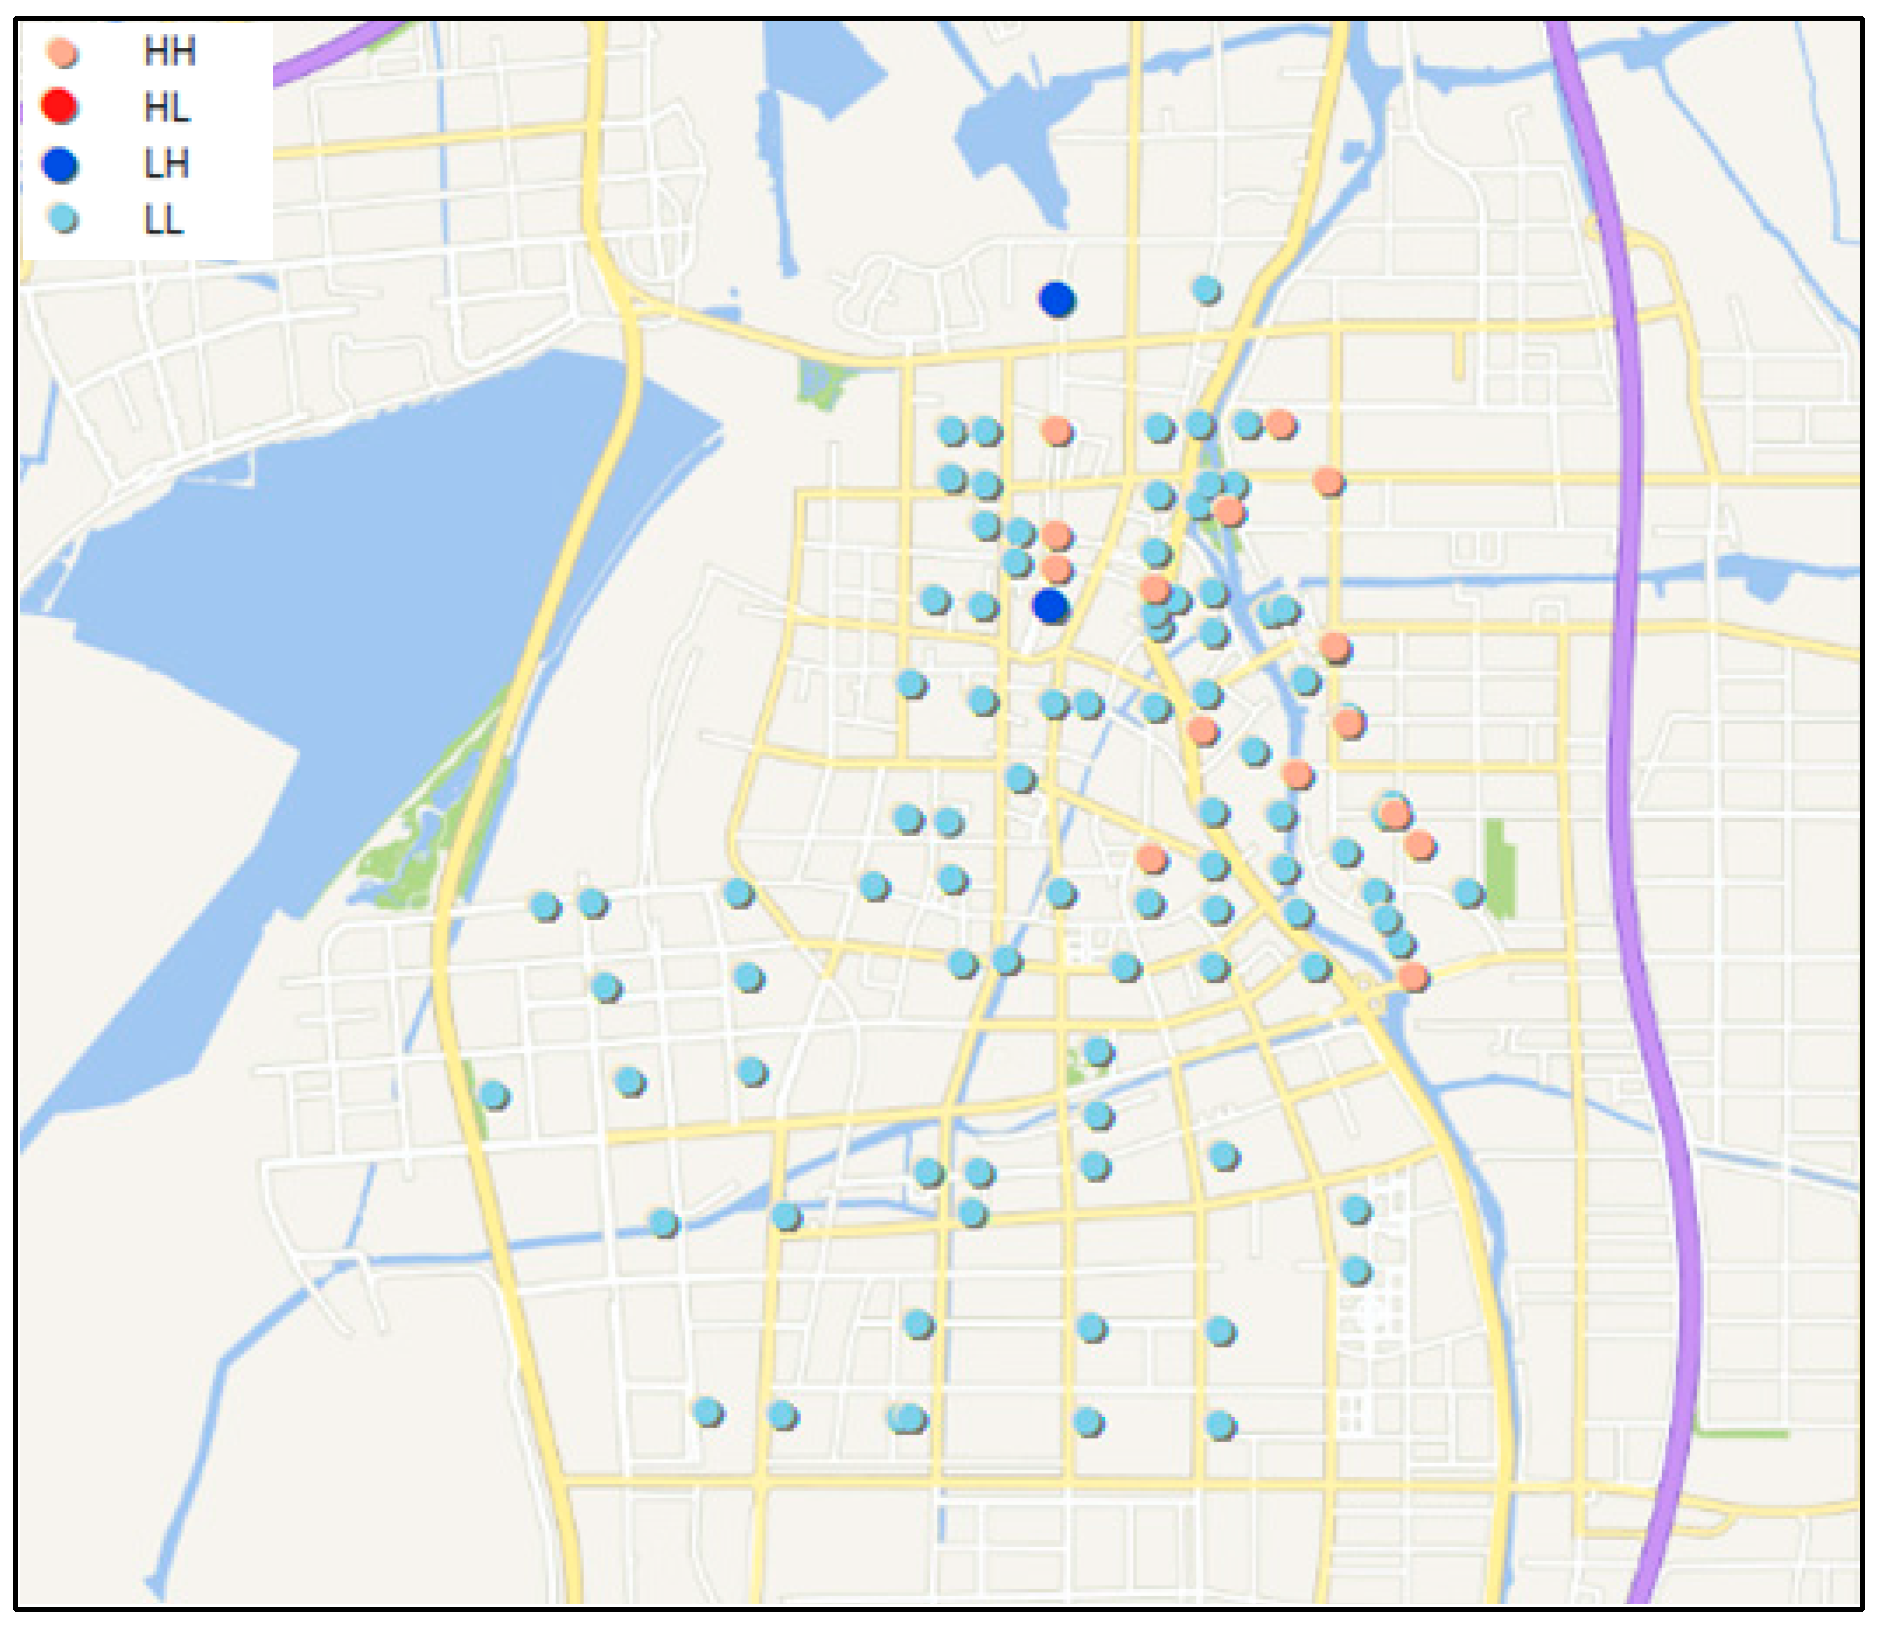
Getis-Ord Gi* can be regarded as the index of local spatial autocorrelation analysis and shows that the high or low values are clustered. The value is involved in spatial analysis, which indicates where hot spots (representing high values clustered in a location) or cold spots (representing low attribute values clustered in a location) appear in the area. The “cluster and outlier analysis” toolbox based on ArcGIS 10.5 is utilized to make the analysis. The results are shown as Figure 7. Four types of points are shown in Figure 7: HH (i.e., the aggregation between high and high values), HL (i.e., the high values are surrounded by low values), LH (i.e., the low values are surrounded by high values), and LL (i.e., the aggregation between low and low values). HH (i.e., the pale pink color) may represent the hot spot, while LL (i.e., light gray points) seems to denote the cold spots.
Notably, z score is the return value of each Gi* statistics. For positive z scores with significant statistical significance (confidence level= 99%, 95%, and 90%), the higher the z score, the closer the high value (hot spot) clustering. Likewise, for negative z scores, the lower the z score, the closer the low value (cold spot) clustering. Grading the degree of clustering of hot or cold spots, as shown in Table 2.
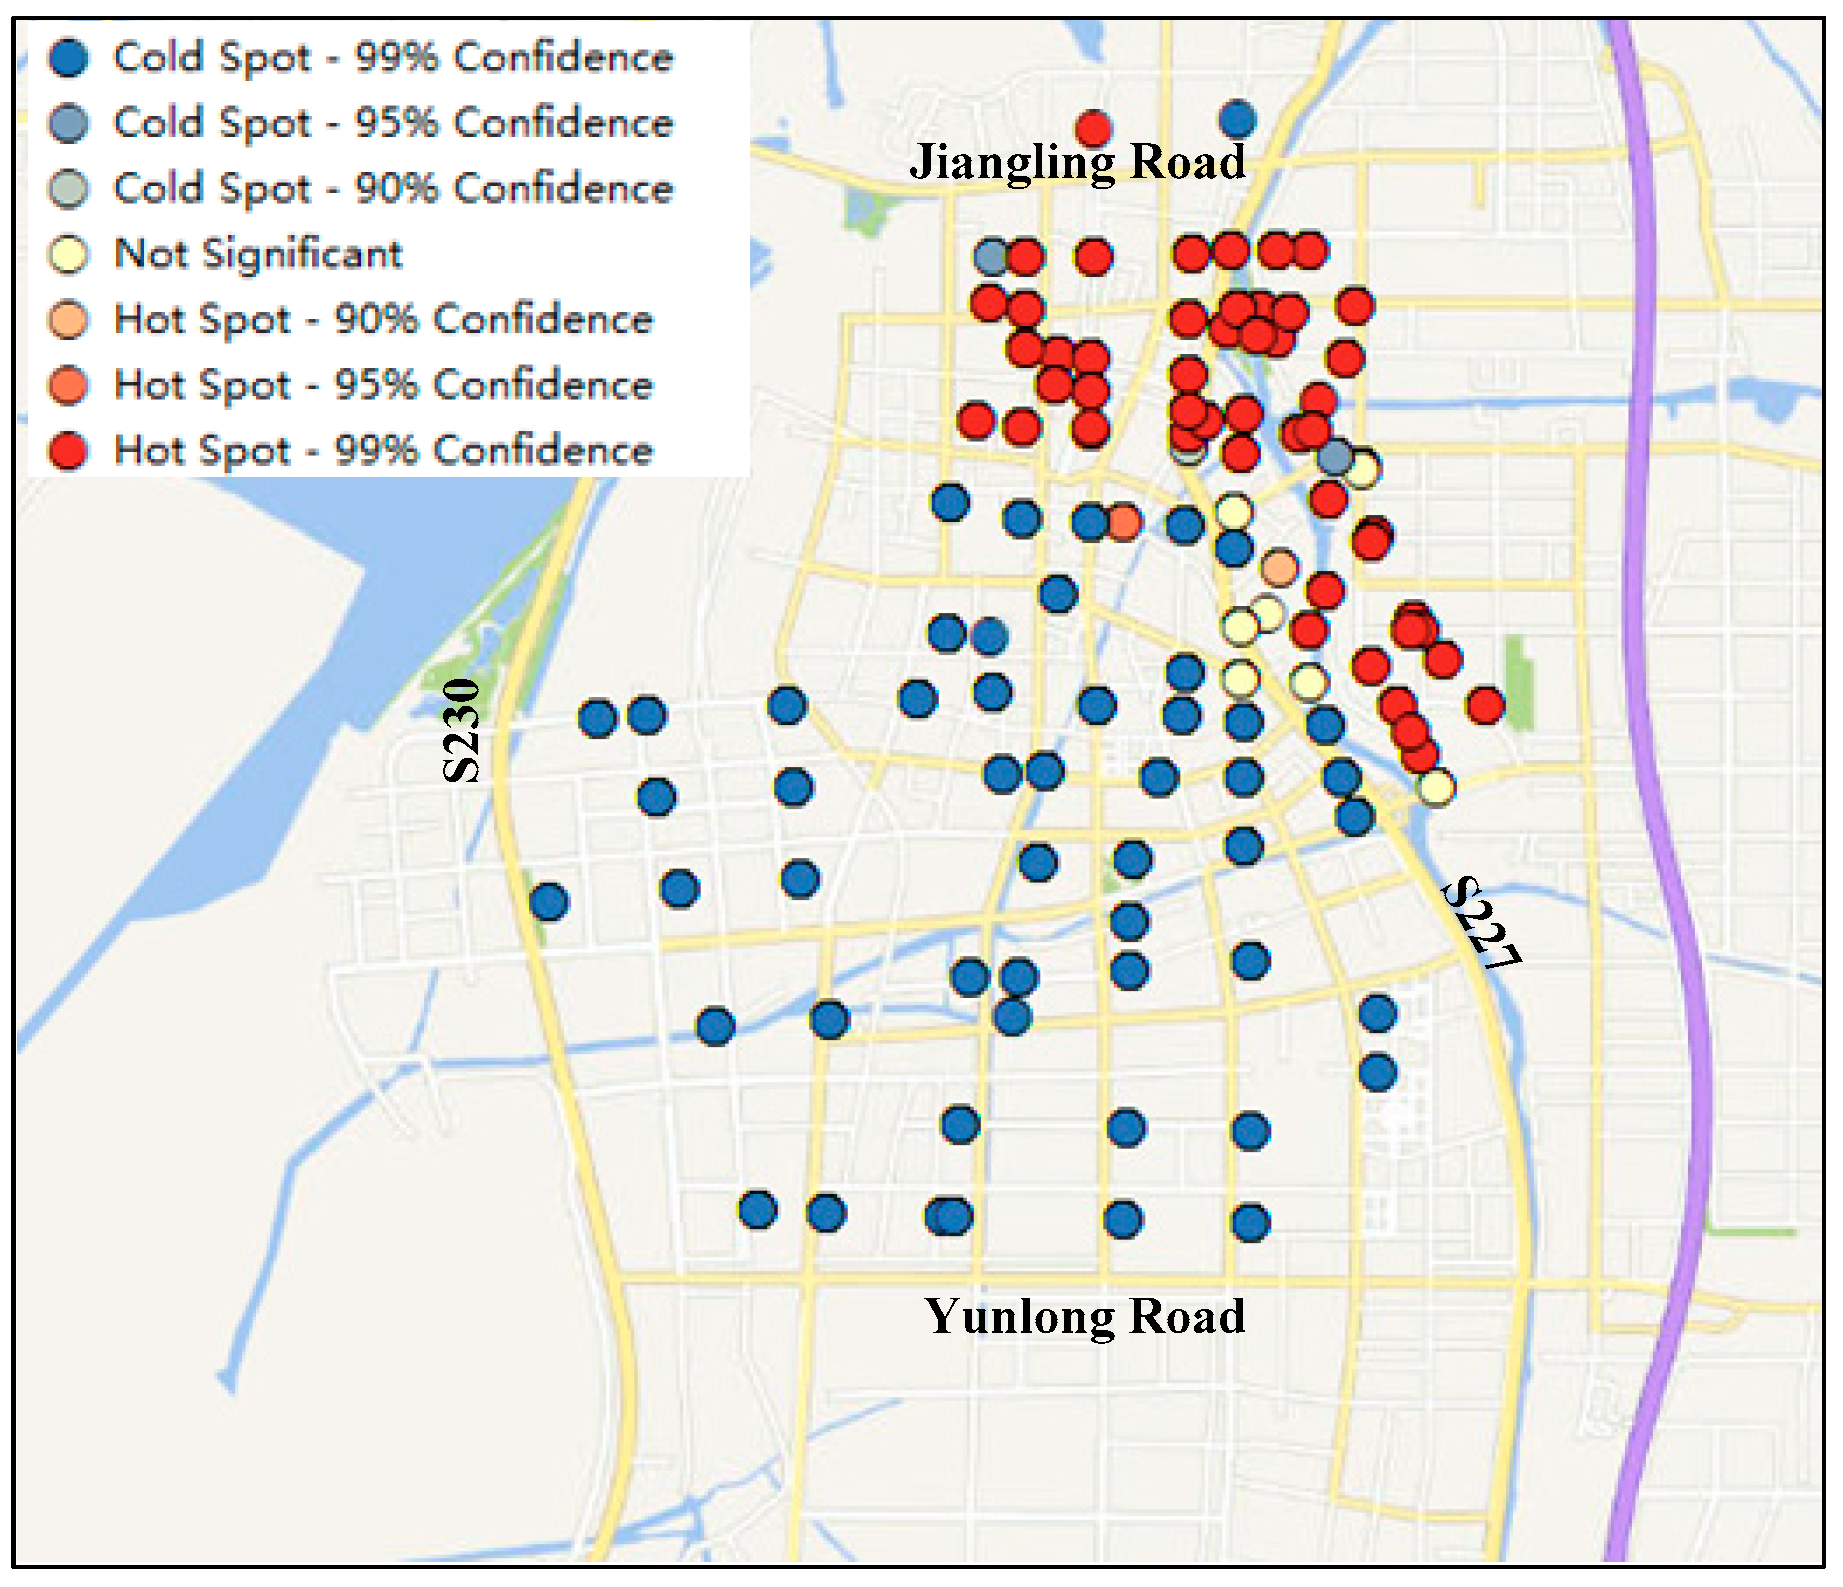
The initial hot spot identification results are shown in Figure 8. From Figure 8, the red locations are crash significantly increased locations (i.e., the hot spot with 99% confidence level), and the blue area are crash significantly decreased locations (i.e., the cold spot with 99% confidence level). Specifically, the crash locations along S227 (i.e., the road intersections of S227-Gaoxin Road, S227-Youche Road, etc.), Yongkang Road (i.e., the road intersection of S227-Yongkang Road), Youche Road (i.e., the road intersection of Youche Road-Luxiang Road), and Gongnong Road (i.e., the road intersection of Zhongshan Road-Gongnong Road) are the crash hot spots, and the crashes in these road intersections are significantly increasing. The crash locations along Tiyu Road, Changban Road, and Lianyang Road are cold spots, and the trends are significantly decreasing.

4.4. Emerging Hot Spot Analysis

The above local spatial autocorrelation analysis has preliminarily identified the crash hot spots. While the emerging hot spot analysis can make a more detailed interpretation and classification of these accident hot spots, they also present the changes of different kinds of hotspots. The emerging spatiotemporal hotspot analysis toolbox provided by ArcGIS 10.5 can identify the trends of crash density in the time-space cube, and classified these hot and cold spots according to 
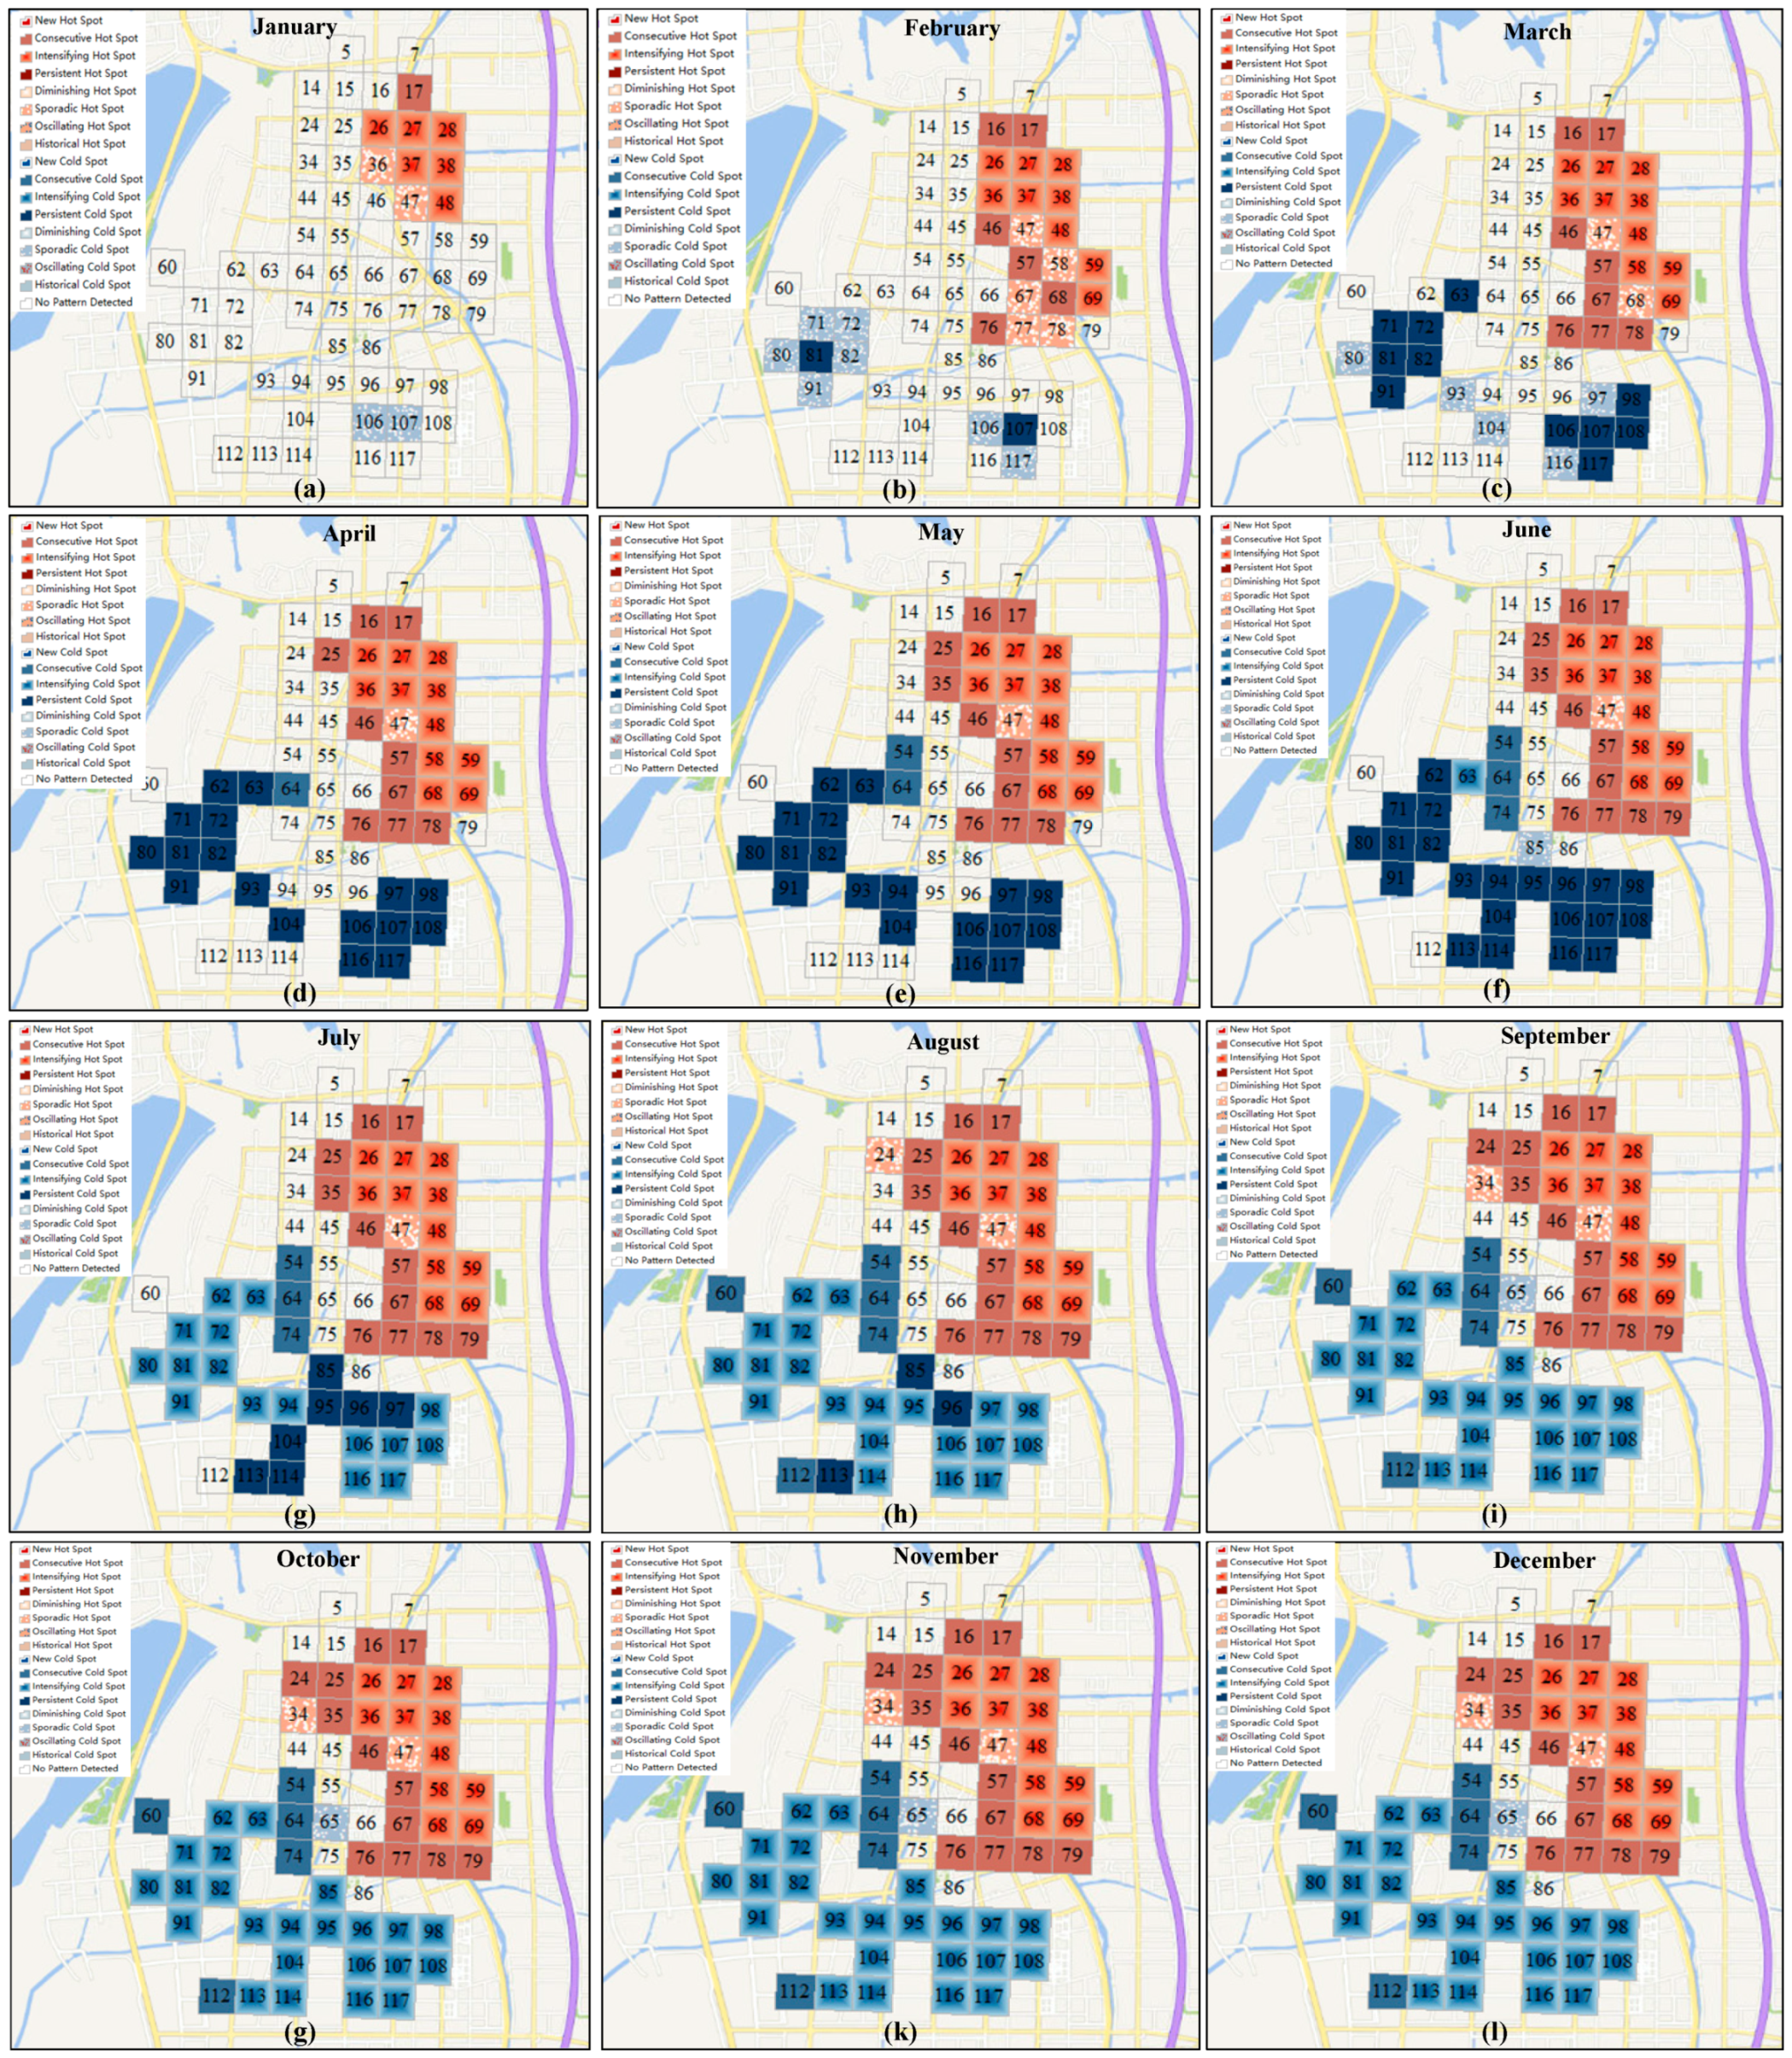
Table 3. Accordingly, this study analyzes the spatiotemporal hotspot of the time-space cube (the time step is one month), and excavates the characteristics of cold hot and hot spots over time. In the process of spatiotemporal hot and cold spots analysis, ArcGIS’s default hotspot is used to analyze the neighborhood distance, and monthly bins were generated for time units. Then, the visualization results of crash hot spots over time for the year of 2016 (from January to December) is shown in Figure 9. The warm color represents the hot spot. The hot spots illustrate that the crash frequency is high at the current locations, and also with a significant agglomeration trend from the spatial perspective. The cold spots are characterized by cold color, and the cold spots indicate the crash frequency is low at the current locations, and the low situation is also gathering on a spatial perspective.
Three types of hot spots (i.e., consecutive hot spot, intensifying hot spot, sporadic hot spot) are distributed at different locations of the study area for the year of 2016 (see Figure 9). Compared to the persistent hot spots, sporadic hot spots, oscillating hot spots, and historical hot spots, the spatiotemporal change trends of those new hot spots, consecutive hot spots, intensifying hot spots, and diminishing hot spots may deserve more attention, especially the new hot spot and intensifying hot spot (see Table 3).
From Figure 9a, the intensifying hot spot locations in January are location ID 26, 27, 28, 37, 38, 48, and the corresponding road intersections are Youche Road-Luxiang Road, Zhongshan Road-Gongnong Road, S227-Gongnong Road, Liuhong Road-Gongyuan Road, S227-Yongkang Road, and S227-Chuihong Road, respectively, which declares that the traffic crashes at these intersections show a significantly increasing trend. As time goes by, the intensifying hot spot locations also increased. For example, on the basis of January, location ID 36 (i.e., road intersection of Liuhong Road-Luxiang Road), location ID 58 (i.e., road intersection of Huayuan Road-Lize Road), location ID 59 (i.e., road intersection of S227-Gaoxin Road) and location ID 69 (i.e., road intersection of Changan Road-Gaoxin Road) are added as the intensifying hot spots one after another from February to March. In April, location ID 68 (i.e., intersection of Huayuan Road-Tiyu Road) also become the intensifying hot spot, and then after it the intensifying hot spot locations keep stable (i.e., intensifying hot spots contain location ID 26, 27, 28, 36, 37, 38, 48, 58, 59, 68, and 69 from April to December). Thus, all these intensifying hot spots are not only statistically significant hot spots within each time step (i.e., one month), but also have a significant increase trend in spatial agglomeration. Therefore, these road intersections such as Youche Road-Luxiang Road, Zhongshan Road-Gongnong Road, S227-Gongnong Road, Liuhong Road-Luxiang Road, Liuhong Road-Gongyuan Road, S227-Yongkang Road, S227-Chuihong Road, Huayuan Road-Lize Road, S227-Gaoxin Road, Huayuan Road-Tiyu Road, and Changan Road-Gaoxin Road should be paid more attentions when taking preventive measures against traffic crashes.
In addition, the consecutive hot spot location in January only contains location ID 17 (i.e., the road intersection of Jiangxing Road-Xitanghe Road). As time goes, the consecutive hot spot locations increase from February to May, and these added locations include location ID 16, 46, 57, 67, 76, 77, and 78, the corresponding road intersections are Jiangxing Road-Luxiang Road, Lize Road-Wumo Road, Zhongshan Road-Tonghong Road, Zhongshan Road-Tiyu Road, Kaiping Road-Luxiang Road, Kaiping Road-Zhongshan Road, and Huayuan Road-Kaiping Road. Then from June to August, location ID 79 (i.e., the intersection of Changan Road-Easttaihu Street) is added to the consecutive hot spot locations. Afterwards, location ID 24 (i.e., the road intersection of Suzhouhe Road-Youche Road) has become consecutive hot spots from September to December, and the consecutive hot spots distribution trend is stable at this period. The above analyses illustrate the traffic crash followed a seasonal change, there are weak hot spots in the coldest months of January and February, then the crash hot spots are gradually increasing from summer to autumn, which aligns with the study in Reference [22].
With respect to traffic crash cold spot, four types of traffic crash cold spots (i.e., sporadic cold spot, persistent cold spot, consecutive cold spot and intensifying cold spot) are identified in the study area. The cold spots in the first half of 2016 are mainly the sporadic cold spots (i.e., from January to March) and persistent cold spots (i.e., from April to June). The sporadic cold spots are not the research focus, we only analyze the persistent cold spots (i.e., the locations include location ID 62, 63, 71, 72, 80, 81, 82, 91, 93, 104, 97, 98, 106, 107, 108, 116, and 117 from April to June). These persistent cold spots represent that the traffic crash rate is low at these locations, and spatial agglomeration of them present no obviously increasing or decreasing trend. As times go, most of the above persistent cold spots became the intensifying cold spots from July to December (see Figure 9g–l), and this indicates the low crash agglomeration trend is increasing, so the traffic crashes at these locations are less and less from July to December. The above analysis demonstrates the traffic crash rate is low at location ID 62, 63, 71, 72, 80, 81, 82, 91, 93, 104, 97, 98, 106, 107, 108, 116, and 117 from April to December, especially in the second half of year 2016, the traffic safety condition at the above locations is obviously getting better.
Overall, the traffic crash hot spots are mainly distributed in the northeast of Wujiang’s major urban area, while the crash cold spots are concentrated in the southwest of Wujiang. This finding is consistent with the existing reference in [27], which indicates that the road intersection crash in the Northeast part of Wujiang is more serious and should be prevented and administered in priority.

5. Discussion

The traffic crash hotspots and cold spots, respectively, denote the high and low crash incidence of the current locations and their proximity locations. The present discussion may only analyze the traffic crash hot spots, because these hot spots are directly related to the traffic safety condition, which has a negative impact on the sustainable development of Wujiang’s road transport.
The emerging hot spot analysis identifies the crash hot spots in the study area of Wujiang. Then the sustainable traffic management can be implemented according to the specific temporal and spatial trends of these hot spots. For example, the road intersections of Youche Road-Luxiang Road, Zhongshan Road-Gongnong Road, S227-Gongnong Road, Liuhong Road-Gongyuan Road, S227-Yongkang Road, and S227-Chuihong Road should attract the traffic managers’ attention in January. The above road intersections are always the traffic crash hotspots for the whole year, among which the traffic crashes along S227 (including the road intersections of S227-Gongnong Road, S227-Yongkang Road, S227-Chuihong road) are serious for three reasons (i.e., S227 is directly connected to Suzhou city, and the AADT in 2016 was rather high; a widening and renovation project was performed on S227; the large truck proportion is high on S227), all of these reasons can increase the likelihood of crash, thus these intersections may inclined to become hotspots. Then, the intersection of Youche Road-Luxiang Road is located near Wujiang Experimental Primary School, and many private cars will go through this intersection during peak school hours, then the illegal parking phenomenon near the intersection is also frequent. Thus, that is why this location is the crash hotspot. The traffic lights are scarce at intersection of Zhongshan Road-Gongnong Road. Meanwhile, the intersection of Liuhong Road-Gongyuan Road is located nearby the hospital (it attracts a lot of motor vehicles and pedestrians). The above conditions increase the traffic crashes in the two intersections, which explains the reasons that the two intersections are crash hotspots. Apart from the abovementioned locations, the additional road intersections such as Liuhong Road-Luxiang Road, Huayuan Road-Lize Road, S227-Gaoxin Road, and Changan Road-Gaoxin Road should also be paid more attention in February and March. Then from April to December, the traffic crashes of all the above road intersections should be covered in the key management and prevention range.
In conclusion, Wujiang’s traffic crash hot spots are primarily distributed in the northeast region of the major urban area. This indicates that the traffic crashes occurred at this area are serious, and should be the key area of traffic safety management. In contrast, the traffic safety situation of the Southwest region of Wujiang is relatively good. This differentiated phenomenon should attract the attention of the traffic managers. The findings can be used to propose preventive strategies targeting the traffic crash of Wujiang. That is to say, the limited emergency response configuration resources (e.g., the professional traffic crash appraisers and traffic crash rescuers, deployment of traffic police stations, and the rescue vehicle scheduling, etc.) and the key road safety improvement measures (e.g., road intersection improvement, traffic safety education, traffic safety law enforcement, etc.) should be preferentially concentrated in the Northeast region of the major urban area of Wujiang.

6. Conclusions

This study presents a comprehensive traffic crash evolution characteristic analysis for identifying the traffic crash hot spots of Wujiang’s road intersections. The spatial autocorrelation analysis, time-space cube analysis, together with the emerging hot spot analysis based on ArcGIS 10.5 are integrated to analyze the spatiotemporal evolution trends of the traffic crashes, and on which basis, different types of crash hotspots are identified. The results determine the areas where different types of crash hotspots are concentrated (i.e., the road intersections of the Northeast region of the major urban area in Wujiang), and this phenomenon is in line with the actual situation of Wujiang [27]. Additionally, the evolution time for different types of crash hot spots are determined, among which the consecutive hot spots in January and February are weak, this trend is also proved by literature in Reference [22]. The reason may be that January and February coincide with the Chinese traditional festival of Spring Festival, and during this period, traffic law enforcement is stricter than ever, which effectively deterred the traffic violation phenomenon. In addition, during Spring Festival, most commuters may stay at home and reduce their travels by private cars. The two aspects can reduce the incidence of traffic crashes in some degree, then the crash hotspots also decrease.
In conclusion, the research finding points out the direction for Wujiang’s traffic crash prevention and management, and avoid the blindness of crash prevention, which makes a potential contribution to the sustainable development of Wujiang’s transport and urban economy. However, before the results are applied effectively, several efforts are still needed.
Due to the sensitivity and privacy of traffic crash data especially those major casualty accidents, the access to get the traffic crash data is difficult, that is why we only use one year’s crash sample in this study. Additionally, the case study is primarily a small-sized city of China, and the portability of the research methods in other cities is not evaluated. Hence, the authors would suggest addressing the above issues in the future.

Author Contributions

Z.C. conceived of the project and is the principal author. Z.Z. provided the research data. J.L. provided some useful suggestions in the writing process. All authors contributed to the final manuscript.

Funding

This research is supported by the National Natural Science Foundation of China (No. 51478110) and the Scientific Research Foundation of Graduate School of Southeast University (No. YBPY1886).

Acknowledgments

The authors would like to thank the editor and the anonymous reviewers for their constructive comments and valuable suggestions to improve the quality of the article.

Conflicts of Interest

The authors declare no conflicts of interest.

References

  1. Traffic Management Bureau, Ministry of Public Security. Annual Report of Road Traffic Crashes in People’s Republic of China; Traffic Management Bureau, Ministry of Public Security: Beijing, China, 2018.
  2. World Health Organization. Global Status Report on Road Safety 2015; WHO: Geneva, Switzerland, 2015. [Google Scholar]
  3. Wujiang Statistical Bureau. Statistical Bulletin on National Economic and Social Development in Wujiang; Wujiang Statistical Bureau: Wujiang, China, 2016.
  4. Scheiner, J.; Holz-Rau, C.A. Residential location approach to traffic safety: Two case studies from Germany. Accid. Anal. Prev. 2011, 43, 307–322. [Google Scholar] [CrossRef] [PubMed]
  5. Dezman, Z.; De Andrade, L.; Vissoci, J.R.; El-Gabri, D.; Johnson, A.; Hirshon, J.M. Hotspots and causes of motor vehicle crashes in Baltimore, Maryland: A geospatial analysis of five years of police crash and census data. Injury 2016, 47, 2450–2458. [Google Scholar] [CrossRef] [PubMed] [Green Version]
  6. Cai, Q.; Abdel-Aty, M.; Lee, J.; Eluru, N. Comparative analysis of zonal systems for macro-level crash modeling. J. Saf. Res. 2017, 61, 157–166. [Google Scholar] [CrossRef] [PubMed]
  7. Saha, D.; Alluri, P.; Gan, A.; Wu, W. Spatial analysis of macro-level bicycle crashes using the class of conditional autoregressive models. Accid. Anal. Prev. 2018, 118, 166–177. [Google Scholar] [CrossRef] [PubMed]
  8. Useche, S.; Montoro, L.; Alonso, F.; Oviedo-Trespalacios, O. Infrastructural and human factors affecting safety outcomes of cyclists. Sustainability 2018, 10, 299. [Google Scholar] [CrossRef]
  9. Shi, L.; Huseynova, N.; Yang, B.; Li, C.; Gao, L. A cask evaluation model to assess safety in Chinese rural roads. Sustainability 2018, 10, 3864. [Google Scholar] [CrossRef]
  10. Cioca, L.I.; Ivascu, L. Risk indicators and road accident analysis for the Period 2012–2016. Sustainability 2017, 9, 1530. [Google Scholar] [CrossRef]
  11. Steenberghen, T.; Dufays, T.; Thomas, I.; Flahaut, B. Intra-urban location and clustering of road accidents using GIS: A Belgian example. Int. J. Geogr. Inf. Sci. 2004, 18, 169–181. [Google Scholar] [CrossRef]
  12. Sandhu, H.A.S.; Singh, G.; Sisodia, M.S.; Chauhan, R. Identification of black spots on highway with kernel density estimation method. J. Indian Soc. Remote Sens. 2016, 44, 457–464. [Google Scholar] [CrossRef]
  13. Hashimoto, S.; Yoshiki, S.; Saeki, R.; Mimura, Y.; Ando, R.; Nanba, S. Development and application of traffic accident density estimation models using kernel density estimation. J. Traffic Transp. Eng. (Engl. Ed.) 2016, 3, 262–270. [Google Scholar] [CrossRef]
  14. Prasannakumar, V.; Vijith, H.; Charutha, R.; Geetha, N. Spatio-Temporal clustering of road accidents: GIS based analysis and assessment. Procedia-Soc. Behav. Sci. 2011, 21, 317–325. [Google Scholar] [CrossRef]
  15. Blazquez, C.A.; Celis, M.S. A spatial and temporal analysis of child pedestrian crashes in Santiago, Chile. Accid. Anal. Prev. 2013, 50, 304–311. [Google Scholar] [CrossRef] [PubMed]
  16. Erdogan, S.; Yilmaz, I.; Baybura, T.; Gullu, M. Geographical information systems aided traffic accident analysis system case study: City of Afyonkarahisar. Accid. Anal. Prev. 2008, 40, 174–181. [Google Scholar] [CrossRef] [PubMed]
  17. Dai, D.; Witlox, F. Identifying clusters and risk factors of injuries in pedestrian-vehicle crashes in a GIS environment. J. Transp. Geogr. 2012, 24, 206–214. [Google Scholar] [CrossRef]
  18. Huang, Y.; Wang, X.; Patton, D. Examining spatial relationships between crashes and the built environment: A geographically weighted regression approach. J. Transp. Geogr. 2018, 69, 221–233. [Google Scholar] [CrossRef]
  19. Traynor, T.L. Regional economic conditions and crash fatality rates-a cross-county analysis. J. Saf. Res. 2008, 39, 33–39. [Google Scholar] [CrossRef] [PubMed]
  20. Yu, H.; Liu, P.; Chen, J.; Wang, H. Comparative analysis of the spatial analysis methods for hotspot identification. Accid. Anal. Prev. 2014, 66, 80–88. [Google Scholar] [CrossRef] [PubMed]
  21. Fox, L.; Serre, M.L.; Lippmann, S.J.; Rodríguez, D.A.; Bangdiwala, S.I.; Gutiérrez, M.I.; Escobar, G.; Villaveces, A. Spatiotemporal approaches to analyzing pedestrian fatalities: The case of Cali, Colombia. Traffic Inj. Prev. 2015, 16, 571–577. [Google Scholar] [CrossRef]
  22. Youngok, K.; Nahye, C.; Serin, S. Spatiotemporal characteristics of elderly population’s traffic accidents in Seoul using space-time cube and space-time kernel density estimation. PLoS ONE 2018, 13, e0196845. [Google Scholar]
  23. Soltani, A.; Askari, S. Exploring spatial autocorrelation of traffic crashes based on severity. Inj. Int. J. Care Inj. 2017, 48, 637–647. [Google Scholar] [CrossRef]
  24. Li, L.; Zhu, L.; Sui, D.Z. A GIS-based Bayesian approach for analyzing spatial-temporal patterns of intra-city motor vehicle crashes. J. Transp. Geogr. 2007, 15, 274–285. [Google Scholar] [CrossRef]
  25. Fan, Y.; Zhu, X.; She, B.; Guo, W.; Guo, T. Network-constrained spatio-temporal clustering analysis of traffic collisions in Jianghan District of Wuhan, China. PLoS ONE 2018, 13, e0195093. [Google Scholar] [CrossRef] [PubMed]
  26. Coșciug, A.; Ciobanu, S.M.; Benedek, J. The safety of transnational imported second-hand cars: A case study on vehicle-to-vehicle crashes in Romania. Sustainability 2017, 9, 2380. [Google Scholar] [CrossRef]
  27. Wujiang District Urban Road Traffic Committee. Wujiang 2016 Urban Transport Development Annual Report; Wujiang District Urban Road Traffic Committee: Wujiang, China, 2016.
  28. Eris. ArcGIS Pro for Desktop 10.5. Available online: http://pro.arcgis.com (accessed on 6 December 2018).
  29. Mohamed, M.G.; Saunier, N.; Miranda-Moreno, L.F.; Ukkusuri, S.V. A clustering regression approach: A comprehensive injury severity analysis of pedestrian-vehicle crashes in New York, US and Montreal, Canada. Saf. Sci. 2013, 54, 27–37. [Google Scholar] [CrossRef]
  30. Scott, L.M.; Janikas, M.V. Handbook of Applied Spatial Analysis; Springer: Berlin/Heidelberg, Germany, 2010. [Google Scholar]
  31. Siddiqui, C.; Abdel-Aty, M.; Choi, K. Implications of pedestrian safety planning factors in areas with minority and low-Income populations. Int. J. Sustain. Transp. 2014, 8, 360–381. [Google Scholar] [CrossRef]
  32. Getis, A.; Ord, J.K. The analysis of spatial association by use of distance statistics. Geogr. Anal. 1992, 24, 189–206. [Google Scholar] [CrossRef]
  33. Songchitruksa, P.; Zeng, X. Getis-Ord spatial statistics to identify hot spots by using incident management data. Transp. Res. Rec. J. Transp. Res. Board 2010, 2165, 42–51. [Google Scholar] [CrossRef]
Figure 1. Road intersection crash distributions of the study area.
Sustainability 11 00160 g001
Figure 2. Crash distribution after spatial join.
Sustainability 11 00160 g002
Figure 3. Time-space cube structure.
Sustainability 11 00160 g003
Figure 4. Time-space cube visualization of traffic crashes.
Sustainability 11 00160 g004
Figure 5. Spatiotemporal identification of traffic crashes.
Sustainability 11 00160 g005
Figure 6. Global Moran’s I analysis result.
Sustainability 11 00160 g006
Figure 7. Local spatial cluster result.
Sustainability 11 00160 g007
Figure 8. Significance of traffic crash hot spots.
Sustainability 11 00160 g008
Figure 9. Change trends of traffic crash hot and cold spots.
Sustainability 11 00160 g009
Table 1. Correlation between the significant level, confidence, and z score.
Z ScoreConfidenceSignificant Level
<−1.65 or >1.6590%<0.10
<−1.96 or >1.9695%<0.05
<−2.58 or >2.5899%<0.01
Table 2. Classification categories of hotspot to or cold point values.
GI_BINZSCOREPVALUENOTE
−3<−2.5899%cold spot, 99% confidence level
−2−2.58–−1.9695%cold spot, 95% confidence level
−1−1.96–−1.6590%cold spot, 90% confidence level
0−1.65–1.65not significant hot or cold spot
11.65–1.9690%hot spot, 90% confidence level
21.96–2.5895%hot spot, 95% confidence level
3>2.5899%hot spot, 99% confidence level
Table 3. Spatiotemporal hot and cold spots classification.
PatternDescription
New hot (cold) spotFirst time to present warm (cold) color within the nearest time interval
Consecutive hot (cold) spotWarm (cold) color time interval (more than 90%) running continuously
Intensifying hot (cold) spotTime interval (at least 90%) presents warm (cold) color, and the trend is increasing over time
Persistent hot (cold) spotTime interval (at least 90%) presents warm (cold) color, and not present the increasing or decreasing trend
Diminishing hot (cold) spotTime interval (at least 90%) presents warm (cold) color, and the trend is decreasing over time
Sporadic hot (cold) spotOnly certain time intervals present warm (cold) color
Oscillating hot (cold) spotSome time intervals present warm (cold) color, and some present cold (warm) color
Historical hot (cold) spotTime interval (at least 90%) presents warm (cold) color, except for the nearest time interval

