Article

A Digital-Twin Evaluation of Net Zero Energy Building for Existing Buildings

by
Sakdirat Kaewunruen
1,*,
Panrawee Rungskunroch
1,2 and
Joshua Welsh
1,3
1
School of Engineering, University of Birmingham, Birmingham B15 2TT, UK
2
UC Berkeley Institute of Transportation Studies, 109 McLaughlin Hall, University of California Berkeley, Berkeley, CA 94720, USA
3
Engineering, Royal Air Force, Birmingham B2 4LS, UK
*
Author to whom correspondence should be addressed.
Sustainability 2019, 11(1), 159; https://doi.org/10.3390/su11010159
Submission received: 16 November 2018 / Revised: 18 December 2018 / Accepted: 27 December 2018 / Published: 29 December 2018
(This article belongs to the Section Sustainable Urban and Rural Development)

Abstract

:
With buildings around the world accounting for nearly one-third of global energy demand and the availability of fossil fuels constantly on the decline, there is a need to ensure that this energy demand is efficiently and effectively managed using renewable energy now more than ever. Most research and case studies have focused on energy efficiency of ‘new’ buildings. In this study, both technical and financial viability of Net Zero Energy Buildings (NZEB) for ‘existing’ buildings will be highlighted. A rigorous review of open literatures concerning seven principal areas that in themselves define the concept of NZEB building is carried out. In practice, a suitable option of the NZEB solutions is needed for the evaluation and improvement for a specific geographical area. The evaluation and improvement has been carried out using a novel hierarchy-flow chart coupled with a Building Information Model (BIM). This BIM or digital twin is then used to thoroughly visualize each option, promote collaboration among stakeholders, and accurately estimate associated costs and associated technical issues encountered with producing an NZEB in a pre-determined location. This paper also provides a future model for NZEB applications in existing buildings, which applies renewable technologies to the building by aiming to identify ultimate benefit of the building especially in terms of effectiveness and efficiency in energy consumption. It is revealed that the digital twin is proven to be feasible for all renewable technologies applied on the NZEB buildings. Based on the case study in the UK, it can be affirmed that the suitable NZEB solution for an existing building can achieve the 23 year return period.

1. Introduction

Net Zero Energy Building (NZEB) is a method taken towards producing buildings, which can meet their energy demand through green energy and will be a crucial element to securing a more sustainable future. However, NZEBs applications are always directed towards new buildings and it is not fully understood how both costs and technical issues of constructing an NZEB currently can possibly be associated with ageing or existing built environments; therefore, a full evaluation and visualization of a possible NZEB solution is needed for the existing buildings. The objective of this research is to define and visualize what the NZEB is and evaluate pertinent costs and technical issue of the solutions which fit NZEB definition and can be applied to existing buildings.
Several reports have mentioned the need for reduced demand for energy and other sources, i.e., fossil fuels. An EU report stated that 40% of total energy consumption occurred from buildings [1] that nearly equal to the US country, which the building was accounting for 41% of their energy consumption [2]. As a result, all building in both regions accounts for 1/3 of the world’s energy use [3].
The NZEB is a proposed type of building, which can meet their energy demand through the use of clean energy. However, the definition for the ‘use of clean energy’ is rather vague and its practicality causes confusion around the world. Due to the achievement to design the zero energy building has no specific strategies or guidelines [4,5,6], it was a starting point for some countries to integrate the NZEB goals into their building codes that can lead to reducing energy demand and fossil fuel around the world, which were almost launched along the concept of using renewable technologies [5,6].
The need to combat the extensive energy use in buildings has been identified by the European Union (EU) who have released targets for its member’s states regarding NZEB goals. The EU’s plans were to have all newly constructed buildings produce as much energy as they consume on-site no later than 31 December 2018.; however, this was updated with the release of the Energy Performance of Buildings Directive [7]. Not only was the target year pushed back, but also the buildings energy goals, with the new targets stating that ‘all new public buildings must be nearly zero-energy by 2018, with nearly zero-energy having a different definition to net-zero-energy, and all new buildings to be nearly zero-energy by the end of 2020’ [1]. It is important to note that most applications of NZEB and EU directive have been emphasized on only new buildings. Since the majority of buildings are already built, there is a necessity to explore the energy efficiency options for existing infrastructures. The emphasis of this study has thus been placed on the facilitation of NZEB on existing built environments via the use of digitalization such as Building Information Modelling (BIM).
The definition of a NZEB from EU can be found from various sources. However, the EU Directive specifies that NZEB is a building where, as a result of the very high level of energy efficiency of the building, the overall annual primary energy consumption is equal to or less than the energy production from renewable energy sources on site [8,9] And, there are seven keys areas to define an NZEB consisting of the energy demand of a building, a time frame of the balance, representing the balance, grid connection, on-site vs off-site energy production, energy conversion factors and finally, energy production types.
The aim of NZEBs is at reducing the amount of energy used from fossil fuels. It seems pointless to not first minimise the amount of energy being demanded when there is such great potential to do [7,10,11,12]. The first stage of NZEB is enhancing the energy savings of a building [11,12,13]. This is a common opinion in the topic area with the defining NZEB as a building with greatly reduced operational energy needs [14]. And, some authors stating it is a ‘flaw’ of the NZEB definitions which do not ensure that buildings are optimized for reduced consumption of resources [15].
With respect to reduce site energy use, the buildings should employ techniques in the design of the building such as: Daylighting, insulation, passive solar heating and natural ventilation to name a few [14]. Also, it has been highlighted that energy efficiency measures such as high-performance windows, compact fluorescent lights, air conditioner with a water-cooled condenser and a highly-insulated roof have a combined payback time of just under 15 years [13]. However, it is only analysing the payback times by using energy efficiency technologies, which cannot be considered such as thermal mass walls, which incur a 633-year payback time [13]. The energy reduction; nonetheless; can differ depends on the areas. One of research from Romania mentioned about the affordable and sustainable solutions, which have been explored the energy reduction of a new built NZEB at 90% [16] where the energy reduction was found at 35–50% in the building in the Middle East and North Africa [17]. In the fact that, there showed different standards for energy efficiency on each area; for example, the minimum requirements for wall insulation is 0.8 W/m2 K in Portugal [18] compared to 0.35 W/m2 K in England and Wales [19]. Therefore, it becomes difficulties in trying to measure the total percentage of reductions possible by applying a blanket figure to all countries.
The timeframe is a criterion to decide the building meet the Net Zero Energy or not. There are various aspects of the timeframe that it commonly being on an annual basis [9,13,14]. While the standard timescales have been agreed at being annual, the building may not achieve a net zero energy position in actual operations every year [7] therefore, other time frames of the building must be considered and defined in the suitable range.

1.1. Defining the Balance

Defining the balance is the most crucial part of establishing an NZEB, it is determining what energy should be accounted for essentially as the outflow and gives a way of knowing how to calculate the energy required to flow in through ‘green sources’ to balance this.
There are four definitions of Net Zero Energy as follows: Net Zero Site Energy, Net Source Energy, Net Zero Energy Costs and Net Zero Energy Emissions [20]. These brief definitions are:
  • Net Zero Site Energy: A site ZEB produces at least as much energy as it uses in a year when accounted for at the site.
  • Net Zero Source Energy: A source ZEB produces at least as much energy as it uses in a year when accounted for at the source. Source energy refers to the primary power used to generate and deliver the energy to the site. To calculate a building’s total source energy, imported and the appropriate site-to-source conversion multiply exported energy.
  • Net Zero Energy Costs: In a cost ZEB, the amount of money the utility pays the building owner for the energy the building exports to the grid is at least equal to the amount the owner spends the efficiency for the energy services and energy used over the year.
  • Net Zero Energy Emissions: A net-zero emissions building produces at least as much emissions-free renewable energy as it uses from emissions-producing energy sources.
There will result in very different sized systems for green energy production. They each have their pros and cons; however, these definitions have been gone on to be used in a future paper such as Re(De)fining Net Zero Energy stated that there is no single best accounting method. Therefore, the definition of NZEB should be aligned with the owner’s goals for the project [14].
The Energy Performance of Building Directive (EPBD), which is one of EU directive about the energy utilisation, stated for calculating the energy performance of a building. The energy should be taken into account is energy that is consumed in order to meet the different needs associated with its typical use and shall reflect the heating energy needs and cooling energy needs (energy needed to avoid overheating) to maintain the envisaged temperature conditions of the building, and domestic hot water needs [1]. This quotation has no mention of energy used through the outlet in the house for appliance use. It is a stance which is argued that user related energy becomes an important part of the total energy of the building [9].
The net energy need is made up of the previously mentioned variable for heating and cooling from the EPBD along with the user related energies introduced. These collectively would better be referred to the operational energies. Some research stated that there was no adverse energy or environmental impacts associated with its operation, the use of this term ‘operation’ and the fact that a building will almost certainly use lighting and appliances during its operation, indicates the necessity to include them [7].
There is also one final part of a building that demands energy, and its inclusion in the balance is also disputed, this is the inclusion of the embodied energy of the building and energy for construction. The importance of including represented energy increases the introduction of energy efficient materials occurs, which ironically often require intensive energy inputs for their manufacture [21]. It is remembered that the end goal of defining NZEB is to have a sustainable building practice, accounting for this energy seems more crucial. It was also previously mentioned in Re(De)fining Net Zero Energy: Renewable energy balance in environmental building design, which was not initially reducing the energy demand of a building is a flaw. Moreover, it was also stated the other common fault as NZE definitions only deal with operating energy quantities and related emissions [15]. It can be justified when the values for these embodied energies of buildings are assessed.
There is a different value given for the amount of embodied energy in a building per square metre (m2) with the lowest being 3.6 GJ/m2 all the way to 6.6 GJ/m2 [22]. However, using these two values along with three other intermediates of 3.9–5.6 [23], 4.3–5.3 [24] and 5.0 [25] gives an average value for all five of 5.22 GJ/m2, which provided a range with the maximum of that range. Combining this figure with the amount of 90 m2 [26] for the average floor space of a house in England and Wales gives an average embodied energy of 469.8 GJ/m2. This figure was compared to the 14.184 GJ that represented the average yearly consumption of UK households in 2014 [27,28]. It can be observed that this was over 30 times greater, and the construction of houses required a much higher energy consumption than its operation. This value, nevertheless, may have some discrepancies in it since the data used to determine the average embodied energy was over 17 years old and advancements inefficiencies were likely to have reduced this value.
Moreover, it was due to such a high figure that was believed as the embodied energy should be included in the NZEB balance. Thus, it could be adequately accounted. It is even more crucial to include embodied energies when it was acknowledged that Net Zero Energy Housing (NZEH) contained more embodied energy in comparison to a basic house, this could be expected when the increased efficiency materials and renewable energy technologies were taken into consideration as they all required extra manufacturing [29].
However, the vast amount of the embodied energy accounts for as already pointed out. It must still be questioned whether it should be included in the Net Zero Energy Definition. Also, the embodied energy has already been decided for the most appropriate timeframe to yearly turnaround. Moreover, the concept of Life Cycle—Zero Energy Balance (LC-ZEB) is introduced with the aimed at fit the embodied energy with annual balance; where, the primary energy used in the building (building operation, constituent materials and systems) was equal to or less than the produced energy from the renewable energy systems within the building over its lifetime [30], this concept takes NZEB reaching a higher goal of accounting for all power and generates more sustainable building.
It can be seen that many experts believe embodied energy should be included within the NZEB model. However, this was a goal and, its inclusion now might make it more difficult to annually balance the energy used for the operation of the building. Therefore, the energy demand of an NZEB should be concluded to be all energy required from the grid for; heating, cooling, ventilation, hot water, lighting and appliance use, plus any energies associated with transmission.

1.2. Grid Connection

With respect to the method to find net-zero energy building NZEB, grid electricity is described by the term delivered energy [31], this implies that a grid connection is needed as grid electricity will be utilised at times when there is not enough on-site energy production. This grid connection is also needed as electricity is sold back to the grid [32] and is key to paying for many of the expensive technologies required of an NZEB. Some options of NZEB also only use electricity from the grid to supplement on-site renewable energy [33] hence making this grid connection a crucial part of the balance.
The need for a grid connection can also be seen further when the implications of being off-grid, or autonomous as it is often referred to, are assessed. As previously mentioned with no grid connection there is no way for the excess energy an NZEB should be producing to be exported; there is also no way for them to draw power from the grid when their production drops. It would mean on-site energy storage would become necessary to maintain the zero-energy status of the building [14], with another study also confirming this, stating autonomous houses need to use some energy storage system. They point out that this would incur an additional input of energy when their production processes are considered [30] along with greater costs and still would not always guarantee power to the buildings. In a best effort to ensure there is always the production of energy if technologies dependent on the fail, energy production, which utilises the on-site burning of fuel can be considered. However, it must be ensured that this backup energy is supplied from renewable resources such as wood pellets or biodiesel [7], also pointing out that despite being the better option there are concerns about how large-scale applications of NZEB’s will affect grid stability.

1.3. The Comparison between on-Site and off-Site Energy Production

Many of the papers talk about using a mix by taking energy from the grid to supplement what the buildings cannot produce onsite [28]. Despite the ability to still be an NZEB if energy is taken from the grid, there is still a hierarchy. The developed hierarchy can be seen in Table 1.
This hierarchy states that the option number 1 available to a building in regards to its energy production is to use renewable technologies solely on the building’s footprint, this is due to the fact that only area for on-site energy production that a building has guarantee as its own over its lifetime is within its footprint [20]. Moreover, the hierarchy was also used to find the best option for NZEB with different purposes such as NZEB: A (generate and use energy through a combination of energy efficiency) and NZEB: D (purchasing off-site RE), which identify each definition in Appendix A.

1.4. Energy Conversion Factors

Energy conversion factors, or source-to-site ratios as they are referred to, are a part of the NZEB, which only come into play once the building, is connected to the grid and energy starts being imported and exported. It is since values of fossil fuels at the source of production are different to that at the site of use with one unit of exported electricity required for every 3.37 units of site gas use [20]. These conversion factors are also included in a formula for calculating the ‘primary energy’ of a building [31] and used as a multiplication factor for calculating both energy in and energy out [34,35].
However, it must be noted that this use of the term primary energy does not refer to the energy that’s harvested directly from natural resources [36] which is the commonly accepted definition, but rather the net energy delivered minus exported energy [26]. This difference may cause some confusion when trying to define NZEB.
The value of 3.37 is not one which translates to all parts of the world; for example, the costs of 2.5 are observed in Denmark [30]. This is because the differentiation of electricity prices in the various part of the world, along with the influence of different import and export prices of fossil fuels and the abundance of power plants to produce this electricity. It is an indication that different countries and perhaps even different regions of these countries would have to determine their own factors to be used in the NZEB definition. In the US, for example, the ratio of source-to-site was provided across the area [31].

1.5. Energy Production Methods

Energy production methods are the final area of NZEB’s required to be defined; however, it could be considered the most important as if done incorrectly could result in the net zero goal being missed. In the hierarchy, in Table 1 there are different examples of energy production methods given, with on-site favouring photovoltaic (PV), solar thermal and some wind [20,37,38].
It is safe to assume the wind mentioned would not be on the scale of the 328-foot industrial turbines available [39]. In comparison, the off-site options would be Biomass, wood pellets, ethanol, biodiesel, large-scale—wind, PV or hydroelectricity [20] with the fuel type energies being imported to the site for combustion at the point of demand. Whilst some research class introduced fuels as an off-site option [20], another study class energy production method based on the location of production hence making the use of renewable fuels with Combined Heat and Power (CHP) unit an on-site [38]. This disagreement could cause some discrepancy when ranking NZEB’s using the hierarchy as the building could fall into either tier 1 or 3.
With on-site being favoured as the most preferred option it is best to explore what the options available are. Some study mentioned that the only energy carrier that is relatively easy to export is electricity, and the mainstream microgeneration technology is PV panels [40], unfortunately using just a PV system solely for all power in the house requires a system so large that it results in a payback time of around 82.8 years [32]. However, it could be related to the relatively low cost of electricity in Quebec, which was the location of their case study, resulting in a smaller financial return. Moreover, the use of more than one technology is widely agreed using both PV and solar thermal in their case study [13] and Wang et al. agreeing giving solar photovoltaics, solar thermal or wind turbines as examples of the renewable energy technologies available, but do not mention the scale of the wind turbines. Also, the solar domestic hot water systems are widely considered to be one of the most promising systems in the delivery of zero energy homes [4].
All experts seem to suggest PV as the most suitable option for on-site production, due to its minimal maintenance costs and its only requirement being one thing, sunlight. It could be an indicator of why it is the most commonly used on-site renewable technology along with solar thermal [37]. Moreover, the cost-optimal on-site renewable system is a PV installation in combination with a ground source heat pump [37] however this is for a case study specific to Denmark, therefore might not translate to other parts of the world for cost efficiency. Despite this possibility, a geothermal ground source heat pump was also used in a case study in Romania where it was stated that only solar and geothermal energies can be considered as available on-site renewable energy sources [16]. Therefore, ruling out any on-site wind power, but expanding the possibility of geothermal in other areas. The reason wind is often discounted as a possible technology, along with the why many other systems are often over/undersized, has been hypothesised as being due to the fact that ‘simulations are performed by ‘rewinding’ the typical weather file at the end of each year’ [33]. The use of this historical data is not accurate to current days weather climates and results in a design which is neither desirable or acceptable [33]. In this paper, the application of digital twin has been highlighted in order to improve corporation and visualization of NZEBs solutions for existing buildings. The aim of this study is to help decision makers who are often be the owners or residences of existing building improve the awareness of potential benefits that could counterbalance the potential cost.

2. Methods

To evaluate the NZEBs for existing buildings, there are four main methodologies consisted of the Hierarchical flow chart, Building Information Model (BIM), the Thermal property of the building model and Energy and cost analysis model as follows;

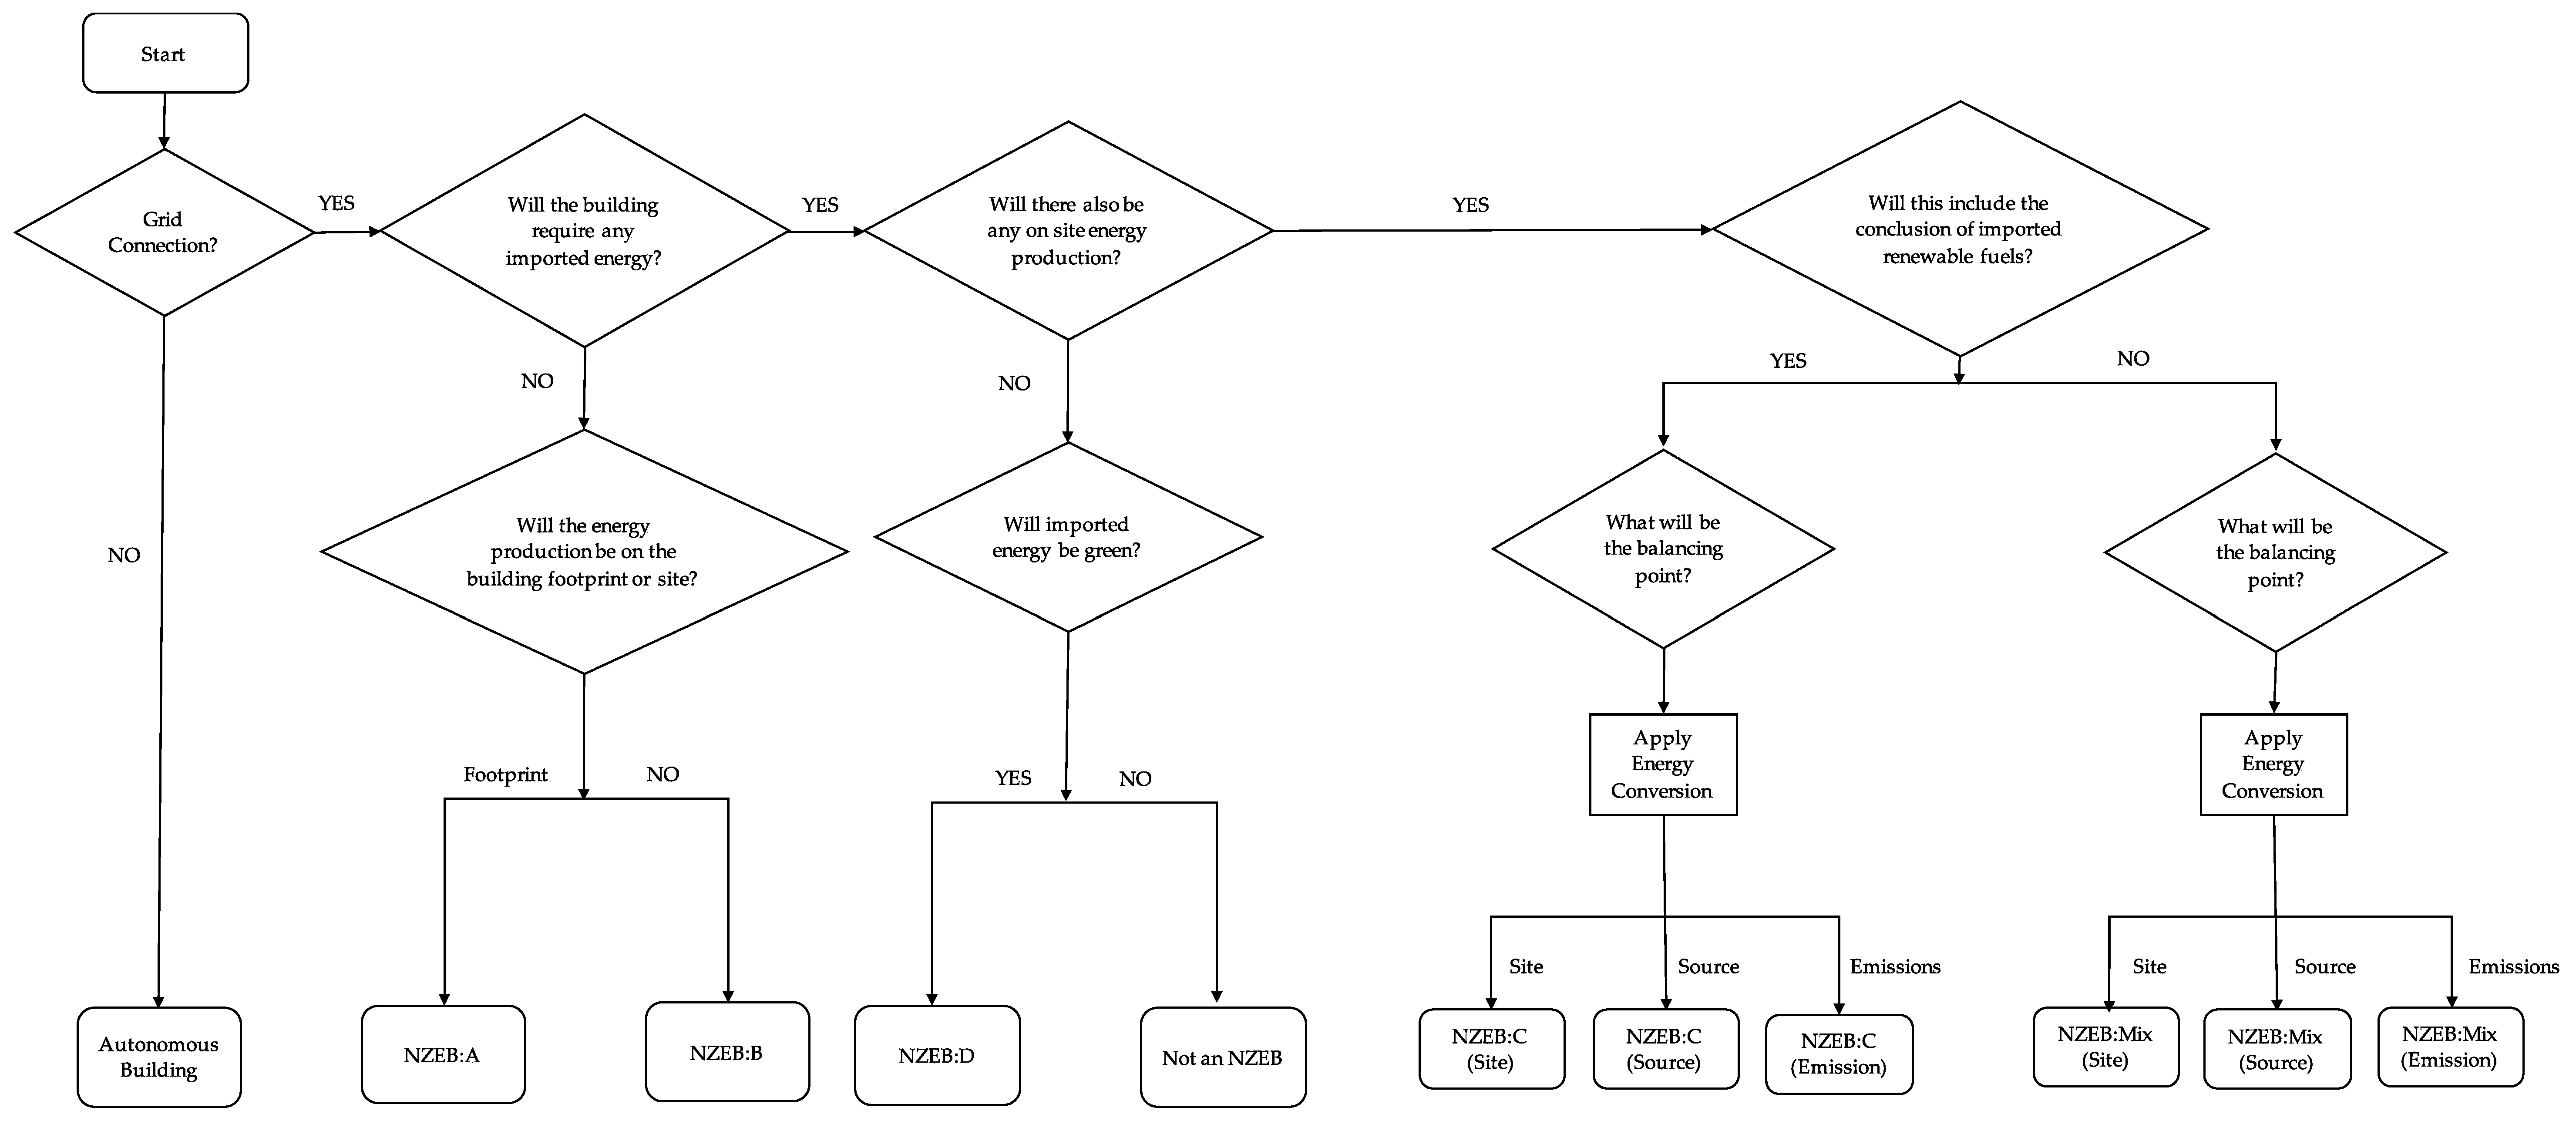
2.1. Hierarchical Flow Chart

In order to design the hierarchical flow chart all the possible definitions of an NZEB from the literature review had to be compiled into a list and ranked in Appendix A. The ranking system was made using Torcellini et al.’s table [20], which ranked energy production methods along with the explanations also were discussed in the ‘Defining the balance’ section of this paper [20]. Some choices in the ranking system were relatively easy to make, with the NZEB: A being the prime choice as no energy is imported to the building throughout the year and the energy technologies used will always be available to the building through its lifetime. The NZEB: B was a close second with the only difference to the option before it is that the renewable energy sources are placed on the building site, an area which may not always be available to the property.
All definitions including the source balance were then deemed to be the next best option as they account for energy lost through transmission; however, these definitions require an appropriate ‘site-to-source’ conversion factor which often varies depending on the location of the building and the energy type used. The subcategory ‘emissions’ came. Next, this was not deemed to be as good as any other definitions before it due to its lack of accounting for transmission losses, however still provides a green end goal. The NZEB: D then followed, with this being described as a building which meets its energy demand from 100% imports from renewable sources. Whilst this definition still provides a green balance and does not use energy from fossil fuels, and therefore may actually provide a more environmentally friendly solution than the options preceding it as well as counts as an NZEB (Emissions), there is no on-site energy production which is one of the critical elements of an NZEB so, therefore, less desirable. The subcategory site was then inserted, this is another definition which doesn’t include the energy for transmission and unlike NZEB emissions doesn’t offer a full balance for something instead. Finally, an autonomous NZEB finished the ranking, with this being a building not connected to the energy grid at all. Likewise, the NZEB: D may also offer a better option environmentally than many of the others, primarily due to its complete lack of imported energy and total reliance on renewable energy; however, due to associated intermittency issues with renewable energy the building may experience periods with no energy at all. It may still occur even once energy storage is considered, and is an unacceptable possibility which must be avoided at all costs.
With respect to the definition of source, emissions and site, they were also broken down into the NZEB: C and the NZEB: mix, with the mix being an option not previously mentioned. A ‘Mix’ is a building which only differs from a NZEB: C due to the inclusion of on-site combustion of renewable fuels. It consequently makes it a less desirable option than NZEB: C due to its reliance on regular deliveries of these fuels.
These definitions were then incorporated into a flow chart to allow for users to define their own buildings that can be found in Appendix B. It must be noted that a buildings definition is not constant and could be subject to change, this comes down to the unpredictability of some renewable technologies. For example, the weather conditions for one year may allow a building to generate enough electricity through solar PV cells situated on its roof, thus making it a NZEB: A; however, the next year there may be times when energy imports are required thus making it one of the NZEB: C or Mix definitions.
There are some of the critical aspects of an NZEB definition, which were discussed earlier on in the paper but were not included or fully explained in the flowchart. These are; the time scale of the balance, the energy conversion factors and the reduced energy demand, and are parts that either apply to all definitions or a single answer cannot be given. In the case of the time frame a yearly balance was decided and refers to the balancing options for all definitions, the reduced energy demand is something which precedes any description but is still crucial, and like the time frame is something which should be indicated. It is one way in which the flowchart could be improved. The energy conversion factors are a slightly different scenario due to the complexity of their calculation and the variance for different countries [38]. Before this flowchart can start to be used here in the UK, these factors must be calculated for the country and its different regions and then added to the future improvement of the flowchart. It is not until these improvements have been made that explicit processing for defining NZEB’s will be established.

2.2. Building Information Model (BIM)
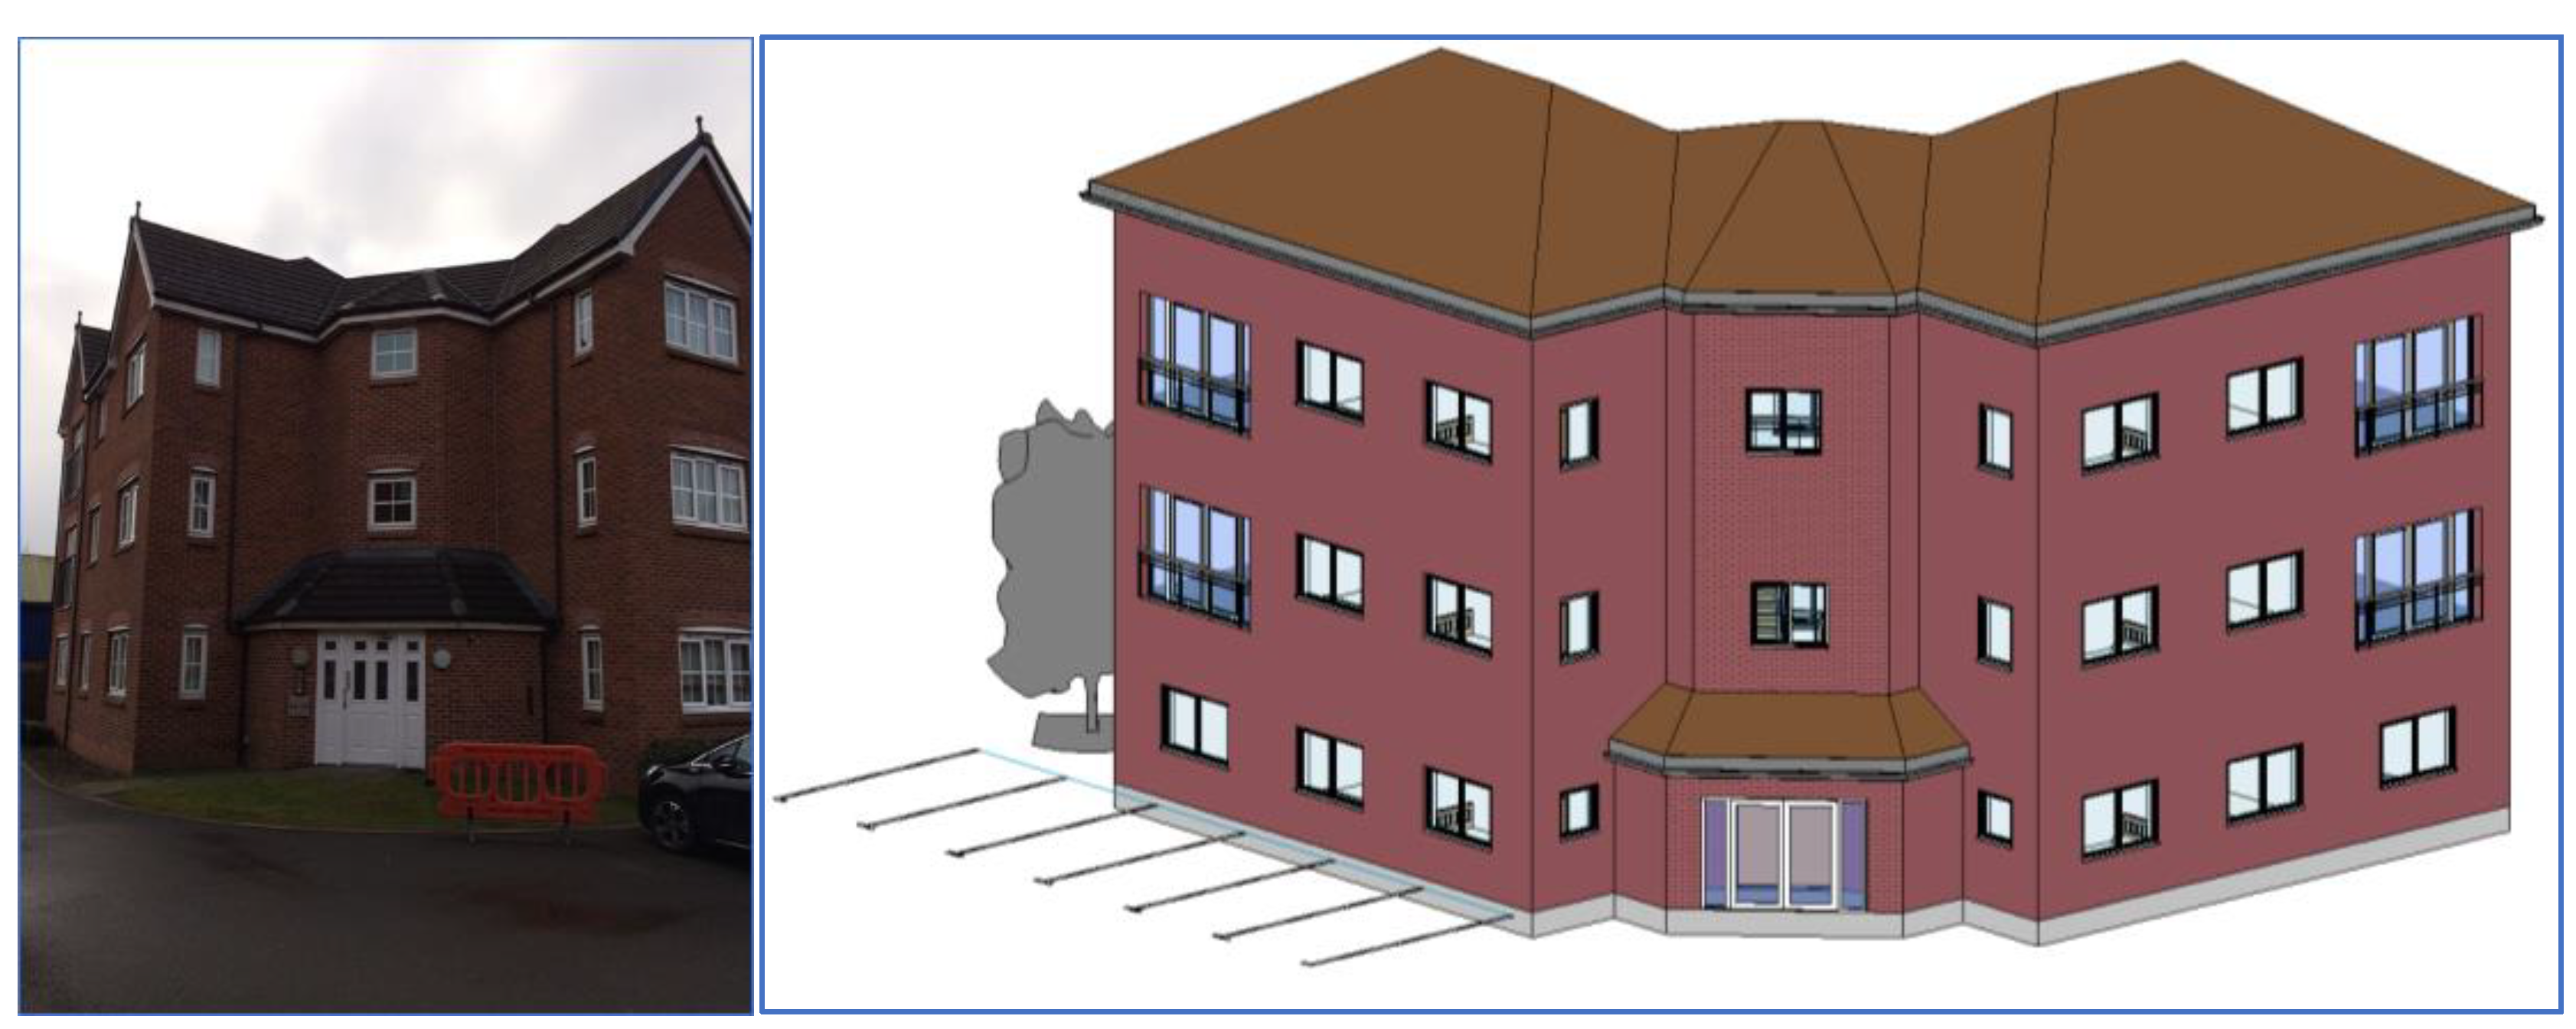
Choice of Building

To properly evaluate NZEB applications for existing buildings a model needed to be created, it was decided that this model should reflect the predictions of where people will be living in the future as this will directly affect the type of buildings being constructed. In the fact that, the percentage of the world population living in urban areas will increase from 54% to 66% translating to an extra 8.6 million people needing somewhere to live [41]. This increase in urban population since 1960 can also be seen in Figure 1. As these metropolitan areas have high population densities, there will also need to be an increase in more multi-family homes to accommodate the population increase in the limited area available; hence, this was the building chosen for the BIM. An existing building was selected to base the model on, the property Hendeley Court in Burton upon Trent was decided due to previous knowledge of the building and its occupants.
The BIM model has been created using the software Revit, which is available as part of the Autodesk package. It allows the user to create buildings using a library of building materials and pre-created constructs. Both the final model and the building used as a base for the design can be found in Appendix C.

2.3. Thermal Property of the Building Model

Once the model had been created thermal values and, it had to be assigned to the different components of the building. It was decided that there should be two data sets, one for a standard house and another one for reducing energy demand, this is owing to its importance in the NZEB process. Whilst Revit does assign its base values. It was seen that they did not match up to the values, which a standard house should have. The components which were altered included; walls, roof and windows, this was due to their sheer size and heavy influence they have on the building envelope, a full breakdown of the data sets can be found in Appendix D.
Various problems were encountered with the windows owing to the values for thermal resistances that Revit offered for ‘analytical construction’ of windows and doors did not match up to the ones decided beforehand. The new analytical constructions had to be created and added to the constructions file in the Revit Program file to overcome. The existing ‘Double Glazing—domestic’ was used as a base for the new construction to give values for Solar Heat Gain Coefficients; however, the U-value was altered.
Some of the mentioned improvements do not only apply to future constructions, and there are some such as improved plasterboard and plaster which can be made to an existing building. However, this would come as an inconvenience to any inhabitants and would not be a simple job. Insulation in the roof may be readily altered along with again the plasterboard and plaster on the ceiling of the top floor, and all windows and doors, whilst costly and again, inconvenient, could be replaced on an existing building. For the modelling, it will be considered to be completely new construction, which would have a severe structural impact, can also be included by changing bricks, concrete blocks and insulation for the walls and roof tiles and trusses.

2.4. Energy and Cost Analysis of Model

Once the models had been created with the correct thermal values, it was then possible to perform energy analysis. This study applied the house model through the Revit Software, and the results of both the buildings were studied side by side using Insight, the software also available through the Autodesk package. The Insight software gives a value for the yearly running costs of the building, in the unit GBP/m2/year, and Energy Use Intensity (EUI) in the unit kWh/m2/year. The values of EUI were 142 for the standard house and 133 for the improved thermal efficiency house as can be found in Table 2. These results conclude that the changes made to the thermal properties improved the efficiency of the building and resulted in a 6.76% reduction in energy demand. However, these results are nowhere near in the region of savings energy needed. Once the floor area was calculated and taken into consideration, this 6.76% saving translated to 5420.79 kWh and still left a demand of energy 80,107.23 kWh/year.
Architecture 2030, which is a non-profit organisation, is a set of targets with the aim of increasing the NZEB presence globally by the year 2030. It used the EUI metric to measure the success of newly constructed buildings at reaching these goals, Insight used these guidelines and indicated that the EUI for this building should be around 60 kWh/m2/year. However, upon inspection of the ‘2030 Challenge Targets: US National Medians’ document, which provides values of the recommended EUI’s for different buildings depending on their use, the building with the lowest EUI value is a ‘Non-refrigerated Warehouse’ at 28 kBtu/Sq.Ft/Year [43]. This 28 kBtu/Sq.Ft is equal to 88 kWh/m2 and is greater than the recommended value from Insight and causes some uncertainty of what the EUI should be for the BIM created. There is also more uncertainty caused when the EUI for ‘Lodging’ is assessed, the building with an intended purpose closest to the BIM, and is seen to be 514 kWh/m2, a value over eight times greater than the Insight. However, the document being six years old and for US buildings it’s more likely that the value of 60 kWh/m2/year is correct. Therefore, this was taken as the target EUI.
The using of the Insight software was possible to reduce the EUI of the building to 124 kWh/m2/year. It was done through minimalising infiltration, improving lighting efficiency and the addition of daylighting and occupancy controls. It was decided that this would be the lowest the EUI could go through improving the efficiency of the building components. This study took the average electrical cost based on the UK price at 0.13 £/kWh [44,45,46] and, the reduced cost of both improve thermal efficiency and Insight software methods were compared with the standard method as shown in Table 3.

3. Results

3.1. The Results of Energy and Cost Analysing Model

With respect to the energy and cost analysis model in Section 2.4, the Revit software also makes it possible to calculate a total cost for the building, once certain parameters have been defined. Estimations for the price of different components of the standard BIM have been found to be £80/m2 for the cavity walls including both labour and materials [47], £99.24/m2 for the roof again for both labour and materials [48] and a variety of prices for the windows. These values were calculated using Southern PVC Systems Limited’s online price calculator based on the amount in 2012. These variables had been input Revit software then gave total costs for the walls, roof and windows were £72,964.24, £25,463.69 and £12,718.00 respectively, providing a total cost of £111,145.93. However, there are obviously many other costs involved with estimating the price of the building in question, such as; purchase of land, groundwork, plumbing, electrics, flooring, wall finishes and furnishing to name a few, and estimating these through Revit proves difficult. Therefore, other alternatives must be found and checked they are higher than the value calculated by Revit.
Different estimating calculators were used and the results compared, the first was on the ‘Build It’ website. The price of £446,086.09 was determined once the number of floors and floor area was input. A secondary calculator was used and yielded a much lower price of £102,000 [49], which is less than the calculation from the Revit software. Due to this lack of conformity between the two prices a third estimation was needed, and this came from the average value for a ‘Private developments 3rd to 5th floor flats’. As given by Costmodelling.com, they stated that at £2180/m2 this building should cost £437,678.60, which matched the value of Build It, a round figure of £440,000 will be used from here on for simplicity as the differences are negligible.
This price for the standard building can also be used to estimate the cost of the more eco-efficient improved building, with a level 4 green improvement costing 6.5% more than a conventional building [50]. This means the improved building will cost an estimated £468,600. However, it was also highlighted that this came with financial benefits of between $50 and $70 per square foot, which roughly converts to £390–£540/m2, showing potential financial return for the initial investment.
Base on the differentiation of building price among the four models, Figure 2 and Figure 3 represent the comparison of the net present value (NPV) in different discount rate by using the improve thermal efficiency rate and improve thermal efficiency housing rate respectively. The present value (PV) is calculated at 30 years and, the electrical rate is applied at £0.13/kWh. By comparing with the standard house building, the Improve thermal efficiency model able to reduce electrical cost around £700/year whereas, it took approximately £1400/year on the Insight software model. However, both models pointed out that there remained more energy that needed to be reduced from the building, which will be discussed in the next section.

3.2. Renewable Technologies with NZEB

To assess what role these NZEB’s play in the future, the costs of the building must be calculated for the addition of renewable energy technologies to meet the balancing conditions. The cost analysis must be deeply considered regarding the feasibility of these technologies could be implemented for the future building.

3.2.1. Photovoltaic Panels

As previously mention photovoltaic is the most commonly used on-site renewable technology [37] and was commonly agreed on being crucial for NZEBs. Therefore, it will be the first method considered. The insight software also allows the simulation of solar panels using the actual location and orientation of the building once parameters such as; roof percentage covered, panel efficiency and payback limit have been selected. It was found that once 90% of the roof had been covered with panels of a 20.4% efficiency and 30-year payback limit, then the EUI of the building would be further reduced to 97.2 kWh/m2/year.
Using software such as this provides a more accurate figure of how much electricity could be produced, as initial calculations using information from the Eco Experts suggested a 24 kW system would be needed to install within the building. They also proposed it would take up 172.2 m2 of the 247 m2 available on the roof would have a typical annual output of 20,400 kWh [51], comparing this to the insight value, the system will output 5099.56 kWh/year over 75% less than initially predicted, this is a huge discrepancy. It must be acknowledged that the coverage of 90% of the roof compared to the energy created does seem excessive. It is known that the amount of electrical energy, which will be obtained from PV systems is directly proportional to the intensity of the sunlight which falls on the panel [52]. Therefore, once panels start to be installed on an area of the roof receiving minimal solar radiance, usually the north facing area, the electricity produced is not of a substantial enough quantity to justify the panels installation. Unfortunately, there are not enough variables of ‘percentage of a roof covered’ on Insight to properly find this point and optimise for the best energy produced to cost ratio, with the lowest option being 60%. Despite resulting in a higher EUI this 60% coverage will have the best ratio of all options available and will be the best to use later on when evaluating the cost of the NZEB model. The EUI then became 106 kWh/m2/year, which Autodesk defines as being A measure of the annual electricity usage per floor area [53] meaning the area should be multiplied by 3 to account for the 3 storeys; therefore, leaving 63,844.86 kWh/year to be met by renewable energy technologies as much as possible.

3.2.2. Wind Power

Being an island country the UK has a great potential for utilising wind energy, compared to other countries the capacity factor of wind power in the UK is around 30% higher than the annual average capacity factor [54], raising the question why are there not more home wind power systems currently installed? It could be due to the fact that comparatively for the purchase of a similar sized system, wind costs twice as much as solar PV, an output of around 3400 kWh would cost you £6000–£8000 for PV [51] but £14,000 for a home wind turbine. However, in cases such as this, once as much on-building solar PV has been exhausted wind turbines may be the next option to explore due to the demand for less ground space. Although some noise concern exists, the new development of turbine blades to reduce noise impacts has significantly advanced in recent years.
The energy saving trust highlights the importance of having a Microgeneration Certification Scheme certified wind turbine so as to allow the user to be eligible for payments through the Feed-in Tariff [55], by doing this it is possible to look at a list of all possible turbines and their operating capacities at certain wind speeds. Using database from the national wind speed, it can be established that the average wind speed for the site in question is 4.5 m/s at 10 m, 5.3 m/s at 11.9 m and 5.9 m/s at 13.2 m [56], from this the most suitable turbine can be decided.
A wind turbine, which would be able to provide the remaining 63,844.86 kWh, is the Evoco 10, with a rated power of 9.55 kW. The referenced output at 5 m/s is 21,706 kWh [55]; therefore, would require three turbines. However, the given diameter of this was 7.2 m and would need a suitable clearance from the building, this proves to be a problem once a site plan of the building is inspected due to a limited area currently available. Moreover, this was something that would be addressed when planning the layout of an area for future constructions. This turbine also incurred quite a considerable cost with the Renewable Guide listing the price of this technology at £41,850 [28], however, it gained a 20-year profit of £47,822.77 and a payback of 12 years.

3.2.3. Biomass

Biomass is an option which could be utilised, and more particularly a Biomass CHP system. It is believed that indigenous biomass resources and energy crops could service up to 44% of UK energy demand by 2050 without impacting food systems [57,58,59,60,61], giving this option high potential in helping to meet the NZEB goals.
HWEnergy, which is UK Biomass heating company, provide biomass solutions to a number of different non-domestic customers such as farms, factories and schools. They also work with hotels, which are similar in demands and load patterns to the BIM, with higher demands in the mornings and evenings for cooking lighting and heating when occupants are not at work. HWEnergy lists a number of biomass CHP systems available, and upon inspection, there were several suitable options. The remaining 63,844.86 kWh/year could also be considered as a 174.96 kWh/day demand, 3 CHP systems had a total output per day which could meet this. The electrical output of these 3 systems varies from 9 kW–49 kW, therefore to meet the demand through only using the electrical energy produced would require 1302.9–7094.1 operating hours a year, or approximately 3–19 h a day [62,63,64].
Despite having no way of breaking down this daily demand into thermal and electrical demand, it is safe to assume that it will not be 100% electrical demand and there will be some thermal output required [65,66,67,68,69]. Therefore, the operating hours a day would consequently reduce once thermal energy is harnessed, as the thermal output is up to 8 times as much as the electrical for the same fuel.

4. Discussion

Further analysis simulated the possible energy production that could be harnessed from the utilisation of solar PV technology covering 60% of the roof space and, the associated costs came with this. It was determined that the addition of a further three, 9.55 kW wind turbines would be needed in the NZEB building to meet the energy demand. Calculating the costs of these technologies based on current market prices, which estimated around £610,518.42 for the NZEB building, combined with the additional costs associated with improving the efficiency of the house yielded a 23-year payback period as shown in Figure 4, concluding that the cost of making an NZEB is feasible and affordable. Homes biomass systems were also identified as a solution capable of meeting demands. However, the biomass system associated with high prices caused by it cannot currently contribute to the NZEB goal.
For more NZEBs to be built and become operational firstly a clear set of definitions, such as the one(s) in this paper need to be accepted and the associated site to source factors calculated, this then needs to be rolled out worldwide and implemented into the building codes. Each country may be able to harness different technologies to the one mentioned in this paper based on better-suited climates; therefore, the most cost-efficient solutions should be decided depending on each country.
To further encourage the NZEB goals, government grants for solar PV should be reintroduced. Some evidence showed that the number of new solar PV installations had fallen by three quarters since The Government cut to subsidies [61], this was due to the high initial costs of the systems even despite the achievable payback period, the reintroduction of grants would give NZEB houses more chance of taking off and becoming commonplace. It is also often found that with increasing use of technology there is a decreasing price, which would hopefully be the case with these technologies as NZEB applications mature.
If this study were to be repeated or expanded on, then the following suggestions would be made to improve the study further:
  • The reference building for the BIM would be a larger building, such as a high rise block of flats, as this is more likely the type of building, which will be constructed and needed in the future of urban areas.
  • The details about installing renewable energy should be included in the NZEB model for further study; for example, infiltration, internal gains, plug loads, to make the NZEB model more accuracy.
  • More improvements would be suggested for existing building to assess whether they can meet the NZEB goal. Also, this would allow for not just an evaluation of future buildings, but instead all buildings in the future.
  • More renewable energy technologies would be explored, and their potential application to the building would be assessed, along with renewable energy imports. It would allow for a more thorough analysis and could potentially highlight cheaper and more feasible options.

5. Conclusions

Most applications of NZEB are often directed towards new buildings. Since the majority of buildings are already built, there is essential to highlight the application of NZEB on existing built environments via the use of digitalization such as Building Information Modelling (BIM). According to this study, it can be revealed from expert discussions and technical analyses that it is possible to manage a existing building to balance out its energy demand with energy from renewable technologies (NZEB options). This was established through detailed energy simulations to accurately determine the energy demand of an environmentally friendly building with reduced demand by using the BIM. The best solution for the renewable technologies of the future NZEB building depends on each country’s strategies. This paper places research focuses on the UK and finds that to install solar PV on the roof with 7.2 m three wind turbines can gain 23-year payback periods.
Another conclusion to be made from the NZEB solution established in this paper is the increased land demand for the 7.2 m diameter wind turbine. Potentially, it could be a significant drawback and ultimately make it harder for many existing buildings to become an NZEB environment as they do not have the area available to produce their own on-site energy. However, the importation of clean energy is still allowed for NZEB’s, ultimately making a utility, which is more heavily relied upon by existing buildings. This demand for more area would also result in less densely populated areas where these NZEBs similar to this model, are constructed in the future.
Ultimately the NZEB goal is one that is very achievable, and there is no reason why more buildings are meeting this goal, cannot be constructed once public attitude and willingness to invest in a more sustainable and green future improves.

Author Contributions

S.K. provides the idea and suggestion along this study also give final approval of the version to be submitted and any revised version. The main methodology in term of energy analysis model along with the calculation part of ROI analysis is provided by P.R. And, J.W. provide the literature review and others analysis models. All authors participate in writing the article.

Funding

This research was funded by European Commission for the financial sponsorship of the H2020-MSCA-RISE Project No. 691135 “RISEN: Rail Infrastructure Systems Engineering Network,” which enables a global research network that tackles the grand challenge in railway infrastructure resilience and advanced sensing [70]. The APC is sponsored by the University of Birmingham Library’s Open Access Fund.

Acknowledgments

The first author is grateful to Australian Academy of Science (AAS) and Japan Society for the Promotion of Sciences (JSPS) for his JSPS Invitation Fellowship for Research (Long-term), Grant No. JSPS-L15701, at Railway Technical Research Institute (RTRI) and the University of Tokyo, Japan. The second author gratefully appreciates the Royal Thai Government for her PhD scholarship.

Conflicts of Interest

The authors declare no conflict of interest.

Appendix A

Table A1. NZEB definition ranking.
RankNZEB DefinitionMeaning
1NZEB: AThe buildings energy demand is met 100% by renewable technologies situated on the building footprint and no energy is imported. Any excess energy produced will be sold back to the energy grid
2NZEB: BThe buildings energy demand is met 100% by renewable technologies situated on the buildings site and no energy is imported. Any excess energy produced will be sold back to the energy grid
3NZEB: C (Source)A building which meets its energy demand through a combination of imported energy and renewable technologies, with the technologies being located either on the building footprint (preferred) or site. The energy imported is balanced by the renewable energy produced when all energy for generation and transmission, the correct site-to-source conversion factors must be applied
4NZEB: Mix (Source)A building which meets its energy demands through the on-site combustion of imported renewable fuels, along with imported energy and on-site energy production through other renewable energy technologies. The energy imported is balanced by the renewable energy produced when all energy for generation and transmission, the correct site-to-source conversion factors must be applied
5NZEB: C (Emissions)A building which meets its energy demand through a combination of imported energy and renewable technologies, with the technologies being located either on the building footprint (preferred) or site. The energy imported from emission producing sources is balanced by an equal amount of energy from emission free sources.
6NZEB: Mix (Emissions)A building which meets its energy demands through the on-site combustion of imported renewable fuels, along with imported energy and on-site energy production through other renewable energy technologies. The energy imported from emission producing sources is balanced by an equal amount of energy from emission free sources.
7NZEB: DA building which 100% of its energy demand is met through the imports of energy from a renewable source
8NZEB: C (Site)A building which meets its energy demand through a combination of imported energy and renewable technologies, with the technologies being located either on the building footprint (preferred) or site. These technologies produce as much energy as the building consumes in the year, not including energy for transmission
9NZEB: Mix (Site)A building which meets its energy demands through the on-site combustion of imported renewable fuels, along with imported energy and on-site energy production through other renewable energy technologies. These technologies produce as much energy as the building consumes in the year, not including energy for transmission
10Autonomous NZEBThis is a building which is not connected to the grid, therefore any energy it uses must come from its own production, these production methods must be from either renewable technology or combustion of renewable fuels. The lack of grid connection means on site storage must be utilised, however the building may still experience periods with no energy.

Appendix B

Figure A1. Hierarchical flow chart.
Sustainability 11 00159 g0a1

Appendix C

Figure A2. Final model of improved thermal efficiency house (front view).
Sustainability 11 00159 g0a2
Figure A3. Final model of improved thermal efficiency house (side view).
Sustainability 11 00159 g0a3

Appendix D

Table A2. Thermal properties of improved thermal efficiency house.
ItemRevit (Standard)Standard HouseIncreased Efficiency
Wall (mm)R = 4.2
U = 0.24
R = 2.607 (from values below)R = 5.3346 (from values below)
Brick (102.5)K = 0.540.69–1.32 [62]0.6 [63]
Insulation (75)K = 0.0190.038 [64,65]0.021 [63]
Concrete (100)K = 1.30.19 [63]0.11 [63]
Plaster board (12.5)K = 0.510.48 [62]0.022—(insulated plaster board) [66]
Base coat (2) 0.018 (Ecomerchant.co.uk, 2018)
Plaster (2)K = 0.650.5 [67]0.5
Roof (mm)R = 9.3383
U = 0.107
R = 4.2516 (from values below)R = 15.4084 (from values below)
Tiles (38)K = 0.840.84 [67]0.11—Western red cedar [64,65]
0.12—(Terrazzo tiles) [67]
Wood (lath) (25)K = 0.120.12 [67]0.12
Felt (2)K = 0.50.5 [69]0.19—roofing felt [68]
Wood (board) (25)K = 0.120.14 [69]0.14
Insulation (100)K = 0.0350.038 [64,65]0.021 [63]
Ensure 270 mm thick [27,28]
Wood (truss) (150)K = 0.0250.13 [69]0.13
Plaster board (12.5) 0.48 [70]0.022—(insulated plaster board) [68]
Base coat (2) 0.018 [68]
Plaster (2)K = 0.650.5 [69]
Window R = 0.667; U = 1.5
(Double glazed, 16 mm gap with argon filling) [69,70]
R = 1.42; U = 0.8
(Triple glazed, 16 mm gap with argon filling) [67]
DoorR = 1.03
U = 0.97
U = 1.8 [70]R = 1.42; U = 0.8
(Triple glazed, 16 mm gap with argon filling) [67]

References

  1. European Union. Directive 2010/31/EU of the European Parliament and of the Council of 19 May 2010 on the energy performance of buildings (recast). Off. J. Eur. Union 2010, 153, 13–35. [Google Scholar]
  2. US Department of Energy. 2015 Renewable Energy Data Book; US Department of Energy: Washington, DC, USA, 2015; p. 14.
  3. Srinivasan, R.S.; Braham, W.W.; Campbell, D.E.; Curcija, C.D. Re (De) fining Net Zero Energy: Renewable Emergy Balance in environmental building design. Build. Environ. 2012, 47, 300–315. [Google Scholar] [CrossRef]
  4. Wang, L.; Gwilliam, J.; Jones, P. Case study of zero energy house design in UK. Energy Build. 2009, 41, 1215–1222. [Google Scholar] [CrossRef]
  5. Voss, K.; Musall, E. Net Zero Energy Buildings—International Projects on Carbon Neutrality in Buildings; DETAIL; Walter de Gruyter: Berlin, Germany, 2011; ISBN -978-3-0346-0780-3. [Google Scholar]
  6. Sartori, I.; Napolitano, A.; Voss, K. Net zero energy buildings: A consistent definition framework. Energy Build. 2012, 48, 220–232. [Google Scholar] [CrossRef] [Green Version]
  7. Crawley, D.; Pless, S.; Torcellini, P. Getting to net zero. ASHRAE J. 2009, 51, 18–25. [Google Scholar]
  8. European Parliment. On the Proposal for a Directive of the European Parliament and of the Council on the Energy Performance of Buildings (Recast); European Parliament: Brussels, Belgium, 2009. [Google Scholar]
  9. Marszal, A.; Heiselberg, P.; Bourrelle, J.; Musall, E.; Voss, K.; Sartori, I.; Napolitano, A. Zero Energy Building—A review of definitions and calculation methodologies. Energy Build. 2011, 43, 971–979. [Google Scholar] [CrossRef]
  10. Noguchi, M.; Athienitis, A.; Delisle, V.; Ayoub, J.; Berneche, B. Net Zero Energy Homes of the Future: A Case Study of the ÉcoTerraTM House in Canada. In Proceedings of the Renewable Energy Congress, Glasgow, Scotland, 19–25 July 2008. [Google Scholar]
  11. Heinze, M.; Voss, M. Goal zero energy building—Exemplary experience based on the solar estate Solarsiedlung Freiburg am Schlierberg. Ger. J. Green Build. 2009, 4. [Google Scholar]
  12. Musall, E.; Weiss, T.; Lenoir, A.; Voss, K.; Garde, F.; Donn, M. Net Zero Energy Solar Buildings: An Overview and Analysis on Worldwide Building Projects. In Proceedings of the EuroSun Conference 2010, Graz, Austria, 28 September–1 October 2010. [Google Scholar]
  13. Zhao, J.; Wu, Y.; Zhu, N. Check and evaluation system on heat metering and energy efficiency retrofit of existing residential buildings in northern heating areas of china based on multi-index comprehensive evaluation method. Energy Policy 2009, 37, 2124–2130. [Google Scholar] [CrossRef]
  14. Pless, S.; Torcellini, P. Net-Zero Energy Buildings: A Classification System Based on Renewable Energy Supply Options Net-Zero Energy Buildings; Contract; National Renewable Energy Laboratory: Golden Colorado, CO, USA, 2010.
  15. Srinivasan, R.S.; Campbell, D.E.; Wang, W. Renewable Substitutability Index: Maximizing Renewable Resource Use in Building. Building 2015, 5, 581–596. [Google Scholar] [CrossRef]
  16. Visa, I.; Moldovan, M.D.; Comsit, M.; Duta, A. Improving the renewable energy mix in a building toward the nearly zero energy status. Energy Build. 2014, 68, 72–78. [Google Scholar] [CrossRef]
  17. Krarti, M.; Ihm, P. Evaluation of net-zero energy residential buildings in the MENA region. Sustain. Cities Soc. 2016, 22, 116–125. [Google Scholar] [CrossRef]
  18. Portuguese Government. Decreto-Lei nr. 80/2006, Regulamento das Características do ComportamentoTérmico dos Edifícios (RCCTE); Portuguese Parliament: Lisbon, Portugal, 2006.
  19. UK Government. The Building Regulation 2000, Part L: Conversation of Fuel and Power; British Parliament: London, UK, 2000.
  20. Torcellini, P.; Pless, S.; Deru, M. Zero Energy Buildings: A Critical Look at the Definition Preprint. ACEE Summer Study 2006, 2, 15. [Google Scholar] [CrossRef]
  21. Sartori, I.; Napolitano, A.; Marszal, A.; Pless, S.; Torcellini, P.; Voss, K. Criteria for Definition of Net Zero Energy Buildings Criteria for Definition of Net Zero Energy Buildings. In Proceedings of the International Conference on Solar Heating, Cooling and Buildings 2010, Graz, Austria, 28 September–10 October 2010. [Google Scholar]
  22. Ballantyne, E.; Gurr, T.; Hill, R. Energy Considerations: Housing 2000; Report vol. 2; Australian Industrial Research Group and Commonwealth Scientific Industrial Research Organization (CSIRO) Division of Building Research: Canberra, Australia, 1980. [Google Scholar]
  23. Edwards, P.J.; Stewart, P.J.; Tucker, S.N. A CAD-based Approach to Embodied Energy Impact Modelling for Housing Design. In Proceedings of the National Construction and Management Conference, Sydney, Australia, 17–18 February 1994; Wakefield, R.R., Carmichael, D.G., Eds.; Institution of Engineers: Kensington, N.S.W., Australia, 1994; pp. 255–265. [Google Scholar]
  24. D’Cruz, N. Study on Environmental and Energy Bricks and Tiles; Curtin Consultant Services, Curtin University of Technology: Perth, Australia, 1990. [Google Scholar]
  25. Lawson, B. Capital Energy Costs of Building and Recycling of Building Materials. In Proceedings of the Construction Beyond 2000, Espoo, Finland, 15–18 June 1992. [Google Scholar]
  26. House Price per Square Metre and House Price per Room, England and Wales: 2004 to 2016. Available online: https://www.ons.gov.uk/economy/inflationandpriceindices/articles/housepricepersquaremetreandhousepriceperroomenglandandwales/2004to2016 (accessed on 14 December 2017).
  27. How Much Electricity does a Home Use? Available online: https://www.ovoenergy.com/guides/energy-guides/how-much-electricity-does-a-home-use.html (accessed on 15 December 2017).
  28. The Ultimate Guide to Roof and Loft Insulation | OVO Energy. Available online: https://www.ovoenergy.com/guides/energy-guides/the-ultimate-guide-to-roof-and-loft-insulation.html (accessed on 10 February 2018).
  29. Leckner, M.; Zmeureanu, R. Life cycle cost and energy analysis of a Net Zero Energy House with solar combisystem. Appl. Energy 2011, 88, 232–241. [Google Scholar] [CrossRef]
  30. Hernandez, P.; Kenny, P. From net energy to zero energy buildings: Defining life cycle zero energy buildings (LC-ZEB). Energy Build. 2010, 42, 815–821. [Google Scholar] [CrossRef]
  31. Kurnitski, J.; Allard, F.; Braham, D.; Goeders, G. How to define nearly net zero energy buildings nZEB. REHVA J. 2011, 5, 6–12. [Google Scholar]
  32. Kaewunruen, S.; Rungskunroch, P.; Jennings, D.V. A through-life evaluation of end-of-life rolling stocks considering asset recycling, energy recovering, and financial benefit. J. Clean. Pro. 2019, 212, 1008–1024. [Google Scholar] [CrossRef]
  33. Robert, A.; Kummert, M. Designing net-zero energy buildings for the future climate, not for the past. Build. Environ. 2012, 55, 150–158. [Google Scholar] [CrossRef]
  34. Primary Energy—Energy Education. Available online: http://energyeducation.ca/encyclopedia/Primary_energy (accessed on 15 December 2017).
  35. Marszal, A.J.; Heiselberg, P.; Jensen, R.L.; Nørgaard, J. On-site or off-site renewable energy supply options? Life cycle cost analysis of a Net Zero Energy Building in Denmark. Renew. Energy 2012, 44, 154–165. [Google Scholar] [CrossRef]
  36. Deru, M.; Torcellini, P. Source Energy and Emission Factors for Energy Use in Buildings. Stuff. Mit. Edu. 2007. [Google Scholar] [CrossRef]
  37. National Wind Watch. National Wind Watch | Size of Industrial Wind Turbines. Available online: https://www.wind-watch.org/faq-size.php (accessed on 15 December 2017).
  38. Kapsalaki, M.; Leal, V.; Santamouris, M. A methodology for economic efficient design of Net Zero Energy Buildings. Energy Build. 2012, 55, 765–778. [Google Scholar] [CrossRef]
  39. The United Nations. World’s Population Increasingly Urban with More Than Half Living in Urban Areas | UN DESA | United Nations Department of Economic and Social Affairs. Available online: http://www.un.org/en/development/desa/news/population/world-urbanization-prospects-2014.html (accessed on 18 March 2018).
  40. Data.worldbank.org. Urban population | Data. Available online: https://data.worldbank.org/indicator/SP.URB (accessed on 18 March 2018).
  41. Architecture 2030. 2030 CHALLENGE Targets: U.S. National Medians. Available online: http://www.architecture2030.org/files/2030_Challenge_Targets_National.pdf (accessed on 18 March 2018).
  42. Gas & Electricity Tariff Price per kWh. Available online: https://www.ukpower.co.uk/home_energy/tariffs-per-unit-kwh (accessed on 11 October 2018).
  43. Colclough, S.; Kinnane, O.; Hewitt, N.; Griffiths, P. Investigation of nZEB social housing built to the Passive House standard. Energy Build. 2018, 179, 344–359. [Google Scholar] [CrossRef]
  44. Asdrubali, F.; Ballerina, I.; Corrado, V.; Evangelisti, L.; Grazieschi, G.; Guattari, C. Energy and environmental payback times for an NZEB retrofit. Build. Environ. 2019, 147, 461–472. [Google Scholar] [CrossRef]
  45. Cost Guide: Walls and Insulation. Available online: https://www.self-build.co.uk/cost-guide-walls-and-insulation/ (accessed on 13 March 2018).
  46. How Much does it Cost to Tile a Roof? Available online: https://www.homebuilding.co.uk/how-much-does-it-cost-to-tile-a-roof/ (accessed on 13 March 2018).
  47. BCIS Rebuild Calculator Results. Available online: https://calculator.bcis.co.uk (accessed on 13 March 2018).
  48. Green Building Costs and Financial Benefits. Available online: http://staging.community-wealth.org/sites/clone.community-wealth.org/files/downloads/paper-kats.pdf (accessed on 13 March 2018).
  49. The Eco Experts. Solar Panel Sizes—3 Tips To Determine Which Size Is Best. Available online: https://www.theecoexperts.co.uk/what-size-solar-panel-do-i-need (accessed on 13 March 2018).
  50. Sungur, C. Multi-axes sun-tracking system with PLC control for photovoltaic panels in Turkey. Renew. Energy 2009, 34, 1119–1125. [Google Scholar] [CrossRef]
  51. Autodesk—Revit. Help—Energy Use Intensity. Available online: http://help.autodesk.com/view/RVT/2016/ENU/?guid=GUID-DC115EA5-B157-4C00-82EC-72F6E947E69E (accessed on 13 March 2018).
  52. Sinden, G. Characteristics of the UK wind resource: Long-term patterns and relationship to electricity demand. Energy Policy 2007, 35, 112–127. [Google Scholar] [CrossRef]
  53. Energy Saving Trust. Choosing a Wind Turbine. Available online: http://www.energysavingtrust.org.uk/sites/default/files/reports/choosing%20a%20wind%20turbine_0.pdf (accessed on 13 March 2018).
  54. NOABL. Available online: https://www.rensmart.com/Information/NOABLModel (accessed on 19 September 2018).
  55. Welfle, A.; Gilbert, P.; Thornley, P. Securing a bioenergy future without imports. Energy Policy 2014, 68, 1–14. [Google Scholar] [CrossRef]
  56. Ala-Talkkari. Veto Dynamo The Small ORC Plant. Available online: http://www.hwenergy.co.uk/wp-content/uploads/VETO-Dynamo-tekniska-data.pdf (accessed on 13 March 2018).
  57. Froling. Biomass—CHP Fixed Bed Gasifier CHP 50. Available online: http://www.hwenergy.co.uk/wp-content/uploads/CHP50-Emhofer-2015.pdf (accessed on 13 March 2018).
  58. ILK Dresden. R&D—Project “BioStrom”—CHP—Plant with Small Power*. Available online: http://www.hwenergy.co.uk/wp-content/uploads/Veto-CHP.pdf (accessed on 13 March 2018).
  59. UK Solar Power Installations Plummet after Government Cuts. Available online: https://www.theguardian.com/environment/2016/apr/08/solar-installation-in-british-homes-falls-by-three-quarters-after-subsidy-cuts (accessed on 13 March 2018).
  60. Biddulph, P.; Gori, V.; Elwell, C.; Scott, C.; Rye, C.; Lowe, R.; Oreszczyn, T. Inferring the thermal resistance and effective thermal mass of a wall using frequent temperature and heat flux measurements. Energy Build. 2014, 78, 10–16. [Google Scholar] [CrossRef]
  61. Ibstock. Understanding ‘k’ Values (Design Thermal Conductivity) and U-Values. Available online: http://www.ibstock.com/wp-content/uploads/2015/08/Ibstock-TIS-A9-UNDERSTANDING-THERMAL-CONDUCTIVITY-k-VALUES-.pdf (accessed on 13 March 2018).
  62. GreenSpec. Insulation Materials and Their Thermal Properties. Available online: http://www.greenspec.co.uk/building-design/insulation-materials-thermal-properties/ (accessed on 13 March 2018).
  63. GreenSpec. Pitched Roof Coverings 1: Wood Shingle, Slate & Clay Tile. Available online: http://www.greenspec.co.uk/building-design/pitched-roof-coverings-1/ (accessed on 10 February 2018).
  64. Ecotherm.co.uk. Insulated Plasterboard | Internal wall insulation for cavity, solid & timber frame walls. Available online: http://www.ecotherm.co.uk/our_products/cavity_wall_insulation_which_provides_maximum_insulation_with_the_minimum_of_thickness/eco-liner.aspx (accessed on 10 February 2018).
  65. Leeds Beckett University. Thermal conductivity of building materials. Available online: http://www.leedsbeckett.ac.uk/teaching/vsite/low_carbon_housing/resources/thermal-conductivity-of-building-materials.pdf (accessed on 10 February 2018).
  66. Saeed, S.A.; Qadir, S.S.; Shaan, R.H. Thermal Insulating Concrete Tiles. Int. J. Eng. Technol. 2012, 2, 1877–1880. [Google Scholar] [CrossRef]
  67. LABC Hertfordshire. U-Values of Elements. A Guide to the Specification of Insulation Materials in Order to Achieve Compliance with Approved Document L1B 2010 of the Building Regulations for Small Domestic Works. Available online: http://www.haringey.gov.uk/sites/haringeygovuk/files/u-value_guidance_nov_06a.pdf (accessed on 1 December 2018).
  68. Pilkington.com. Understanding the Government’s Data on U Values. Available online: https://www.pilkington.com/~/media/Pilkington/Site%20Content/UK/Reference/TableofDefaultUValues.pdf (accessed on 13 March 2018).
  69. Kaewunruen, S.; Martin, V. Life Cycle Assessment of Railway Ground-Borne Noise and Vibration Mitigation Methods Using Geosynthetics, Metamaterials and Ground Improvement. Sustainability 2018, 10, 3753. [Google Scholar] [CrossRef]
  70. Kaewunruen, S.; Joseph, M.; Sussman, A.M. Grand challenges in transportation and transit systems. Front. Built Environ. 2016, 2, 4. [Google Scholar] [CrossRef]
Figure 1. The trend of world urban population since 1960 adopted data from the World Bank [42].
Sustainability 11 00159 g001
Figure 2. The comparison between NPV of building price in different discount rate using improve thermal efficiency house rate.
Sustainability 11 00159 g002
Figure 3. The comparison between NPV of building price in different discount rate using insight software rate.
Sustainability 11 00159 g003
Figure 4. The break-even point analysis of renewable technologies for NZEB building.
Sustainability 11 00159 g004
Table 1. NZEB supply options hierarchy [20].
Option NumberZEB Supply-Side OptionsExamples
1Reduce site energy use through low-energy building technologies.Daylighting, high-efficiency HVAC equipment, natural ventilation, evaporative cooling, etc.
On-Site Supply Options
2Use renewable energy sources available within the building’s footprint.PV, solar hot water, and wind located on the building.
3Use renewable energy sources available at the site.PV, solar hot water, low-impact hydro, and wind located on-site, but not on the building.
Off-Site Supply Options
4Use renewable energy sources available off-site to generate energy on site.Biomass, wood pellets, ethanol, or biodiesel that can be imported from off-site, or waste streams from on-site processes that can be used on-site to generate electricity and heat.
5Purchase off-site renewable energy sources.Utility-based wind, PV, emissions credits, or other “green” purchasing options. Hydroelectric is sometimes considered.
Table 2. The comparison on energy analysis of improved thermal efficiency house and standard house through Revit program.
Name of ModelImproved Thermal Efficiency HouseStandard House
Model Sustainability 11 00159 i001 Sustainability 11 00159 i002
Revit energy analysis result133 kWh/m2/year142 kWh/m2/year
Table 3. The summarization of EUI values from other sources.
SourcesEUI Values (kWh/m2/year)Remaining Energy (kWh/year)Electrical Cost (£) Reduced Cost (£/year)
Standard14285,528.0211,118.64-
Improve Thermal Efficiency13380,107.2310,413.94704.70
Insight Software12474,691.629709.911408.73

