Article

Floating Away: The Impact of Hydroelectric Power Stations on Tourists’ Experience in Iceland

by
Anna Dóra Sæþórsdóttir
1,* and
C. Michael Hall
2
1
Department of Geography & Tourism, Faculty of Life and Environmental Sciences, University of Iceland, 101 Reykjavík, Iceland
2
Department of Management, Marketing and Entrepreneurship, University of Canterbury, 8140 Christchurch, New Zealand
*
Author to whom correspondence should be addressed.
Sustainability 2018, 10(7), 2315; https://doi.org/10.3390/su10072315
Submission received: 27 May 2018 / Revised: 25 June 2018 / Accepted: 2 July 2018 / Published: 4 July 2018
(This article belongs to the Special Issue Hydropower Production)

Abstract

:
It is of vital importance that nature-based tourist destinations maintain their natural resources in a sustainable way. Nature and wilderness are the main attractions for tourism in Iceland. The Central Highlands are uninhabited with little visible evidence of human influence except for some huts, gravel roads, and a small number of hydroelectric power plants. However, there are plans for further hydroelectric power development in the area. The Blanda Power Station was constructed in 1991 at the edge of the North Central Highlands. This paper presents the results of a questionnaire survey conducted among tourists in the area in the summer of 2016 with a total of 1078 answered questionnaires. The objective was to estimate the impact of the power station on the experience of tourists and to assess whether their attitude differs from that of tourists in locations where power plant construction has been proposed. The results show that the power plant infrastructure at Blanda, with the exception of transmission lines, does not seem to disturb the experience of the majority of tourists. Tourists at Blanda are also more positive towards power plants than at locations where there are no power plants but where they have been proposed.

1. Introduction

Given that hydroelectricity is a renewable source of energy which is as an important driver for climate change mitigation (e.g., Klöpper [1]), the acceptance of hydroelectric power in societies is generally high. However, hydroelectric power plants have an unavoidable impact on the landscape, reflecting Nadaï and Horst [2], (p. 143) observation, “There can be very little doubt that energy will remain the number one driver for landscape transformation in the 21st century”. As a result of demands for low carbon energy hydroelectric power plant infrastructure will unavoidably stretch further into places that have so far been unaffected by such developments. Meanwhile it is of vital importance for tourist destinations that are based on nature-based tourism to preserve their relative naturalness. The demand in the Western world for the use of natural landscapes for tourism and recreation has been steadily expanding, due to the growing number of visitors, increased leisure time, and a continued favorable disposition to wilderness and remote landscapes. Furthermore, the economic prospects of nature-based tourism are very promising in many northern regions given that there is often an abundance of pristine nature and few other development alternatives.
It is generally assumed that power plants and accompanying infrastructure reduce the attractiveness of nature-based tourism destinations [3]. Therefore, opposition against power plant development can be expected and it is often greater in natural areas which possess a high-quality landscape [4], than at destinations where developments are already in place [5]. This can partly be explained via the changes to senses of place identity, place attachment [6] and a social construction of nature in which the “naturalness” of wilderness has been questioned, (e.g., [7,8,9,10]).
This study follows these ideas by evaluating the impact of a hydroelectric power station on the experience of tourists and whether their attitude differs from tourists in areas in which power plant construction is pending. The case comes from Blanda hydroelectric power station in northern Iceland—a region rich both in hydropower and in popular locations for nature-based tourism.
Large-scale production of hydroelectric power started in Iceland in the mid–1960s and currently the country produces the most renewable electricity per capita in Europe [11]. There are plans for further development of hydroelectric power plants in areas that might create conflicts with nature-based tourism as most of the proposed plants are located in high-value natural areas. In recent years, nature-based tourism has become the largest export sector in Iceland with 83% of visitors claiming nature as the primary reason for visiting the country and nearly 50% state the country’s pristine landscape and wilderness is the main attraction of Icelandic nature [12]. Blanda hydroelectric power station is at the periphery of the uninhabited Central Highlands, referred to here as the Highlands. Research conducted among tourists has demonstrated that wilderness is an important part of the appeal of the Highlands [13,14,15]. Yet, given the impending developments and their potential affect on the tourism sector, it is imperative that a better understanding on tourist perceptions of the impacts of power plants on the landscape is gained.
Based upon a questionnaire survey among tourists at Blanda Power Station the aim of this paper is to examine:
  • How tourists experience the area around Blanda Power Station and whether they perceive wilderness as a part of the attraction.
  • The attitude of tourists towards power plant constructions in the area.
  • The attitude of tourists towards power plants in Iceland.
  • Whether tourists’ attitudes towards the questions above differs depending on main variables (i.e., nationality, age, gender, travel pattern, season).
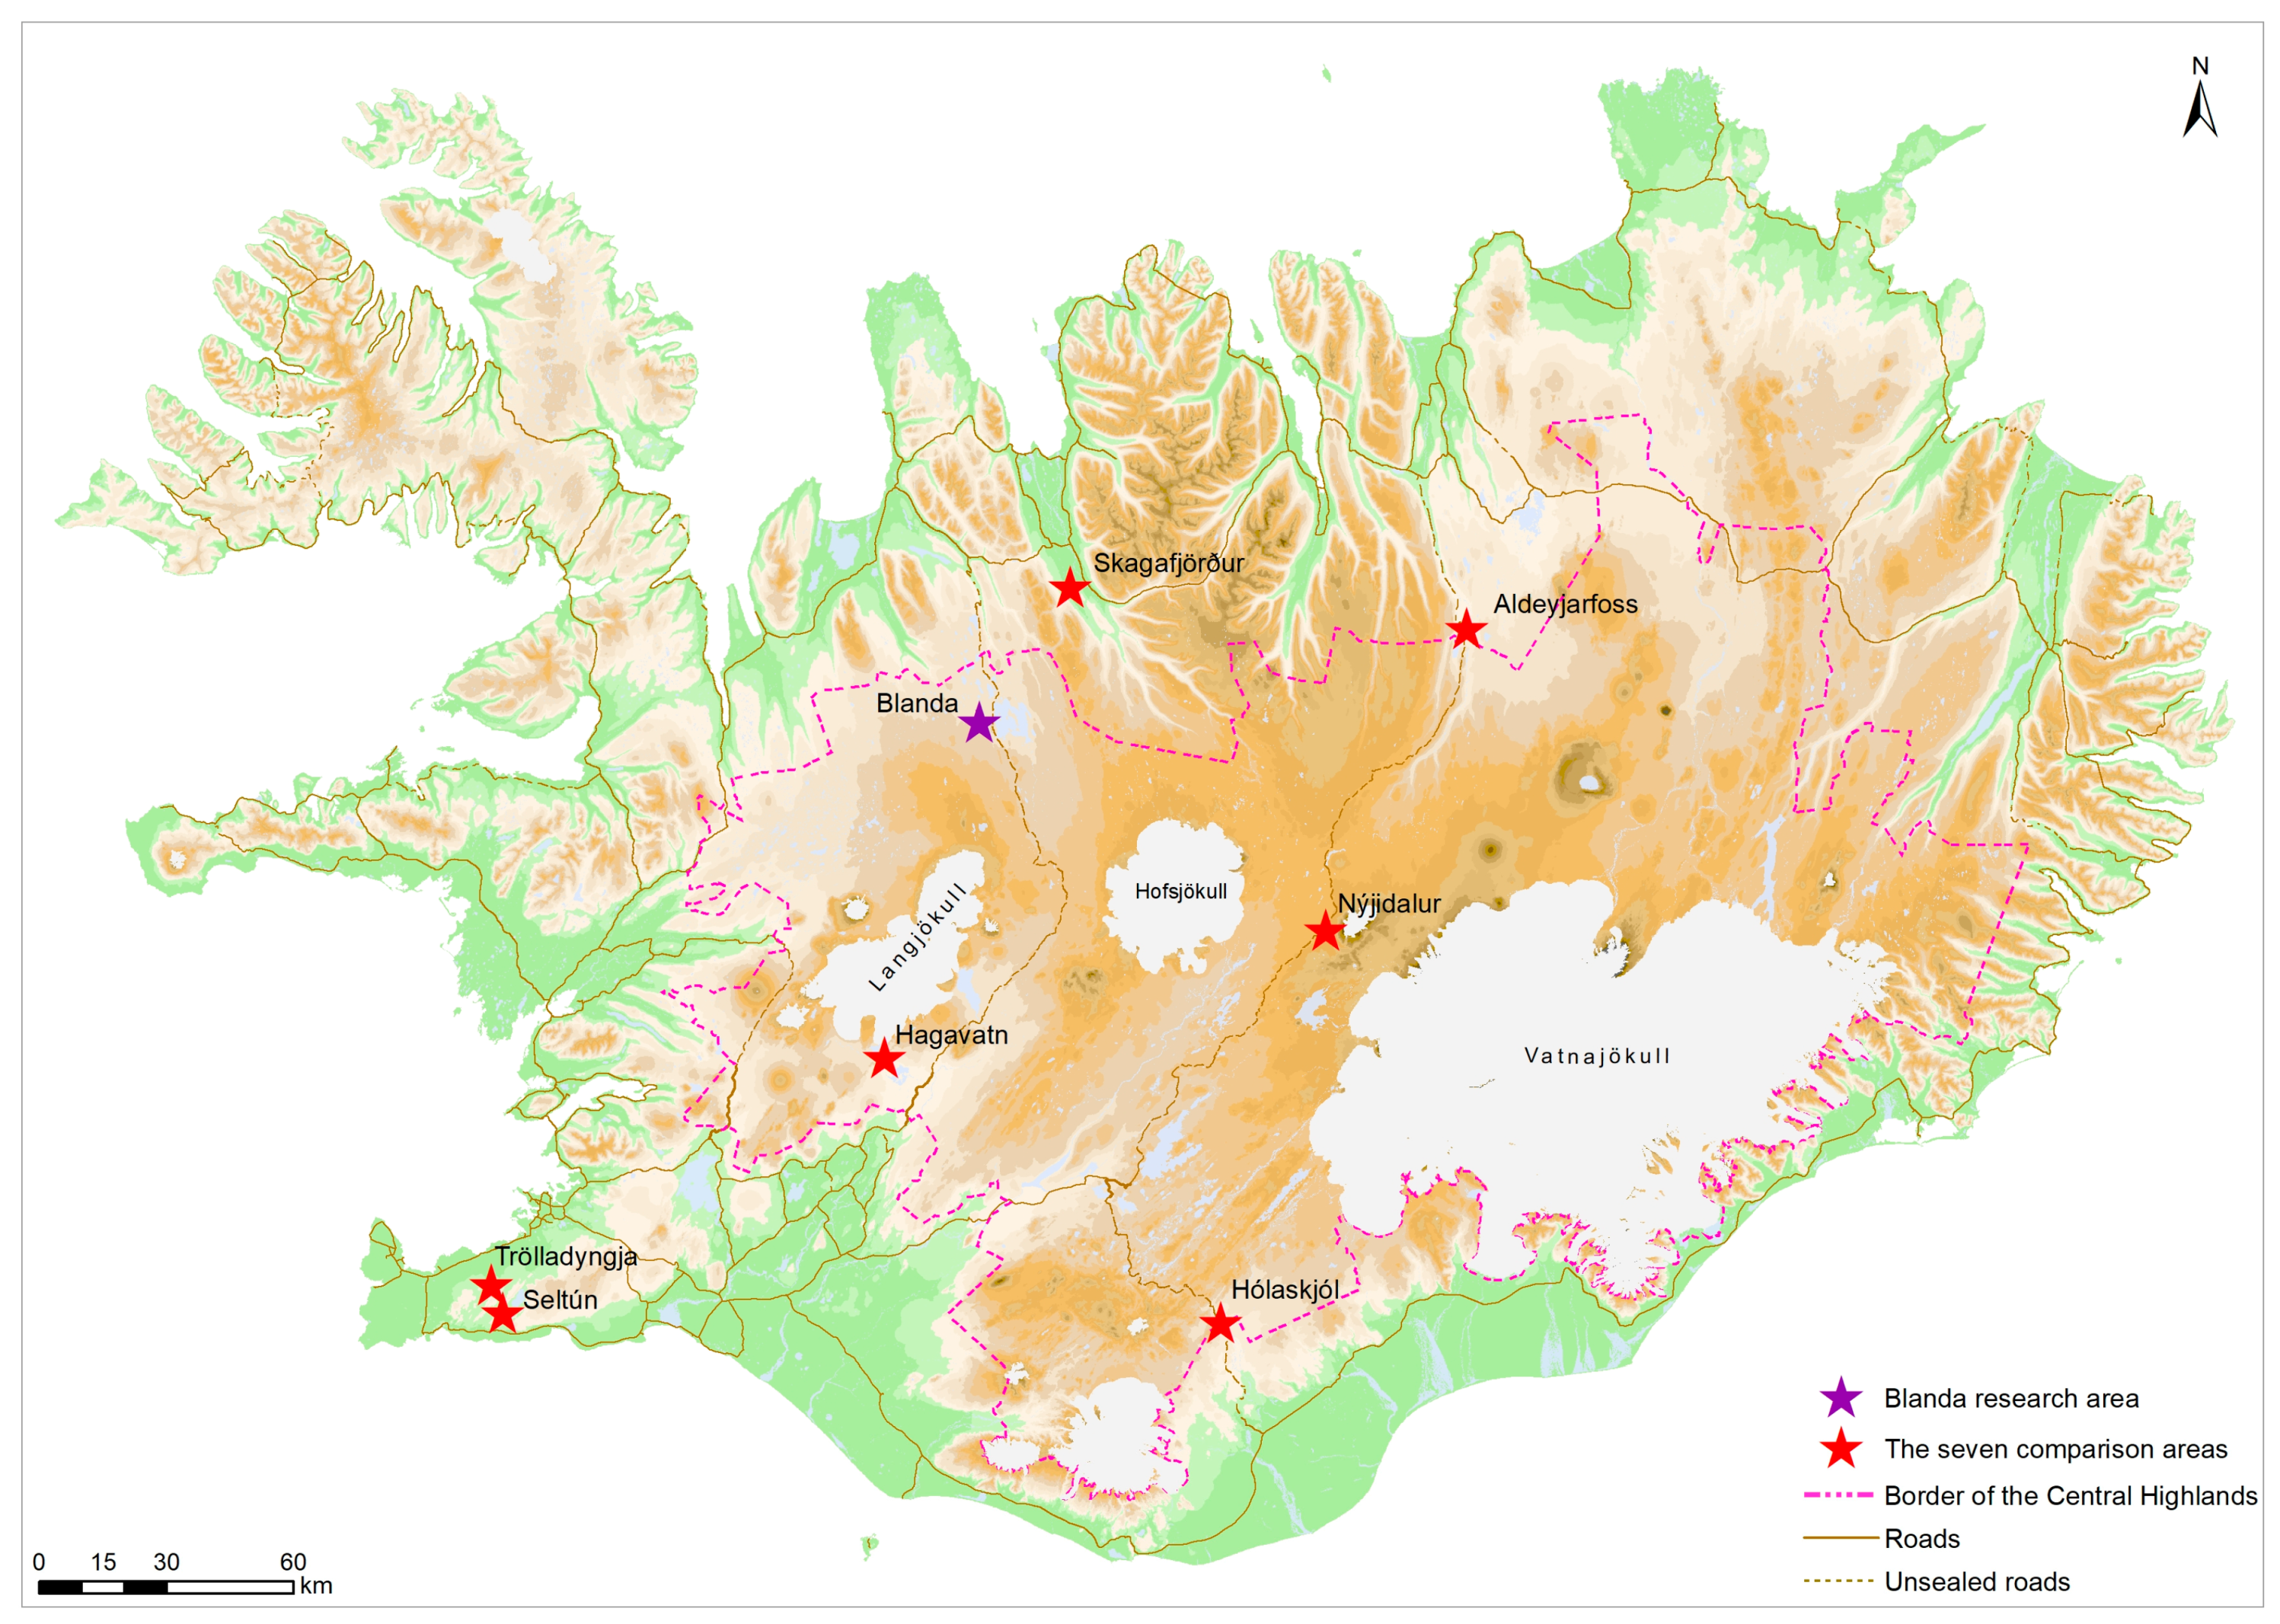
  • Whether there is a difference in the attitude of tourists in the vicinity of Blanda Power Station and the seven other areas where power plant development has been proposed.
Bishop [16] argued that in the near future, landscapes will change significantly due to the development of renewable energy as a response to climate change. This will presumably result in power plant infrastructure becoming increasingly visible in the landscape in natural areas in many parts of the world [16]. However, this brings up major public policy issues regarding the development of renewable energy versus its impact on the natural environment and the prosperity of economic sectors that rely on locations with high degrees of naturalness, such as the tourism industry. In countries and regions with an economically significant nature-based tourism sector that depends on natural areas and wilderness as an attraction, an understanding of tourists’ perceptions of the effects of power plant construction should therefore become integral to policy discourse. If, as Nadaï and Van der Horst suggest, “Landscape has become a key arena for the debate on energy policy” [2] (p. 143), then it is imperative that debate is informed and evidence-based with respect to the relative values of energy and tourism development and the interrelationships between these sectors. Consequently, this study addresses some of the most important issues with respect to sustainable development in peripheral and wilderness areas with significant energy development potential [17] that are also nature-based tourism destinations.
The next section discusses concepts of the social construction of nature, place identity, and place attachment in relation to the meaning of wilderness [6], along with how people perceive power plant constructions in natural areas. A description of the research area and comparative locations is provided, as well as an account of the methods that were employed and data processing. A comprehensive analysis of the questionnaire results is provided, with the main results discussed in the wider context of the policy and planning discourse surrounding such developments as well as the implications for future energy and tourism development.

2. Constructing Place

The geographical concept of ‘topophilia’ (love of/for a place) addresses the emotional connections between people and the physical environment as a way of admiring the landscape [2,18,19]. The connection between humans and places has been looked at, for example, via the lens of ‘place identity’ which describes how the physical and symbolic characteristics of places add to peoples’ sense of self or identity [20]. ‘Place attachment’ is a related concept, which consist of relations between behaviour, perception and feelings that are supposed to evolve through individual experiences with the physical environment. Local people usually have more experiences of neighboring areas as they use them more than others and are therefore assumed to develop stronger attachment to the areas [21]. Thus, their opposition to environmental change is expected to be greater than those with weaker place attachments. This relationship has been studied empirically by Vorkinn and Riese [22] who evaluated the connections between place attachment and the local opposition against a proposed hydropower project in Norway. They showed that the stronger local people felt attached to the proposed area the more negative they were towards development, indicating that a power plant in the area would reduce place attachment.
In this context, a ‘place’ refers to a space that has been given a symbolic meaning by individuals and groups via processes of social and economic developments. Thus, a place is a dynamic concept that can change over time. Places are of various size/scale and their realties can vary. Some places are quite ‘real’ such as, for example, an island. Others, like wilderness, are more of an idea, at least according to social constructionists, e.g., [7,9,10], that fit perceptions of a landscape. However, this is a selective practice in which individuals tend to see what fits into their image of a place and their prior beliefs. According to Bell [23] people tend not to see, or forget more easily, negative visual experiences that do not fit their prior image of how the area should look like. Accordingly, the meaning people ascribe to certain landscapes depends on their preconceived image of how an area is supposed to look like. Social constructionists consequently argue that the perception of a landscape depends on individuals’ knowledge and that such knowledge is constructed through communicative connections between people, as well as between people and institutions. From this perspective, environmental knowledge is therefore actively produced by individuals and groups rather than being a passive reflection of reality. For instance, if tourists assume an area to be wilderness and they understand wilderness as a non-human world with unspoiled nature, they may consciously or unconsciously avoid seeing human made modifications of the environment and thereby construct their perceived reality. Hence ‘wilderness’ according, to this approach, is a cultural and historical construction [24].
Studies among tourists in the various areas within the Icelandic Highlands have showed that despite human influence like roads, mountain huts and some other infrastructures, most tourists still experience the area as wilderness. Thus, the social construction of the wilderness in Iceland suggests that tourists see what they want to see and that they make and preserve in their minds an image of the Highlands as wilderness or unspoiled nature [25,26]. As Devine-Wright [27] observes, consideration needs to be given as to how power plant constructions ‘fit’ with the socially constructed ideas and the symbolic image of how the area ‘should’ look. Therefore, it is really the alteration of a certain landscape that causes the most dissatisfaction but not the new landscape as such. Consequently, new power plant developments have to fit in with the existing place identity and its symbolic dimensions in order to be acceptable to affected communities [6,19,28,29].
Much research [30,31,32,33,34,35] highlights that the most important factor preventing people’s acceptance of renewable energy are their visual perceptions of the appendant infrastructure. Built structures seem to reduce wilderness experiences considerably. Although the type of construction does not appear to matter, whether they are directly related to tourism and outdoor recreation, or related to other industries, e.g., dams and hydroelectric power plants [13,36,37,38,39]. Studies among tourists in nature destinations in Iceland have similarly shown that tourists are rather negative to pending power plant constructions albeit that they are renewable [13,40,41]. That also goes for hydroelectric and geothermal power plant proposals [42] wind farms [41], and transmission lines [40].
There is a large difference between the visibility of the various renewable energy types and the energy landscapes they create. The visual contrast in the landscape from a hydroelectric power plant is, for example, far less than that of a wind farm. Wind farms have very large structures with reflective surfaces, and therefore contrast strongly with the natural environment. As a result, they are usually visible over long distances. For example, in Western American landscapes, Sullivan et al. [43] recommend a radius of 48 km for assessing the visual impact of a wind energy facility. Hydroelectric power plants, on the other hand, create a very different visual experience. They involve housing where turbines and transformers are kept but these buildings are often built underground and therefore have only limited visual impact.
Hydroelectric power plant infrastructure comprises dams, canals, reservoirs, transmission lines, buildings and roads. Reservoirs can create their own landscape signature by taking the appearance of a natural lake, which could potentially create a more positive experience of an area. As Henry David Thoreau (1854) stated in Walden: “A lake is the landscape’s most beautiful and expressive feature. It is earth’s eye; looking into which the beholder measures the depth of his own nature.” However, the surface of reservoirs fluctuates and when it is low it may be an eyesore as the bank can be covered in silt that sometimes can also cause erosion and feed sandstorm when the wind blows. Furthermore, reservoirs lie in depressions in the landscape that are often vegetated, so when the vegetation disappears under the reservoirs the ecological landscape is changed substantially. Hydroelectric power plants also often alter the appearance of the neighboring environment as waterfalls can disappear or their flows reduced, river turbidity altered, and rivers and canyons can become dry. Such events that can affect the recreational use of whitewater habitats due to reduced kayaking and rafting opportunities [44,45], as well as affecting fishing and hunting of water-fowl.
All types of power plants need a way to transfer the energy from the production site to the demand site and therefore transmission lines are a necessary accompanying structure. Due to their visibility they therefore have a substantial impact on landscape perception and attachment towards the area.
New or improved roads are usually unavoidable for the construction of new hydroelectric power plants. However, while roading can have a substantial impact on visual amenity, it can also make locations much more accessible to visitors and therefore have a major effect on what type of tourism develops, what kind of tourists visit and their number [38].
Tourist preferences towards nature destinations varies along a broad spectrum, from appreciation of wilderness with no or little human intrusion to places with considerable infrastructure that have been changed substantially by humans. Different variables can be used to differentiate tourists’ preferences in nature destinations. One widely used method [46,47,48,49] is the so-called Purist Scale model which divides tourists into the groups purists, neutralists and nonpurists according to their satisfaction with qualities and settings in wilderness and other nature destinations. Purists prefer to travel in a pristine environment, with primitive facilities and search for solitude, while nonpurists do not notice or get disturbed by environmental change, appreciate good facilities, and are not disturbed by the number of travelers. Stefánsson, Sæþórsdóttir and Hall [40] found that purists are more negative towards transmission lines and wind turbines than neutralists and nonpurists. This study further investigates the extent to which different groups of tourists respond to power generating infrastructure in a high natural quality landscape.

3. Materials and Methods

3.1. Hydroelectric Power in Iceland

Iceland is the largest producer of renewable electricity per capita in Europe and produces 2.07 times more than Norway, which is the second largest. Iceland is ranked in 15th place among European countries with regard to total production of renewable electricity in total [11]. Hydroelectric power produces about 73% of the electrical power produced in the country, while 27% comes from geothermal sources [50]. About 80% of the total energy produced in Iceland is used by a few (<10) power-intensive industries [51]—all owned by foreign companies. The low price of energy is the main reason that transnational power intensive industries are located in Iceland [52].
The Icelandic population is about 335,000 people and almost all settlement is below 200 m. About 63% of the population lives in the capital area, and the rest lives in towns and farms scattered along the coast and in valleys that penetrate the country to varying degrees [53]. The interior of Iceland, the Central Highlands, cover approximately 40% of the country and form a high plateau at 400–700 m altitude. The area is largely desert-like though occasional depressions and valleys are vegetated. The landscape is diverse and, in many ways, unique, characterized by wide open spaces, with vast lava fields, sandy or stony deserts, geothermal areas, mountains and large ice caps which melt water runs from and forms powerful glacial rivers. The area is uninhabited and there is little visible evidence of human influence except mountain huts for travelers, a small number of power plants and primitive gravel roads. There are two main roads that cross the Highlands between the north and south. One of them is Kjalvegur, which passes the research area presented in this study.
Utilizing rivers to produce hydroelectric power began in Iceland in 1904 when the first hydroelectric power plant was built and for the first half of the twentieth century small hydropower plants were built in towns and at farms in all parts of the country except in the Highlands. In the beginning, such developments were solely for domestic use but, in the late 1960s, the first aluminum smelter was built. To provide the smelter with power, Landsvirkjun (The National Power Company) was set up with the aim of building and operating a new power station, by far the largest in Iceland. It was built at the southern periphery of the Highlands, where the river Þjórsá was harnessed as it runs southwards from its origin in the glacier Hofsjökull in the center of the Highlands. This marked the beginning of hydroelectric power production in the Highlands. In the following years, six more plants were built in the same area. The first hydroelectric power plant, Blanda Power Station in the northern part of the Highlands, was built in 1991 when the river Blanda was harnessed. Blanda, like Þjórsá, also flows from the glacier Hofsjökull but to the north. In 2007 the largest hydroelectric power plant was built in the northeast of the Highlands.
The harnessing of geothermal energy started in 1978 when the first plant was built. So far, no geothermal power plants have been built in the Central Highlands but this could change, as some of the most energetic geothermal areas are located there. Geothermal power plants consist of large buildings for turbines and steam separators, as well as drill holes that sometimes steam that are connected to the main buildings by long pipelines.
Significantly, tourism has benefitted from increased access as a result of roads constructed for the building of power plants. Increased accessibility can have enormous impacts because of the growth in visitor numbers and the further along a destination is in the development process the more obvious the environmental problems tend to be [54,55].

3.2. Blanda Hydroelectric Power Station

The river Blanda is one of the longest rivers in Iceland, about 125 km long and with a catchment area of about 2370 km2. It mostly contains glacial meltwater, although several spring creeks join its stream. The surrounding landscape is characterized by a rather homogenous and expansive plateau at 400–600 m.a.s.l., which is covered by moraine and glaciofluvial deposits. The installed capacity of the power plant is 150 MW (Landsvirkjun, 2016). The power station building lies at the highland border by the northern part of Kjalvegur mountain road. The bulk of the power plant construction itself lies underground, although above ground there is a building and nearby lies a personnel residence along with some other constructions. Further inland from the power station are two reservoirs that have made their mark on the landscape. The larger of the two is called Blöndulón, and at 57 km2, is the third largest inland body of water in Iceland and is situated approximately 25 km by road from the power station building. The other reservoir is the 5 km2 Gilsárlón, located 5 km by road from the power station. In addition, there are a few natural lakes used to canalize water distribution. The mountain lakes were all crystal-clear before the power station was constructed but because of their role in water distribution are now gray colored. The reservoirs and the former natural lakes are connected through diversion canals that are about 9800 m long. Five dams have been built in the area. The three main dams are between 44 and 34 m high (Landsvirkjun, 2016). As a result of lake expansion and the formation of reservoirs, about 62 km2 of land was submerged and some of it vegetated. As compensation, the power company financed the construction of fences, huts and stables in the area and the nearby heaths were reclaimed and cultivated. Roads were also built and asphalted. The electricity from Blanda Power Station is conducted through two 132 kV high voltage transmission lines that lie to the north from the power station. In addition to infrastructural developments, the landscape has been altered due to the Blanda River no longer flowing along its natural course, although the water flowing down it has become clearer.

3.3. Data Collection

The method employed in this study was a questionnaire survey conducted among tourists in the area. Since the objective of the research was to assess the impact of Blanda Power Station and its pertinent infrastructure on the experience of tourists, the respondents had to have travelled through the area where the power station infrastructure is visible before answering the questionnaire. Moreover, they could not have travelled so far from the area so as to not realize what area they were being asked about. As mentioned, the landscape around the power station contains no specific location that all tourists stop to visit. Therefore, reaching a sample group in the area was methodologically challenging.
The method adopted for the research meant that two interviewers were working simultaneously. One interviewer was located at the northern end of the power station’s impact area, by the crossroads of Kjalvegur and the road to the power station/employee building. The questionnaire was handed to the tourists that were entering the Kjalvegur mountain road from the north. The other interviewer was posted in the southern part of the area, on Kjalvegur mountain road just north of the mountain hut Áfangi, where a parking space/rest area and picnic table has been set up. There the questionnaires were handed to the tourists that were coming from the south via Kjalvegur. The interviewers had a signpost in order to draw the attention of tourists. All the passengers in the cars that stopped were asked to answer the questionnaire except for the driver. Those who agreed to participate were handed a questionnaire they answered while driving through the power station impact area, which took about 15 min. Once they had filled out the questionnaires they were delivered upon meeting the interviewer on the other side of the area. Usually the duration of the drive gave the respondents ample time to fill out the questionnaire, nevertheless, if the tourists had any questions left, they would stop the vehicle and finish answering before continuing on their journey.
Tourists on organized tours were approached differently because it is usually more time-consuming to hand out and explain a questionnaire to a group of tourists in a bus than to individuals in private cars, plus the schedule of organized tours is generally full, leaving them with little time to answer. Tour guides or bus drivers were requested to take questionnaires with them and the passengers were asked to respond whilst on the bus. The interviewers gave the guides/drivers a stamped envelope and were asked to mail the questionnaires back to the researchers.
The data collection over the summer took place for two weeks; between the 28 June until the 4 July and in the autumn between the 2 and 8 September 2016. The total number of private and group vehicles that drove through the area was 479 during the summer and 369 over the autumn. The number of vehicles that did not stop to participate in the survey were 150 over the summer and 51 during autumn. Hence, the response ratio compared with the number of vehicles was 67% during the summer and 86% over the autumn. In total, 1078 questionnaires were answered and handed in, 617 in the summer and 461 in the autumn.

3.4. Questionnaire and Data Analysis

The questionnaire was available in four languages, i.e., Icelandic, French, German, and English. It comprised 27 questions, some had a number of subquestions. Their subject can be divided into the following categories:
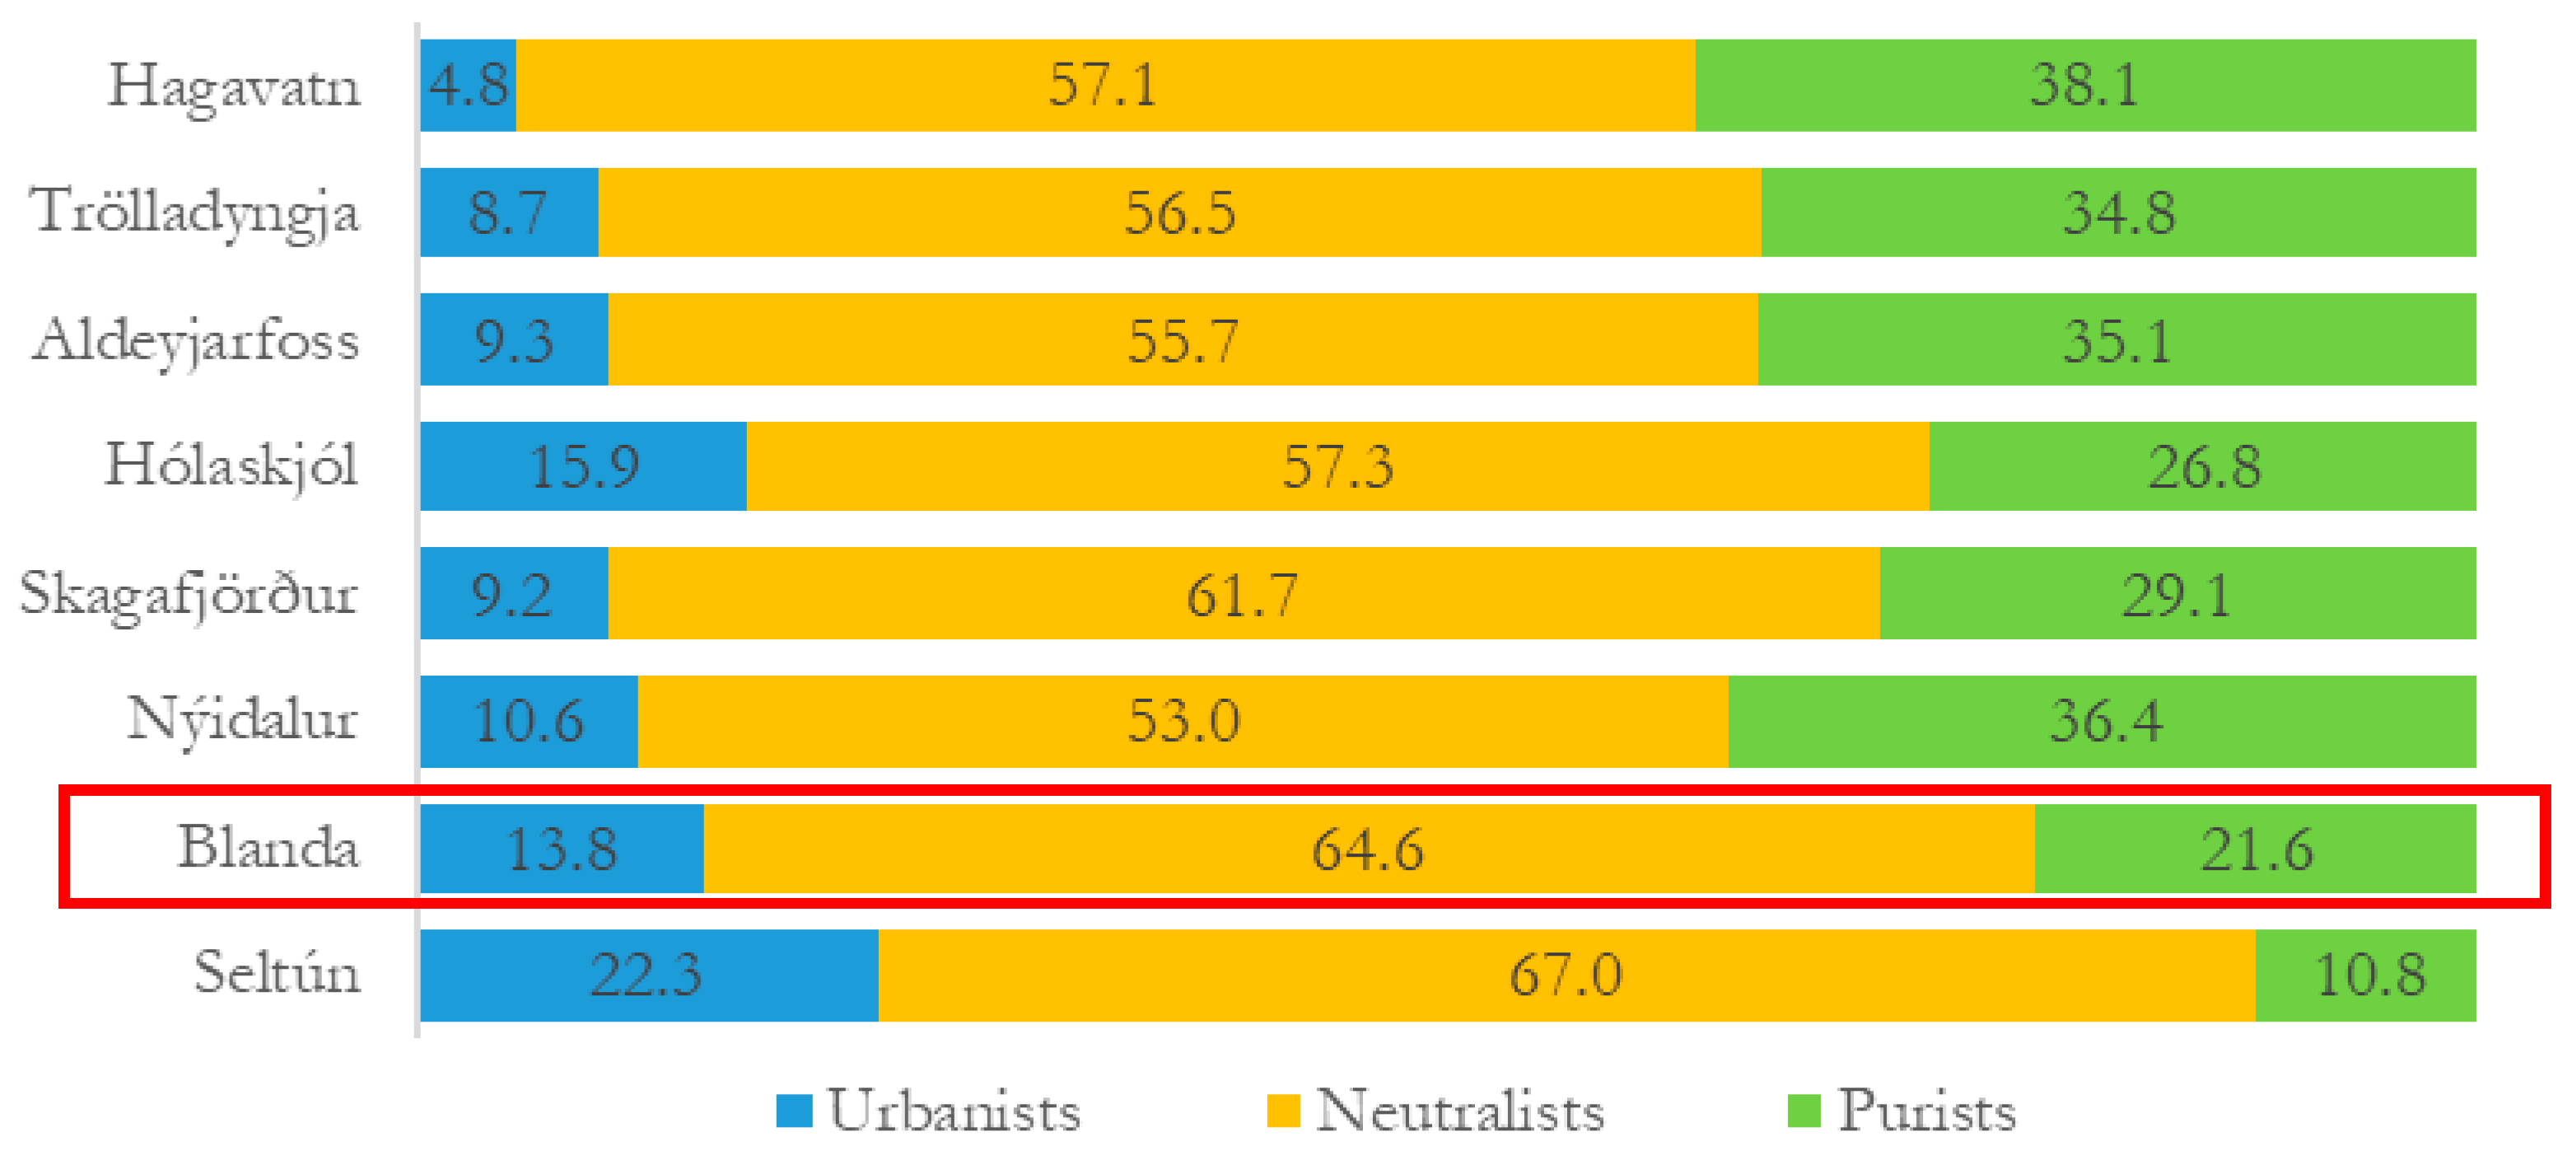
  • Background questions regarding age, gender, residence, and a question that categorizes tourists into purists, neutralists, and urbanists on the purist scale.
  • Questions concerning the stay in the area, e.g., experience and attraction and whether wilderness was part of that.
  • Questions about appropriate infrastructure in the research area.
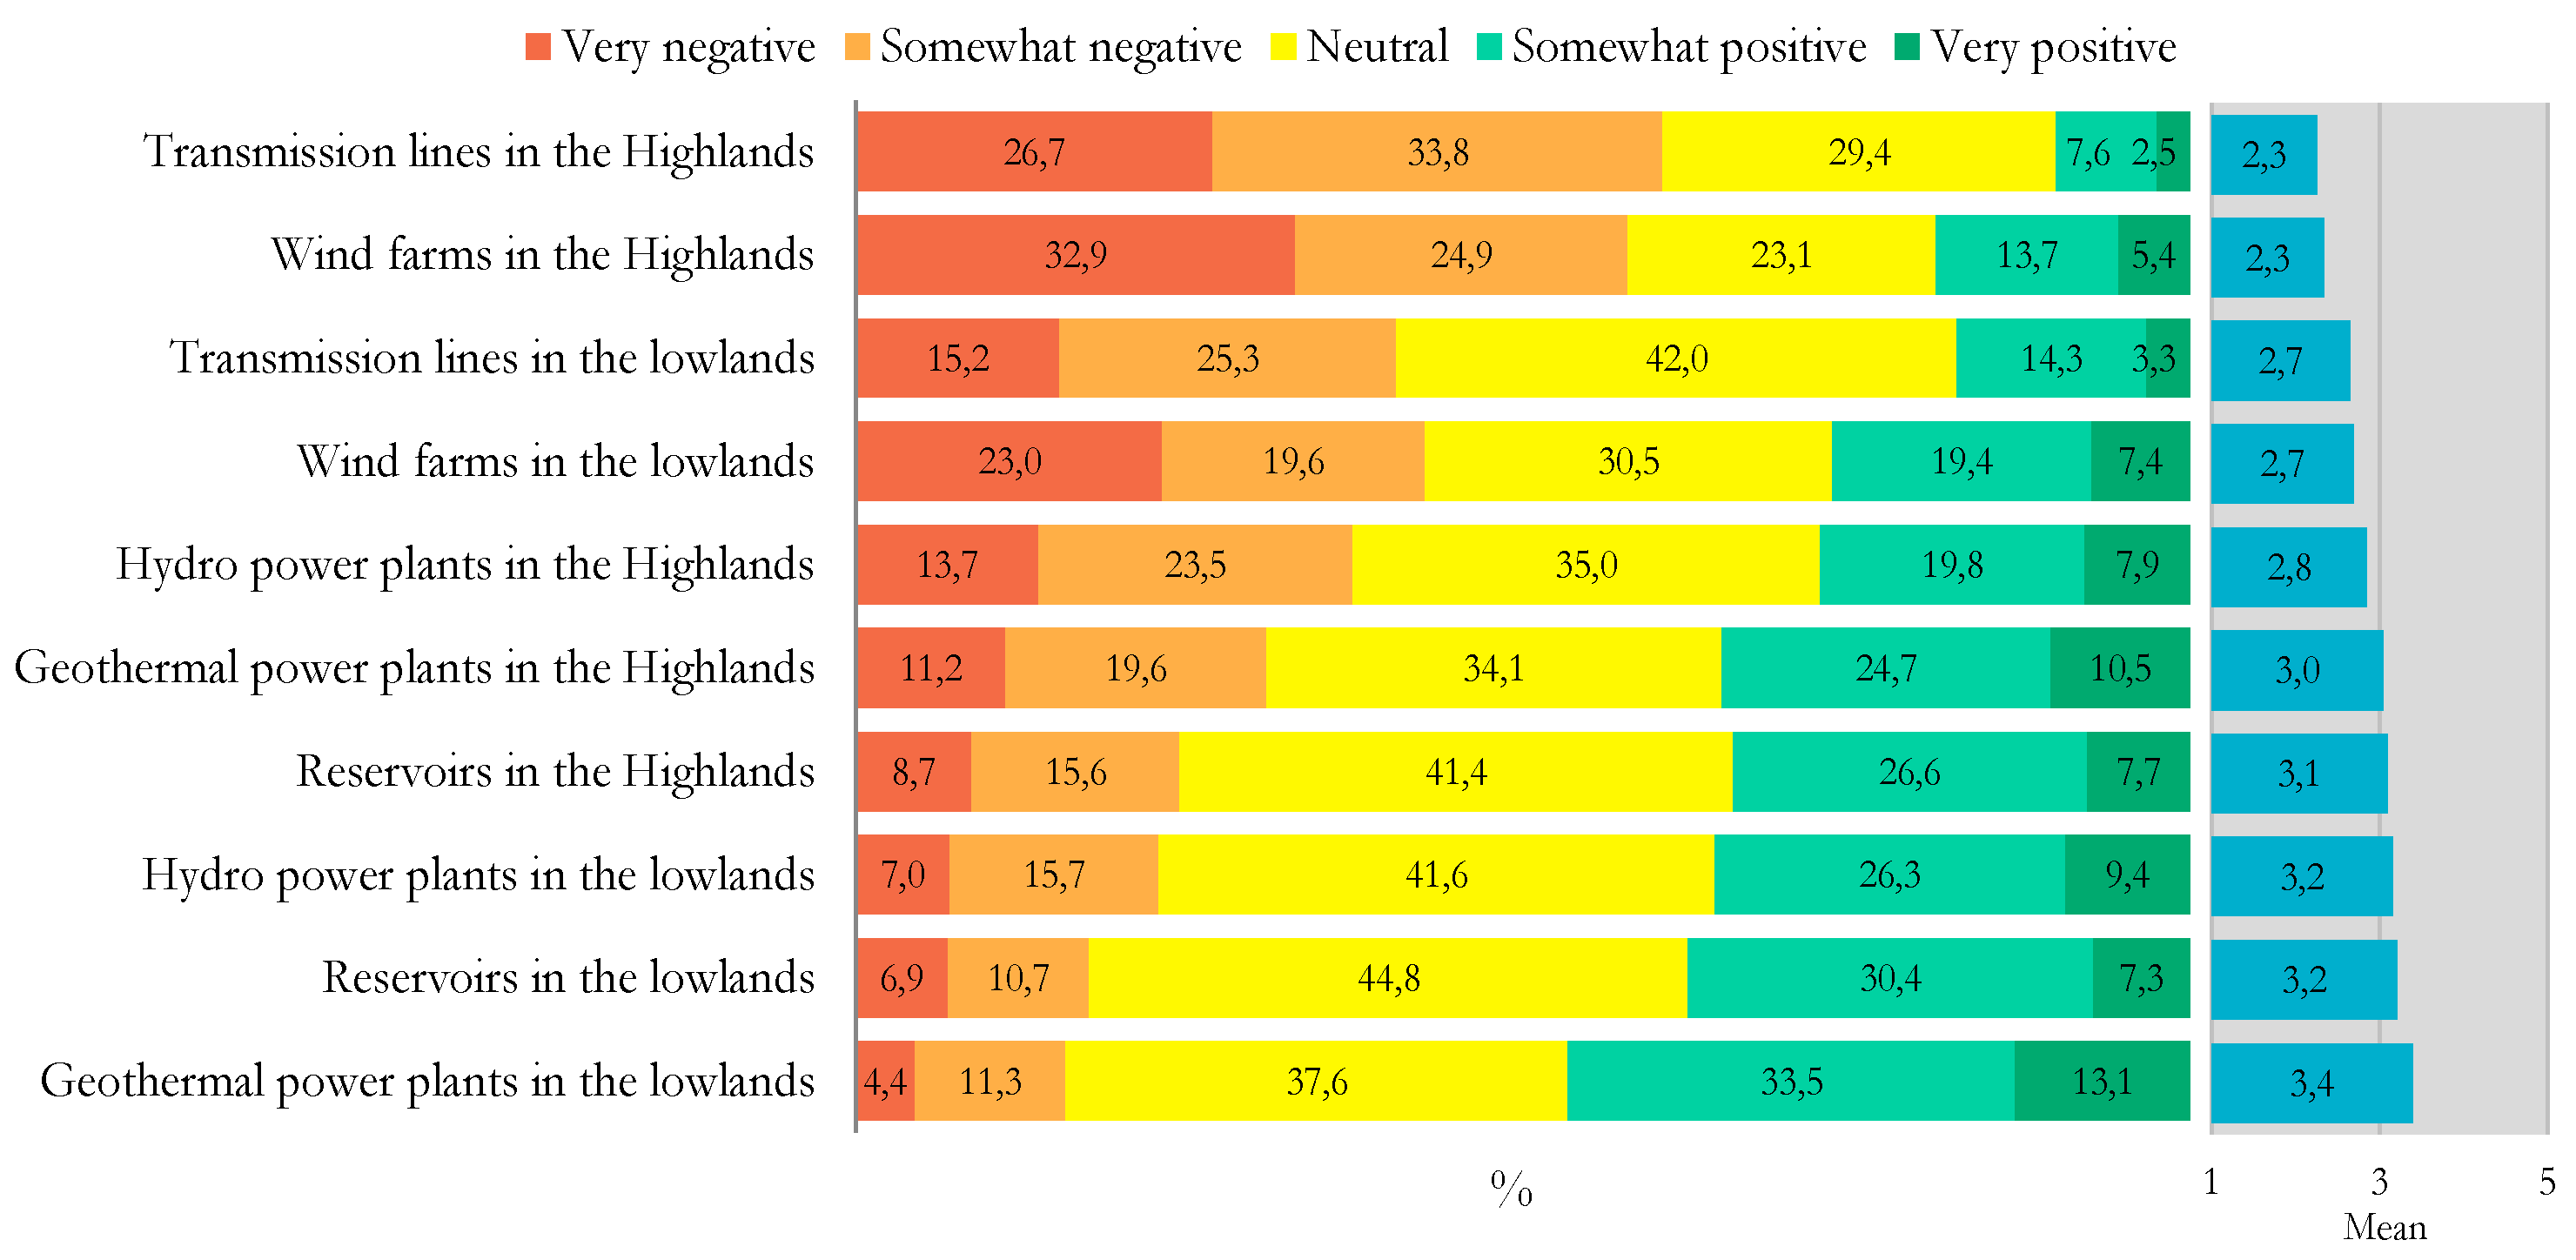
  • Questions about attitudes towards the construction of the various types of renewable power and whether the production should be in the Highlands or in Lowlands.
  • Questions regarding attitudes towards Blanda Power Station and its impact on tourists’ experience.
  • The impact of further harnessing of energy on tourists’ interests in returning to Iceland.
The questionnaires contained a few questions that included the word ‘area’, as in, for example, “how do you perceive the area?” and “do you think wilderness is a part of the appeal of the area?” It has been an acknowledged dilemma in similar research that tourists place distinct meaning to the concept of an area [56]. In this research concerning the impact of the Blanda Power Station on the experience of tourists, the area in question is not an officially defined area with borders in the manner of a nature reserve or a municipality. In order to assist the tourists in realizing what particular area was under discussion, a map of the research area and the infrastructure pertinent to Blanda Power Station was handed out to the respondents along with the questionnaires (Figure 1). The northern border of the area that is shown on the map is right north of the power station main building and its outgoing transmission line, while the southern border is just south of the southern part of the Blöndulón reservoir. Kjalvegur mountain road can be seen in the middle of the map and the eastern and western borders of the area reach approximately 5 to 15 km east and west off the road.
However, not all individuals are equally proficient at reading a map and what is more, not all of the respondents dedicated much time to reviewing the map. Therefore, it is likely that on some occasions the questions relating to a specific area have been answered in view of the respondent’s own definition of the area. This is, for example, rather obvious in a question regarding the duration of the tourists’ stay in the area where it says that the respondents have stayed on average 2.6 nights in the area and that day tour visitors have stayed on average 3.4 h. Here the respondents must have had a much larger area in mind than the one the researchers were asking about and showed on the map that went along with the questionnaire.
A few questions were open and this gave respondents an opportunity to answer in their own words. However, the majority of the questions were multiple-choice closed-ended questions based on a five-point Likert scale, i.e., 1 = strongly disagree, 2 = disagree, 3 = neutral, 4 = agree, 5 = strongly agree. Certain means were calculated from the results in order to make a comparison between different aspects possible.
The data was analyzed for information as to whether there was a statistically significant difference between tourists’ answers depending on gender, age, nationality, place of residence in Iceland (capital versus rural areas), means of travel, duration of hiking tours, overnight and day tour visitors, along with the categories of the purist scale (urbanists, neutralists, purists, strong purists). The answers were also analyzed according to whether the tourists were arriving through the Highlands from the south or on their way to the Highlands from the north, after the season (summer and autumn), as well between first-time visitors and repeat visitors. Research was conducted related to pending power station projects in the summer of 2015, which was partly based on a similar questionnaire as the one presented here [57]. That research was executed at seven areas. In the following analysis of the data a comparison is made between the answers from respondents at Blanda Power Station and each of these seven areas. This kind of comparison, i.e., between the opinion of tourists at an area where hydroelectric power plants have already been constructed and at places where there are proposals to construct power plants has, according to our knowledge, not been made before. Due to hydroelectric power plants’ potential effects on tourism, and the likely growth of both sectors in the future, it is vital to have a better understanding of tourists’ perception of the impact of power plants on the destination.
Obviously, a comparison between different locations is always challenging as no two places are identical. The types of tourism activities and main attractions in the seven comparison areas are different (Table 1). The seven comparison areas have different degrees of medium to high naturalness. Two of them are in the center of the Highlands (Hagavatn and Nýidalur) with only a mountain hut in the vicinity and a dirt road passing by. Three are in the Lowlands (Trölladyngja, Skagafjörður and Seltún). Skagafjörður is an accessible rural area with farms and agriculture. Seltún and Trölladyngja are reachable in about 30 min from the capital area by car. Seltún is accessible by an asphalted road and is a kind of mass tourism destination for international visitors. Trölladyngja, on the other hand, can be reached by a dirt road and is mostly visited by domestic visitors. Two of the comparison areas (Aldeyjarfoss and Hólaskjól) are similar to Blanda by being at the edge of the Highlands. Although Blanda is the only place where a power plant has been constructed, there are some reservoirs approximately 13–15 km away from Nýidalur (Figure 2).
In order to examine whether there were differences between the abovementioned variables, a t-test was employed where there were only two groups (for example, gender and daytrip versus overnight visitors), while an ANOVA was used were there were three or more groups (for example, Nonpurists, neutralists and purists). In the cases where the ANOVA showed significant dissimilarities within a parameter the difference between specific groups was located through a post-hoc test. A Hochberg’s GT2 was employed if the variance was the same and a Games–Howell post-hoc test if they differed [58].
In the following presentation of the results, the main outcome from the Blanda sample is displayed in a chart and underneath a table with the mean and the standard deviation as well as the results from the various statistical analyses. In the discussions the significant difference is set at a p-value below 0.05.

4. Results

4.1. Tourists’ Perception of the Naturalness of the Area

Tourists were asked an open question concerning what fascinates them about the area. The responses to this question were diverse, however, after encoding, ten categories emerged that reflect the most common answers. Some categories overlap, furthermore the responses of many fall under more than one category and therefore the total ratio is higher than 100%. What attracts most, or 52% of the respondents, is the view, open vast spaces, and beauty. Many (36%) say that they are attracted to the landscape and nature, while 26% mention the wilderness and uninhabited areas. About 13% list quietude and solitude, whereas plants and animals are named by 10% of the respondents. About 7% of tourists say that water appeals to them and four individuals specifically mentioned the reservoirs of Blanda power station. Of note, 6% mentioned areas outside the defined research area, shown on the map that followed the questionnaire, like the geothermal area Hveravellir, which is about 30 km away—a two-hour drive south of the reservoir Blöndulón. About 3% of respondents state that driving through the area is appealing to them and the same proportion mention harnessing of energy and/or green energy as an attraction.
A vast majority, about 92% of tourists in the vicinity of Blanda Power Station, feel that wilderness constitutes a part of the appeal of the area, 4% do not consider wilderness as a part of the attraction, while another 4% have no opinion on the matter. In comparison to the research areas of pending power station projects in the summer of 2015 [57], wilderness makes up for less of the appeal in the area surrounding Blanda Power Station. The areas where wilderness is regarded as a part of the attraction by the highest ratio of respondents are Aldeyjarfoss, Hagavatn and Nýjidalur (98%), followed by Hólaskjól, Seltún, Skagafjörður and Trölladyngja (93–96%), with Blanda with 92%.
Approximately 79% of the respondents go to the Blanda area to experience wilderness, 14% do not visit the area for this purpose and 8% are neutral to this question. A comparison with the research areas related to pending power station projects in the summer of 2015 shows that Blanda and Seltún are less visited to experience wilderness than the other locations. About 79% go to Blanda and Seltún to experience wilderness, compared with 92–94% of those that visit Aldeyjarfoss, Nýjidalur and Hagavatn, and 87–89% of Hólaskjól, Trölladyngja and Skagafjörður.
An analysis of visitors’ attitudes, according to Stankey [59] Purist sScale, shows that there is a statistically significant difference between the average score in the eight areas (anova test F = 24,768, p < 0.001). Blanda is visited by fewer purists than the other locations, except Seltún, since purists are about 22% of all visitors in the Blanda area and 11% at Seltún. At the other locations the proportion of purist–urbanist is rather similar with about 27–38% being purists (Figure 3).
Tourists at Blanda were asked whether they felt that nearby infrastructure, that they know of but is out of sight, affects their experience of the wilderness/unspoilt nature of the area. The largest group, 47% of respondents, does not feel that nearby infrastructure affects their experience if it is out of sight and 32% consider it to have little effect. Less than 13% consider that it affects their experience somewhat, while 5% believe it affects their experience rather much and 4% say that it affects their experience very much.
Tourists in the vicinity of Blanda Power Station were also asked what infrastructure, or signs of human interference, could be present without the concepts ‘wilderness’ or ‘unspoilt nature’ losing their meaning. It was possible to select more than one option. According to 21% of tourists no signs of human interference could be present. On the other hand, over 80% feel that the presence of mountain huts and tracks by hikers and sheep do not make wilderness meaningless, 60% consider road tracks to be permissible and 56% man-made walking paths. Fewer (40%) regard reservoirs, fences (39%) and roads (33%) as permissible and ever fewer consider transmission lines (19%), visitor centers (14%), transmission towers (14%), power stations (12%), wind turbines (11%), and hotels (7%) as acceptable infrastructure without the concepts of wilderness/unspoiled nature losing their meaning.
The respondents were asked to describe whether they considered the research area around Blanda power station was natural or developed. About 63%, consider the area very natural, while 26% consider it rather natural. About 7% of tourists regard the area as rather or very artificial and 4% are neutral towards this question (Table 2). However, all of the places used from the 2015 research were perceived to be more natural [57]. The attitude of tourists at Blanda Power Station did differ according to age, although the multilateral comparison does not show a difference between specific groups. There is also a distinction in attitudes depending on nationality, as Icelandic respondents consider the area less natural than the French, Germans, Austrians/the Swiss, Americans/Canadians, Beneluxians, the British/Irish and those that are categorized as “other nationalities”. Neutralists regard the area as more natural than purists and those travelling in a private vehicle consider it less natural than those travelling in a rented car or on a tour bus. Those that have not visited the area previously consider it more natural than those that have been there before, while those that walked for three to five hours regard the area as more natural than the groups that walked for less than three hours. Tourists that were coming through the Highlands from the south along Kjalvegur also felt that the area was more natural than those going to south. Other parameters showed no statistical significant difference.

4.2. The Impact of Blanda Power Station

Tourists at Blanda Power Station were asked what impact the fact that the river Blanda has been harnessed had on their interest in travelling in the area. About 67% of the respondents stated that the power station has no effect on their interest in travelling in the area. Those that say the power station has a positive effect on their interest are more numerous (19%) than those that say it has a negative effect (13%). There is no statistical difference between groups regarding this subject except that it had a more positive impact on urbanists and neutralist than purists.
Tourists were asked whether they had noticed any infrastructure on their way through the area, the options being no or yes. About 90% of respondents said they noticed infrastructure, while 10% stated that they had not seen any infrastructure. Those that responded in the affirmative were then asked to specify what impact certain types of infrastructure, such as reservoirs, dams, canals, transmission lines, asphalt road and gravel road, had on their experience. The available options were that the effect was very negative, somewhat negative, no effect, somewhat positive and very positive.
Between 39–61% claimed that the various types of infrastructure had no effect on their experience (Figure 4). Transmission lines caused a much more negative effect on the experience of tourists than other infrastructure whereas about 54% said they had a negative effect. The reservoirs and the gravel road have a positive effect on the experience of 46–47% of those that notice them, and 10–13% say the impact was negative. The asphalt road was perceived somewhat more negatively. The dams and the canals had positive effect on 25–34% and negative on 14–21%.
In the following sections the responses to the question regarding the impact of all the various types infrastructure are analyzed in more detail.

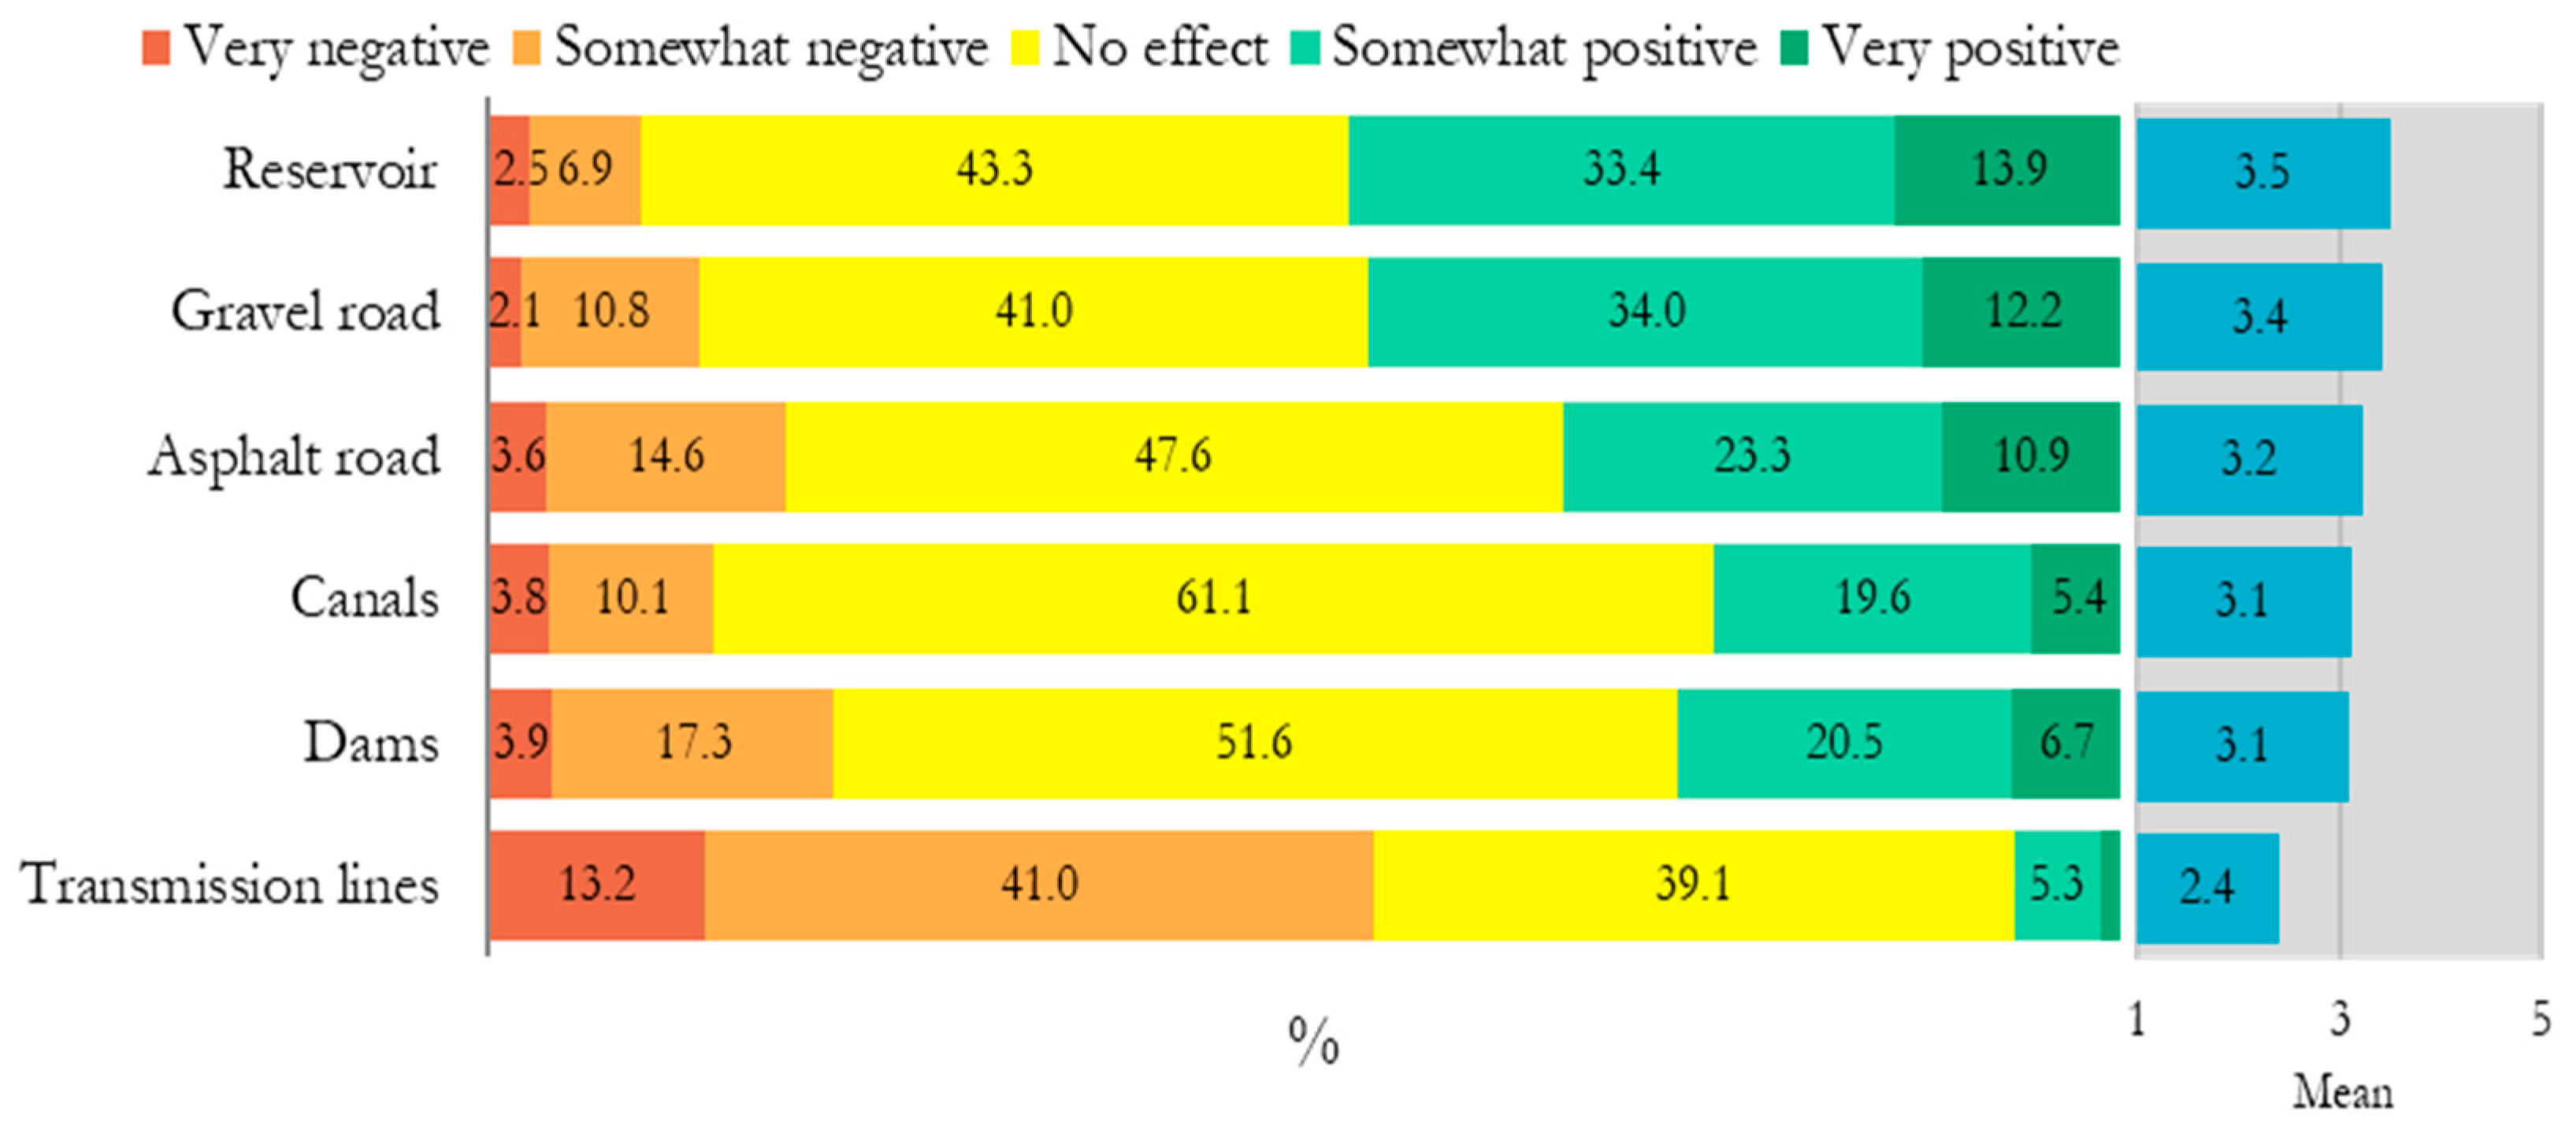
4.2.1. The Impact of Reservoirs on Experience

About 43% of tourists at Blanda Power Station state that the reservoirs have no impact on their experience of the area (Table 3). Approximately 47% say their impact was positive and 10% say it was negative. The reservoirs have a more positive effect on the French than Germans. They also have a more positive effect on urbanists and neutralists than purists. Furthermore, there is a difference in the experience of tourists depending on mode of travel, while the variance between different groups is not significant according to a multilateral comparison. Other parameters showed no statistical significant difference.

4.2.2. The Impact of a Gravel Road on Experience

About 46% of tourists by Blanda Power Station say that the gravel road had a positive effect on their experience of the area, 41% say the gravel road had no impact, while 13% say the impact was negative (Table 4). The gravel road had a more positive effect on neutralists and purists than urbanists. It also has a more positive effect on purists than strong purists. Tourists travelling in buses are affected more negatively by the gravel road than those using other means of transportation. Moreover, the gravel road has a more positive effect on the experience of tourists during the summer than during the autumn. Other parameters showed no statistical significant difference.

4.2.3. The Impact of An Asphalt Road on Experience

Almost half of tourists by Blanda Power Station, or 48%, say that an asphalt road has no impact on their experience in the area, 34% say it impacts positively, and 18% say the effect is negative (Table 5). Tourists’ attitude towards an asphalt road varies depending on their age group according to an ANOVA test, however, a multilateral comparison does not detect a significant difference between groups. An asphalt road has a more negative impact on purists than neutralists and urbanists. Furthermore, it has a more positive effect on those southbound than on those heading north through Kjölur. Other parameters showed no statistical significant differences.

4.2.4. The Impact of Canals on Experience

A majority (61%) of tourists in the vicinity of Blanda Power Station say that canals connected to the power station do not affect their experience of the area (Table 6). About 25% of respondents state that the canals have a positive effect and 14% say they affect their experience in a negative manner. There is a difference between the attitudes of tourists towards canals depending on their age group according to the ANOVA test. Nevertheless, a multilateral comparison does not detect a significant difference between groups. The canals have a more negative impact on purists than on neutralists and urbanists. Other parameters showed no statistical significant difference.

4.2.5. The Impact of Dams on Experience

Over half of tourists, or 52%, in the vicinity of Blanda Power Station say that dams do not impact their experience in the area, 27% say a dam impacts them in a positive manner and 21% say the effect was negative (Table 7). The age variant is at the alpha level according to an ANOVA test, while a multilateral comparison does not show a significant difference between groups. The presence of dams has a more positive effect on urbanists than other groups and it also has a more positive effect on neutralists than purists. Other parameters do not show a significant difference.

4.2.6. The Impact of Transmission Lines on Experience

Transmission lines had a negative impact on the experience of 54% of tourists at Blanda Power Station (Table 8). Approximately 39% of tourists say they are unaffected by the transmission lines, while 7% say their effect is positive. The transmission lines had a less negative effect on the experience of tourists that are 66 years old and older than on all the other age groups except the second eldest, 56–65 years old. The transmission lines had a greater negative effect on the French respondents than Germans and they had a less negative effect on urbanists than the other groups on the purist scale. The transmission lines had a less negative effect on neutralist than on purists and strong purists and a greater negative effect on those travelling in a rental car than on those on tour buses. Additionally, they had a more negative effect on those who had travelled over the Highlands to the north on Kjalvegur than on those travelling southbound. Other parameters showed no statistical significant difference.

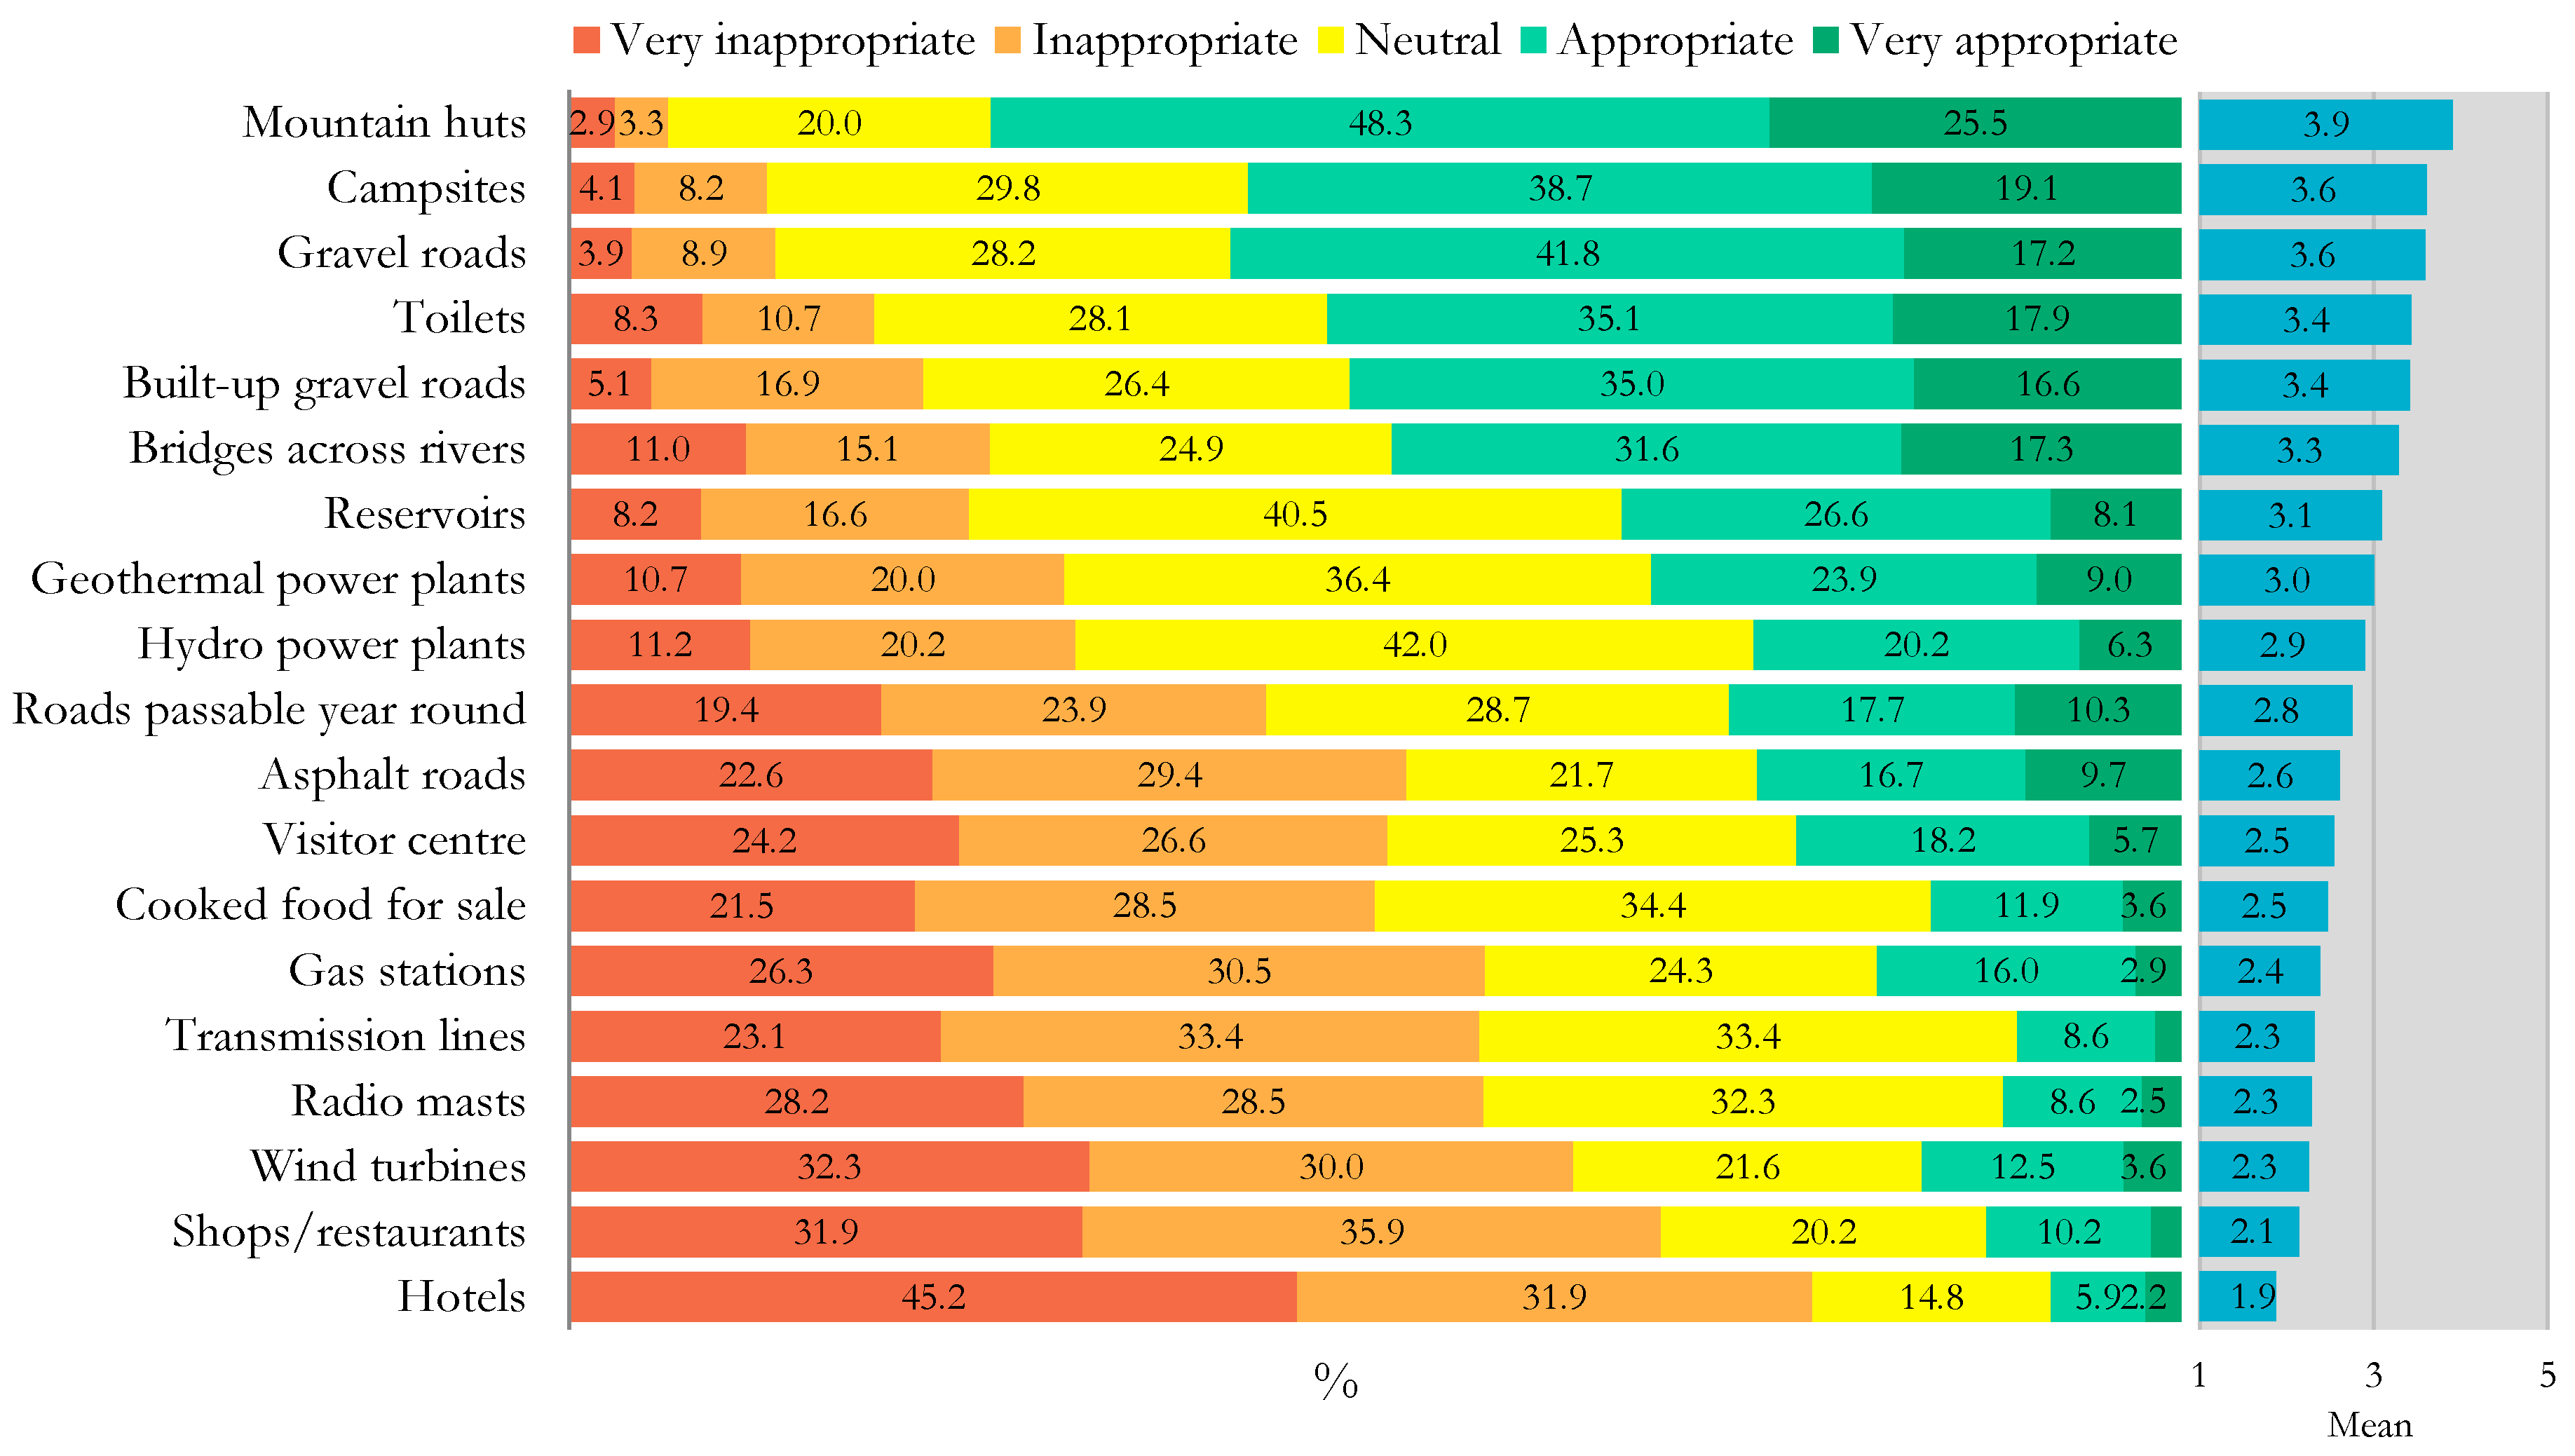
4.3. Desirable Infrastructure in the Area

Tourists were asked how desirable they considered 19 different types of infrastructure in the Blanda Power Station area. Mountain huts are the structures that the respondents regard as most desirable in the area, as 74% consider them rather or very desirable. Camping sites (58%) and gravel roads (59%) are also considered to be desirable infrastructure in the area. The infrastructure felt to be least desirable in the area were hotels, since 77% regard them to be rather or very undesirable. Stores and restaurants are undesirable according to 68% of the respondents and wind turbines (62%), transmission towers (57%) and transmission lines (56%) are also among the least desirable infrastructure in the area (Figure 5). Less than one-third regard hydroelectric power stations in the area as undesirable, while over a quarter of the respondents consider them desirable and 42% find them acceptable.
Of the abovementioned those constructions that belong to power production were analyzed further here below:

4.3.1. Reservoirs

Reservoirs are considered acceptable according to 41% of tourists to the Blanda Power Station area, 27% regard them as rather desirable and 8% find them very desirable (Table 9). Approximately 25% consider them to be undesirable in the area. Reservoirs are felt to be more desirable by Blanda Power Station then at all the locations that were studied in the 2015 research except Seltún [57].
The 26–35 years old age group considers reservoirs as less desirable than the youngest and oldest groups, i.e., those 25 years old and younger and those who are 66 years old and older. Icelanders regard reservoirs as less desirable than the French, Americans/Canadians, Beneluxians, Visegrád Group inhabitants, and the British/Irish. Germans also find them less desirable than the French, the Swiss/Austrians, Americans/Canadians, Beneluxians, Visegrád Group inhabitants, and the British/Irish. Urbanists and neutralists consider reservoirs as more acceptable than purists and strong purists. Those travelling in a rental car find them more acceptable than those travelling in a private vehicle. Moreover, those that have visited the area previously regard reservoirs as less desirable than those visiting it for the first time. Other parameters showed no statistical significant difference.

4.3.2. Geothermal Power Stations

Geothermal power stations are considered acceptable by 36% of respondents, 24% regard them as rather desirable and 9% find them very desirable (Table 10). Approximately 31% find them undesirable. Geothermal power stations are regarded as more acceptable by tourists by Blanda Power Station than by tourists at all of the research areas in the study of 2015. In the vicinity of Blanda Power Station Icelanders consider geothermal power stations to be less desirable than the French, the Swiss, Austrians, Americans/Canadians, Visegrád Group inhabitants, the British/Irish and those pertaining to the group “other nationalities”. German respondents also regard them as less desirable than Americans/Canadians and the British/Irish. Urbanists and neutralists find geothermal power stations more desirable than purists and strong purists. Moreover, purists regard them as more desirable than strong purists. The ANOVA test demonstrates a significant difference over this aspect between distinct modes of travel, while a multilateral comparison does not show a difference between modes of travel. Those that have visited the area previously consider geothermal power stations less desirable than those visiting for the first time. Other parameters showed no statistical significant difference.

4.3.3. Hydroelectric Power Stations

Hydroelectric power stations are regarded as acceptable by 42% of respondents, 26% find them desirable, while 31% find them undesirable (Table 11). Hydroelectric power stations are considered more acceptable by tourists in the vicinity of Blanda Power Station than at all the locations that were studied in the summer of 2015, except by Seltún. According to the results from an ANOVA test the average varies between age groups, while a multilateral comparison does not show a significant difference between certain age groups. Germans consider hydroelectric power stations less desirable in the area than Americans/Canadians and the British/Irish. Purists and strong purists also find them less desirable than urbanists and neutralists. Other parameters showed no statistical significant difference.

4.3.4. Transmission Lines

Transmission lines are felt to be undesirable according to 57% of respondents, 33% consider them acceptable and 10% consider them desirable in the area (Table 12). Tourists regarded transmission lines as being more acceptable in the Blanda Power Station area than in all of the locations under review in 2015, except at Seltún where they are considered more desirable than Blanda Power Station.
The French consider transmission lines less desirable in the vicinity of Blanda Power Station than the Swiss/Austrians, Americans/Canadians and the British/Irish. There is a significant difference between all of the groups in the purist scale regarding attitude towards transmission lines by Blanda Power Station. Those travelling northbound over Kjölur find transmission lines less desirable than those heading south. Other parameters showed no statistical significant difference.

4.3.5. Wind Turbines

Wind turbines are considered undesirable by 62% of respondents, 22% consider them acceptable, 13% find them rather desirable, and 4% regard them to be very desirable in the area (Table 13). Wind turbines are regarded as more acceptable by tourists at Seltún than in the vicinity of Blanda Power Station. Those 25 years-old and younger are more in favor of wind turbines in the Blanda Power Station area than those 46 years-old and older. Americans and Canadians consider wind turbines more acceptable than all other nationalities, except the British/Irish. Those classified as “other nationalities” also find wind turbines more acceptable than Icelanders, Germans, the French and Beneluxians. Moreover, Swiss/Austrian tourists consider them more acceptable in the area than Germans.
Purists are more opposed to wind turbines in the area than neutralists and urbanists. Those travelling in tour buses are also less in favor of wind turbines than those travelling in a private or rental vehicle. Overnight visitors regard wind turbines as less desirable in the area than those on day tours. Furthermore, those heading south on Kjölur find them less desirable than those travelling northbound. Other parameters showed no statistical significant difference.

4.4. Interest in Visiting Power Stations’ Visitor Centres

Respondents were asked about their interest in visiting the visitor centers of hydroelectic and geothermal power plants. Approximately 55% of tourists say they are interested in visiting such visitor centers, 13% are somewhat interested, 16% have little interest and 16% have no interest in visiting them. Strong purists are less interested in visiting than the other groups in the purist scale and purists are less interested than neutralists and urbanists. Those travelling in the area during the summer were more interested in visiting the centers than those travelling in the autumn. Other parameters do not show a significant difference.

4.5. Attitude Towards the Construction of Power Stations and the Impact of Further Harnessing of Energy on Tourists’ Interests in Returning to Iceland

Tourists’ attitudes towards the construction of power stations in Iceland were surveyed and if it mattered as to whether the power station is located in the Highlands or in the Lowlands (Figure 6). Tourists are most negative towards transmission lines and wind turbines in the Highlands with 58–61% being rather or very negative in their attitude towards them. The number of tourists that are negative towards transmission lines and wind turbines in the Lowlands and hydroelectric power stations in the Highlands is higher (41–43%) than those with a positive attitude towards them (18–27%). The respondents are most positive towards further development of geothermal power stations in the Lowlands, with about 47% being positive. Approximately 36% of tourists are positive towards further development of hydroelectric power plants.
Foreign tourists in the vicinity of Blanda Power Station were asked whether further harnessing of energy in Iceland would make it more or less likely that they would return to the country in the future (Table 14). About 75% state that further harnessing of energy would have no impact on their interest in travelling again to Iceland in the future. Approximately 19% of tourists say they would be less likely to return if there would be further harnessing of energy, while 7% would be more likely to return.
The French are less likely to return to Iceland because of further harnessing of energy than Germans, the Swiss/Austrians, Americans/Canadians, Visegrád Group inhabitants, Italians/Spaniards, the British/Irish and those classified as “other nationalities”. Urbanists are more likely than any of the other purist scale groups to return in spite of further harnessing of energy. Neutralists are also more likely to do so than purists. Those travelling over the summertime are more likely to return if further harnessing of energy occurs than those travelling in the autumn. Other parameters do not represent a significant difference.

5. Discussion

5.1. Tourism and Hydroelectric Power Plants

This study seeks to analyse how tourists perceive a hydroelectric power plant in natural environment. It furthermore evaluates if it reduces the attractiveness of a nature destination, as is often assumed [3], by reducing its wilderness qualities, namely naturalness and remoteness. The method used for the paper, i.e., to ask tourists en route while they drive through an area with various hydroelectric power plant infrastructure is quite innovative and provided useful information. The results showed that despite the fact that 90% noticed the power plant infrastructure at Blanda it did not seem to particularly affect the experience of the tourists. About 39–61% of respondents claim it had no effect, depending on the type of infrastructure. Transmission lines have the most negative effect on tourists’ experience as 54% claimed they had a negative impact. This is in keeping with other research conducted in Iceland [13,40,57], as well as abroad [29,60,61], that show transmission lines are the least desirable infrastructure in natural areas. This study furthermore indicates that the transmission lines had a more negative effect on the experience of the tourists that came from the Highlands, i.e., those that had been driving in the area with no permanent human settlement for 4–6 h than those who just left the inhabited lowland. It is noteworthy that those coming from the Highlands are just about to see the transmission lines when they are finishing answering the questionnaire while the ones coming from the Lowlands have had them in their sight for a while and even driven under them shortly before answering the questionnaire. This might be an indication that being in the wilderness makes you more sensitive towards human artefacts and constructions in the landscape compared to being in a cultural landscape.
These results are in keeping with an Icelandic study on the effect of transmission lines on tourists [40] which showed that tourists are more negative towards transmission lines in the Icelandic Highlands than in the Lowlands. Both studies [40] indicated that when it comes to the impact of transmission lines French respondents were very sensitive towards them. Nevertheless, this study does not show the variance between the attitudes of Icelanders and the other inhabitants of Nordic countries, that the other Icelandic study [40] showed with respect to the strongest opposition to transmission lines.
This study also suggests that other types of infrastructure had a limited negative impact as 10–20% claimed them to have a negative effect on their experience. The gravel roads and the reservoirs raised positive feelings among about 46–47%. A few visitors even praised the lake/the reservoir as it presented a variation from the interminable sandy desert. The French tourists experience the reservoirs more positively than other nationalities, while the transmission lines had the most negative effect on their experience. Approximately a quarter of the respondents claimed that the canals and dams had a positive effect on their experience.
Despite the power plant infrastructure in the area most tourists regard the area as very natural, although 7% of tourists consider it developed. Nonetheless, in comparison with the seven locations studied in 2015 the Blanda area is considered less natural. The power plant does not seem to impair the image of the central Highlands as the vast majority of tourists, or 92%, consider wilderness a part of the attraction of the area. Nevertheless, in comparison with the locations in 2015 [57], wilderness is regarded as being less a part of the appeal of the area in the vicinity of Blanda Power Station.
About 40% of tourists did not feel that the presence of reservoirs causes the concepts of wilderness and unspoilt nature to lose their meaning, 19% consider the presence of transmission lines to be permissible and 12% that of power stations. Still, the visibility of infrastructure is important for tourists, since just under half of them consider the infrastructure they are aware of but is not visible still affect their experience, while about a third feel that it has little effect, 13% say it has some effect, 5% state that the impact on their experience is rather significant and 4% regard it to be very significant. This situation reflects the idea of nature as a social construct, which suggests that the subjective reality of tourists is to a large extent based on preconceived ideas they have regarding the area. In light of this, the image of Iceland’s central highlands as an unspoilt wilderness [25], could render foreign tourists oblivious to reality, i.e., they do not seem to notice the infrastructure present in the area they were travelling through. As Priestley and Evans [62] point out, people have a tendency to overestimate the actual visual impact of energy infrastructure they feel negatively towards.
Even though the existing power plant infrastructure around Blanda does not disturb tourists all that much, 37% of tourists are negative towards further construction of hydroelectric power stations in the Highlands, 35% are neutral and 28% of the respondents are positive towards further construction. Still, tourists at Blanda Power Station are more positive towards further hydroelectric power developments in the Highlands than the tourists at all the locations in 2015, except those by Seltún [57]. Similar trends can be seen in the results regarding the development of hydroelectric power stations in the Highlands as towards the current infrastructure. That is, purists, the French, and those that have visited the area previously, are more negative towards hydroelectric power stations and geothermal power stations in the Highlands as well as in the Lowlands than those that are visiting for the first time. This situation reflects Vorkinn and Riese [22] work, which suggests that the more people feel attached to an area the more negative they are towards proposed power plants.

5.2. Explanation of the Results

Various explanations can be provided to help explain these results. One is that possibly the design of Blanda power plant and accompanying structure is good and well-adjusted to the landscape. Another reason for why the power infrastructure in the Blanda area causes little disturbance to the experience of tourists could be its locational setting. The landscape is homogenous and does not have some major natural attractions as at some of the other destinations, i.e., where there is a waterfall, which would disappear if the proposed hydroelectric power plant would be built.
The statistical comparison made in this study between the attitudes of tourists in the Blanda Power Station area and the seven research areas in 2015 showed that there is a difference between these locations since the attitude at Blanda towards power plants is more positive. There is one exception, which is Seltún. Tourists at Blanda (and Seltún) are dissimilar to those at the other locations when it comes to the division of tourists according to the purist scale, as at Blanda (and Seltún) there are fewer purists and more urbanists and neutralists than at the other six areas. Consequently, it appears that those who have the highest demands for what can be considered unspoilt nature visit the Blanda area to a lesser extent than the other areas (except Seltún). One of the possible explanations for this could be self-selection, given that tourists are aware that a power station has been constructed at the northern edge of the Central Highlands. Thus, those who have high demands for unspoilt nature avoid travelling to the Blanda area and direct their travel somewhere else in the Highlands. Accordingly, it is possible that the Blanda Power Station has diminished the areas’ attraction for purists. Indications from other research suggest that a certain type of tourist stops visiting an area after power stations have been constructed. For instance, the research of Devine-Wright [27] has shown that alterations in the landscape of areas that are in opposition to the image and experience that individuals connect with them can lead to their abandonment of the areas.
This study showed that all types of power plant infrastructure had greater negative effects on purists than on urbanists and neutralists. This study, as well as others in Iceland [14,37,49], have also shown that the types of tourists travelling to the various parts of the Highlands of Iceland vary substantially, mostly according to the accessibility of the destinations. Destinations seem to appeal to different users not only depending on their accessibility, which goes hand-in-hand with the installations and infrastructure on site, but also the number of tourists. Increased access to tourist destinations is often a side effect of power plant developments, which then changes the type of tourism and what kind of tourist visits the area, as well as the overall number. An example of this can be seen in Landmannalaugar, the most visited highland destination, where access was increased after the harnessing of energy in the area of Tungnaá and Þjórsá in the late 1960s. As a result, the area is relatively accessible and has become well-known among travellers who come to Iceland. The number of tourists visiting the area is quite high and fewer purists visit the area now and instead seek more secluded areas [55]. It is therefore possible that, at Blanda, certain tourist types (purists) have moved away from the area to more remote and more natural locations as has happened in Landmannalaugar [14,55].
At the same time, a new type of tourism has started at the river Blanda, which is salmon angling. Before the hydroelectric power station was built, a lot of sediments were transported by the glacial river so the water was gray and even though salmon was in the water it could not see the bait. But when the river was stilled behind the dams the sediments it contained sank to the bottom of the reservoir. Since the power plant was built, the river has become clearer and is now one of the best salmon rivers in Iceland. Over half of tourists in the vicinity of Blanda Power Station state their interest in visiting power stations visitor centers while travelling in Iceland. Urbanists and neutralists are more interested in such visits than purists. Three out of every four tourists feel that further harnessing of energy would not affect their interest in a second trip to Iceland, while a fifth of tourists believe that it would make them less likely to return. There is a considerable difference between the impact of further energy production on tourists, depending on whether they are purists or urbanists. These results suggest that further energy infrastructure would have a more positive than negative effect on the interest of urbanists in travelling to Iceland, while the impact on purists would be negative. Moreover, the impact of further harnessing of energy would be more negative on the French than on most other nationalities with the French less likely to return to Iceland if more power stations are constructed.

6. Conclusions

The results of the study provide interesting insights into how tourists perceive the impact of energy infrastructure in areas with high naturalness values. The main findings of this study are that most tourists in the vicinity of Blanda Power Station are satisfied with their stay in the area, while 8% are dissatisfied with the main attractions of the area: natural beauty, vast open landscape, quietude and calm. In spite of the fact that Blanda Power Station is on the edge of the Central Highlands, close to inhabited areas and power infrastructure, such as reservoirs, dams, canals, roads, and transmission lines can be found there, 92% of tourists consider unspoilt wilderness a part of the attraction of the area. Nevertheless, this percentage is lower than at the locations of the comparative 2015 research [57]. Accordingly, Blanda Power Station does not seem to impair the Central Highlands’ image as unspoilt wilderness for the tourists passing through the area. Up to 87% of tourists say they did not notice the power station and its appendant infrastructure.
Most tourists find the area surrounding Blanda Power Station natural, although 7% of tourists consider it artificial. Approximately 67% of tourists’ state the existence of the power station does not affect their interest in travelling in the area, while a slightly higher percentage of respondents say the effect is positive (19%) rather than negative (13%). Therefore, perhaps unsurprisingly, over half of tourists in the vicinity of Blanda Power Station claim to be interested in visiting a power station visitor center while travelling in Iceland. With respect to the application of the purist scale, 65% of the tourists in the vicinity of Blanda Power Station are neutralists, 20% are purists, 14% urbanists and 1% strong purists. There were considerably more purists at all of the research areas in the study of 2015, except at Seltún [57].
These results are significant in the Icelandic context given the current substantial increase in visitors to the country, the majority of which identify nature as a major reason for visiting, and debate over the extent to which tourism may be affected by planned and future hydroelectric and other energy developments. The results here suggest that, on the whole, hydroelectric infrastructure has only limited effects on tourist perception of high areas of naturalness, although transmission lines have been identified as having a far greater impact [44]. This does mean that with careful planning, including potentially the undergrounding of some transmission lines, hydroelectric developments may be relatively compatible with tourism in some circumstances. However, it should be stressed that the limitations of the study to this particular location and time of research, even given its comparisons to previous studies [57], may possibly reduce the applicability of the results in a wider context. Nevertheless, it appears that the research may significantly inform planning and policy debates with respect to the relationships between hydroelectric and other energy developments and tourism. In this context it is therefore very important to keep in mind that areas appeal to different user groups depending on their characteristics, as well as on what energy installations and infrastructure are in place. Therefore, it must be considered what group of tourists makes use of an area when the impact of infrastructure on experience is being researched and, in a wider tourism planning and marketing context, what type and number of tourists are being sought.

Author Contributions

A.D.S. conceived and designed the surveys; A.D.S. and C.M.H. wrote the paper.

Acknowledgments

Landsvirkjun funded the data gathering used in the study. The University of Iceland and Landsvirkjun covered the costs of open access publishing. Silja Gunnarsdóttir and Sigurbjörg Eðvarðsdóttir helped gather data; Anna Mjöll Guðmundsdóttir and Hulda Þorsteinsdóttir set the data into SPSS; Þorkell Stefánsson helped analyse the data; Adam Hoffritz made the maps; Zsófia Cságoly and Þórhildur Heimisdóttir also provided assistance.

Conflicts of Interest

The authors declare no conflict of interest.

References

  1. Klöpper, Y. Southeast Asian water conflicts—From a political geography perspective. Asia Eur. J. 2008, 6, 325–343. [Google Scholar] [CrossRef]
  2. Nadaï, A.; van der Horst, D. Introduction: Landscapes of energies. Landsc. Res. 2010, 35, 43–155. [Google Scholar] [CrossRef] [Green Version]
  3. Tveit, M.; Ode, Å.; Fry, G. Key concepts in a framework for analysing visual landscape character. Landsc. Res. 2006, 31, 229–255. [Google Scholar] [CrossRef]
  4. Nadaï, A.; van der Horst, D. Wind power planning, landscapes and publics. Land Use Policy 2010, 27, 181–184. [Google Scholar] [CrossRef]
  5. Devine-Wright, P.; Batel, P. Explaining public preferences for high voltage pylon designs: An empirical study of perceived fit in a rural landscape. Land Use Policy 2013, 31, 640–649. [Google Scholar] [CrossRef] [Green Version]
  6. Van Veelen, B.; Haggett, C. Uncommon Ground: The role of different place attachments in explaining community renewable energy projects. Sociol. Rural. 2017, 54, 533–554. [Google Scholar] [CrossRef]
  7. Williams, D.R. The social construction of arctic wilderness: Place meanings, value pluralism, and globalization. Paper presented at the Wilderness in the Circumpolar North: Searching for Compatibility in Ecological, Traditional, and Ecotourism, Values, University of Alaska, Anchorage, AK, USA, 15–17 May 2001. [Google Scholar]
  8. Callicott, J.B.; Nelson, M.P. Introduction. In The Great New Wilderness Debate; Callicott, J.B., Nelson, M.P., Eds.; The University of Georgia Press: Athens, GA, USA, 1998; pp. 1–22. [Google Scholar]
  9. Proctor, J.D. The Social construction of nature: Relativist accusations, pragmatist and critical realist responses. Ann. Assoc. Am. Geogr. 1998, 88, 352–376. [Google Scholar] [CrossRef]
  10. Demeritt, D. What is the ‘Social Construction of Nature’? A typology and sympathetic critique. Prog. Hum. Geogr. 2002, 26, 767–790. [Google Scholar] [CrossRef]
  11. EIA, BETA. Total Renewable Electricity Net Generation. U.S. Energy Information Administration. 2015. Available online: https://www.eia.gov/beta/international/data/browser/#/?pa=000000000000000000000000000001&c=1028j008006gg61680a0a4k000e8ai00gg0004g800ho0008&ct=0&tl_id=2-A&vs=INTL.29-12-ALB-BKWH.A&vo=0&v=H&start=2013&end=2015 (accessed on 25 June 2018).
  12. Icelandic Tourist Board. Erlendir Ferðamenn á Íslandi Sumar 2016 [En: Foreign Tourists in Iceland during the Summer of 2016]; Icelandic Touris Board: Reykjavík, Iceland, 2016. [Google Scholar]
  13. Sæþórsdóttir, A.D. Tourism struggling as the Icelandic wilderness is developed. Scand. J. Hosp. Tour. 2010, 10, 334–357. [Google Scholar] [CrossRef]
  14. Sæþórsdóttir, A.D. Preserving wilderness at an emerging tourist destination. J. Manag. Sustain. 2014, 4, 65–78. [Google Scholar] [CrossRef]
  15. Sæþórsdóttir, A.D.; Ólafsdóttir, R. Planning the wild: In times of tourist invasion. J. Tour. Res. Hosp. 2017, 6. [Google Scholar] [CrossRef]
  16. Bishop, I. The Renewable Energy landscape: Preserving Scenic Values in Our Sustainable Future; Routledge: London, UK, 2017; (Preface). [Google Scholar]
  17. Sovacool, B. What Are We Doing Here? Analyzing fifteen years of energy scholarship and proposing a social science research agenda. Energy Res. Soc. Sci. 2014, 1, 1–29. [Google Scholar] [CrossRef]
  18. Tuan, Y. Topophilia: A Study of Environmental Perception, Attitudes, and Values; Columbia University Press: New York, NY, USA, 1974. [Google Scholar]
  19. Bridge, G.; Bouzarovski, S.; Bradshaw, M.; Eyre, N. Geographies of energy transition: Space, place and the low-carbon economy. Energy Policy 2013, 53, 331–340. [Google Scholar] [CrossRef] [Green Version]
  20. Proshansky, H.M.; Fabian, A.K.; Kaminoff, R. Place-identity: Physical world socialization of the self. J. Environ. Psychol. 1983, 3, 57–83. [Google Scholar] [CrossRef]
  21. Low, S.M.; Altman, I. Place attachment. In Place Attachment; Altman, I., Low, S.M., Eds.; Springer: Boston, MA, USA, 1992; pp. 1–12. [Google Scholar]
  22. Vorkinn, M.; Riese, H. Environmental concern in a local context: The significance of place attachment. Environ. Behav. 2001, 33, 249–263. [Google Scholar] [CrossRef]
  23. Bell, S. Landscape: Pattern, Perception and Process; Routledge: London, UK, 2012. [Google Scholar]
  24. Castree, N. Nature, Key Ideas in Geography; Routledge: London, UK; New York, NY, USA, 2005. [Google Scholar]
  25. Sæþórsdóttir, A.D.; Hall, C.M.; Saarinen, J. Making wilderness: Tourism and the history of the wilderness idea in Iceland. Polar Geogr. 2011, 34, 249–273. [Google Scholar] [CrossRef]
  26. Hall, C.M.; Saarinen, J. Polar tourism: Definitions and dimensions. Scand. J. Hosp. Tour. 2010, 10, 448–467. [Google Scholar] [CrossRef]
  27. Devine-Wright, P. Rethinking nimbyism: The role of place attachment and place identity in explaining place-protective action. J. Community Appl. Soc. Psychol. 2009, 19, 426–441. [Google Scholar] [CrossRef]
  28. Devine-Wright, P. Place attachment and public acceptance of renewable energy: A tidal energy case study. J. Environ. Psychol. 2011, 31, 336–343. [Google Scholar] [CrossRef]
  29. Devine-Wright, P.; Howes, Y. Disruption to place attachment and the protection of restorative environments: A wind energy case study. J. Environ. Psychol. 2010, 30, 271–280. [Google Scholar] [CrossRef]
  30. Pasqualetti, M.J.; Gipe, P.; Righter, R.W. Wind Power in View: Energy Landscapes in a Crowded World; Academic Press: New York, NY, USA, 2002. [Google Scholar]
  31. Johansson, M.; Laike, T. Intention to respond to local wind turbines: The role of attitudes and visual perception. Wind Energy 2007, 10, 435–451. [Google Scholar] [CrossRef]
  32. Wolsink, M. Planning of renewables schemes: Deliberative and fair decision-making on landscape issues instead of reproachful accusations of non-cooperation. Energy Policy 2007, 35, 2692–2704. [Google Scholar] [CrossRef]
  33. Wolsink, M. Near-shore wind power—Protected seascapes, environmentalists’ attitudes, and the technocratic planning perspective. Land Use Policy 2010, 27, 195–203. [Google Scholar] [CrossRef] [Green Version]
  34. Frantál, B.; Kunc, J. Wind turbines in tourism landscapes: Czech experience. Ann. Tour. Res. 2011, 38, 499–519. [Google Scholar] [CrossRef]
  35. Pasqualetti, M.; Smardon, R. Social acceptance of renewable energy landscapes. In The Renewable Energy Landscape: Preserving Scenic Values in Our Sustainable Future; Apostol, D., Palmer, J., Pasqualetti, M., Smardon, R., Sullivan, R., Eds.; Routlege: New York, NY, USA, 2016. [Google Scholar]
  36. Manning, R.E. Studies in Outdoor Recreation: Search and Research for Satisfaction, 2nd ed.; Oregon State University Press: Corvallis, OR, USA, 1999. [Google Scholar]
  37. Sæþórsdóttir, A.D. Planning nature tourism in Iceland based on tourist attitudes. Tour. Geogr. 2010, 12, 25–52. [Google Scholar] [CrossRef]
  38. Johnson, B.J.; Hall, T.E.; Cole, D.N. Naturalness, Primitiveness, Remoteness and Wilderness: Wilderness Visitors’ Understanding and Experience of Wilderness Qualities; U.S. Department of Agriculture, Forest Service, Rocky Mountain Research Station, Aldo Leopold Wilderness Research Institute: Missoula, MT, USA, 2005; Available online: https://www.wilderness.net/toolboxes/documents/vum/Visitors%20Experience%20and%20Wilderness%20Qualities.doc (accessed on 3 June 2018).
  39. Hallikainen, V. The Finnish Social Wilderness; USDA Forest Service Proceedings; USDA: Newtown Square, PA, USA, 2000.
  40. Stefánsson, Þ.; Sæþórsdóttir, A.D.; Hall, C.M. When tourists meet transmission lines: The effects of electric transmission lines on tourism in Iceland. Energy Res. Soc. Sci. 2017, 34, 82–92. [Google Scholar] [CrossRef]
  41. Sæþórsdóttir, A.D.; Ólafssdóttir, R.; Smith, D. Turbulent times: Tourists’ attitudes towards wind turbines in the southern Highlands in Iceland. Int. J. Sustain. Energy 2017, 1, 1478–6451. [Google Scholar] [CrossRef]
  42. Sæþórsdóttir, A.D.; Saarinen, J. Challenges due to changing ideas of natural resources: Tourism and power plant development in the Icelandic wilderness. Polar Rec. 2015, 52, 82–91. [Google Scholar] [CrossRef]
  43. Sullivan, R.; Kirchler, L.; Lahti, T.; Roché, S.; Beckman, K.; Cantwell, B.; Richmond, P. Wind turbine visibility and visual impact threshold distances in western landscapes. In Proceedings of the 37th Annual Conference on National Association of Environmental Professionals, Portland, OR, USA, 18 May 2012. [Google Scholar]
  44. Karwacki, P. The Kipawa river versus the Tabaret river diversion projects. Appl. Energy 2003, 75, 2221–2233. [Google Scholar] [CrossRef]
  45. Hynes, S.; Hanley, N. Preservation versus development on Irish rivers: Whitewater kayaking and hydro-power in Ireland. Land Use Policy 2006, 23, 170–180. [Google Scholar] [CrossRef]
  46. Fredman, P.; Emmelin, L. Wilderness purism, willingness to pay and management preferences: A study of Swedish mountain tourists. Tour. Econ. 2001, 7, 5–20. [Google Scholar] [CrossRef]
  47. Hendee, J.C. Wilderness Users in the Pacific Northwest: Their Characteristics, Values, and Management Preferences; Research Paper PNW: 61: Pacific Northwest forest and Range Experiment Station; U.S. Dept. of Agriculture: Portland, OR, USA, 1968.
  48. Vistad, O.I.; Vorkinn, M. The wilderness purism construct—Experiences from Norway with a simplified version of the purism scale. For. Policy Econ. 2012, 19, 39–47. [Google Scholar] [CrossRef]
  49. Ólafsdóttir, R.; Sæþórsdóttir, A.D.; Runnström, M. Purism scale approach for wilderness mapping in Iceland. In Mapping Wilderness: Concepts, Techniques and Applications; Carver, S.J., Fritz, S., Eds.; Springer: Dordrecht, The Netherlands, 2016; pp. 157–176. [Google Scholar]
  50. Orkustofnun [En National Energy Authority]. Os-2018-T006-01: Uppsett rafafl og Raforkuframleiðsla í Virkjunum á Íslandi 2017 [En. Installed Electricity and Power Generation in the Power Plants in Iceland 2017]; Orkustofnun: Reykjavik, Iceland, 2018. [Google Scholar]
  51. Orkustofnun [En National Energy Authority]. Os-2017-T016-01: Þróun Raforkunotkunar á Íslandi [En. The Evolutin of Energy Use in Iceland]; Orkustofnun: Reykjavik, Iceland, 2017. [Google Scholar]
  52. Jonsson, T.; Pinson, P.; Nielsen, H.A.; Madsen, H.; Nielsen, T.S. Forecasting electricity spot prices Accounting for wind power predictions. IEEE Trans. Sustain. Energy 2013, 4, 210–218. [Google Scholar] [CrossRef]
  53. Statistics Iceland. Mannfjöldi eftir Þéttbýlisstöðum, Kyni og Aldri 2011–2018 [Eng: Population by Municipalities, Gender and Age 2011–2018. edited by Hagstofa Íslands [eng: Statistics Iceland]; Hagstofa Íslands: Reykjavík, Iceland, 2018. [Google Scholar]
  54. Sæþórsdóttir, A.D.; Ólafsson, R. Nature tourism assessment in the Icelandic master plan for geothermal and hydropower development. Part I: Rapid evaluation of nature tourism resources. J. Herit. Tour. 2010, 5, 311–331. [Google Scholar] [CrossRef]
  55. Sæþórsdóttir, A.D. Managing popularity: Changes in tourist attitudes in a wilderness destination. Tour. Manag. Perspect. 2013, 7, 47–58. [Google Scholar] [CrossRef]
  56. Hall, C.M.; Page, S.J. The Geography of Tourism and Recreation: Environment, Place and Space, 4th ed.; Routledge: London, UK, 2014. [Google Scholar]
  57. Sæþórsdóttir, A.D.; Stefánsdóttir, B.; Stefánsson, Þ. Viðhorf ferðamanna til nokkurra virkjana í 3. áfanga Rammaáætlunar [En: Tourists view towards power plants in the third phase of the master plan for nature protection and energy utilization]. In Rammaáætlun Vernd- og orkunýting landsvæði [En: The Master Plan for Nature Protection and Energy Utilization]; Land- og ferðamálafræðistofa, Líf og umhverfisvísindadeild Háskóla Íslands: Reykjavík, Iceland, 2015. [Google Scholar]
  58. Field, A. Discovering Statistics Using Spss, 2nd ed.; Sage: London, UK, 2005. [Google Scholar]
  59. Stankey, G.H. Visitor Perceptions of Wilderness Recreation Carrying Capacity; edited by USDA Forest Service Research Paper; USDA Forest Service: Ogden, UT, USA, 1973. [Google Scholar]
  60. Tangeland, T.; Aas, Ø. Kraftinstallasjoner i Naturområder—Effekter på Turisme, Friluftsliv og Bruk av Fritidsboliger: En Literaturstudie [Transmission Line in Natural Environments—Effects on Tourism, Outdoor Recreation and Use of Summer Houses]; Norwegian University Life Sciences: Norwegian, Norway, 2010. [Google Scholar]
  61. Tempesta, T.; Vecchiato, D.; Girardi, P. The landscape benefits of the burial of high voltage power lines: A study in rural areas of Italy. Landsc. Urban Plan. 2014, 126, 53–64. [Google Scholar] [CrossRef]
  62. Priestley, H.; Evans, G.W. Resident perceptions of nearby electric transmission line. J. Environ. Psychol. 1996, 16, 65–74. [Google Scholar] [CrossRef]
Figure 1. The map followed in the questionnaire survey and shows the research area.
Sustainability 10 02315 g001
Figure 2. Blanda research area and the seven comparison areas.
Sustainability 10 02315 g002
Figure 3. Division of tourists at Blanda and the seven comparison areas according to the Purist Scale.
Sustainability 10 02315 g003
Figure 4. Effects of Blanda power plant infrastructure on tourist experiences.
Sustainability 10 02315 g004
Figure 5. Opinions on structures/facilities in the area.
Sustainability 10 02315 g005
Figure 6. Attitudes towards power infrastructure in the Highlands and Lowlands.
Sustainability 10 02315 g006
Table 1. Main characteristics of the seven comparison areas.
Research AreasLocationAttractionMain Tourist ActivityMain Tourist MarketProposed Power Plant
HagavatnHighlandsA glacier lagoon and wilderness landscapeJeep safari and hikingInternational and IcelandersHydroelectric
NýjidalurHighlandsWilderness landscapeMostly driving, some hiking and ridingInternational and IcelandersHydroelectric & Geothermal
AldeyjarfossEdge of the HighlandsA waterfall and wilderness landscapeMostly driving, some hiking and ridingMainly internationalHydroelectric
HólaskjólEdge of the HighlandsWilderness landscapeDriving, hiking, riding and bikingMainly internationalHydroelectric
SkagafjörðurLowlandsRural landscapeRiver rafting, hiking and ridingMainly international, some IcelandersHydroelectric
TrölladyngjaLowlandsGeothermal area in natural areaHiking, close to the capital areaMainly IcelandersGeothermal
SeltúnLowlandsGeothermal area in rural landscapePopular for daytrips from ReykjavíkMainly internationalGeothermal
Analyzed from Sæþórsdóttir, Stefánsdóttir and Stefánsson [57].
Table 2. The perception of the area as natural or developed.
Sustainability 10 02315 i001
NMeanSt.dev.t-Test/Anova
Total10324.440.908-
Female4744.490.848t = 1.182
Male4774.420.926p = 0.238
Younger than 25 years1204.510.820F = 2.450
p = 0.032
25–34 years2344.340.932
35–44 years1194.300.988
45–54 years1854.460.891
55–64 years1564.500.947
65 years and older924.650.777
Iceland823.631.282F = 10.684
p < 0.001
Germany3384.560.734
France1034.720.733
Switzerland/Austria864.480.822
USA/Canada744.450.924
Benelux nations664.610.762
Visegrád nations504.221.016
Italy/Spain494.201.207
Nordic nations384.320.989
Other nations764.490.774
Icelanders living in capital area223.731.032t = 0.244
Icelanders living outside of capital area513.651.383p = 0.808
Rental car6014.530.816F = 11.836
p < 0.001
Own car1794.121.118
Bus1484.540.811
Motorcycle/quad, bicycle, horseback304.131.106
Heading north on F354574.550.855t = 3.269
Heading south on F354914.360.905p = 0.001
Repeat visitors1614.151.125t = −3.782
First-time visitors8414.500.841p < 0.001
Day trip visitors5574.410.896t = −1.328
Overnight visitors3694.490.882p = 0.185
Nonpurists1144.400.975F = 5.435
p = 0.005
Neutralists5534.480.851
Purists1854.231.023
Summer5834.460.896t = 0.797
Autumn4494.410.925p = 0.426
Came to experience wilderness8064.480.883t = 2.331
Didn’t come to experience wilderness1284.261.014p = 0.021
Table 3. Impacts of reservoirs on tourist experience, analyzed by groups.
Sustainability 10 02315 i002
NMeanSt.dev.t-Test/Anova
Total8733.490.904-
Female3953.490.894t = 0.265
p = 0.791
Male4113.480.903
Younger than 25 years763.460.791F = 1.054
p = 0.385
25–34 years1913.410.895
35–44 years1093.491.015
45–54 years1623.430.855
55–64 years1403.491.014
65 years and older943.660.727
Iceland823.321.295F = 2.873
p = 0.002
Germany2863.330.724
France893.780.822
Switzerland/Austria743.570.795
USA/Canada683.460.905
Benelux nations563.611.090
Visegrád nations433.670.747
Italy/Spain313.611.022
Nordic nations283.541.138
Other nations613.610.936
Icelanders living in capital area253.601.080t = 1.096
p = 0.277
Icelanders living outside of capital area483.251.391
Rental car5083.550.875F = 2.888
p = 0.035
Own car1663.331.047
Bus1223.390.777
Motorcycle/quad, bicycle, horseback273.411.152
Heading north on F353613.500.916t = −0.012
p = 0.990
Heading south on F354413.500.858
Repeat visitors1493.381.119t = −1.491
p = 0.138
First-time visitors7003.530.838
Day trip visitors4913.540.928t = 1.191
p = 0.234
Overnight visitors3033.460.871
Nonpurists1003.640.835F = 7.195
p = 0.001
Neutralists4773.520.866
Purists1503.250.983
Summer4883.460.908t = −1.159
p = 0.247
Autumn3853.530.898
Came to experience wilderness6963.480.910t = −0.849
p = 0.396
Didn’t come to experience wilderness1063.560.947
Table 4. Impacts of a gravel road on tourist experience, analyzed by groups.
Sustainability 10 02315 i003
NMeanSt.dev.t-Test/Anova
Total9623.430.911-
Female4373.390.928t = −1.469
p = 0.142
Male4503.480.873
Younger than 25 years903.420.948F = 0.924
p = 0.464
25–34 years2203.420.853
35–44 years1123.590.945
45–54 years1713.450.848
55–64 years1513.440.906
65 years and older1043.340.991
Iceland843.351.125F = 1.090
p = 0.368
Germany3123.410.895
France973.530.855
Switzerland/Austria783.550.816
USA/Canada713.300.991
Benelux nations653.540.849
Visegrád nations443.640.810
Italy/Spain423.480.862
Nordic nations383.320.989
Other nations693.320.899
Icelanders living in capital area253.561.044t = 1.081
p = 0.283
Icelanders living outside of capital area503.261.175
Rental car5733.450.912F = 4.689
p = 0.003
Own car1753.490.958
Bus1323.200.795
Motorcycle/quad, bicycle, horseback263.810.939
Heading north on F354113.470.890t = 0.842
p = 0.234
Heading south on F354753.400.912
Repeat visitors1593.440.945t = 0.195
p = 0.845
First-time visitors7793.420.894
Day trip visitors5393.420.873t = −0.835
p = 0.404
Overnight visitors3383.480.912
Nonpurists1023.200.923F = 5.401
p = 0.005
Neutralists5313.470.869
Purists1673.540.848
Summer5403.490.896t = 2.281
p = 0.023
Autumn4223.360.926
Came to experience wilderness7623.480.890t = 2.262
p = 0.025
Didn’t come to experience wilderness1183.251.047
Table 5. Impacts of a paved road on tourist experience, analyzed by groups.
Sustainability 10 02315 i004
NMeanSt.dev.t-Test/Anova
Total7423.230.953-
Female3303.300.909t= 1.924
p = 0.055
Male3543.170.942
Younger than 25 years673.461.105F = 2.562
p = 0.026
25–34 years1633.210.892
35–44 years893.090.925
45–54 years1343.100.917
55–64 years1193.300.962
65 years and older843.420.908
Iceland713.131.206F = 0.845
p = 0.574
Germany2123.300.838
France823.150.891
Switzerland/Austria583.160.854
USA/Canada543.480.818
Benelux nations563.160.848
Visegrád nations373.351.006
Italy/Spain313.191.167
Nordic nations313.231.230
Other nations633.240.946
Icelanders living in capital area203.651.137t = 2.159
p = 0.035
Icelanders living outside of capital area442.951.219
Rental car4383.250.902F = 0.425
p = 0.735
Own car1443.191.073
Bus943.300.890
Motorcycle/quad, bicycle, horseback223.090.868
Heading north on F352643.050.950t = −3.787
p < 0.001
Heading south on F354133.330.910
Repeat visitors1403.111.117t = −1.444
p = 0.150
First-time visitors5873.250.908
Day trip visitors4173.220.944t = −0.474
p = 0.636
Overnight visitors2673.250946
Nonpurists863.420.913F = 14.623
p < 0.001
Neutralists4103.300.905
Purists1232.821.017
Summer4273.260.903t = 0.736
p = 0.462
Autumn3153.201.017
Came to experience wilderness5813.180.957t = −3.191
p = 0.001
Didn’t come to experience wilderness953.520.932
Table 6. Impacts of canals on tourist experience, analyzed by groups.
Sustainability 10 02315 i005
NMeanSt.dev.t-Test/Anova
Total6633.130.806-
Female2873.170.796t = 1.171
p = 0.242
Male3143.100.783
Younger than 25 years593.310.749F = 2.461
p = 0.032
25–34 years1523.040.708
35–44 years823.130.828
45–54 years1203.130.885
55–64 years1063.030.786
65 years and older623.370.814
Iceland783.001.184F = 1.109
p = 0.354
Germany1883.060.695
France663.080.686
Switzerland/Austria563.230.660
USA/Canada493.220.715
Benelux nations473.170.732
Visegrád nations333.360.742
Italy/Spain283.111.066
Nordic nations273.300.912
Other nations473.210.690
Icelanders living in capital area213.381.071t = 1.589
p = 0.117
Icelanders living outside of capital area502.901.199
Rental car3813.160.719F = 1.898
p = 0.129
Own car1403.060.969
Bus773.140.806
Motorcycle/quad, bicycle, horseback222.770.973
Heading north on F352673.150.839t = 0.115
p = 0.908
Heading south on F353323.140.733
Repeat visitors1283.021.004t = −1.653
p = 0.100
First-time visitors5183.170.738
Day trip visitors3773.140.808t = 0.356
p = 0.722
Overnight visitors2313.120.780
Nonpurists673.360.829F = 12.203
p < 0.001
Neutralists3853.150.703
Purists1122.820.903
Summer3663.140.789t = 0.298
p = 0.766
Autumn2973.120.828
Came to experience wilderness5273.120.804t = −0.944
p = 0.346
Didn’t come to experience wilderness763.210.914
Table 7. Impacts of dams on tourist experience, analyzed by groups.
Sustainability 10 02315 i006
NMeanSt.dev.t-Test/Anova
Total8523.090.891-
Female3763.130.857t = 1.256
p = 0.209
Male4073.050.885
Younger than 25 years763.110.759F = 2.165
p = 0.056
25–34 years1952.940.871
35–44 years1033.010.857
45–54 years1603.100.863
55–64 years1353.130.960
65 years and older813.280.855
Iceland823.121.309F = 1.923
p = 0.046
Germany2602.930.739
France883.090.797
Switzerland/Austria743.190.753
USA/Canada633.170.752
Benelux nations603.000.991
Visegrád nations403.300.758
Italy/Spain353.110.963
Nordic nations323.251.136
Other nations653.280.893
Icelanders living in capital area223.501.144t = 1.521
p = 0.133
Icelanders living outside of capital area503.001.340
Rental car5063.080.810F = 0.884
p = 0.449
Own car1683.111.061
Bus1023.060.830
Motorcycle/quad, bicycle, horseback272.811.178
Heading north on F353603.030.907t = 1.646
p = 0.100
Heading south on F354223.140.820
Repeat visitors1482.991.082t = −1.403
p = 0.162
First-time visitors6813.120.827
Day trip visitors4843.080.902t = −0.424
p = 0.672
Overnight visitors2993.110.870
Nonpurists933.390.834F = 27.273
p < 0.001
Neutralists4823.130.802
Purists1452.630.970
Summer4783.120.873t = 1.269
p = 0.205
Autumn3743.050.912
Came to experience wilderness6723.060.887t = −1.576
p = 0.116
Didn’t come to experience wilderness1063.210.973
Table 8. Impacts of transmission lines on tourist experience, analyzed by groups.
Sustainability 10 02315 i007
NMeanSt.dev.t-Test/Anova
Total9072.400.832-
Female4152.420.842t = 0.566
p = 0.572
Male4212.390.802
Younger than 25 years862.440.791F = 5.588
p < 0.001
25–34 years2122.300.716
35–44 years1112.280.906
45–54 years1652.370.751
55–64 years1482.450.921
65 years and older812.810.853
Iceland822.461.124F = 2.307
p = 0.015
Germany2902.530.749
France912.160.749
Switzerland/Austria792.390.741
USA/Canada682.340.704
Benelux nations612.310.743
Visegrád nations412.240.888
Italy/Spain402.450.876
Nordic nations332.151.004
Other nations642.440.889
Icelanders living in capital area232.871.100t = 1.468
p = 0.146
Icelanders living outside of capital area502.461.110
Rental car5482.360.772F = 4.410
p = 0.004
Own car1692.430.943
Bus1112.660.858
Motorcycle/quad, bicycle, horseback262.270.724
Heading north on F353772.310.811t = −2.560
p = 0.011
Heading south on F354572.460.810
Repeat visitors1532.420.991t = 0.266
p = 0.790
First-time visitors7332.400.783
Day trip visitors5222.380.826t = −0.729
p = 0.466
Overnight visitors3042.420.809
Nonpurists962.650.794F = 21.912
p < 0.001
Neutralists5102.420.744
Purists1612.040.809
Summer5062.420.834t = 0.583
p = 0.560
Autumn4012.390.829
Came to experience wilderness7172.360.817t = −3.198
p = 0.001
Didn’t come to experience wilderness1162.630.900
Table 9. Opinions on reservoirs in the area.
Sustainability 10 02315 i008
NMeanSt.dev.
Blanda power plant9283.101.037
Comparative
research locations
from 2015
Aldeyjarfoss3102.241.073
Hagavatn762.111.066
Hólaskjól3662.451.169
Nýidalur692.121.219
Seltún5783.020.995
Skagafjörður2102.111.142
Trölladyngja1061.760.911
Female4413.130.961
Male4603.091.097
Younger than 25 years903.300.942
25–34 years2183.070.943
35–44 years1192.921.018
45–54 years1743.011.020
55–64 years1533.221.164
65 years and older1003.351.048
Iceland762.671.269
Germany3252.840.952
France953.420.963
Switzerland/Austria843.230.896
USA/Canada723.460.918
Benelux nations663.301.022
Visegrád nations463.370.903
Italy/Spain412.951.203
Nordic nations333.181.185
Other nations713.420.951
Icelanders living in capital area243.081.349
Icelanders living outside of capital area482.521.203
Rental car5783.181.010
Own car1772.921.120
Bus1402.990.974
Motorcycle/quad, bicycle, horseback292.971.117
Heading north on F354123.071.073
Heading south on F354393.140.972
Repeat visitors1472.801.158
First-time visitors7553.160.990
Day trip visitors5173.131.029
Overnight visitors3283.131.019
Nonpurists1053.361.011
Neutralists5173.180.931
Purists1692.761.116
Summer5213.091.049
Autumn4073.101.022
Came to experience wilderness7323.081.035
Didn’t come to experience wilderness1163.141.054
Table 10. Opinions on geothermal power stations in the area.
Sustainability 10 02315 i009
NMeanSt.dev.t-Test/Anova
Blanda power plant 20169153.001.108-
Comparative
research locations
from 2015
Aldeyjarfoss3062.421.117p < 0.001
Hagavatn752.311.262p < 0.001
Hólaskjól3682.551.225p < 0.001
Nýidalur702.211.273p < 0.001
Seltún5733.010.996p = 1.000
Skagafjörður2072.531.165p < 0.001
Trölladyngja1061.871.005p < 0.001
Female4393.011.077t = −0.056
Male4503.021.129p = 0.956
Younger than 25 years923.251.065F = 2.548
p = 0.027
25–34 years2162.980.947
35–44 years1172.911.013
45–54 years1692.861.134
55–64 years1523.141.242
65 years and older963.181.231
Iceland742.421.239F = 6.406
p < 0.001
Germany3202.841.067
France973.271.195
Switzerland/Austria853.020.963
USA/Canada693.380.925
Benelux nations603.051.111
Visegrád nations473.190.992
Italy/Spain402.981.121
Nordic nations343.031.267
Other nations703.470.989
Icelanders living in capital area242581.248t = 0.755
Icelanders living outside of capital area462.351.233p = 0.453
Rental car5673.091.099F = 3.639
p = 0.013
Own car1772.881.169
Bus1382.831.046
Motorcycle/quad, bicycle, horseback292.761.057
Heading north on F354103.021.122t = 0.075
Heading south on F354293.021.062p = 0.940
Repeat visitors1442.771.256t = −2.545
First-time visitors7443.061.066p = 0.012
Day trip visitors5023.001.069t = −0.606
Overnight visitors3283.041.111p = 0.545
Nonpurists1013.231.048F = 21.151
p < 0.001
Neutralists5083.141.036
Purists1722.561.161
Summer5183.031.136t = 0.833
Autumn3972.971.070p = 0.405
Came to experience wilderness7172.971.106t = −1.105
Didn’t come to experience wilderness1183.091.177p = 0.270
Table 11. Opinions on hydroelectric power stations in the area.
Sustainability 10 02315 i010
NMeanSt.dev.t-Test/Anova
Blanda power plant 20169162.901.048-
Comparative
research locations
from 2015
Aldeyjarfoss3022.071.015p < 0.001
Hagavatn772.031.038p < 0.001
Hólaskjól3662.331.167p < 0.001
Nýidalur712.041.212p < 0.001
Seltún5692.880.975p = 1.000
Skagafjörður2112.091.115p < 0.001
Trölladyngja1001.790.935p < 0.001
Female4392.900.977t = −0.326
Male4522.921.115p = 0.745
Younger than 25 years933.100.979F = 2.841
p = 0.015
25–34 years2182.890.936
35–44 years1152.720.987
45–54 years1722.841.041
55–64 years1512.931.132
65 years and older953.181.185
Iceland722.721.406F = 3.479
p < 0.001
Germany3192.730.964
France942.840.987
Switzerland/Austria862.990.874
USA/Canada693.160.918
Benelux nations593.001.130
Visegrád nations473.110.983
Italy/Spain442.841.200
Nordic nations342.911.264
Other nations733.330.987
Icelanders living in capital area243.081.530t = 1.369
Icelanders living outside of capital area452.601.321p = 0.175
Rental car5702.951.022F = 1.419
p = 0.236
Own car1742.861.124
Bus1392.781.041
Motorcycle/quad, bicycle, horseback292.691.105
Heading north on F354092.851.052t = −1.536
Heading south on F354322.961.019p = 0.125
Repeat visitors1382.801.239t = −1.185
First-time visitors7512.931.004p = 0.238
Day trip visitors5032.911.046t = −0.046
Overnight visitors3292.921.028p = 0.963
Nonpurists1023.241.045F = 31.420
p < 0.001
Neutralists5073.000.908
Purists1722.401.127
Summer5192.941.042t = 1.209
Autumn3972.851.056p = 0.227
Came to experience wilderness7162.841.034t = −3.478
Didn’t come to experience wilderness1193.191.076p = 0.001
Table 12. Opinions on transmission lines in the area.
Sustainability 10 02315 i011
NMeanSt.dev.t-Test/Anova
Blanda power plant 20169232.320.975-
Comparative
research locations
from 2015
Aldeyjarfoss3101.950.907p < 0.001
Hagavatn791.870.992p = 0.005
Hólaskjól3712.061.003p = 0.001
Nýidalur721.570.836p < 0.001
Seltún5702.640.984p < 0.001
Skagafjörður2152.131.070p = 0.266
Trölladyngja1071.780.914p < 0.001
Female4412.340.945t = 0.543
Male4562.300.997p = 0.587
Younger than 25 years922.450.894F = 2.206
p = 0.052
25–34 years2232.300.897
35–44 years1182.180.921
45–54 years1702.280.942
55–64 years1542.331.085
65 years and older962.571.103
Iceland732.271.216F = 2.978
p = 0.002
Germany3202.280.910
France972.000.935
Switzerland/Austria842.430.826
USA/Canada722.631.080
Benelux nations662.350.984
Visegrád nations472.320.862
Italy/Spain402.201.043
Nordic nations362.170.910
Other nations712.591.022
Icelanders living in capital area232.521.201t = 0.993
Icelanders living outside of capital area472.211.232p = 0.324
Rental car5822.330.949F = 0.740
p = 0.528
Own car1742.231.061
Bus1372.390.987
Motorcycle/quad, bicycle, horseback272.330.877
Heading north on F354152.210.943t = −3.283
Heading south on F354312.430.939p = 0.001
Repeat visitors1462.251.048t = −1.070
First-time visitors7502.340.949p = 0.285
Day trip visitors5112.340.929t = 0.214
Overnight visitors3232.321.013p = 0.831
Nonpurists1022.870.951F = 37.428
p < 0.001
Neutralists5162.360.903
Purists1761.900.918
Summer5232.340.966t = 0.623
Autumn4002.300.986p = 0.533
Came to experience wilderness7292.260.957t = −3.772
Didn’t come to experience wilderness1142.631.041p < 0.001
Table 13. Opinions on wind turbines in the area.
Sustainability 10 02315 i012
NMeanSt.dev.t-Test/Anova
Blanda power plant 20169262.251.140-
Comparative
research
locations from 2015
Aldeyjarfoss3082.201.141p = 1.000
Hagavatn782.131.085p = 1.000
Hólaskjól3722.121.130p = 0.762
Nýidalur741.841.086p = 0.063
Seltún5702.711.099p < 0.001
Skagafjörður2122.251.128p = 1.000
Trölladyngja1042.041.023p = 0.858
Female4422.301.114t = 1.260
Male4572.211.152p = 0.208
Younger than 25 years912.631.189F = 4.554
p < 0.001
25–34 years2212.451.138
35–44 years1182.221.079
45–54 years1702.151.026
55–64 years1542.091.260
65 years and older982.091.158
Iceland772.171.351F = 9.782
p < 0.001
Germany3211.951.002
France1002.201.155
Switzerland/Austria852.451.086
USA/Canada673.101.116
Benelux nations642.171.106
Visegrád nations482.381.064
Italy/Spain432.281.054
Nordic nations332.151.034
Other nations702.811.158
Icelanders living in capital area241.791.179t = −1.666
Icelanders living outside of capital area492.351.408p = 0.100
Rental car5792.281.118F = 2.763
p = 0.041
Own car1792.321.243
Bus1351.991.011
Motorcycle/quad, bicycle, horseback292.241.244
Heading north on F354122.171.106t = −1.964
Heading south on F354362.321.132p = 0.050
Repeat visitors1482.141.193t = −1.332
First-time visitors7492.271.109p = 0.183
Day trip visitors5082.171.088t = −3.517
Overnight visitors3312.451.183p < 0.001
Nonpurists1022.571.182F = 12.492
p < 0.001
Neutralists5132.331.098
Purists1741.941.054
Summer5232.241.133t = −0.467
Autumn4032.271.150p = 0.641
Came to experience wilderness7262.211.111t = −1.058
Didn’t come to experience wilderness1182.321.124p = 0.290
Table 14. The impact of further harnessing of energy on tourist interest in returning to Iceland, analyzed by groups.
Sustainability 10 02315 i013
NMeanSt.dev.t-Test/Anova
Total8562.870.617-
Female4202.900.589t = 1.050
p = 0.294
Male4142.850.647
Younger than 25 years832.950.561F = 0.718
p = 0.610
25–34 years2132.820.629
35–44 years1062.900.646
45–54 years1632.880.571
55–64 years1342.900.592
65 years and older932.860.669
Germany3272.870.497F = 7.859
p < 0.001
France962.500.725
Switzerland/Austria812.930.346
USA/Canada662.940.605
Benelux nations672.840.809
Visegrád nations483.250.812
Italy/Spain452.890.532
Nordic nations332.940.704
Other nations723.000.581
Rental car5752.870.620F = 0.094
p = 0.964
Own car1172.850.567
Bus1372.880.669
Motorcycle/quad, bicycle, horseback212.900.436
Heading north on F353912.840.650t = −1.123
p = 0.262
Heading south on F354192.890.586
Repeat visitors892.780.617t = −1.572
p = 0.116
First-time visitors7472.880.614
Day trip visitors4822.880.624t = 0.595
p = 0.552
Overnight visitors3072.860.625
Nonpurists1003.130.597F = 23.068
p < 0.001
Neutralists4712.900.549
Purists1502.630.691
Summer4922.910.590t = 2.015
p = 0.041
Autumn3642.820.650
Came to experience wilderness6852.850.632t = −2.167
p = 0.032
Didn’t come to experience wilderness992.990.598

