Abstract
Potassium (K) is an essential macronutrient for maintaining crop productivity, but the economic benefit of K fertilizer often has been neglected. We collected a database from 60 maize field experimental sites in Northeast China between 2005 and 2012 to study the impacts of potassium (K) application rates on yield, K concentrations in grain and straw, plant K uptake, and to evaluate the economic optimum K rate (EOKR) for maize under different levels of soil indigenous K supply (IKS). The results showed that the average maize yield in Krec treatment (the recommended K rate) was highest and was 32.1% higher than that in K0 treatment (no K fertilization). Compared to K0, the application of K did not significantly increase grain K concentration, whereas it significantly increased K concentration in the straw. Plant K uptake in K150 treatment (150% of the recommended K rate) was higher than that in Krec treatment, but grain yield was lower than that in Krec treatment. Thus, the result indicates that luxury K absorption occurred in K150% treatment due to excessive K application. Thus, the application rate of K should be further optimized. Based on the modified Mitscherlich model, the average economic optimum K rate (EONR) was 135.24, 124.27, and 96.54 kg K2O/ha for the low, medium, and high levels of soil indigenous K supply (IKS), respectively. The average economic optimum yield (EOY) at a high IKS level was similar to the average yield in Krec treatment, whereas the EOKR could reduce by a K rate of 37.9–63.7 kg K2O/ha compared to Krec treatment. This study highlights the importance of K application to improve grain yield and provides a promising fertilizer recommendation method for minimizing fertilizer inputs and optimizing maize production.
1. Introduction
Maize (Zea mays L.) is the second-largest cereal crop in China and primarily used for food and feed [1]. Maize is extensively cultivated worldwide and forms the primary food crop, providing 30% of total caloric intake to 4.5 billion people [2]. Ensuring increased maize production is critical to meet an increasing population demand for maize under declining arable cropland [3,4,5]. Annual maize yield roughly accounts for 34% of the world’s crop production and 39% of total grain output in China [6]. With the economic growth and consumption rising, demand for maize is projected to increase 47% to 2030 [7,8]. Additionally, more notably, major advances in the expansion of maize production have occurred over the past four decades through genetic improvements that enhance disease and pest resistance [9,10,11]. Since the majority of maize production systems in China are limited from low nutrient use efficiency and imbalanced fertilization [1,2], it is essential to optimize nutrient application for improving maize production.
Potassium (K) is an essential plant macronutrient and plays an important role in many physiological processes vital to plant nutrient and water uptake, nutrient transport, and growth, especially under adverse conditions [12,13]. K fertilizer is the primary K source in most modern agricultural systems. The application rates of nitrogen (N) and phosphorus (P) fertilizers have increased annually, whereas the application rate of fertilizer K is still insufficient [14,15]. Indeed, the world’s agricultural lands suffer from severe soil K deficiencies [16], especially in Africa [17], Asia [18], and Europe [19]. One reason for the K deficiency is that K fertilizer always lacks attention, and farmers generally believe that K fertilizer does not effectively increase crop yields compared to N and P fertilizers. Besides, most K fertilizer in China is imported from other countries and fertilizer K is relatively cost prohibitive to many small-scale farmers [20,21]. With the implementation of policies to return crop straws to the soil, K deficiency potential has been relieved [22]; however, many Chinese soils are still K deficient.
Recent studies have shown that K fertilizer application has markedly increased wheat, potato, and rice yield in China [21,23,24]. Due to a lack of more information of optimal K application rates for maize, an evaluation of the optimum K fertilizer recommendations at the regional scale is urgently needed. Therefore, the objectives of this study were to: (1) analyze the effects of K application on grain yield, K concentrations in grain and straw, and plant K uptake; and (2) to quantify the economic optimum K rate (EOKR) for maize under high, medium, and low levels of soil indigenous K supply (IKS).
2. Materials and Methods
2.1. Site Description
The data for the study were collected from field experiments conducted at 60 experimental sites in the main maize-producing regions in Northeast China (Liaoning Province, 38°43′ N–43°26′ N and 118°53′ E–125°46′ E) between 2005 and 2012 (Figure 1). Local maize cultivated varieties, i.e., Zhengdan985, Liaodan565, and Danyu402, were planted in early May and harvested in late September. The typical subtropical–humid monsoon climate is characterized by hot summers with intensive rainfall, abundant sunshine, and long and cold winters. The majority of rainfall was concentrated in the maize-growing seasons, where, across all sites, the average monthly precipitation was 109 mm. The mean monthly temperature was 21.8 °C during the maize-growing seasons in 2005–2012 (Figure 2).
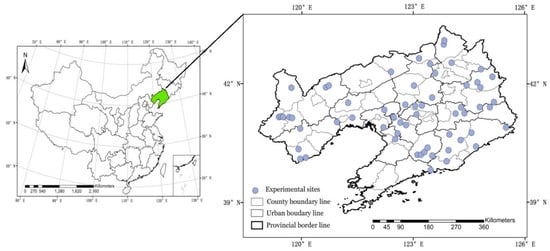
Figure 1.
Location map of the 60 experimental sites for maize in Liaoning province of Northeast China.
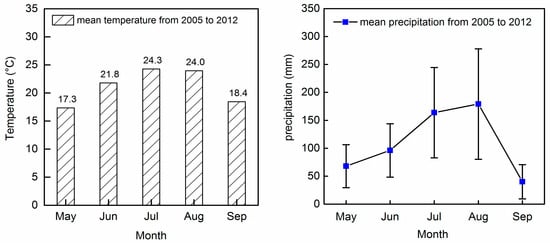
Figure 2.
Monthly mean temperatures and precipitation amounts (mm) during the maize-growing season over the period 2005–2012 at all 60 experimental sites.
The soil is blown soil, which could be classified as Haplic-Udic Luvisols (according to the FAO classification). The main chemical properties of the topsoil (0–20 cm) prior to the experiment are shown in Table 1.

Table 1.
Initial chemical properties of the topsoil (0–20 cm) across all 60 experimental sites.
2.2. Experimental Treatments
At each of the 60 experiment sites, 14 fertilization treatments were established; however, only the following 4 K fertilizer treatments were used in this study: (1) no K fertilization (K0); (2) 50% of the recommended K rate treatment (K50 = 60~75 kg/ha); (iii) the recommended K rate treatment (Krec = 120–150 kg/ha) based on soil testing K and local agronomist recommendations; and (4) 150% of the recommended K rate treatment (K150 = 180~225 kg/ha). At each site, treatment was arranged in a completely randomized design with three replications per treatment. Nitrogen and phosphorus fertilizer were kept identical for each treatment: 195~225 kg N/ha and 120~150 kg P2O5/ha. Sources of fertilizers were urea (46%N), calcium superphosphate (12% P2O5), and potassium chloride (60% K2O), respectively. For each maize growing season, 60% of the N fertilizer and all P and K fertilizer were broadcast by hand onto the soil surface as a basal fertilizer before planting, and approximately 40% of the N fertilizer was applied at the heading stage. Other farming practices, such as irrigation and pest control, were performed using local management practices.
2.3. Plant Sampling and K Concentration Testing
At maturity, maize plants were harvested by hand. Grain yield value was measured at each plot and recorded on a 14% moisture content basis. The fresh maize samples were rinsed with tap water before being dried at 80 °C to a constant weight for measuring dry weight. After oven-drying, the dry samples (grain and straw) were ground into powder, sieved through a 1-mm screen, and then digested separately with H2SO4–H2O2. The K concentration was determined using atomic absorption spectrophotometry [25]. The plant K uptake was calculated as the K concentration in grain/straw multiplied by the dry weight of the grain or straw.
2.4. Economic Optimum K Fertilizer Recommendation Method
To calculate the optimal K rate for maize, the modified Mitscherlich model was used to fit the relationship between K rate (x) and grain yield (y) at each experimental site and calculate the coefficients of the equation. Based on this, the economic optimum K rate (EOKR) and the economic optimum yield (EOY) at each site were calculated. The modified Mitscherlich model is given by Dobermann et al. [26] as follows:
where x is the K application rate (kg/ha); y is the maize grain yield (t/ha); a is the unfertilized grain yield (t/ha); b is the maximum yield increase to applied K of K (t/ha); and c is the constant related to the efficiency of soil and fertilizer K.
The economic optimum K rate (EOKR, kg/ha) was calculated as:
where R is the price of maize grain ($/t)/fertilizer K price ($/kg). Here, the prices of K fertilizer (0.89–1.087 $/kg) and maize (0.28–0.38 $/kg) are from 2005 to 2012.
2.5. Statistical Analysis
Data were descriptively analyzed using SPSS 19.0 software (Chicago, IL, USA). The LSD at 5% level was adopted to analyze the differences in grain yield and plant K uptake among the four K application treatments. Origin 2016 was used for plotting the grain yield and plant K uptake. We used ArcGIS 10.3 software to map the distribution of IKS using the Kriging method.
3. Results and Discussion
3.1. Response of K Rates to Maize Yield
Across all sites, the average unfertilized (K0) grain yield was 8.96 t/ha and ranged from 5.10 to 11.26 t/ha (Figure 3a). The average grain yield in K50, Krec, and K150 treatments were 10.86, 11.84, and 11.15 t/ha, respectively, which were increased by 21.2%, 32.1%, and 28.4% compared to K0 (Figure 3a). This indicates that the K application rate of 120–150 kg/ha contributed more grain. The K50 treatment could not greatly enhance the yield (Figure 3a); therefore, the K application rate in the K50 treatment should to be increased by 50% in order to produce higher yields. Correspondingly, the K application rate in the K150 treatment should to be reduced by 33% to achieve the same yield as Krec. The average grain yield showed an increasing trend; the ranking of the treatments was Krec > K150 > K50 > K0.
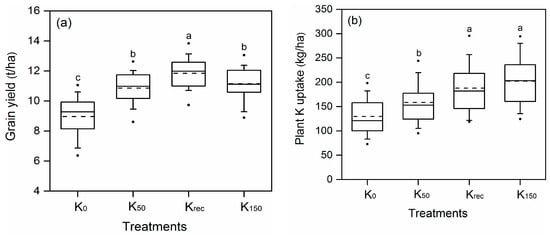
Figure 3.
Grain yield (a) and plant K uptake (b) for maize under four different K application treatments across 60 experiment sites. Black solid and dotted lines represent the median and average values, respectively; the upper and lower of Box edges represent the 25th and 75th quartiles; whisker caps indicate the 90th and 10th percentiles; and circles denote the 95th and 5th percentiles. Lower-case letters indicate a significant difference (p < 0.01) among the four treatments.
Similarly, Wu et al. [27] found that K application at the recommended K rate significantly increased grain yields by 14.7% compared with no K applied in the North China Plain. Qiu et al. [28] also found that the average grain yield (8.0 t/ha) at the K application rate of 113 kg K2O/ha was higher than that at 225 kg K2O/ha. As a whole, these studies reflected that the optimum K rate of 120 to 150 kg/ha maximized grain yield.
3.2. Grain K Concentration and Straw K Concentration
The average grain K concentrations in the K50, Krec, and K150 treatments were 1.81–4.20 g/kg, 2.42–5.41g/kg, and 2.20–4.78 g/kg with the averages of 3.01 g/kg, 3.49 g/kg, and 3.28 g/kg, respectively. Compared with K0 treatment, grain K concentration in the K50, Krec, and K150 treatments slightly increased by 0.08 g/kg, 1.91 g/kg, and 0.35 g/kg, respectively, indicating that the application of K did not significantly increase the grain K concentrations for maize (Table 2). This is probably due to the grain K concentrations being well-buffered against the deficiency or sufficiency of K fertilizer supply [29]. The result coincides with those previously reported by Qiu et al. [28].
Table 2.
Grain and straw K concentration for maize in the K0, K50, Krec, and K150 treatments across 60 experimental sites from 2005 to 2012.
Application of K fertilizer significantly (p < 0.05) increased straw K concentration, especially in K150 treatments (Table 2). The average straw K concentration in the K0 treatment was 10.17 g/kg and ranged from 6.13 to 14.84 g/kg (Table 2). The average straw K concentration in the K50, Krec, and K150 treatments was 12.1%, 22.2%, and 37.7% higher than that in the K0 treatment, respectively. Therefore, the treatment with the straw K concentration was highest in K150 followed by Krec and K50 and finally K0. In addition, Niu et al. [30] found that the straw K concentration of maize at a K rate of 150–225 kg/ha was highest. Similarly, Zhan et al. [31] reported that the straw K concentration of wheat at the K application rate of 72–225 kg/ha was significantly higher (by 51.4–64.7%) than that in K0 treatments. These findings are also consistent with the results of our study, which demonstrates that the maximum straw K concentration is mainly observed at a higher application rate of K.
3.3. Plant K Uptake
The K application significantly increased plant K uptake (Figure 3b). The average plant K uptake in the K0 treatment was 129.8 kg/ha and ranged from 68.7 to 254.8 kg/ha (Figure 3b). Plant K uptake in the K150 treatment was significantly increased by 55.9% compared with the K0 treatment. The average plant K uptake in the K50 and Krec treatments was 158.5 and 187.9 kg/ha, respectively, and those two treatments were 21.7% and 7.16% lower than the K150 treatment, respectively. Thus, application of K led to a significant increase in plant K uptake of maize in the following order: K150 > Krec > K50 > K0 (Figure 3b). Meanwhile, the results clearly revealed that plant K uptake gradually increased with an increase in K fertilizer input. Other crops have staged similar trends, such as wheat [31], maize [28], and rice [32].
Although plant K uptake in the K150 treatment was higher than that in the Krec treatment, the grain yield was lower than that in the Krec treatment, which is likely due to K luxury consumption having occurred in the K150 treatment. The results reflected that the K application in the K150 treatment was excessive, and therefore K150 treatment may cause residual K in the soil leading to K luxury uptake. The K luxury uptake has been widely observed in some regions of China for other crops [33,34]. Thus, an unbalanced K supply should be reduced according to the soil indigenous K supply and plant K demand for both economic benefit and environmental purposes.
3.4. Classification of Indigenous Soil K Supply
Indigenous nutrient supply was defined as the total amount of a particular nutrient uptake in the omission plots [35]. In the present study, the indigenous K supply (IKS) was defined as K uptake in the K0 treatment, which ranged from 68.7 to 254.8 kg/ha across all the experimental sites (Figure 4). The lowest IKS observed was in Huludao (68.7 kg/ha) and the highest in the Tieling and Fushun (>200 kg/ha) regions, respectively (Figure 4). The average IKS was 129.6 kg/ha, which was mostly in the range of 100–120 kg/ha (23.3%) and 120–140 kg/ha (21.6%).
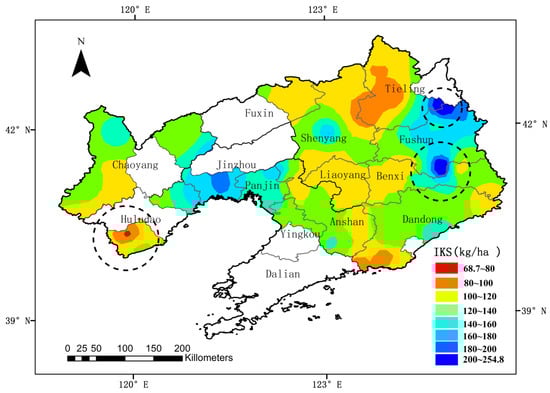
Figure 4.
The spatial distribution of the indigenous K supply (IKS, kg/ha) in parts of regions of Liaoning province of China.
To better estimate optimum K rates at different levels of IKS, the levels of IKS values were classified into three different levels. Zhang et al. [36] used the relative yield of <85%, 85–95%, and >95% soil nutrient supply for the three levels. Different from previous studies, we considered the uniformity of the classification standard of IKS, and thus established a power function relationship between relative yield (Ry) and IKS (Figure 5). Here, we used the relative yield values of <80%, 80–90%, and >90% as the grade values to divide IKS values into three different levels (low, medium, and high soil K supply) (Figure 5). This classification method has also been used for other nutrients and crops [21,37].
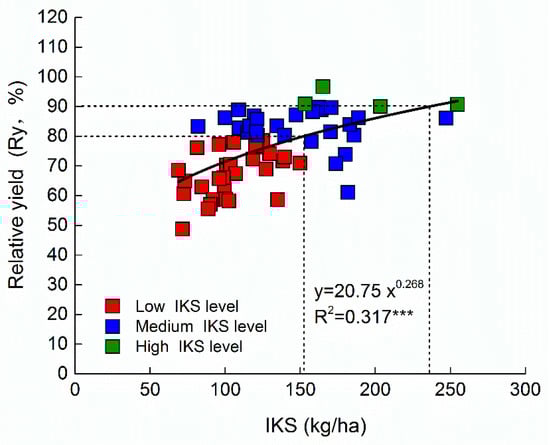
Figure 5.
The relationship between relative yield (Ry) and soil indigenous K supply (IKS) for maize across the 60 field experiments during 2005 to 2012. Solid lines indicate a regression curve. *** significant at 0.001.
3.5. Economic Optimum K Rate for Maize under the Three Levels of Soil K Supply
The Mitscherlich model was used to fit the relationship of grain yield response to applied K and determine the EOKR for each site. Here, the regression coefficients for the Mitscherlich model of yield response to applied K under three levels of soil indigenous K supply (IKS) are shown in Table 3.
Table 3.
Regression coefficients for the modified Mitscherlich model of yield response to applied K and economic optimum K rates (EOKR) under three levels of soil indigenous K supply (IKS) in Liaoning province.
There were 29 experimental sites at the low IKS level (Figure 5). For the Low IKS level, the average regression coefficients a, b, and c were 8.01 t/ha, 3.52 t/ha, and 0.029, respectively (Table 3). On average, the Mitscherlich model of yield response to applied K was y = 8.01 + 3.52 (1 − e−0.029x). The calculated average EOKR was 135.24 kg/ha and ranged from 79.3 to 176.12 kg/ha and the average economic optimum yield (EOY) was 11.44 t/ha (Table 3).
In addition, a total of 27 experimental sites were at the medium IKS level (Figure 5). For the medium IKS level, the average regression coefficients in the Mitscherlich model of a, b, and c were 9.6 t/ha, 1.99 t/ha, and 0.024 (Table 3), respectively. The average Mitscherlich model of yield response to applied K was y = 9.6 + 1.99 (1 − e−0.024x). For the medium IKS level, the calculated average EOKR was 124.27 kg/ha, and the average EOY was 11.51 t/ha (Table 3).
There were four experimental sites at the high IKS level (Figure 5). For the high IKS level, the average regression coefficients in the Mitscherlich model of a, b, and c were 10.88 t/ha, 0.86 t/ha, and 0.018 (Table 3). The Mitscherlich model of yield response to applied K was y = 10.88 + 0.86 (1 − e−0.018x). For the high IKS level, the average EOKR was 96.54 kg/ha, which ranged from 56.34 to 112.10 kg/ha. Additionally, the average EOY was 11.61 t/ha (Table 3).
More remarkable, the EOY at the high IKS level was not different compared with the yield in the Krec treatment (Figure 3a), whereas the EOKR could be reduced by 37.9–63.7 kg/ha compared with the Krec treatment (recommended K rate, 120–150 kg/ha). Therefore, it is demonstrated that the calculated EOKRs tended to use lower K fertilizers to produce more grain. Furthermore, it is worthwhile noting that the ranking of the IKS levels with respect to EOKR was High IKS level < Medium IKS level < Low IKS level, implying that the low IKS levels of the soils needed more K fertilizers to produce grain. The EOY followed a different trend from that of the EOKR: Low IKS level < Medium IKS level < High IKS level. Compared to EOKRs, the EOYs did not show a significant trend among the three IKS levels. This means that the same average EOY was attained with EOKRs compensating for IKS level. These findings are consistent with the results of Cong et al. [22] for rapeseed and Zhang et al. [36] for rice and wheat.
4. Conclusions
By the data from 60 experimental sites for maize in Liaoning province of China with four K treatments from 2005 to 2012, we analyzed the effect of K fertilization on yield, K concentrations of grain and straw, and plant K uptake, and evaluated the economic optimum K rate (EOKR) under different soil indigenous K supply (IKS) levels. We found that: (1) maize yield in the recommended K rate (Krec treatment) was higher than that in other K treatments across all sites; (2) Application of K fertilizer did not significantly increase grain K concentrations for maize, but it greatly increased straw K concentration; and (3) The plant K uptake in the K150 treatment was higher than that in the Krec treatment, but the K150 treatment did not produce a significant yield increase, demonstrating that K150 treatment would result in plant K luxury uptake due to excessive K fertilizer supply. Using the modified Mitscherlich model to evaluate the average EOKRs, they were 135.24, 124.27, and 96.54 kg/ha for the low, medium, and high levels of IKS, respectively. Moreover, the EOKR could significantly reduce by 37.9–63.7 kg/ha compared to the Krec treatment. This means that the EOKRs tended to use a lower K application than the recommended rates to achieve a higher yield. As a result, these studies would help to determine the optimum K rates, avoid nutrient depletion or excess application, and improve economic yield and environment sustainability.
Author Contributions
W.J. and X.L. conceived the research idea and used the model. X.L. and Y.W. collected the data. W.J. and Y.Z. analyzed the data. W.J. wrote the paper. All authors contributed to revising the manuscript.
Funding
This research was funded by the National Key Research and Development Program of China (Grant number 2016YFD0200105).
Acknowledgments
The author heartfelt thanks to the academic editors and three anonymous reviewers for their kind suggestion and valuable comments used to help us with the improvement of the quality of our manuscript.
Conflicts of Interest
The authors declare no conflict of interest.
References
- Xu, X.; He, P.; Zhang, J.; Pampolino, M.F.; Johnston, A.M.; Zhou, W. Spatial variation of attainable yield and fertilizer requirements for maize at the regional scale in China. Field Crops Res. 2017, 203, 8–15. [Google Scholar] [CrossRef]
- Zhao, J.; Yang, X. Distribution of high-yield and high-yield-stability zones for maize yield potential in the main growing regions in China. Agric. For. Meteorol. 2018, 248, 511–517. [Google Scholar] [CrossRef]
- Chen, C.; Wang, E.; Yu, Q.A. Modeling wheat and maize productivity as affected by climate variation and irrigation supply in North China Plain. Agron. J. 2010, 102, 1037–1049. [Google Scholar] [CrossRef]
- Wart, J.V.; Kersebaum, K.C.; Peng, S.; Milner, M.; Cassman, K.G. Estimating crop yield potential at regional to national scales. Field Crops Res. 2013, 143, 34–43. [Google Scholar] [CrossRef]
- Xu, Z.; Lai, T.; Li, S.; Si, D.; Zhang, C.; Cui, Z.; Chen, X. Promoting potassium allocation to stalk enhances stalk bending resistance of maize (Zea mays L.). Field Crops Res. 2018, 215, 200–206. [Google Scholar] [CrossRef]
- Chen, X.P.; Cui, Z.L.; Vitousek, P.M.; Cassman, K.G.; Matson, P.A.; Bai, J.S.; Meng, Q.F.; Hou, P.; Yue, S.C.; Römheld, V.; et al. Integrated soil-crop system management for food security. Proc. Natl. Acad. Sci. USA 2011, 108, 6399–6404. [Google Scholar] [CrossRef] [PubMed]
- Chen, X.; Cui, Z.; Fan, M.; Vitousek, P.; Zhao, M.; Ma, W.; Wang, Z.; Zhang, W.; Yan, X.; Yang, J. Producing more grain with lower environmental costs. Nature 2014, 514, 486–489. [Google Scholar] [CrossRef] [PubMed]
- Liu, B.; Chen, X.; Meng, Q.; Yang, H.; Wart, J.V. Estimating maize yield potential and yield gap with agro-climatic zones in China—Distinguish irrigated and rainfed conditions. Agric. For. Meteorol. 2017, 239, 108–117. [Google Scholar] [CrossRef]
- Yong, H.; Jin, Z.; Gao, L.; Zhang, L.; Liu, X.; Zhang, F.; Zhang, X.; Zhang, D.; Li, M.; Weng, J. Breeding potential of maize germplasm populations to improve yield and predominant heterotic pattern in Northeast China. Euphytica 2017, 213, 219. [Google Scholar] [CrossRef]
- Hao, D.; Cheng, Y.; Chen, G.; Lu, H.; Shi, M.; Zhang, Z.; Huang, X.; Mao, Y.; Xue, L. Identification of significant single nucleotide polymorphisms for resistance to maize rough dwarf disease in elite maize (Zea mays L.) inbred lines. Euphytica 2015, 203, 109–120. [Google Scholar] [CrossRef]
- Chen, Z.Y.; Brown, R.L.; Damann, K.E.; Damann, K.E.; Cleveland, T.E. PR10 expression in maize and its effect on host resistance against Aspergillus flavus, infection and aflatoxin production. Mol. Plant Pathol. 2010, 11, 69–81. [Google Scholar] [CrossRef] [PubMed]
- Pettigrew, W.T. Potassium influences on yield and quality production for maize, wheat, soybean and cotton. Physiol. Plant. 2008, 133, 670–681. [Google Scholar] [CrossRef] [PubMed]
- Zörb, C.; Senbayram, M.; Peiter, E. Potassium in agriculture—Status and perspectives. J. Plant Physiol. 2014, 171, 656–669. [Google Scholar] [CrossRef] [PubMed]
- Darilek, J.L.; Huang, B.; Wang, Z.; Qi, Y. Changes in soil fertility parameters and the environmental effects in a rapidly developing region of China. Agric. Ecosyst. Environ. 2009, 129, 286–292. [Google Scholar] [CrossRef]
- He, C.; Ouyang, Z.; Tian, Z.; Schaffer, H.D. Yield and Potassium Balance in a Wheat–Maize Cropping System of the North China Plain. Agron. J. 2012, 104, 1016–1022. [Google Scholar] [CrossRef]
- He, P.; Yang, L.; Xu, X.; Zhao, S.; Chen, F.; Li, S.; Tu, S.; Jin, J.; Johnston, A.M. Temporal and spatial variation of soil available potassium in China (1990–2012). Field Crops Res. 2015, 173, 49–56. [Google Scholar] [CrossRef]
- Wortmann, C.S.; Kaizzi, C.K. Nutrient balances and expected effects of alternative practices in farming systems of Uganda. Agric. Ecosyst. Environ. 1998, 71, 115–129. [Google Scholar] [CrossRef]
- Hedlund, A.; Witter, E.; An, B.X. Assessment of N, P and K management by nutrient balances and flows on peri-urban smallholder farms in southern Vietnam. Eur. Agron. J. 2003, 20, 71–87. [Google Scholar] [CrossRef]
- Bengtsson, H.; Öborn, I.; Jonsson, S.; Nilsson, I.; Andersson, A. Field balances of some mineral nutrients and trace elements in organic and conventional dairy farming—A case study at Öjebyn, Sweden. Eur. J. Agron. 2003, 20, 101–116. [Google Scholar] [CrossRef]
- Sheldrick, W.F.; Syers, J.K.; Lingard, J. Soil nutrient audits for China to estimate nutrient balances and output/input relationships. Agric. Ecosyst. Environ. 2003, 94, 341–354. [Google Scholar] [CrossRef]
- Cong, R.; Li, H.; Zhang, Z.; Ren, T.; Li, X.; Lu, J. Evaluate regional potassium fertilization strategy of winter oilseed rape under intensive cropping systems: Large-scale field experiment analysis. Field Crops Res. 2016, 193, 34–42. [Google Scholar] [CrossRef]
- Liu, Y.; Ma, J.; Ding, W.; He, W.; Lei, Q.; Gao, Q.; He, P. Temporal and spatial variation of potassium balance in agricultural land at national and regional levels in China. PLoS ONE 2017, 12, e0184156. [Google Scholar] [CrossRef] [PubMed]
- Li, S.; Duan, Y.; Guo, T.; Zhang, P.; He, P.; Johnston, A.; Shcherbakov, A. Potassium management in potato production in Northwest region of China. Field Crops Res. 2015, 174, 48–54. [Google Scholar] [CrossRef]
- Niu, J.; Zhang, W.; Ru, S.; Chen, X.; Xiao, K.; Zhang, X.; Assaraf, M.; Imas, P.; Magen, H.; Zhang, F. Effects of potassium fertilization on winter wheat under different production practices in the North China Plain. Field Crops Res. 2013, 140, 69–76. [Google Scholar] [CrossRef]
- Wright, R.J.; Stuczynski, T.I.; Sparks, D.L.; Page, A.L.; Helmke, P.A.; Loeppert, R.H. Atomic absorption and flame emission spectrometry. Available online: https://dl.sciencesocieties.org/publications/books/abstracts/sssabookseries/methodsofsoilan3/65 (accessed on 29 June 2018).
- Doberman, A.; Pcs, C.; Cassman, K.G. Fertilizer inputs, nutrient balance, and soil nutrient-supplying power in intensive, irrigated rice systems. I. Potassium uptake and K balance. Nutr. Cycl. Agroecosyst. 1996, 46, 1–10. [Google Scholar] [CrossRef]
- Wu, L.; Ma, W.; Zhang, C.; Wu, L.; Zhang, W.; Jiang, R.; Zhang, F.; Cui, Z.; Chen, X. Current potassium-management status and grain-yield response of Chinese maize to potassium application. J. Plant Nutr. Soil Sci. 2013, 176, 441–449. [Google Scholar] [CrossRef]
- Qiu, S.; Xie, J.; Zhao, S.; Xu, X.; Hou, Y.; Wang, X.; Zhou, W.; He, P.; Johnston, A.M.; Christie, P. Long-term effects of potassium fertilization on yield, efficiency, and soil fertility status in a rain-fed maize system in northeast China. Field Crops Res. 2014, 163, 1–9. [Google Scholar] [CrossRef]
- Zhang, F.S.; Niu, J.F.; Zhang, W.F.; Chen, X.P.; Li, C.J.; Yuan, L.X.; Xie, J.C.; Cakmak, I. Potassium nutrition of crops under varied regimes of nitrogen supply. Plant Soil 2010, 335, 21–34. [Google Scholar] [CrossRef]
- Niu, J.; Zhang, W.; Chen, X.; Li, C.; Zhang, F.; Jiang, L.; Liu, Z.; Xiao, K.; Assaraf, M.; Imas, P. Potassium Fertilization on Maize under Different Production Practices in the North China Plain. Agron. J. 2011, 103, 822–829. [Google Scholar] [CrossRef]
- Zhan, A.; Zou, C.; Ye, Y.; Liu, Z.; Cui, Z.; Chen, X. Estimating on-farm wheat yield response to potassium and potassium uptake requirement in China. Field Crops Res. 2016, 191, 13–19. [Google Scholar] [CrossRef]
- Islam, A.; Muttaleb, A. Effect of potassium fertilization on yield and potassium nutrition of Boro rice in a wetland ecosystem of Bangladesh. Arch. Agron. Soil Sci. 2016, 62, 1530–1540. [Google Scholar] [CrossRef]
- Chuan, L.; He, P.; Jin, J.; Li, S.; Grant, C.; Xu, X.; Qiu, S.; Zhao, S.; Zhou, W. Estimating nutrient uptake requirements for wheat in China. Field Crops Res. 2013, 146, 96–104. [Google Scholar] [CrossRef]
- Tan, D.; Jin, J.; Jiang, L.; Huang, S.; Liu, Z. Potassium assessment of grain producing soils in North China. Agric. Ecosyst. Environ. 2012, 148, 65–71. [Google Scholar] [CrossRef]
- Janssen, B.H.; Guiking, F.C.T.; Eijk, D.V.D.; Smaling, E.M.A.; Wolf, J.; Reuler, H.V. A system for quantitative evaluation of the fertility of tropical soils (QUEFTS). Geoderma 1990, 46, 299–318. [Google Scholar] [CrossRef]
- Zhang, L.; Zhang, W.L.; Lu, J.W.; Dai, Z.G.; Yi, R.Y.; Cong, R.H. Study of Optimum Potassium Reducing Rate of Rice, Wheat and Oilseed Rape Under Different Soil K Supply Levels with Straw Incorporation. Sci. Agric. Sin. 2017, 50, 3745–3756. (In Chinese) [Google Scholar]
- Li, H.; Cong, R.; Ren, T.; Li, X.; Ma, C.; Zheng, L.; Zhang, Z.; Lu, J. Yield response to N fertilizer and optimum N rate of winter oilseed rape under different soil indigenous N supplies. Field Crops Res. 2015, 181, 52–59. [Google Scholar] [CrossRef]
© 2018 by the authors. Licensee MDPI, Basel, Switzerland. This article is an open access article distributed under the terms and conditions of the Creative Commons Attribution (CC BY) license (http://creativecommons.org/licenses/by/4.0/).