5.2. Stability Test
Before constructing the PVAR model or PVEC model, the stability of variables needs to be tested. If the variables are all stable, unconstrained PVARs are established. If the variables are not stable, a PVEC model with co-integration constraints can be established under the premise that the variables are monotonous and co-integration exists. In this paper, the homogenous unit root and heterogeneous unit root tests were performed on the six variables of FD, DP, PG, wastewater, exhaustgas, and smokedust. The lag time of the unit root test is determined according to the AIC criterion. Dwastewater, dexhaustgas, and dsmokedust represent the first-order difference of the wastewater, exhaustgas, and smokedust. The results of the variable test are shown in
Table 4.
In the test of the stationarity of variables, the p values of the FD, DP, and PG variables under various test methods were mostly less than 0.05, so, these three variables are considered to be stationary sequences. Among the three variables of wastewater, exhaustgas, and smokedust, the p values of most of the test methods were all greater than 0.05, so these three variables were considered non-stationary sequences. However, after wastewater, exhaustgas, and smokedust are converted to first-order differentials, their p values, under all test methods, were less than 0.05. Thus, these three variables, after the first-order difference, become stable. Although in the unit root test the three variables quantifying environmental pollution (wastewater, exhaustgas, and smokedust) are non-stationary sequences, the variables become stable after the first-order difference and the variables after the first-order difference still have practical significance (annual increment of pollutant discharge). Thus, we use the six variables of FD, DP, PG, dwastewater, dexhaustgas, and dsmokedust to construct an unconstrained PVAR model.
However, it is worth noting that we use the panel data of 30 provincial governments for 10 years. Due to the large gap between the socio-economic development levels of the provinces, it is very likely that cross-correlation exists between variables. If cross-correlation does exist between the variables, the credibility of the conclusion of the stability of the variable obtained by the first-generation unit root test will be reduced. In order to investigate the cross-correlation of variables, this paper first performs a CD (cross-section dependence) test. The CD statistic is a statistic based on the average of the OLS regression residual correlations for each set of panel data. The specific steps are to perform an ADF test on the individual’s sequence and then perform a CD test on the residuals of the ADF test. As can be seen from
Table 5, there is a significant cross-correlation of each variable, and the use of the first-generation panel test results in doubt about the credibility.
In order to analyze the stationarity of variables better, and revise the results of the first-generation panel unit root test. This paper uses Pesaran’s (2007) second-generation panel unit root test method (CIPS method) to determine the stationarity of variables. This method is based on the CADF (cross-section augmented ADF) of the cross-section extension and can effectively overcome the cross-correlation problem between variables. The test results are shown in
Table 6. As can be seen from the panel unit root test results, the original sequences of wastewater, exhaustgass, and smokedust are not stable, but the first-order differentials (dwastewater, dexhaustgas, dsmokedust) all achieve stability. The original sequences of FD, DP, and PG are stable, so the stability of the variables obtained by using the CIPS method is consistent with the results we have obtained before.
5.3. Impulse Response Function
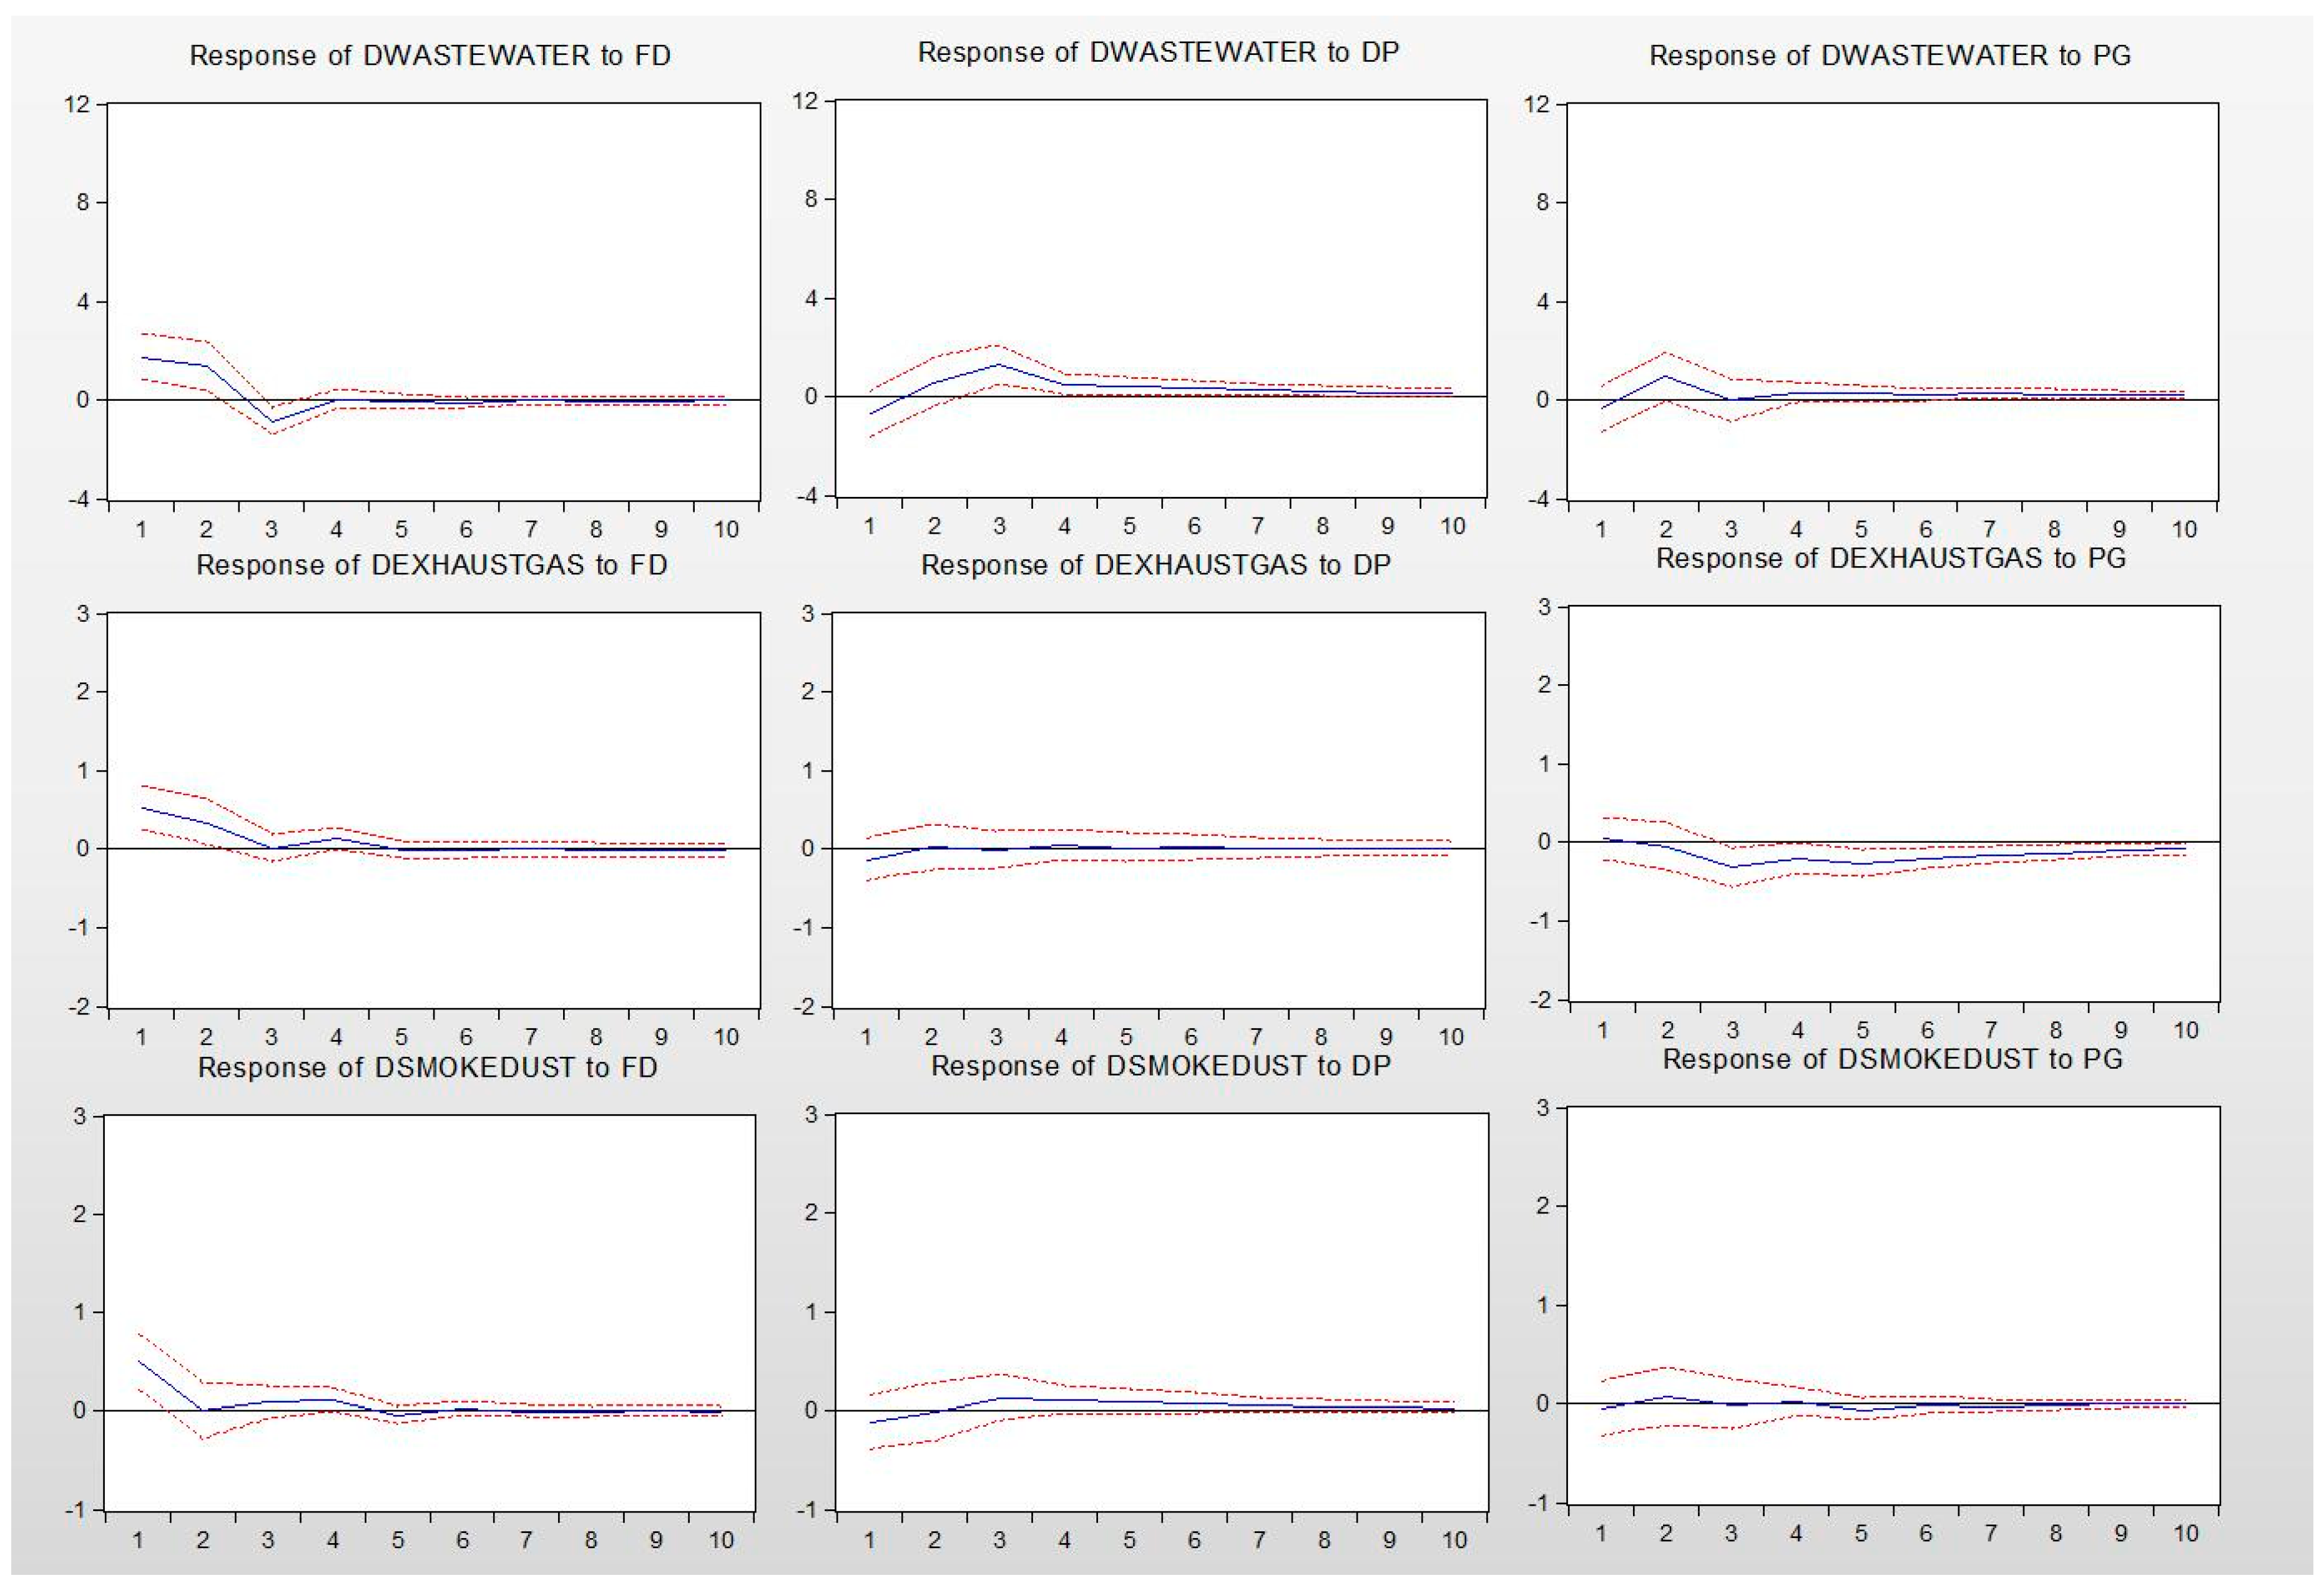
Based on the constructed PVAR model, the impulse response function of each pollution index’s response to changes in fiscal decentralization, debt pressure, and poverty governance impact was plotted. The impulse response function can fully demonstrate the entire process of one variable affecting another. Therefore, the impulse response function provides us with an effective tool for observing the full impact of various influencing factors at the system level on environmental pollution. This paper uses Cholesky decomposition technology to draw the impulse response function based on the PVAR model estimation results shown in
Figure 1.
From
Figure 1, it can be seen that the impact of a positive standard deviation of one unit of fiscal autonomy brings a significant drop in dwastewater, dexhaustgas, and dsmokedust. Dexhaustgas and dsmokedust reached the lowest point in the third period and remained stable thereafter. This shows that the improvement of FD has effectively curbed the degree of environmental pollution and eased the pressure on the environment. With the official performance appraisal gradually changing the status quo of the GDP-only theory, the country’s transformation of the economic development mode, and vigorously promoting the policy orientation of green development, the expansion of the local government’s financial power makes local governments have more funds to invest in the regional environment to improve the mode of economic development. On top of that, it brings about a reduction in the degree of pollutant emissions. Hypothesis 1 is verified.
The impact of one unit of positive standard deviation of DP brought a rise in the dwastewater, dexhaustgas, and dsmokedust. Among them, DP had the most obvious effect on the elevation of dwastewater, followed by dexhaustgas, and it had the weakest effect on dsmokedust. However, overall, with the expansion of DP, the total discharge of pollutants increased. This shows that under the pressure of very large debt-servicing and repayment, local governments have to pay off debts in order to circumvent the crisis of government credibility, reducing environmental barriers to attract investments and obtain debt-recovery funds at the cost of polluting the environment. Hypothesis 2 is verified.
After being affected by the positive standard deviation of one unit of PG, dwastewater starts from 0, rises to the highest point in the second period, returns to 0 in the third period, and then remains at the 0 point level, indicating that PG’s increase caused short-term fluctuations in dwastewater, but it did not cause the actual rise and fall of dwastewater. At the same time, dexhaustgas dropped from 0 to the lowest point in the third period, then slowly returned to 0, indicating that the increase in PG brought about a reduction in dexhaustgas in the short term. However, in the long term, it did not cause significant changes in dexhaustgas. Finally, dsmokedust stayed at 0 for a long time, indicating that the increase in PG did not affect the changes in dsmokedust. Summarizing the above three impulse response function diagrams, the influence of the increase of PG on different pollutants is not the same and the number of pollutants did not significantly increase. Therefore, there is no “PPE circle” in China. Hypothesis 3a has not been verified.
5.4. Construction and Inspection of a Long-Term Panel Regression Model
The impulse response function can only show the impact of one variable after a positive change in another variable. That is to say, when studying the relationship between the poverty population and environmental pollution, the impulse response function can only show the increase of the poor population to the environment. The impact does not explain the effect of the reduction of poverty on environmental pollution. Therefore, we cannot just rely on the impulse response function to study whether the current poverty reduction in China will have a negative impact on the environment. Based on this, in order to test hypothesizes again, especially to test Hypothesis 3b, we introduced panel regression Models (2)–(4).
In the panel regression model, FD, DP, and PG were used as explanatory variables, and wastewater, exhaustgas, and smokedust were used as explained variables, respectively. Referring to the existing literature, we introduced RC, ED, and EC as control variables. RC is used to demonstrate the impact of changes in the local government financial power on the environmental pollution under regional competition, ED is used to illustrate the extent of economic development on the environment, and EC is used to illustrate that the increase in energy consumption will lead to an increase in pollutant emissions, which will lead to environmental damage.
In order to solve the possible endogenous problems between explanatory variables and explained variables, we first used the Toda-Yamamoto Granger causality test to explore the mutual predictive relationship between variables. If there is a strong mutual predictive relationship between explanatory variables and explained variables, then we need to solve the endogeneity problem first. In the discussion of the previous section, the three variables of EP (wastewater, exhausttgas, and smokedust) are I (1) (first-order single integer variables), and FD, DP, and PG are all sequences of the original order. Therefore, we cannot use the traditional Granger causality test to explore the prediction relationship between them. In fact, same order mono is a necessary basis for cointegration between variables. However, each variable in this paper no longer satisfies this condition. Therefore, the traditional Granger causality test based on the original sequence’s stability or the existence of a cointegration relationship loses its application foundation. The advantage of this status quo is that the probability of a “pseudo-regression” in panel regression is greatly reduced. We can use the Toda-Yamamoto Granger causality test that does not depend on cointegration to explore the mutual predictive relationship between variables. This method was proposed by Toda and Yamamoto in 1995. First, determine dmax (the highest possible single integer order) in the variable, then establish an extended “p+dmax” order VAR model. With the modified Wald test, it is determined whether a variable has a Granger significance causality for other variables by examining whether the coefficient of the p-order lag term is significantly equal to zero at the same time. Obviously, the highest single integer order in this paper is 1, and the optimal lag period for the VAR model determined by the AIC criterion is 3. Therefore, the VAR (3 + 1) model was established. The final results of Toda-Yamamoto Granger causality test are shown in
Table 7.
As can be seen from
Table 7, when FD, DP, and PG are used as Granger causes, except for DP and PG is not Granger causality for wastewater, other results show that the three variables (FD, DP, PG) are all significant Granger causes for EP variables (wastewater, exhaustgas, smokedust). On the contrary, when the EP’s three variables (wastewater, exhaustgas, smokedust) are the causes, except that exhaustgas is the Granger cause of FD and DP, other results show that EP variables are not Granger causes of FD, DP, and PG. Overall, the endogenous problems in panel regression models are not serious. However, in order to more completely mitigate the adverse consequences of the endogeneity problems in the model, we used the lag one-phase independent variable and the current dependent variable in the subsequent regression.
In Models (2)–(4), the concomitant probabilities of the test statistics for each model passed the hausman test were less than 0.05, so we decided to establish fixed effect models. This part uses the panel data of 30 provinces from 2001 to 2016. In order to eliminate the influence of heteroscedasticity, DP, RC, ED, and EC were taken logarithmically. The results of the regression are shown in
Table 8.
Except for Model (3), FD has a significant negative correlation with both wastewater and smokedust, indicating that with the increase of FD, the government has more energy and funds to focus on environmental governance, resulting in an improved environment. This is consistent with the conclusions obtained in the impulse response function.
The results of DP show differences in the three models. In Models (2) and (4), the relationship between DP and wastewater, exhaustgas, and smokedust was not tested. Model (3) showed that DP and exhaustgas were significantly positively correlated. The reason for this phenomenon may be that the relationship between DP and exhaustgas may not be linear and that the coefficients of regression equation reflect only a local dynamic relationship, so a simple linear regression equation cannot show the complexity between the two. In contrast, the impulse response function captures the overall complex and dynamic relationships between variables and, thus, can demonstrate the overall change in environmental pollution as the poverty population changes.
From Model (2), it can be seen that PG and wastewater are significantly negatively correlated. Considering that, since 2001, the number of people in poverty in China has been on a downward trend, and poverty governance has continued to progress, there is no increase in poverty. Therefore, the regression results of Model (2) show that with the decrease of PG, water continuously increases and water pollution is aggravated. The regression results of Model (4) showed that there was a significant negative correlation between PG and smokedust, indicating that as PG decreased, smokedust increased, causing environmental pollution. However, we can also see that in Model (3), with exhaustgas as the explained variable, there is a significant positive correlation between PG and exhaustgas, indicating that with the decrease of PG, exhaustgas is significantly reduced and that the air pollution situation improves. Based on the above regression results, Models (2) and (4) accept Hypothesis 3b. It is believed that the reduction of the poverty population is at the cost of environmental pollution. However, Model (3) rejects Hypothesis 3b and believes that China’s poverty governance has not caused an increase in atmospheric pollutant emissions for a long time. The reason that this paper uses “exhaustgas” (industrial sulfur dioxide emissions) as a variable to quantify the degree of environmental pollution is special. Industrial sulfur dioxide is one of the major pollutants in air pollution and it is also the culprit of the current urban haze phenomenon. For a long time, the air quality of major cities has been unsatisfactory and has become an important factor affecting the daily health of urban residents, especially the haze problem in large cities, such as Beijing. Under the pressure of strong public opinion, major cities have formulated relevant policies and measures to carry out haze governance. More than 20 provincial governments have all introduced and successively implemented relevant measures for controlling air pollution, and the air pollutant emissions have been initially controlled throughout the country. Air pollution control has become a pioneering area in the entire field of environmental governance and has achieved certain results. Therefore, with strong policy guidance, exhaustgas, and PG have shown a significant positive relationship, revealing a clear downward trend between the two. Based on the above results, we can conclude that for a long time, the reduction of PG in China led to a significant increase in water and gas pollution, but in the area of air pollution control, gas pollution did not conflict with PG. On the whole, China has long achieved the goal of reducing poverty at the cost of the environment.
5.5. The Relationship between Poverty Governance and Environmental Pollution in the New Period
It is worth noting that China’s proposal for a 2020 victory to eradicate poverty and further implement the green development strategy is something that has happened since 2012. Therefore, when we study the relationship between poverty governance and environmental pollution under policy pressures, the data since 2012 is a more accurate research window. Therefore, we have selected the data from 2012 to 2016 in this part to conduct further research on environmental pollution caused by fiscal stress and poverty governance. Based on this, in order to test hypotheses again, especially to test hypothesis 3b, we introduced panel regression Models (5)–(7). The concomitant probabilities of the test statistics for each model that passed the Hausman test were less than 0.05, so we decided to establish fixed effect models to test the effect of FD, DP, and PG on EP in 2012–2016. The model regression results with EP (wastewater, exhaustgas, and smokedust) as explained variables are shown in
Table 9.
FD is negatively related to EP. In Models (6) and (7), there was a significant negative correlation between FD and exhaustgas or smokedust. In Model (5), the relationship between FD and EP is not significant, but the coefficient is positive. It shows that, since 2012, the expansion of fiscal power in various regions has brought about a reduction in the emissions of various environmental pollutants. This is consistent with the conclusions reached earlier and, once again, Hypothesis 1 is confirmed.
In Models (5)–(7), DP and EP were positively correlated, in which Models (5) and (6) were not significant and Model (7) was significantly positively correlated. Again, verifying Hypothesis 2.
Models (5)–(7) did not test the significant correlation between PG and EP, but from the regression coefficient point of view, the regression coefficients of PG in the three models are all positive. This result indicates that the PG decreased with the reduction of EP. Basically verifying H3b again. This result can illustrate two issues. First, China has adopted a policy of transforming the mode of economic development, implementing the policy of green development, and reducing economic and social development at the cost of the environment. Over the past few years, poverty alleviation and fighting against economic development have become less dependent on environmental destruction and this has brought about a non-significant regression coefficient. Second, environmental protection and economic development are not fundamentally antagonistic. We can achieve environmental protection in the process of promoting economic development, and we can even exchange economic development from environmental protection. Under the guidance of green development, poverty governance is gradually drawing on nutrients from environmental protection to achieve a mutually beneficial win-win situation between environmental protection and poverty governance, thus, bringing about a positive regression coefficient. Based on the above results, it can be proved that in recent years, China’s strategy of comprehensively eradicating poverty and promoting the transformation of economic development methods and realizing green development has not produced conflicting phenomena. In the process of poverty reduction by local governments, there was no environmental sacrifice. In exchange for the effect of reducing poverty, at this stage, especially in recent years, there has been no “environmental trap” in China.
In summary, wastewater, exhaustgas, and smokedust are used as surrogate variables of EP to measure their response to FD, DP, and PG, respectively, and a relatively consistent conclusion is drawn. This shows that this study has robustness.


