Abstract
Despite a global push in the development and implementation of widespread alternative energy use, significant disparities exist across given nation-states. These disparities reflect both technical and economic factors, as well as the social, political, and ecological gaps between how communities see energy development and national/global policy goals. Known as the “local-national gap”, many nations struggle with fostering meaningful conversations about the role of alternative energy technologies within communities. Mitigation of this problem first requires understanding the distribution of existing alternative energy technologies at the local level of policymaking. To address the limitation of existing adoption trend analysis at the scale of local governance (e.g., county governments), this paper demonstrates a novel method for contextualizing solar technology adoption by using the State of Georgia in the United States as an exemplar. Leveraging existing work on the Gini Coefficient as a metric for measuring energy inequity, we argue these tools can be applied to analyze where gaps exist in ongoing solar adoption trends. As we demonstrate, communities that adopt solar tend to be concentrated in a few counties, indicating existing conversations are limited to a circumscribed set of social networks. This information and the model we demonstrate can enable focused qualitative analyses of existing solar trends, not only among high-adoption areas but within communities where little to no adoption has occurred.
1. Introduction
Access to clean and reliable forms of energy across spatial and socioeconomic barriers continues to hamper global sustainable development goals. As of 2014, approximately 97% of urban communities had access to electricity, as compared to 73% in rural locations [1]. The disparity between rural and urban energy access is not merely a product of economics and technology. It is an emergent quality of the complex social, economic, political, and technological factors that inflect how individual communities become enmeshed in existing energy systems. In historical cases, such as the rural southern United States, communities depended on federal-level support to enable the creation of local “electricity cooperatives”: locally managed organizations tasked with providing electrification infrastructure where large power companies would (or could) not reach. These cooperatives, focused on local consumer wants and needs, provided a socially responsive alternative model to large private utilities primarily interested in the expansion of their customer bases [2]. Contemporary case studies, such as the planned Boulder, Colorado, 100% renewable municipal power company or the Investment on the part of Utah’s municipal power systems in developing small modular reactors (SMRs), further indicate how such community-level decisions can impact the emergence and operation of specific types of energy technologies and systems.
Individual communities do not necessarily share the same energy wants and needs, and as noted in multiple studies of energy development projects [3,4] the alignment of value systems between energy sources and local needs play a significant role in how—if at all—these sources are used. Sovacool [5] (p. 705) notes that several factors, many of which revolve around local concerns, drive the processes of energy development:
Acceptance and rejection at the scale of local communities tends to revolve around issues related to environmental quality, procedural justice, distributional justice and trust, yet at larger scales involve broader socio-political and market dimensions related to public approval, electricity prices, profits for Investors, and ability to Improve energy security.
When local value systems and regional/national priorities align, cases such as the cooperative utility system in the United States can emerge. However, a lack of alignment can devolve into contentious and sometimes drawn out debates. These moments of conflict between community values and other, usually national, priorities are paradigmatic of what scholars have called the “NIMBY” or Not-In-My-Back-Yard syndrome. Characterized by intense emotional activity geared towards political action [6] at the local, regional, and even national level, NIMBYism represents an attempt by scholars to characterize why communities resisting large technological projects (especially large ones) tend to behave in similar manners. Though initially reserved for studies of opposition to siting projects with potential negative environmental effects (nuclear and other hazardous waste sites) scholars more recently have applied the term to a variety of anti-siting movements, including those around renewable energy [7,8].
What the idea of NIMBYs belies is the complex systems that underlie how humans experience and come to understand the role of technology—and in particular energy technologies—in daily life. Local opposition to the siting of energy projects is a product of how communities see themselves, their value systems, and the physical landscape within their larger sense of collective responsibility at the local, regional, and national levels [9,10,11,12]. Similarly, as noted in Smith and Tidwell [13], local support for specific energy technologies and industries can create similar discords between communities and national priorities. Importantly, social and physical distance from existing analogous energy projects play a direct role in shaping how communities come to understand how these technologies do and could shape their daily lives.
The social and physical distances between where people live their daily lives and where governments define national priorities are a critical, yet only recently explored, phenomena. A burgeoning area of research, studies of this ‘local-national gap’, seek to establish a space for national policy analyses and studies of individual motivations with community-level dynamics. Social, political, community, and market acceptance all play a role in the emergence of specific energy technologies in communities, as well as how they are deployed and to what ends [14,15,16]. Rather than focusing on how local opposition (or support) for an energy technology, studies of the local-national gap emphasize understanding how individual and community decision-making processes reflect the larger networks of norms and values that shape their daily lives.
The Energy Information Administration positions Georgia as a leader in biomass energy production and an emerging space for the deployment of photovoltaic solar in the utility, commercial, and residential sectors [17]. Its status as an emergent space for PV solar is reflective of the perceived high potential for solar energy in Georgia in terms of solar insolation—it having some of the highest in the southeastern United States (Figure 1).
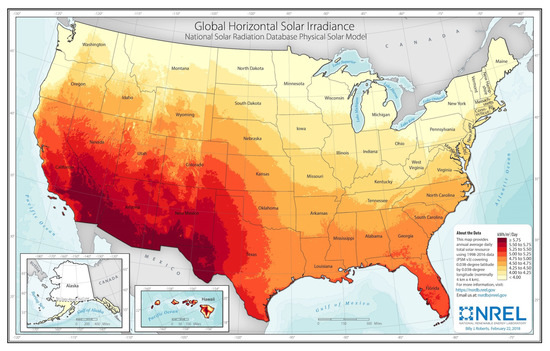
Figure 1.
Solar irradiance map of the United States [18].
Due to this quality, the size of the Georgia economy (9th in the country by Gross Domestic Product), and its existing energy system characteristics, Georgia is posited to be one of the states with the highest potential for solar deployment [19].
Recent trends in solar adoption would seem to reflect these analyses. Between 2017 and 2018, total net generation from solar photovoltaic rose from 22nd in the nation [20] to 9th [17], moving Georgia from laggard to leader in solar power production [21]. Policy changes, including the Solar Power Free-Market Financing Act of 2015, have opened possibilities for integrating solar from third-party producers despite the lack of net metering policies or a Renewable Portfolio Standard. Despite this seemingly positive uptake in energy generation through solar-powered technologies, a closer look locally indicates that the primary driving force is the integration of several utility and commercial-scale solar facilities.
In 2018, Georgia ranked 37th in power generated from residential PV solar: making it the lowest ranked state among the top ten in total PV solar energy production. Despite recent increases in the annual generation of electricity from solar installations in the state of Georgia—primarily a result of new utility-scale installations [17]—there is still a significant amount of potential for solar technology adoption for Georgia (see Table 1 [22]).

Table 1.
Georgia Energy Data solar electric installations Summary.
According to the NREL Rooftop Solar Photovoltaic Technical Potential in the United States: A Detailed Assessment [23], Georgia has a total combined annual generation potential (solar) percentage of sales (from small, medium, and large rooftops) of 33.8%, which is not an insignificant amount for a state comprised of 10.31 million people (see Table 2).
Table 2.
NREL rooftop solar capacity and generation potential estimations.
When we compare the data from NREL’s estimates to the number of installations accounted for in the state of Georgia, we notice that there is a significant amount of potential for rooftop PV adoption throughout the state to meet the 33.8% generation potential they estimate as being potentially sold in this state. The question that we are left with is, “despite the uptake in the last few years in solar adoption in Georgia, what factors characterize those counties that have certain types of solar installations, or even no installations at all?”
While studies of the local-national gap bridge a key limitation of the NIMBY framework, the growing body of work continues to focus on moments of conflict between communities and planned energy projects. As a result, analyses are effective for analyzing ongoing and completed conflicts, but at the cost of always responding to, rather than engaging in at early stages, potential energy project conflicts. Moreover, the body of literature has yet to demonstrate an effective model for scaling these analyses in such a way that researchers and policymakers can identify opportunities for productively engaging in emergent local debates. As noted by Warren et al. [11] the presence of alternative energy technologies within one’s physical landscape and social networks are the strongest predictors of emergent attitudes towards these technologies. Consequently, if we are to study at scale how communities understand energy technologies we must first understand the distribution of these “opportunities” to develop local viewpoints. To address this need for better understanding the nature of local-national gap issues, this paper seeks to demonstrate a novel method for contextualizing solar technology adoption at a level of scale that represents local governance, using the State of Georgia in the United States as an exemplar.
The rest of the paper seeks to demonstrate this method. Section 2 contains an overview of the data used in this study, as well as its treatment during analysis. It focuses primarily on demonstrating the highly non-parametric pattern to solar technology adoption that is present in the state. In Section 3, we share our results, drawing from global development literature to show that current solar trends in Georgia are skewed towards a limited number of counties: specifically using Gini coefficients and the Lorenz curve as a measure of inequity between communities. The fourth section of this paper, provides a Discussion of the complexity in the social aspects of adoption on the county level and the importance of social programs (e.g., “Solarize" campaigns) for enabling community members to access resources and opportunities for adopting solar. We argue that these social factors, and the ability for people to have meaningful access to conversations about solar relevant to their communities, may be playing a more significant role than has previously been ascribed. In the fifth and final section of this paper, we conclude that understanding these value systems will require a pairing of both the material dimensions of solar adoption (the physical facilities and systems) with a large-scale qualitative analysis of how community members in low-adoption areas understand the role of solar in their lives.
2. Methods and Materials
The dichotomy between Georgia’s utility and industrial scale production capabilities and its residential sector makes the state unique among its peers, suggesting that the conditions that influence how solar emerges in the state do not align with the trends of other key producers. To this end, we present a case study of solar adoption in Georgia, performing an analysis at the county level to uncover ground truth data for learning where PV technology adoption efforts can more effectively take place.
Our distinctive choice to focus on counties as the locus of local governance reflects the critical role this level of power enacted plays in the Georgia energy landscape. Georgia counties are the locus of building codes, permitting, and taxation, directing key interactions necessary for the siting of solar facilities regardless of scale [24]. Counties also function as the place where societal commitments and institutional frameworks intersect in the processes that turn visions of alternative energy installations into reality. Georgia’s counties are representative of what Timothy Foxon [25] has called ‘institutional lock-in’: the significant power historically contextualized governance structures can play in shaping contemporary policies around technology adoption.
Focusing on the county-level also avoids a key limitation of other large-scale energy trend analyses, namely the use of postal codes (such as the Zoning Improvement Code, or ZIP code in the United States) as the scale of spatial analysis. While ZIP codes cover a much smaller physical area and may reflect key socioeconomic characteristics within a community (race, wealth, home ownership), they do not reflect the scale at which governance and public engagement within Georgia occur. This differentiation is critical given the choices by state politicians and regulators in the Public Service Commission to pursue a ‘free-market’ model of energy development. With no explicit state incentives for solar programming, counties are the political arena where community members debate the value of solar for their community and establish processes to enable/constrain its development.
As energy policy analysts in Georgia have noted, public engagement and municipal governance play a direct role in residential solar development [26]; our analysis seeks to move beyond residential to look at the trends of solar PV adoption. Our methods also eschew a focus on analyzing total installed generating capacity for PV in favor of looking at the number of installations present in each county. Taking inspiration from North and Weingast [27], we argue that the ability to install every solar facility is dependent on a stable set solar “rules of law” that do not differentiate based on the actor requesting the service. While specific elements of the cost of installing different kinds of installations vary, these “soft costs” (customer acquisition, permitting, taxation, financing, and others) depend on existing governance structures that make it possible to envision developing new energy facilities.
To take on this methodological challenge, we began by aggregating several datasets that capture different aspects of the sociocultural systems underlying adoption of rooftop PV in local communities: solar installation information [22,27], percent suitability of rooftops by county [28], population demographics [29], house and rental property values [30], all known state and federal renewable energy incentives for each county [31], and utility rates [32]. The variables for each county were then collected, combined, and made available in the Social Energy Atlas SolarView application (http://sea.galib.uga.edu/solarview) and dataset, which is provided as supplementary material to this article [33].
In this study, we are interested in analyzing where solar technology has already been adopted, as each PV installation demonstrates a commitment by individuals and communities to adopting this technology and an encumbrance of the soft costs. Moreover, we wanted to better understand the nuances between those adoption rates and the characteristics of those communities such as population total and median income. Thus, two of the tables within this database were of interest for this paper. After these tables were retrieved, they were then analyzed to determine what relationships, if any, were present between the social variables (e.g., census demographic information) and the frequency of solar adoption of each county. See Figure 2 for a description of this process.
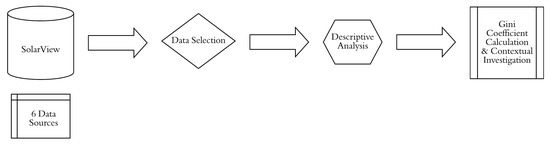
Figure 2.
Methods process diagram.
Databases and Sources
The solar installation data for the state of Georgia present in the SolarView dataset was obtained from NREL’s Open PV Project (http://openpv.nrel.gov) and Southface’s Solar Map of Georgia (Figure 3) [22].
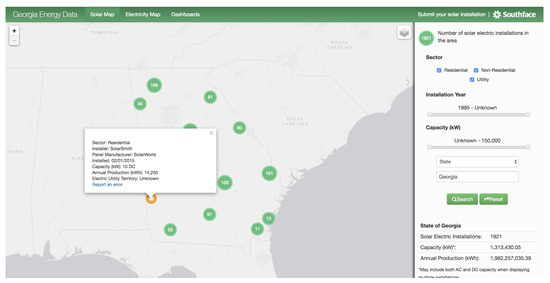
Figure 3.
Southface’s Georgia Energy Data Solar Map, which can be found at http://georgiaenergydata.org.
All collected variables from each dataset were reconciled with one another, so as to obtain a more complete understanding of adoption frequency across the state, and the summative counts of installations by type for each county were then cross-referenced with population demographics that were obtained from the U.S. Census Bureau’s 2015 American Community Survey [29].
3. Results
At the time of collection (January 2018), 2147 documented solar installation data points were obtained for the state of Georgia. It was discovered that 8% of the solar installations were utility-scale, 29% were classified as non-residential, and the remaining 63% were residential installation. These installations were then organized by county and type (residential, non-residential, and utility), for analysis in the context of Georgia’s scale of governance (see Table 3).
Table 3.
Excerpt of Georgia solar installation frequencies by county and type ranked descending (Top 10%).
An initial analysis of the data indicates that it does not follow a normal distribution. As when data was ranked by installation frequency, we can see that the mean is skewed significantly—so as to not provide an adequate description of the entire sample population (mean = 13.50 with a standard deviation of 29.26, median = 6, mode = 5). From these adoption numbers, we first notice just how skewed adoption frequency is in Georgia on a county-by-county basis. The top 25% of counties have a total of 13 installations or more–with the county possessing the highest number of installations being Fulton County (part of the Atlanta metropolitan area) at 239. As can be seen in Figure 4 on the next page, 75% of the state’s solar installations are accounted for by only 40 counties. That being said, this top quartile of counties do represent 65% of the total population of Georgia (see Table 4), and represent three key Metropolitan Statistical Areas (MSAs): Atlanta, Athens, and Savannah, in the darker blue colors (see Figure 4).
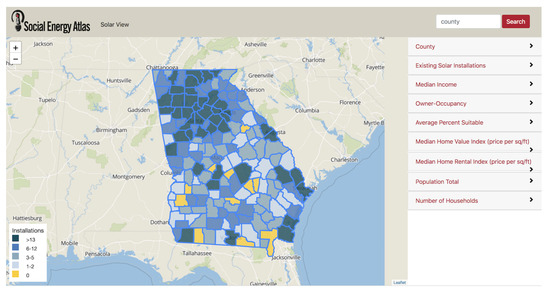
Figure 4.
Map of total Georgia solar installations by quartile from the Social Energy Atlas SolarView tool.
Table 4.
Total Georgia solar installations and demographics by quartile.
From this data, we can see that there is a significant discrepancy between the governing bodies (counties) that are the most frequent adopters of solar PV and those who do not at all. Methods for measuring and assessing such discrepancies are as rare as the presence of nonparametric data in energy policy research [34]. One study that proposes a metric for understanding consumption of energy or energy technologies is Jacobson, Milman, and Kammen’s work on Lorenz curves and Gini coefficients as metrics of equitable energy distribution [34]. Developed as a technique in economic research for measuring resource inequality between subgroups in a population [35,36,37], the Gini coefficient is a common analytical tool today for assessing global income inequality [38].
Jacobson, Milman, and Kammen, building on Saboohi’s [39] examination of the differential effects of energy subsidies on urban and rural populations in Iran, argue that Gini coefficients of energy consumption can provide a useful metric for evaluating comparatively and across time the equity in energy access. Despite the fact that Gini coefficients are a rather simplistic tool and can sometimes lead to oversights regarding causation (e.g., the relationship between such observations and structural changes in society), we are in consensus with Jacobson, Milman, and Kammen that such an approach makes sense when one is wanting to better understand distributions in the consumption of energy: the interest of this article being the installation of solar technologies at a local level. This approach results in a method that allows us the ability to determine the level of disparity in solar adoption across specific actors within a system: e.g., across counties within the state of Georgia.
Examining Engagement in Solar Technology Adoption with the Lorenz Curves and Gini Coefficient
For the purposes of analysis, we have applied the Lorenz curve and Gini coefficient calculations to obtain an understanding of the inequality in solar installations present in Georgia’s 159 counties. Our Lorenz curves are a ranked distribution of the cumulative percentage of the counties versus the cumulative percentage of installations along the x-axis. The greater the distance this curve is from the line of equality, the greater the inequality in solar installations. The Gini coefficient is merely a numeric measure of inequality (or the area between the line of equality and the Lorenz curve). We have calculated our Gini coefficient for solar adoption in a similar manner to Jacobson, Milman, and Kammen [34], as
where Xi is the number of governing bodies (counties) in the population group (state) i and Y the quantity of solar installations present for each governing body ordered from lowest to highest number of installations. The Gini coefficient ranges from perfect equity among all governing bodies (Gsa = 0) to complete inequity (Gsa = 1).
Looking at the total number of solar installations across the state of Georgia, we can see that the Lorenz curve (Figure 5) and corresponding Gini coefficient corroborate what was noticed earlier in the frequency data alone that there are dramatic differences in the frequency of adoption between Georgia’s counties (Gsa = 0.6608).
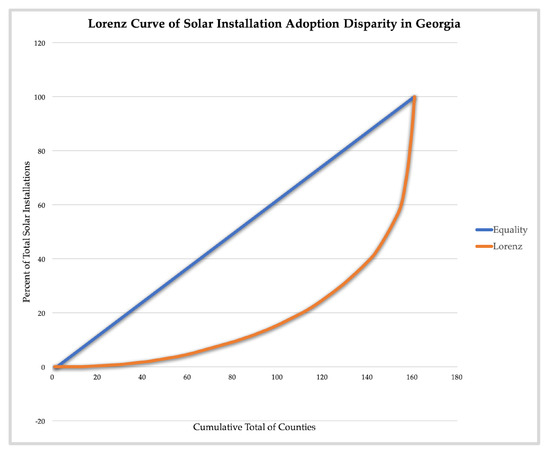
Figure 5.
Lorenz Curve of the solar installation adoption disparity for Georgia, U.S.A.
These disparities are also present when we look at the difference in the Gini coefficients for the state across the different types of solar installations (Table 5).
Table 5.
Gini Coefficients for Georgia by type of solar installation.
When we zoom in and look at each type of solar installation we will notice that not only do the discrepancies in the adoption of solar PV change by way of the Gini coefficient, but also that the rank-order of the counties and other demographic characteristics like population and income of those counties change as well by installation type (Table 6, Table 7 and Table 8).
Table 6.
Excerpt of Georgia residential solar installation frequencies by county ranked descending (Top 10%).
Table 7.
Excerpt of Georgia non-residential solar installation frequencies by county ranked descending (Top 10%).
Table 8.
Excerpt of Georgia utility solar installation frequencies by county ranked descending (Top 10%).
4. Discussion
Jacobson, Milman, and Kammen [34], proposed that Lorenz curves can provide an important way of measuring quantitatively different amounts of energy consumption, but they do not measure the differential of energy services. Similarly, our approach provides a means of using Lorenz curves to measure the capacity of engagement with solar adoption but not necessarily financial commitment or production capacity. Moreover, the differences in Gini coefficient values for each type of solar installations outlined above indicate the possibility for different motivations for adoption at the county-level: indicating a level of complexity in engagement in local adoption of solar energy that requires further investigation. By focusing on the opportunities for interaction (or lack thereof) between community members and solar energy, our study differs in two critical ways from previous works examining the motivations and distribution of solar adoption/non-adoption [40,41]. First, by choosing to focus our attention at the county level we eschew the use of postal codes (ZIP codes in the United States) in favor of studying the level of social and political abstraction where decisions are made about the policies and procedures that govern who can adopt solar, where, and to what ends. This choice is reflective of our argument that local-national gaps in the adoption/non-adoption of solar run do not exist in a vacuum but are directly impinged upon by how localities choose to imagine the role of new energy technologies in daily life. Second, rather than focusing on solar energy adopters, we look at the act of solar energy adoption as an emerging characteristic of the systems rather than a desired ending result. This distinction is important as it reflects our focus on understanding where inequities (as expressed through the Lorenz curves and Gini coefficient) may exist within and between communities.
In Tidwell and Tidwell [42], it was proposed that the Social Energy Atlas’ desire to collect over 1500 individual narratives of perception around solar technology adoption at the county level in Georgia would be of benefit to mitigating the local-national gap as a means of understanding the collective norms and values a society shares surrounding energy systems. With these findings regarding the disparity in adoption of solar technology on the county in Georgia—using the Gini coefficient—it appears as though the combination of quantitative analysis of adoption with interview data will provide important context for working with specific counties in the State of Georgia to investigate why they have such a high degree of engagement in certain types of solar technologies (or not) in comparison to other counties in the state. Below we outline some observed patterns within the data analyzed here and, importantly, how they can inform not only research in this study, but future works analyzing adoption trends at scale.
4.1. Solar Community Campaigns: The Role of Solarize
The method established through the Social Energy Atlas [42] and outlined in this paper affords us the ability to better understand how social innovations—programs and business models that seek to incorporate local values into the energy technology adoption process—effect the inclusion of communities. One such social innovation around solar technologies in the United States has been the Solarize Campaign Program. Funded by the U.S. Department of Energy, U.S. Environmental Protection Agency, U.S. Department of Housing and Urban Development, and the U.S. Department of Agriculture, Solarize programs are typically grassroots efforts to facilitate communities’ abilities to collectively purchase solar PV [43] and have seen success across the United States since the first Solarize Portland campaign in 2010. To our knowledge, there have been seven Solarize programs within the state of Georgia: Savannah, Athens, Decatur/DeKalb, Dunwoody, Atlanta, Carrollton/Carroll, Newton/Morgan–with the last three of this list being active programs (SolarCrowdsource.com). The impact of these seven programs can be seen in the counties ranked as having the highest total installations in the state (Table 9).
Table 9.
Top quartile counties covered by Solarize campaigns in Georgia.
While we do not have enough evidence to state that Solarize campaigns are the reason for an increase in total installations on the county level, we are able to confirm that the Solarize campaigns affiliated with each of these counties were met with acceptance and local buy-in on the part of the individuals living in those communities. Why these communities embraced such programs of policy is a question that is currently under investigation by the Social Energy Atlas. It Is possible that Georgia’s campaigns, like other solar community campaigns [44,45] enable the development of small “niches” where local actors (business and community leaders) can network with state and national resources to enable change. However, as we argued earlier, without a clear analysis of spaces where adoption is and is not occurring we cannot say definitely if it is the Solarize campaigns themselves or some facet of how they enmesh themselves in a community that enables local adoption.
4.2. Utility-Scale Solar
For Georgia, the existence of multiple utility-scale solar correlates with median income in the county. While the motivations of utilities for placing large renewable energy facilities in lower-income areas is a topic of current debate [46,47] we do not find it appropriate at this time to hypothesize as to why we are finding the number of utility-scale installations correlated with the median income of Georgia counties. What we can say, definitively, is that these facilities are an indicator of some form of local buy-in of the states’ utilities decision to adopt solar technology in these counties. Further qualitative data is still needed to better understand the perceptions of the residents in those counties and their receptivity to renewable energy technologies such as photovoltaic solar.
4.3. Non-Adoption Counties
Of Georgia’s 159 counties, only 11 counties have no documented solar installations: Ben Hill, Bleckley, Charlton, Echols, Grady, Montgomery, Peach, Randolph, Taliaferro, Webster, and Wheeler (see Figure 6 on the next page). These counties represent an important subset of social and political units within the state that merit investigation into the local factors driving solar adoption decision-making. As a whole, the counties listed are neither the least populated (Taliaferro being the exception as the least populous county), nor are they the poorest (Table 10).
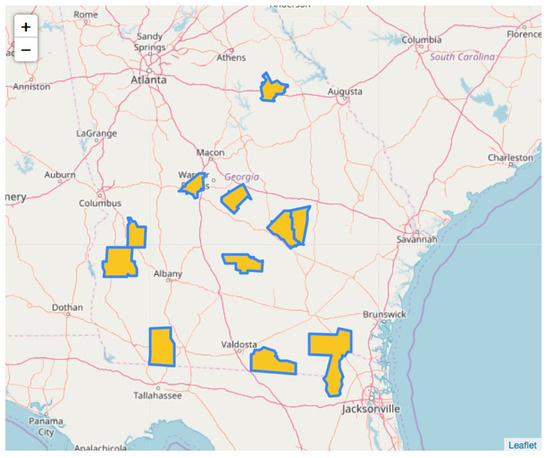
Figure 6.
Georgia counties having no documented solar installations.
Table 10.
Median income of Georgia counties with no documented solar installations.
Studies of technology non-adoption in the energy sector strongly indicate that a multitude of local factors pertaining to adoption—including financial structures, socioeconomic status, business models, and local aesthetic values [48]. Unsurprisingly, the common factor shared between these counties is a predominantly rural landscape dominated by agrarian businesses. For example, Peach County—the self-proclaimed peach capital of the state—is home to a rich agricultural industry that has only recently intersected with the growing exurbs of the city of Macon. More investigation is needed into better understanding the individual perceptions of the people who reside in these locations so as to create a more robust model for bridging the gap between national policies surround solar technology adoption and local governing bodies such as these counties.
To that end, this study should be understood as a snapshot of existing Georgia solar adoption trends, and not a reflection of past or future trends. As noted by other scholars of energy decision-making patterns [49], future predictions of energy trends are inevitably flawed as they incorporate more often than not an assumption that the future will look generally like present daily experience. Future research should attend more readily to exploring not only patterns of adoption, but who does not adopt and why. Achieving this goal will require new analyses that focus on the perception and impact of solar facilities of all scales within specific communities and social networks. Furthermore, such analyses should involve gathering key contextual information (history of community, key industries, social and economic characteristics) as well as incorporate best practices from focus group and semi-structured interview research within the context of energy research and social science [50], rather than the agency individuals and communities have over choosing to or to not adopt, has the potential to reinforce the rhetoric of NIMBYism and further widen the gap between national policy and local action.
5. Conclusions
Despite the burgeoning body of work examining the gaps between national energy priorities and local acceptance of these new systems and technologies—such as photovoltaic solar—few studies have sought to develop a technique for mapping these gaps at scale. Such local-national gap issues are as much about social, political, and ecological factors as they are about econometrics and technical feasibility. Moreover, the opportunities for engaging in productive conversations about the future of new energy technologies is inflected by the presence of such technologies in existing social and political networks. In this paper, we have sought to demonstrate how an established technique for examining disparities in access to resources—the Gini coefficient and Lorenz curve—can be applied to examining technology adoption/non-adoption in terms of level of disparity in access to the solar adoption networks across Georgia.
The Gini coefficient analysis enables our ability to “see” these disparities across space and between local political units. Yet as we note the technique creates opportunities for examining these disparities, but not for understanding why they occur. To better understand the context underlying observations regarding disparities in adoption of solar technologies more work is needed to understand the larger landscape of hopes, dreams, and individual/collective choices that underpin local societies’ adoption of energy innovations influenced by national policy. Using quantitative tools like the Gini Coefficient as a measure of disparity in energy technology adoption at local scales in conversation with the collective stories and perceptions of individuals at the local level opens up new possibilities for bridging the local-national gap and facilitating equitable and just energy transitions. Such quantitative tools can help scholars and practitioners hone in on spaces where opportunities—or the lack thereof—to establish conversations about the role of specific energy technologies exist within a given society.
Our study advances methodological techniques for examining the distribution of social innovations in the energy sector—such as photovoltaic solar—through the analysis of existing datasets by functional level of governance. This approach by no means addresses all the complex interactions that comprise the ‘local-national gap’ for Georgia or any other community. Rather, our intent is to characterize the Georgia photovoltaic solar ‘gap’ and demonstrate how quantitative analyses that respect where policy occurs have the potential to elucidate important and unexplored trends. Future research from the Social Energy Atlas will focus on contextualizing the trends identified above with an eye towards how community members, policymakers, and scholars can create tractable and desirable local solutions.
Supplementary Materials
The dataset for this article is available online at http://github.com/social-energy-atlas/solarview-data. doi:10.5281/zenodo.1477581.
Author Contributions
Conceptualization, J.H.T. and A.T.; Methodology, J.H.T.; Software, J.H.T., S.N.; Investigation, J.H.T., S.N.; Resources, J.H.T., A.T., Data Curation, J.H.T., S.N.; Project Administration, J.H.T.; Funding Acquisition, J.H.T., Writing, J.H.T., A.T., and S.N.; Supervision, J.H.T.
Funding
This project was funded with generous support from the United States Department of Energy Solar Energy Technologies Office, award DE-EE0007664. It is with these funds that both this article and the data resulting from Social Energy Atlas operations are made freely available.
Acknowledgments
The authors would also like to acknowledge the work of Marcus Hill in the design and development of the Social Energy Atlas SolarView application, as well as the diligent work by Southface in collecting and visualizing all of Georgia’s solar installations available at http://georgianenergydata.org.
Conflicts of Interest
The authors declare no conflicts of interest.
Abbreviations
The following abbreviations are used in this manuscript:
| SEA | Social Energy Atlas |
| PV | Photovoltaic |
References
- World Bank. State of Electricity Access Report; Technical Report for the World Bank; Energy Sector Management Program: Washington, DC, USA, 2017. [Google Scholar]
- Yadoo, A.; Cruickshank, H. The value of cooperatives in rural electrification. Energy Policy 2010, 38, 2941–2947. [Google Scholar] [CrossRef]
- McKay, K. Socio-Cultural Dimensions of Cluster vs. Single Home Photovoltaic Solar Energy Systems in Rural Nepal. Sustainability 2010, 2, 494–504. [Google Scholar] [CrossRef]
- Zhao, X.; Zhao, H.; Jiang, L.; Lu, C.; Xue, B. The Influence of Farmers’ Livelihood Strategies on Household Energy Consumption in the Eastern Qinghai-Tibet Plateau, China. Sustainability 2018, 10, 1780. [Google Scholar] [CrossRef]
- Sovacool, B. Exploring and Contextualizing Public Opposition to Renewable Electricity In the United States. Sustainability 2009, 1, 702–721. [Google Scholar] [CrossRef]
- Kraft, M.; Clary, B. Citizen Participation and the NIMBY Syndrome: Public Response to Radioactive Waste Disposal. West. Political Q. 1991, 44, 299–328. [Google Scholar] [CrossRef]
- Bigerna, S.; Polinori, P. Assessing the Determinants of Renewable Energy Acceptance Integrating Meta-Analysis Regression and a Local Comprehensive Survey. Sustainability 2015, 7, 11909–11932. [Google Scholar] [CrossRef]
- Petrova, M. NIMBYism revisited: Public acceptance of wind energy in the United States. WIREs Clim. Chang. 2013, 4, 575–601. [Google Scholar] [CrossRef]
- Freudenberg, W.; Pastor, S. NIMBYs and LULUs: Stalking the Syndrome. J. Soc. Issues 1992, 48, 39–61. [Google Scholar] [CrossRef]
- Kim, E.; Chung, J.; Seo, Y. Korean traditional beliefs and renewable energy transitions: Pungsu, shamanism, and the local perception of wind turbines. Energy Res. Soc. Sci. 2018, 46, 262–273. [Google Scholar] [CrossRef]
- Warren, C.; Lumsden, C.; O’Dowd, S.; Birnie, R. ‘Green on Green’: Public perceptions of wind power in Scotland and Ireland. J. Environ. Plan. Manag. 2005, 48, 853–875. [Google Scholar] [CrossRef]
- Wolsink, M. Entanglement of Interests and Motives: Assumptions behind the NIMBY-theory on Facility Siting. Urban Stud. 1994, 31, 851–866. [Google Scholar] [CrossRef]
- Smith, J.; Tidwell, A. The everyday lives of energy transitions: Contested sociotechnical imaginaries in the American West. Soc. Stud. Sci. 2016, 46, 327–350. [Google Scholar] [CrossRef] [PubMed]
- Batel, S.; Devine-Wright, P. A critical and empirical analysis of the national-local “gap” in public responses to large-scale energy infrastructures. J. Environ. Plan. Manag. 2015, 58, 1076–1095. [Google Scholar] [CrossRef]
- Hess, D.J.; Mai, Q.D.; Skaggs, R.; Sudibjo, M. Local matters: Political opportunities, spatial scale, and support for green jobs policies. Environ. Innov. Soc. Transit. 2018, 26, 158–170. [Google Scholar] [CrossRef]
- Wüstenhagen, R.; Wolsink, M.; Bürer, M.J. Social acceptance of renewable energy innovation: An introduction to the concept. Energy Policy 2007, 35, 2683–2691. [Google Scholar] [CrossRef]
- U.S. Energy Information Administration. Electric Power Monthly February 2018; U.S. Government Printing Office: Washington, DC, USA, 2018. Available online: https://www.eia.gov/electricity/monthly/archive/february2018.pdf (accessed on 8 November 2018).
- Global Horizontal Solar Irradiance 1998–2016. Available online: https://www.nrel.gov/gis/images/solar/solar_ghi_2018_usa_scale_01.jpg (accessed on 15 January 2018).
- Croucher, M. Optimal Deployment of Solar Index. Electr. J. 2010, 23, 75–81. [Google Scholar] [CrossRef]
- U.S. Energy Information Administration. Electric Power Monthly February 2017; U.S. Government Printing Office: Washington, DC, USA, 2017. Available online: https://www.eia.gov/electricity/monthly/archive/february2017.pdf (accessed on 8 November 2018).
- Rojc, P. Georgia’s Conservative Path to a Solar Power Boom. Planetizen, 30 June 2018. [Google Scholar]
- Georgia Energy Data. Available online: http://www.georgiaenergydata.org/solarmap (accessed on 25 July 2018).
- Gagnon, P.; Margolis, R.; Melius, J.; Philips, C.; Elmore, R. Rooftop Solar Photovoltaic Technical Potential in the United States: A Detailed Assessment; Technical Report; United States National Renewable Energy Laboratory: Golden, CO, USA, 2016.
- Vyas, A. Georgia’s County Governments. Available online: https://www.georgiaencyclopedia.org/articles/counties-cities-neighborhoods/georgias-county-governments (accessed on 27 July 2018).
- Foxon, T.J. Technological and Institutional “Lock-In” as a Barrier to Sustainable Innovation. Unpublished work. 2002. Available online: https://www.imperial.ac.uk/media/imperial-college/research-centres-and-groups/icept/7294726.PDF (accessed on 27 July 2018).
- Shea, B. The State of Rooftop Solar in Georgia. Sustainable Communities. 23 July 2018. Available online: https://leadership.saportareport.com/sustainable-communities/2018/07/23/the-state-of-rooftop-solar-in-georgia/ (accessed on 8 November 2018).
- North, D.C.; Weingast, B.R. Constitutions and Commitment: The Evolution of Institutions Governing Public Choice in Seventeenth-Century England. J. Econ. Hist. 1989, 49, 803–832. [Google Scholar] [CrossRef]
- Phillips, C.; Melius, J. U.S. PV-Suitable Rooftop Resources. 2016. Available online: https://data.nrel.gov/submissions/47 (accessed on 15 January 2018). [CrossRef]
- United States Census Bureau. American Community Survey, 2010–2016 Five-Year Profiles; Generated by Jacqueline Hettel Tidwell. Using American FactFinder. Available online: https://factfinder.census.gov/faces/nav/jsf/pages/index.xhtml (accessed on 15 January 2018).
- Zillow Home Value Index Data 2018. Zillow Research. 2018. Available online: http://zillow.com/research/data (accessed on 15 January 2018).
- DSIRE-Programs. Available online: http://programs.dsireusa.org/system/program?fromSir=0&state=GA (accessed on 15 January 2018).
- U.S. Electric Utility Companies and Rates: Look-Up by Zipcode (2015). National Renewable Energy Laboratory. 2015. Available online: https://catalog.data.gov/dataset/u-s-electric-utility-companies-and-rates-look-up-by-zipcode-2015-8c84b (accessed on 15 January 2018).
- Tidwell, J.H.; Nelson, S.; Hill, M.; Tidwell, A.S.D. SolarView: Georgia Solar Adoption in Context. Data 2018. preprinted version. [Google Scholar] [CrossRef]
- Jacobson, A.; Milman, A.D.; Kammen, D.M. Letting the (energy) Gini out of the bottle: Lorenz curves of cumulative electricity consumption and Gini coefficients as metrics of energy distribution and equity. Energy Policy 2005, 33, 1825–1832. [Google Scholar] [CrossRef]
- Champernowne, D. A Comparison of Measure of Inequality of Income Distribution. Econ. J. 1974, 84, 787–816. [Google Scholar] [CrossRef]
- Gastwirth, J.L.; Glauberman, M. The Interpolation of the Lorenz Curve and Gini Index from Grouped Data. Econometrica 1976, 44, 479–483. [Google Scholar] [CrossRef]
- Pyatt, G. On the Interpretation and Disaggregation of Gini Coefficients. Econ. J. 1976, 86, 243–255. [Google Scholar] [CrossRef]
- GINI Index (World Bank Estimate); World Bank: Washington, DC, USA, 2018; Available online: https://data.worldbank.org/indicator/si.pov.gini (accessed on 15 January 2018).
- Saboohi, Y. An evaluation of the impact of reducing energy subsidies on living expenses of households. Energy Policy 2001, 29, 245–252. [Google Scholar] [CrossRef]
- Graziano, M.; Gillingham, K. Spatial Patterns of solar photovoltaic system adoption: The influence of neighbors and the built environment. J. Econ. Geogr. 2015, 15, 815–839. [Google Scholar] [CrossRef]
- Rai, V.; Reeves, C.; Margolis, R. Overcoming barriers and uncertainties in the adoption of residential solar PV. Renew. Energy 2016, 89, 498–505. [Google Scholar] [CrossRef]
- Tidwell, J.H.; Tidwell, A.S.D. Energy ideals, visions, narratives, and rhetoric: Examining sociotechnical imaginaries theory and methodology in energy research. Energy Res. Soc. Sci. 2018, 39, 103–107. [Google Scholar] [CrossRef]
- Irvine, L.; Sawyer, A.; Grove, J.; Northwest Sustainable Energy for Economic Development. The Solarize Guidebook: A Community Guide to Collective Purchasing of Residential PV Systems; Technical Report; United States National Renewable Energy Laboratory: Golden, CO, USA, 2012.
- Aylett, A. Networked Urban Climate Governance: Neighborhood-Scale Residential Solar Energy Systems and the Example of Solarize Portland. Environ. Plan. C Politics Space 2013, 31, 858–875. [Google Scholar] [CrossRef]
- Noll, D.; Dawes, C.; Rai, V. Solar Community Organizations and active peer effects in the adoption of residential PV. Energy Policy 2014, 67, 330–343. [Google Scholar] [CrossRef]
- Mulvaney, D. Opening the Black Box of Solar Energy Technologies: Exploring Tensions Between Innovation and Environmental Justice. Sci. Cult. 2013, 22, 230–237. [Google Scholar] [CrossRef]
- Ottinger, G. The Winds of Change: Environmental Justice in Energy Transitions. Sci. Cult. 2013, 22, 222–229. [Google Scholar] [CrossRef]
- Karakaya, E.; Sriwannawit, P. Barriers to the adoption of photovoltaic systems: The state of the art. Renew. Sustain. Energy Rev. 2015, 48, 60–66. [Google Scholar] [CrossRef]
- Strengers, Y.; Pink, S.; Nicholls, L. Smart energy futures and social practice imaginaries: Forecasting scenarios for pet care in Australian homes. Energy Res. Soc. Sci. 2019, 48, 108–115. [Google Scholar] [CrossRef]
- Sovacool, B.K.; Axsen, J.; Sorrell, S. Promoting novelty, rigor, and style in energy social science: Towards codes of practice for appropriate methods and research design. Energy Res. Soc. Sci. 2018, 45, 12–42. [Google Scholar] [CrossRef]
© 2018 by the authors. Licensee MDPI, Basel, Switzerland. This article is an open access article distributed under the terms and conditions of the Creative Commons Attribution (CC BY) license (http://creativecommons.org/licenses/by/4.0/).