Abstract
Stipa breviflora, a dominant species of Chinese temperate grassland, is vulnerable to climate change. A quantitative description of the changes in the geographic distribution of S. breviflora under climate change can provide a reference for potential changes in Chinese temperate grassland and the necessary countermeasures to cope with climate change. In this study, the relationship between the geographic distribution of S. breviflora and the climate, and its inter-decadal change in geographic distribution and climatic suitability from 1961 to 2040 were investigated. The results showed that S. breviflora’s geographic distribution could be simulated very well by the MaxEnt model, and its climatic suitability could be divided into four levels—most suitable, medium suitable, less suitable, and unsuitable areas—based on its existence probability from the MaxEnt model. In the past 50 years, the total climate-suitable area for S. breviflora’s potential geographical distribution exhibited an obvious increase and a trend of northward expansion, which was larger than the current distribution area. The total climate-suitable area would increase by about 6.7% and decrease by 11.5% from 2011–2040 under RCP4.5 and RCP8.5 climate scenarios, respectively; however, the most suitable area increased and moved to western areas of Tibet, Qinghai, and Ningxia. The results revealed that the distribution area of S. breviflora still has greater potential for expansion.
1. Introduction
Climate is the main factor that determines the type of vegetation and the distribution of species. The distribution of vegetation and species within a certain geographical area is also a reflection and sign of a specific climate, which is also a manifestation of the biodiversity in this region. However, global climate change caused by modern human activities is taking place. According to the fifth report of the Intergovernmental Panel on Climate Change (IPCC), the average global sea—land surface temperature shows a linear increase from 1880 to 2012, with an average temperature increase of 0.85 °C. The heterogeneity of global precipitation increased, causing a series of ecological problems [1]. Severe climate change will have a serious impact on vegetation—climate relationships, significantly affecting the large-scale pattern of plant distribution [2,3,4,5,6]. Especially for regional plants in certain ecological transition zones, the environmental conditions are special, and the impact of climate change will be more intuitive and serious. Therefore, it is of great significance to understand the changes in the geographical distribution of dominant plants and to develop scientific countermeasures to deal with climate change.
Analyzing the impact of climate change on the distribution of plant species is mainly based on the model simulation method. The model simulation methods used are mainly the biophysical correlation model, climate element index method, generalized linear model (GLM), generalized additive model (GAM), logistic regression model, etc. Different models have different advantages and disadvantages. Compared with similar models, the maximum entropy (MaxEnt) model has a strong advantage in predicting species distribution [7]. MaxEnt is a general-purpose machine learning method for making predictions or inferences from incomplete information [8]. The intent of MaxEnt is to estimate a target probability distribution by finding the probability distribution of maximum entropy (which is most spread out, or nearly uniform), subject to a set of constraints that represent incomplete information about the target distribution [7,9]. MaxEnt has good performance in modeling species geographic distribution with presence-only data [9,10,11,12]. However, different climatic factors were selected to simulate the relationship between species and climate, and the distribution of species was then predicted in previous studies. For example, the annual temperature, the highest temperature of the warmest month, the lowest temperature of the coldest month, the average temperature of the most humid and dry season, the precipitation of the wettest and the driest season, the accumulated temperature greater than 5 °C, etc. were chosen by different studies to simulate and assess the impact of climate change on plant distribution [13,14,15,16]. The selection of climatic factors was subjective, and there were no objective selection criteria and methods in these studies. In particular, the climatic factors were not uniform, which led to increased uncertainty and comparability in the results [17]. Therefore, there is a need to establish a method for quantitatively determining climatic factors that affect plant distribution.
Grassland is widely distributed in China, forming the largest land area of China’s ecosystem, most of which is in arid and semi-arid regions and is sensitive to and profoundly affected by climate change [18,19,20]. Results showed that the potential geographical distribution of vegetation in Inner Mongolia in the areas of desert, semi-desert grassland, mountain grassland, and typical grassland increased and expanded eastward, and the area of meadow grassland decreased and extended to high latitudes and high altitudes over the past 50 years [4]. Also, future climate change may lead to a slight decrease in the vegetation of desert and desert steppe in western China, with an increase in shrub [21]. Stipa plants, the most dominant species in the grasslands of Eurasia, are widespread across China [22]. S. breviflora is one of the most dominant species in the desert steppe of China, with a very wide distribution in the Qinghai–Tibet Plateau, Loess Plateau, and Xinjiang region. In the context of climate change, the change in the geographical distribution of S. breviflora is a response to climate change, reflecting, to a certain extent, the impact of climate change on the biodiversity of this grassland. Therefore, studying the suitability of the geographical distribution of S. breviflora to climate change would help comprehensively understand the impact of climate change on species distribution and the protection of the desert steppe ecosystem in a macroscopic view, and provide a basis for formulating scientific grassland management policies.
Around the changes in geographical distribution of vegetation in China under the background of climate change and the need for policy formulation on climate change, the objectives of this study were (1) to quantitatively reveal the main climatic factors that determine the geographical distribution of S. breviflora based on the MaxEnt model; (2) to construct the relationship between the potential geographical distribution and climate factors and investigate the potential geographical distribution of S. breviflora and its climatic suitability in China; and (3) to evaluate the inter-decadal change in the potential geographic distribution of S. breviflora in China from 1961 to 2040.
2. Materials and Methods
2.1. Data on Meteorology and Geographic Information
Data on the geographic information of S. breviflora in continental China were collected using three main methods: (1) collection from the records of seven main herbariums in China (http://www.cvh.org.cn); (2) extraction from flora across China, including those from Henan, Hebei, Qinghai, Sichuan, Xinjiang, Tibet, and Inner Mongolia; (3) publications on S. breviflora in the China National Knowledge Infrastructure (CNKI), Chinese Field Herbarium (CFH), and Web of Science. In total, 125 points for S. breviflora were obtained from all the data sources (Figure 1).
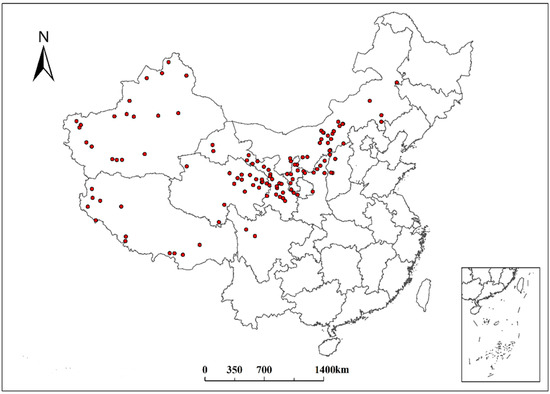
Figure 1.
Geographic distribution points of Stipa breviflora.
Meteorological data were obtained from the daily dataset in 1961–2010 obtained at basic and benchmark meteorological observation stations by the National Meteorological Information Center, including the elements of station longitude, latitude, daily mean, maximum, and minimum air temperature, precipitation, wind, humidity, etc. These data were interpolated onto the surface grid data at a 10-km resolution [23], and the surface data of solar radiation were obtained following the methods of Thornton et al. [24]. Based on the consideration of the climate standard year, the 10 km × 10 km grid data of 1961–1990, 1966–1955, 1971–2000, 1976–2005, and 1981–2010 were established. The simulation of future climate scenarios used climate data for 2011–2040 (RCP4.5 and RCP8.5).
2.2. Maximum Entropy Model
The maximum entropy (MaxEnt) model is a general-purpose machine learning method for making predictions or inferences from incomplete information [8]. Predictions by the MaxEnt model can be assessed using a receiver operating curve (ROC). An ROC plot is obtained by plotting all sensitivity values (true positive fraction) on the y-axis against their equivalent (1-specificity) values (false positive fraction) for all available thresholds on the x-axis. The area under the ROC function (AUC) is usually taken to be an important index because it provides a single measure of overall accuracy that is not dependent upon a particular threshold [25].
There are two methods to assess the contributions of climate indices to simulated models [26]: percentage contribution and the jackknife test. While the MaxEnt model is trained, it keeps track of which climate indices are contributing to fitting the model. Each step of the MaxEnt algorithm increases the gain of the model by modifying the coefficient for a single feature; the program assigns the increase in the gain to the environmental variable that the feature depends on. The percentage contribution is the value of each climatic factor contribution to the model during the model training process, converted to percentages at the end of the training process. The jackknife test is illustrated by a bar graph of green, blue, and red bars. The length of the red bar at the bottom represents the total score for simulating the distribution of S. breviflora using all the selected potential climatic indices. The length of the blue bar represents the score using only one of the climatic indices; the longer the bar is, the more important the climatic factor. The length of the green bar represents the score of a model created with the remaining indices. The greater the difference in length between green and red bars is, the less likely that the factor affecting winter wheat distribution can be replaced by other indices. The factor can only be replaced by other indices if the red and green bars show similar lengths.
2.3. Selection of Climatic Factors Affecting Species Distribution
There are two well-known balance equations on the earth’s surface: the water balance equation and heat balance equation. The heat balance equation is formulated as
where Rn is the intercepted net radiation by the surface of vegetation, E is the evapotranspiration, including evaporation, transpiration, and condensation of the surface of vegetation, L is the latent heat, and H is the sensible heat. When Rn is positive, heat is obtained by the surface of the earth. When other variables are positive, heat is lost from the surface of the earth.
The water balance equation on the earth’s surface has the following formula:
where P is the actual water entering a region, including precipitation and water from neighboring regions, and R is the runoff including the surface and underground.
The intercepted net radiation is formulated as
where Q is the solar radiation, is the land surface reflectance, T7 and T1 are the mean temperature of the warmest month and the coldest month, respectively, and is the Boltzmann constant.
By performing Equations (1) to (3), the following formula can be obtained:
where the right side of equation reflects the effect of vegetation on the energy distribution, Q × shows the solar radiation reflected by vegetation, L × R shows the energy taken away by runoff, and H is the energy heating the atmosphere. The variables on the left side of the equation are all closely related to vegetation; that is to say, the vegetation characteristics of an area are decided by the following variables: solar radiation (Q), precipitation (P), temperature of the warmest month (T7), temperature of the coldest month (T1), and annual mean temperature (T), closely related to latent heat.
Based on the mechanism of species distribution, climatic factors which decide the geographic distribution of plants mainly follow three types: (1) the lowest temperature that a plant is able to endure, (2) the length of the growing season and the heat supply to complete its life cycle, and (3) the water supply to form and maintain the plant’s canopy [27]. Combining Equation (4), climatic factors which decide a plant’s geographic distribution are the lowest temperature that a plant could endure—that is, the extreme temperature Tmin—the heat supply to complete its life cycle (Q), the length of the growing season, which is decided by the extent and intensity of annual temperature, including T7, T1, and T, and the water supply to form and maintain the plant’s canopy, which is mainly decided by precipitation P for vegetation. Thus, there are six climatic factors which decide a plant’s geographic distribution: Tmin, Q, T7, T1, T, and P.
3. Results
3.1. Applicability of Model and Climate Factors
The model of the geographic distribution of S. breviflora was trained by a training subset (randomly selecting 75% of the sample records for training) to check the applicability of MaxEnt. Then, the remaining 25% of the data (the geographic data and meteorological data) were used for model testing. The AUC value derived from the model of the geographic distributions of S. breviflora and climatic factors was 0.92, reaching an excellent level of model accuracy (Figure 2). Thus, MaxEnt was able to study the relationships between the geographic distributions of S. breviflora and the climate.
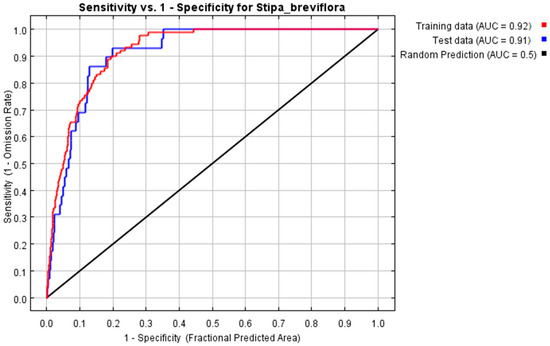
Figure 2.
Receiver operating curve (ROC) for the MaxEnt model simulation of the geographical distribution of S. breviflora.
Based on climatic factors in Table 1 that affect the geographical distribution of S. breviflora, the contribution of climate factors was ranked as follows: annual precipitation (P) > temperature of the coldest month (T1) > temperature of the warmest month (T7) > extreme temperature (Tmin) > annual solar radiation (Q) > annual mean temperature (T) (Table 1). According to the jackknife test, the six climate factors also had a varying degree of contribution to the geographical distribution of S. breviflora (Figure 3), and none of the six factors could be removed.

Table 1.
Percentage of contribution of climatic factors that affect the geographical distribution of Stipa breviflora in China.
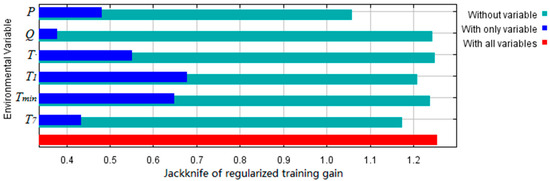
Figure 3.
Climatic factor contribution to the climatic impact on the geographical distribution of S. breviflora in China. Tmin, extreme low temperature; P, annual precipitation; Q, annual amount of solar radiation; T, annual temperature; T1, temperature of coldest month; T7, temperature of warmest month.
3.2. Climate Suitability of S. breviflora Geographical Distribution
According to the known geographic distribution points provided by publications on S. breviflora, the climate variable layer consisted of the six dominant climatic factors over the 30 years from 1961 to 1990 (climate reference period). The simulated model was developed in terms of the MaxEnt model and the present data, including the geographic distribution data of S. breviflora and the climate data during 1961–1990. Thus, the presence probability p to divide the climate suitability of S. breviflora’s potential geographical distribution could be obtained. Based on the climate resource guarantee rate, the climate suitability of the potential geographical distribution for S. breviflora can be divided into four categories: unsuitable (a presence probability smaller than 5% (p < 0.05)), i.e., low-probability events, less suitable (a climate guarantee rate of 76% (0.05 ≤ p < 0.766 = 0.19)), medium suitable (a climate guarantee rate of 85% (0.19 ≤ p < 0.856 = 0.38)), and the most suitable (or optimal; p ≥ 0.38). Figure 4 shows the grades of climate suitability for S. breviflora’s potential geographical distribution from 1961 to 1990 (climate reference period).
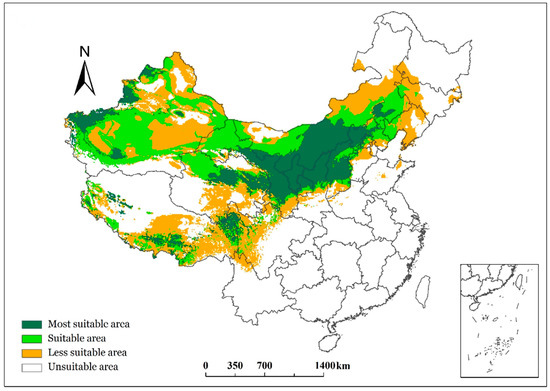
Figure 4.
Grades of climatic suitability of the geographical distribution of S. breviflora in China.
According to the response curve of the presence probability p to climatic factors, the threshold of climatic factors in different climate-suitable regions of S. breviflora can be obtained (Figure 5, Table 2). The most climate-suitable regions of S. breviflora are mainly distributed in the central parts of the Inner Mongolia and Chifeng regions, northern Shaanxi, Ningxia, Gansu, southeastern Qinghai, western Xinjiang, southern Tibet Plateau, and western Sichuan. The thresholds of climatic factors influencing the most suitable distribution of S. breviflora in China were as follows: 105 ≤ P ≤ 704 mm, 107,615 ≤ Q ≤ 174,375 W/m2, −41.1 ≤ Tmin ≤ −19.0 °C, −16.5 ≤ T1 ≤ 1.1 °C, 10.1 ≤ T7 ≤ 30.7 °C, and −1.5 ≤ T ≤ 13.1 °C (Table 2).
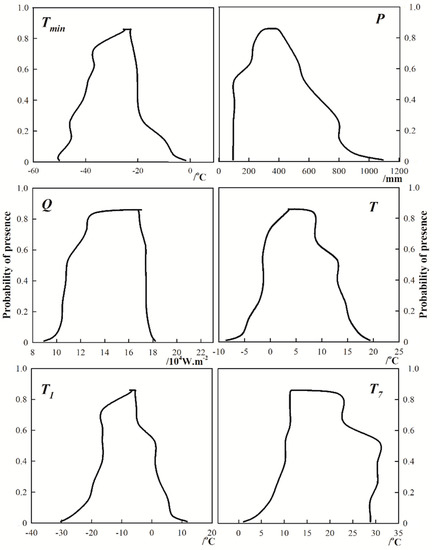
Figure 5.
Response curve of the presence probability p to climatic factors.
Table 2.
The threshold of climatic factors in different climate-suitable areas of S. breviflora’s geographical distribution.
3.3. Inter-Decadal Dynamics of the Potential Geographical Distribution of S. breviflora
The training model was based on the MaxEnt model and the present data, including the geographic distribution data of S. breviflora and the climate data during 1961–1990; subsequently, the inter-decadal potential distributions of S. breviflora from 1961 to 2010 (i.e., 1961–1990, 1966–1995, 1971–2000, 1976–2005, and 1981–2010) and 2011–2040 (RCP4.5 and RCP8.5) were developed (Figure 6). Over the past 50 years, the total climate-suitable scope for the S. breviflora geographical distribution exhibited an obvious increase, of which the scope in Xinjiang and Tibet in southwest China increased obviously and exhibited a trend of northward expansion. In the future, in the period of 2011–2040 under the RCP4.5 climatic scenario, the total climatic-suitable distribution area of S. breviflora increased significantly, and the most climate-suitable area moved to the Qinghai–Tibet Plateau (Figure 6f). Under the RCP8.5 climate scenario, the most climatic-suitable area was mainly in the western part of Tibet, Qinghai, and Ningxia (Figure 6g).
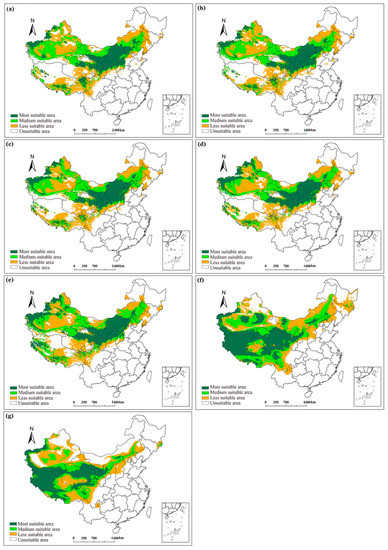
Figure 6.
Inter-decadal change for the potential geographical distribution of S. breviflora in China: (a) 1961–1990; (b) 1966–1995; (c) 1971–2000; (d) 1976–2005; (e) 1981–2010; (f) 2011–2040 in RCP4.5; (g) 2011–2040 in RCP8.5.
The total climate-suitable area for S. breviflora’s geographical distribution showed a linear increase in 1961–2010 (R2 = 0.67, Table 3). Compared to climate standard years (1961–1990), the total climate-suitable area for each assessment period increased by 0.3% (1966–1995), 0.7% (1971–2000), 1.0% (1976–2005), 8.0% (1981–2010), 22.6% (2011–2040, RCP4.5), and −2.6% (2011–2040, RCP8.5). Compared to climate standard periods (1961–1990), the most climate-suitable area exhibited an increasing trend during 1971–2010. While the medium climate-suitable area was the smallest in 2011–2040 under RCP8.5 climatic scenario, the less climate-suitable area fluctuated from 1961–2010 and decreased in 2011–2040 compared to 1961–1990 (Table 3).
Table 3.
Climate-suitable area for the potential geographical distribution of S. breviflora in China (unit: 107 hm2).
4. Discussion
Upon changes in temperature, precipitation, and CO2 concentration, the species composition of the grassland also changes, and the changes in certain climatic resources change the dynamics and balance of different grassland species, thereby affecting their productivity [1,28]. Although climate change impacted grasslands in China from different perspectives [4,29,30], information about the potential geographical distribution of dominant species in grasslands and their climatic suitability in China in response to climate change is still lacking [31]. Therefore, quantitatively analyzing the potential geographical distribution and inter-decadal variation of S. breviflora, the dominant species in desert grassland in China, will help understand the impact of climate change on the structure and function of the desert grassland ecosystem in China.
The climate–vegetation relationship reflects the mutual effects of vegetation and climate. Previous studies determined different climatic factors to simulate the relationship between plant distribution and climate [13,14,16]. The selection of climatic factors was subjective, and there were no objective selection criteria and methods in these studies. The selection of climatic factors affecting plant geographical distribution was mostly determined by study experience, which increased uncertainty and incomparability in the results [17]. In this study, the annual amount of solar radiation, annual precipitation, extreme low temperature, temperature of the coldest month, temperature of the warmest month, and annual temperature were selected to determine the geographical distribution of S. breviflora based on the control mechanism of the geographic distribution of vegetation [27], as well as the energy balance equation and water balance equation of the earth’s surface. These six climatic factors comprehensively reflect the three major elements affecting plant growth: temperature, moisture, and light [32]. At the same time, the accuracy of the maximum entropy model for the geographical distribution of S. breviflora and climatic factors based on the six climatic factors reached an “accurate” level (Figure 2), which showed that the selected climatic factors could reflect the climatic conditions of the geographical distribution of S. breviflora. Additionally, each climatic factor has a certain contribution rate to the geographical distribution of S. breviflora, among which the temperature of the coldest month contributed the most, and the annual precipitation had the largest displacement importance (Table 1, Figure 3). This revealed that the selected six climatic factors affected the geographic distribution of S. breviflora to varying degrees and were indispensable. When these climatic factors act in combination and within a certain threshold range, the area could be suitable for S. breviflora [32]. Then, S. breviflora can regulate its own physiological ecology according to its sensitivity to environmental changes to adapt to a certain degree of hydrothermal changes [33,34], making it more adaptable.
Currently, both biogeochemical models and biogeographic models need accurate climate-driven information, i.e., accurate climate resource information, to accurately simulate the functional and structural characteristics of vegetation. Therefore, climate resources directly determine the function, structure, and diversity of vegetation. The cumulative error caused by the gradual determination of the geographical distribution of vegetation based on the thresholds of multiple climate-limiting factors may gradually lead to large differences between the final geographical distribution and actual distribution in previous studies [35]. The maximum entropy model can predict potential distribution based on incomplete species presence information, which represents regions with similar environmental conditions to actual distribution regions [7]. In terms of the distribution scope, the potential distribution of S. breviflora was generally consistent with the actual distribution area in this study (Figure 4), which was continuously distributed in Inner Mongolia, northern Shaanxi, Ningxia, Gansu, Qinghai, Xinjiang, and the southeast of the Qinghai–Tibet Plateau. The MaxEnt model, based on the combined effects of climatic factors at each grid point, gave the relative probability of the existence of S. breviflora in the predicted area [8], i.e., comprehensive climate resource indicators. Using the probability of existence, the climate-suitable area of S. breviflora was divided into four grades, namely most suitable areas, medium suitable areas, less suitable areas, and unsuitable areas (Figure 4), which accounted for 11.9%, 14.7%, 19.2%, and 54.2% of the national area, respectively, in the reference period (1961–1990). The total potential suitable distribution area accounted for about 45.8% of the national total area (Table 3), which was larger than its actual distribution range, indicating that S. breviflora had greater potential for development in China. However, this study only considered whether S. breviflora could exist under the climatic conditions in the region, and neglected factors such as topography and human disturbance. Further analysis showed that the total climate-suitable area of S. breviflora’s potential distribution gradually increased from 1961 to 2010, and the areas of Xinjiang and southwestern Tibet were significantly increased (Figure 6). This is related to the difference in precipitation patterns in China in the past 50 years: precipitation decreased in Inner Mongolia, northeast China, and north China and increased in the western and Tibetan Plateau regions [36,37], while temperature simultaneously increased. When the distribution of climate resources adapting to S. breviflora changes, the geographical distribution also undergoes corresponding changes [19]. The total climate-suitable area of S. breviflora’s potential geographical distribution gradually increased in 1960–2010 and 2011–2040 under RCP4.5 climate scenarios (Table 3), and the most suitable area moved to the Qinghai–Tibet Plateau under RCP4.5. The increases in average annual temperature of China were 2.9 °C and 5.5 °C under the RCP4.5 and RCP8.5 scenarios, respectively, and the increases in average annual precipitation under RCP4.5 and RCP8.5 were 0.214 mm/day and 0.323 mm/day in the 21st century. The increase in temperature of the coldest month was greater than the average annual temperature, and the increased temperature and precipitation in the 21st century were mainly contributed by the Tibetan Plateau and the northeast of China, especially under the RCP8.5 scenario [38,39]. RCP4.5 is a medium emission scenario, while RCP8.5 is the highest emission scenario, whereby no corresponding policies were adopted to deal with climate change. The temperature increases strongly under RCP8.5 and may exceed the suitable temperature for plant growth [1]. Thus, the results showed that the climate-suitable area decreased in 2011–2040 under the RCP8.5 climate scenario compared to the reference period. This indicated that more regional climatic resources will be suitable for the distribution of S. breviflora, which would have greater potential for expansion in China in the future under a medium-emission scenario, contrary to high-emission scenarios.
5. Conclusions
In terms of the geographical distribution data of S. breviflora and climate data in China, six climatic factors—the annual amount of solar radiation (Q), annual precipitation (P), extreme low temperature (Tmin), temperature of the coldest month (T1), temperature of the warmest month (T7), and annual temperature (T)—influencing S. breviflora distribution were selected based on the energy balance equation and water balance equation of the earth’s surface. Together with the maximum entropy model (MaxEnt) and ArcGIS spatial analysis technique, the relationship between the potential geographical distribution of S. breviflora and climate factors was established, and the potential geographical distribution of S. breviflora and its climatic suitability in China were revealed. The percentage contributions of six climate factors influencing the geographical distribution of S. breviflora were ranked as P > T1 > T7 > Tmin > Q > T. The total climate-suitable area of S. breviflora’s potential geographical distribution accounted for 45.8–49.5% of the land area in China in 1961–2010, increasing by about 6.69% and decreasing by about 11.5% in 2011–2040 under the RCP4.5 and RCP8.5 climate scenarios, respectively. This revealed that the potential distribution area of S. breviflora was larger than the current distribution area, and it still has greater potential for expansion to some extent, reducing degradation of temperate grassland in China.
Author Contributions
Conceptualization, X.L. and G.Z. Methodology, G.Z. and X.L. Software, X.L. Formal analysis, X.L. Writing—original draft preparation, X.L. Writing—review and editing, G.Z. Supervision, G.Z. Project administration, G.Z. Funding acquisition, G.Z.
Funding
This research was funded by the National Natural Science Foundation of China grant number 31661143028, 41571175, and the China Postdoctoral Science Foundation Funded Project grant number 2017M620984.
Conflicts of Interest
The authors declare no conflicts of interest.
References
- IPCC. Summary for policymakers. In Climate Change 2014: Impacts, Adaptation, and Vulnerability. Part A: Global and Sectoral Aspects; Contribution of Working Group II to the Fifth Assessment Report of the Intergovernmental Panel on Climate Change; Cambridge University Press: New York, NY, USA, 2014. [Google Scholar]
- Malhi, Y.; Roberts, J.T.; Betts, R.A.; Killeen, T.J.; Li, W.H.; Nobre, C.A. Climate change, deforestation, and the fate of the Amazon. Science 2008, 319, 169–172. [Google Scholar] [CrossRef] [PubMed]
- Van Groenigen, K.J.; Osenberg, C.W.; Hungate, B.A. Increased soil emissions of potent greenhouse gases under increased atmospheric CO2. Nature 2011, 475, 214–216. [Google Scholar] [CrossRef] [PubMed]
- Wang, D.W.; Zhao, J.; Yin, D.; Han, T.; Li, L.L. Potential vegetation dynamic analysis of spatial and temporal characteristics of Inner Mongolia’s geographical pattern in recent 50a. Pratac. Sci. 2013, 30, 1167–1174. (In Chinese) [Google Scholar]
- Xie, L.N.; Ma, C.C.; Guo, H.Y.; Li, Q.F.; Gao, Y.B. Distribution pattern of Caragana species under the influence of climate gradient in the Inner Mongolia region, China. J. Arid Land 2014, 6, 311–323. [Google Scholar] [CrossRef]
- Yang, B.; He, M.; Shishov, V.; Tychkov, I.; Vaganov, E.; Rossi, S.; Ljungqvist, F.C.; Bräuning, A.; Grießinger, J. New perspective on spring vegetation phenology and global climate change based on Tibetan Plateau tree-ring data. Proc. Natl. Acad. Sci. USA 2017, 114, 6966–6971. [Google Scholar] [CrossRef] [PubMed]
- Peterson, A.T.; Papeş, M.; Eaton, M. Transferability and model evaluation in ecological niche modeling: A comparison of GARP and Maxent. Ecography 2007, 30, 550–560. [Google Scholar] [CrossRef]
- Phillips, S.J.; Anderson, R.P.; Schapire, R.E. Maximum entropy modeling of species geographic distributions. Ecol. Model. 2006, 190, 231–259. [Google Scholar] [CrossRef]
- Wu, W.; Li, Y.; Hu, Y.; Xiu, C.; Yan, X. Impacts of Changing Forest Management Areas on Forest Landscapes and Habitat Patterns in Northeastern China. Sustainability 2018, 10, 1211. [Google Scholar] [CrossRef]
- Hernandez, P.A.; Franke, I.; Herzog, S.K.; Pacheco, V.; Paniagua, L.; Quintana, H.L.; Soto, A.; Swenson, J.J.; Tovar, C.; Valqui, T.H.; et al. Predicting species distributions in poorly-studied landscapes. Biodivers. Conserv. 2008, 17, 1353–1366. [Google Scholar] [CrossRef]
- Ashraf, U.; Ali, H.; Chaudry, M.N.; Ashraf, I.; Batool, A.; Saqib, Z. Predicting the Potential Distribution of Olea ferruginea in Pakistan incorporating Climate Change by Using Maxent Model. Sustainability 2016, 8, 722. [Google Scholar] [CrossRef]
- Zhang, Y.; Wang, Y.; Niu, H. Spatio-temporal variations in the areas suitable for the cultivation of rice and maize in china under future climate scenarios. Sci. Total Environ. 2017, 601–602, 518–531. [Google Scholar] [CrossRef] [PubMed]
- Luoto, M.; Pöyry, J.; Heikkinen, R.K.; Saarinen, K. Uncertainty of bioclimatic envelope models based on the geographical distribution of species. Glob. Ecol. Biogeogr. 2005, 14, 575–584. [Google Scholar] [CrossRef]
- Garcia, K.; Lasco, R.; Ines, A.; Lyon, B.; Pulhin, F. Predicting geographic distribution and habitat suitability due to climate change of selected threatened forest tree species in the philippines. Appl. Geogr. 2013, 44, 12–22. [Google Scholar] [CrossRef]
- Schroth, G.; Läderach, P.; Martinezvalle, A.I.; Bunn, C.; Jassogne, L. Vulnerability to climate change of cocoa in West Africa: Patterns, opportunities and limits to adaptation. Sci. Total Environ. 2016, 621, 1633–1641. [Google Scholar] [CrossRef] [PubMed]
- Dullinger, I.; Wessely, J.; Bossdorf, O.; Dawson, W.; Essl, F.; Gattringer, A.; Klonner, G.; Kreft, H.; Kuttner, M.; Moser, D.; et al. Climate change will increase the naturalization risk from garden plants in Europe. Glob. Ecol. Biogeogr. 2017, 26, 43–53. [Google Scholar] [CrossRef] [PubMed]
- Matsui, T.; Tsutomu, Y.; Tomoki, N.; Nakaya, T.; Taoda, H.; Yoshinaga, S.; Daimaru, H.; Tanaka, N. Probability distributions, vulnerability and sensitivity in Fagus crenata forests following predicted climate changes in Japan. J. Veg. Sci. 2004, 15, 605–614. [Google Scholar] [CrossRef]
- Bai, Y.F.; Han, X.; Wu, J.G.; Chen, Z.Z.; Li, L.H. Ecosystem stability and compensatory effects in the Inner Mongolia grassland. Nature 2004, 431, 181–184. [Google Scholar] [CrossRef] [PubMed]
- Zhang, G.G.; Kang, Y.M.; Han, G.D.; Sakurai, K. Effect of climate change over the past half century on the distribution, extent and NPP of ecosystems of Inner Mongolia. Glob. Chang. Biol. 2011, 17, 377–389. [Google Scholar] [CrossRef]
- Sui, X.; Zhou, G.; Zhuang, Q. Sensitivity of carbon budget to historical climate variability and atmospheric CO2 concentration in temperate grassland ecosystems in China. Clim. Chang. 2013, 117, 259–272. [Google Scholar] [CrossRef]
- Zhao, M.S.; Ronald, P.N.; Yan, X.D.; Dong, W.J. Modelling the vegetation of China under changing climate. Acta Geogr. Sin. 2002, 57, 28–38. [Google Scholar]
- Coupland, R.T. Natural Grasslands, Eastern Hemisphere and Resums; Elsevier: Amsterdam, The Netherlands, 1993. [Google Scholar]
- Thornton, P.E.; Running, S.W.; White, M.A. Generating surfaces of daily meteorological variables over large regions of complex terrain. J. Hydrol. 1997, 190, 214–251. [Google Scholar] [CrossRef]
- Thornton, P.E.; Running, S.W. An improved algorithm for estimating incident daily solar radiation from measurements of temperature, humidity, and precipitation. Agric. For. Meteorol. 1999, 93, 211–228. [Google Scholar] [CrossRef]
- He, Q.; Zhou, G. Climate-associated distribution of summer maize in China from 1961 to 2010. Agric. Ecosyst. Environ. 2016, 232, 326–335. [Google Scholar] [CrossRef]
- Phillips, S.J.; AT&T Research. A Brief Tutorial on Maxent. Available online: http://www.cs.princeton.edu/schapire/maxent/tutorial/tutorial.doc (accessed on 20 September 2011).
- Woodward, F.I. Climate and Plant Distribution; Cambridge University Press: New York, NY, USA, 1987. [Google Scholar]
- Craine, J.M.; Nippert, J.B.; Elmore, A.J.; Skibbe, A.M.; Hutchinson, S.L.; Brunsell, N.A. Timing of climate variability and grassland productivity. Proc. Natl. Acad. Sci. USA 2012, 109, 3401–3405. [Google Scholar] [CrossRef] [PubMed]
- Gao, Q.Z.; Li, Y.; Wan, Y.F.; Qin, X.B.; Jiangcun, W.Z.; Liu, Y.H. Dynamics of alpine grassland NPP and its response to climate change in Northern Tibet. Clim. Chang. 2009, 97, 515–528. [Google Scholar] [CrossRef]
- Piao, S.L.; Fang, J.Y.; Ciais, P.; Peylin, P.; Huang, Y.; Sitch, S.; Wang, T. The carbon balance of terrestrial ecosystems in China. Nature 2009, 458, 1009–1013. [Google Scholar] [CrossRef] [PubMed]
- Lloret, F.; Escudero, A.; Iriondo, J.M.; Martinez-Vilalta, J.; Valladares, F. Extreme climatic events and vegetation: The role of stabilizing processes. Glob. Chang. Biol. 2012, 18, 197–805. [Google Scholar] [CrossRef]
- Chapin, F.S.; Bloom, A.J.; Field, C.B.; Waring, R.H. Plant Responses to Multiple Environmental Factors. Bioscience 1987, 37, 49–57. [Google Scholar] [CrossRef]
- Lv, X.; Zhou, G.; Wang, Y.; Song, X. Sensitive indicators of zonal Stipa plants to changing temperature and precipitation in Inner Mongolia grassland. Front. Plant Sci. 2016, 7, 73. [Google Scholar] [CrossRef] [PubMed]
- Shi, Y.; Zhou, G.; Jiang, Y.; Wang, H.; Xu, Z. Does precipitation mediate the effects of elevated CO2, on plant growth in the grass species Stipa grandis. Environ. Exp. Bot. 2016, 131, 146–154. [Google Scholar] [CrossRef]
- Weng, E.; Zhou, G. Defining plant functional types in China for global change studies. Acta Phytoecol. Sin. 2005, 29, 81–97. [Google Scholar] [CrossRef]
- Liu, Y.X.; Li, X.; Zhang, Q.; Guo, Y.F.; Gao, G.; Wang, J.P. Simulation of regional temperature and precipitation in the past 50 years and the next 30 years over China. Quat. Int. 2010, 212, 57–63. [Google Scholar] [CrossRef]
- Ren, G.Y.; Ding, Y.H.; Zhao, Z.C.; Zheng, J.Y.; Wu, T.W.; Tang, G.L.; Xu, Y. Recent progress in studies of climate change in China. Adv. Atmos. Sci. 2012, 29, 958–977. (In Chinese) [Google Scholar] [CrossRef]
- Liang, Y.L.; Yan, X.D. Prediction of climate change over China and uncertainty analysis during the 21st century under RCPs. J. Trop. Meteorol. 2016, 32, 183–192. (In Chinese) [Google Scholar]
- Sui, Y.; Lang, X.; Jiang, D. Temperature and precipitation signals over China with a 2 °C global warming. Clim. Res. 2015, 64, 227–242. [Google Scholar] [CrossRef]
© 2018 by the authors. Licensee MDPI, Basel, Switzerland. This article is an open access article distributed under the terms and conditions of the Creative Commons Attribution (CC BY) license (http://creativecommons.org/licenses/by/4.0/).