Abstract
Plant breeding of Coffea canephora is based on the characterization and use of the natural genetic variability of the species. Thus, the objective of this study was to quantify the genetic diversity and gains from selection of the fruit and bean physical traits of the C. canephora plant, seeking to understand the relations among the yield components and identify genotypes with superior traits. For this purpose, 42 genotypes were evaluated over two crop years while considering a randomized block design in a factorial arrangement to quantify the effects of genotypes, crop years, and the interaction between these two factors. Coffee fruit samples in the cherry stage were used to evaluate the weights, volumes, and dimensions of the fresh fruit and beans after drying. Genotypic variance prevailed over environmental variance for all of the fruit and bean physical traits of the coffee plants, except for the greatest fruit width (FWG). These associations indicate that the constituent parts of the fruit increased in a manner proportional to an increase in weight. Such associations can facilitate or hinder plant selection. The total gains obtained through the selection indices were similar to those obtained through direct selection for greater bean weights. However, the use of selection indices made it possible to identify clones with more balanced traits.
1. Introduction
Of the 130 known coffee species [1], only 2 are commercially cultivated and represent approximately 99% of the world’s production, namely Coffea arabica L. (Arabica coffee), which accounts for 56%, and C. canephora Pierre ex A. Froehner (Robusta and Conilon coffees) for the remaining 44% [2]. Among coffee cultivated species, C. canephora stands out for its adaptation to tropical regions, significant genetic and phenotypic diversity, and high productive potential [2,3,4,5,6].
Cultivation of C. canephora in Brazil has grown in recent years and has expanded mainly to areas of lower altitudes and higher temperatures, which are not suitable for C. arabica [2,7,8]. In fact, C. canephora can be cultivated in tropical regions on different continents, maintaining its productive potential [9].
C. canephora is naturally an allogamous species due to its gametophytic self-incompatibility, which in turn results in high natural genetic variability in this species [10,11]. This variability in genetic nature is important for plant breeding programs, since it assists with obtaining gains from selection [12] and can be exploited for different purposes of cultivation [13,14].
Throughout the 1980s, 1990s, and early 2000s, C. canephora breeding programs in Brazil prioritized improving yields, minimizing the biennial bearing effect (alternating high and low yields), and enhancing resistance to pests and diseases. These efforts focused on selecting genotypes with uniform maturation cycles, ultimately resulting in the development of the first officially registered coffee cultivars [15,16,17]. After this period, studies addressing other important traits intensified in the following decades. Recently, beverage quality and the adaptation of genotypes in different environments [18,19,20], evaluation of individual performance, and the mean performance of groups of clones [5,21,22] have directed research toward development of new cultivars.
A new cultivar should have a series of favorable traits, providing benefits to the coffee grower compared with other existing cultivars. Not only the yield but also vigor and resistance to pests and diseases are important traits for the selection of C. canephora plants [23,24]. As breeding programs progress and specific cultivars are increasingly in demand, other traits, such as the physical quality of the beans, have also become important selection criteria.
Although the physical properties of the beans are an important yield component, these traits have been little explored in coffee plant selection [25]. If considered individually, the magnitude and direction of the genetic correlations make selection based on a single trait result in undesired changes in other yield components. These changes are called correlated responses, and their meaning should be considered in plant selection [26]. There are studies showing the association between hulled coffee yield and a larger bean size [27,28,29]. In contrast, an increase in fruit dimensions may result in a greater hull weight in relation to the bean weight.
An alternative for selection of plants which have a set of favorable traits is the use of selection indices [30]. Selection indices estimated from linear combinations of traits of interest allow interpretation of estimates of the total gain from selection in plant selection processes [26].
One of the first indices used for selection was developed by Smith [31], with the aim of maximizing the correlation between the index and the genotypic value of the individuals [32]. Furthermore, there are nonparametric selection indices which do not require estimates of the genetic parameters and can be applied to samples of both a random and fixed nature [33]. The index proposed by Mulamba and Mock [34] is based on the sum of the ranking of the genotypes in relation to each trait, and the genotype-ideotype distance index [35] considers the ideal values for each trait estimated from the original data, thus considering an ideal genotype. Therefore, the aim of this study was to quantify the genetic diversity and the gains from selection of the bean’s physical traits from C. canephora plants in order to understand the relations between the yield components and identify the genotypes with the best traits.
2. Materials and Methods
2.1. Plant Material and Experimental Conditions
The experiment was conducted on a farm in the municipality of Nova Venécia in the north Espírito Santo state of Brazil (18°39′43″ S, 40°25′52″ W), with a mean altitude of 200 m.a.s.l. and a mean annual temperature of 23 °C. The predominant climate in the region according to the Köppen classification is Aw, or tropical with a dry season [36]. The soil at the location is classified as a dystrophic red-yellow latosol, with a clayey texture and rolling topography [37]. The soil’s chemical and physical properties were determined in the 0–10, 10–20, 20–30, 30–40, 40–50, and 50–60 cm layers (Table 1).

Table 1.
Chemical and particle size analysis of the soil in the experimental area in Nova Venécia, ES, Brazil.
The crop was set up in 2014 using 42 genotypes of C. canephora. The plants were grown under full sun conditions at a spacing of three meters between rows and one meter between plants. Crop treatments were carried out according to the technical guidelines for the crop, which included weed control with herbicides and a brush cutter, preventive plant health management, liming, fertilization, and drip irrigation [38].
Considering the soil’s chemical and physical analysis, the coffee plants received 500, 100, and 400 kg ha−1 year−1 of N, P2O5, and K2O, respectively, applied according to the plant needs and phenological stages [39]. Soil micronutrients were corrected by the application of 2, 1, 2, and 10 kg ha−1 year−1 of Zn, B, Cu, and Mn, respectively. The experiment was conducted in a 42 × 2 factorial arrangement, formed by the combination of 42 genotypes (Table 2) and two crop years (2016–2017 and 2017–2018). The experiment followed a randomized block design with three replications, and each experimental plot consisted of seven plants.
Table 2.
Identification of the 42 genotypes of Coffea canephora in Nova Venécia, ES, Brazil.
2.2. Fruit Collection and Analysis
Three fruit samples were collected from each genotype in the cherry maturation stage, considering the maturation cycle of each genotype (early, late, and very late). Fruits were collected from all seven plants in each plot, creating a composite sample from these seven plants representing one plot. Then, the samples were sent to the Coffee Research Laboratory of the Universidade Federal do Espírito Santo’s São Mateus campus to perform biometric evaluations.
A precision balance (0.001 g) was used to assess the fresh fruit weight, measured in grams. The dried fruit volume (DFV) was determined through an adapted volume complementation methodology [41] using 50 mL graduated cylinders (with 1 mL markings).
A digital caliper rule with a resolution of 0.01 mm/0.0005 inch was used to measure the following traits: the fruit length (FL), greatest fruit width (FWG), and smallest fruit width (FWS), measured in millimeters. Afterward, the samples were placed in a forced air circulation oven at 40 °C and dried until reaching constant weights.
After drying, the fruit dry matter was found using a precision scale (0.001 g), and then the dry matter was adjusted to 12% moisture (DMF). Subsequently, they were manually peeled, separating the hulls from the beans to measure the following traits: the length of the hulled beans (LHB), greatest width (GW), and smallest width (SW) of the hulled beans, measured in millimeters. The hulled bean dry matter (DMB) and hull dry matter (DMH) were measured in grams, and the volume of the dried hulled beans (DBV) was measured in milliliters.
2.3. Genetic Parameters
The genetic parameters were considered to interpret the effects of genotypes and crop years, which were estimated using the following model:
where y is the data vector; m is the vector of the measurement-replication combinations (assumed to be fixed); g is the vector of the genotypic effects, assumed to be random (g~N(0,IV_g)); p is the vector of the permanent environment effects, assumed to be random (p~N(0,IV_perm)); and e is the vector of errors or residues (e~N(0,IV_e)), assumed to be random [42]. The uppercase letters X, Z, and W represent the incidence matrices for said effects.
The components of variance were estimated through the restricted maximum likelihood (REML), and the genotypic values were predicted through best linear unbiased prediction (BLUP) [43]. The following variance components and genetic parameters were estimated: the genotypic variance (Vg); permanent environmental variance (Vperm); temporary residual variance (V_e); individual phenotypic variance (Vf); mean phenotypic variance (Vfm); broad sense heritability of individual plots (h_g^2); mean broad sense heritability of genotypes (h_mg^2); and repeatability at the plot level (r).
Genetic progress was quantified by considering direct gains, the correlated response, and the use of selection indices. The estimates of the direct gain, which measures the genetic progress from selection in the trait itself, were obtained according to the following expression [42]:
where G_s is genetic progress; k is the standardized selection differential; r pp is the selection accuracy; and V_gp is the genotypic variance added to the permanent environmental effects.
The correlated response, which measures the change in traits related to selection of a main trait, was estimated by considering evaluations of the two harvest times according to the following expression:
where there is the correlated response of gain in a trait y in accordance with the selection of another trait x, the standardized selection differential, the genetic correlation between x and y, the individual repeatability of trait x, the individual repeatability of trait y, and the genotypic variance added to the permanent environmental effects. The genotypic values were used to quantify genetic progress using the index based on the sum of ranks [34] and the genotype-ideotype index [42].
The index based on the sum of ranks [34] corresponds to the sum of the classification of the genotypes ordered according to their genetic value for each one of the traits. Classification of the genotypes was obtained through ordering the genetic values of the traits evaluated in decreasing order. The estimated distances between the genotypes and reference values are considered in the genotype-ideotype index [42], defined by the maximum and minimum values observed according to the following expression:
where Gi is the genotype-ideotype distance, along with the score of the principal component technique of the ith genotype in the jth principal component and the score associated with the ideal reference in the jth principal component. The analyses were performed on the Selegen REML/BLUP software version December 2020 [43].
3. Results and Discussion
Genotypic variance prevailed in relation to permanent environmental variance for all of the coffee fruit and bean physical traits, except for the greatest fruit width (FWG) (Table 3). The predominance of genotypic variance indicates a greater contribution from the genetic component in expression of the fruit and bean physical traits. In fact, the grown C. canephora showed natural genetic variation among the clones for the bean weight [44], as was also observed by Teixeira et al. [21] upon studying different cultivars evaluated in the western Amazon. In an extensive characterization of approximately 600 accessions maintained in the Germplasm Bank, Ferrão et al. [13] observed the importance of the genetic component in expression of fruit and bean physical traits.
Table 3.
Estimates of the genetic parameters of fruit and bean traits evaluated in 42 genotypes of Coffea canephora over two crop years (2016–2017 and 2017–2018) in the municipality of Nova Venécia, ES, Brazil.
In the interpretation of measurements repeated over time, repeatability (r) is interpreted to quantify the ability of the clones to maintain their performance in different crop years [42,43]. In this context, estimates of higher values or values near 0.80 indicate that the response of the clones is maintained from one year to another [45]. Repeatability estimates ranged from 0.87 (FWS) to 0.94 (FL) for the fruit traits and from 0.73 (DBV) to 0.89 (LHB and GW) for the bean traits (Table 3). The only trait which exhibited an estimate classified as having a low magnitude was the FWG. Similar magnitude repeatability estimates were observed by Silva et al. [46] in evaluation of the yields of 130 clones in three environments over three years, indicating that the number of measurements considered was adequate.
Discarding traits which do not show natural genetic variation is one of the most important steps in the characterization of genetic parameters [47]. The estimates of broad sense heritability observed in this study can be considered to be of high and medium magnitudes [42], except for the FWG trait (Table 3). The lower estimates for the genotypic variance and heritability observed in this trait indicate that the variability observed was mainly due to the effect of the environment, and gains from the practice of selection were not expected, suggesting that this trait be discarded in the following evaluations.
With the aim of considering the estimates of gains from direct and indirect selection for the bean weight, the estimates of genotypic correlations were interpreted among the traits studied. Of a total of 28 estimates of genotypic correlation, 17 were significant (Figure 1). As the amplitude ranged from −0.69 to 0.97 between DMB × DMH and DMF × DMH, respectively, the estimates of correlation of a greater magnitude were represented separately from the estimates of a medium magnitude (Figure 1). In plant breeding, the estimates of correlation can be classified as low magnitude when they are from 0.0 to 0.33, medium magnitude from 0.34 to 0.67, and high magnitude from 0.67 to 1, both for positive values and negative values [43]. Positive estimates between the pairs indicate that an increase in one trait is conditioned by an increase in the other. In contrast, negative correlations indicate that an increase in one trait is related to reduction in the other one.
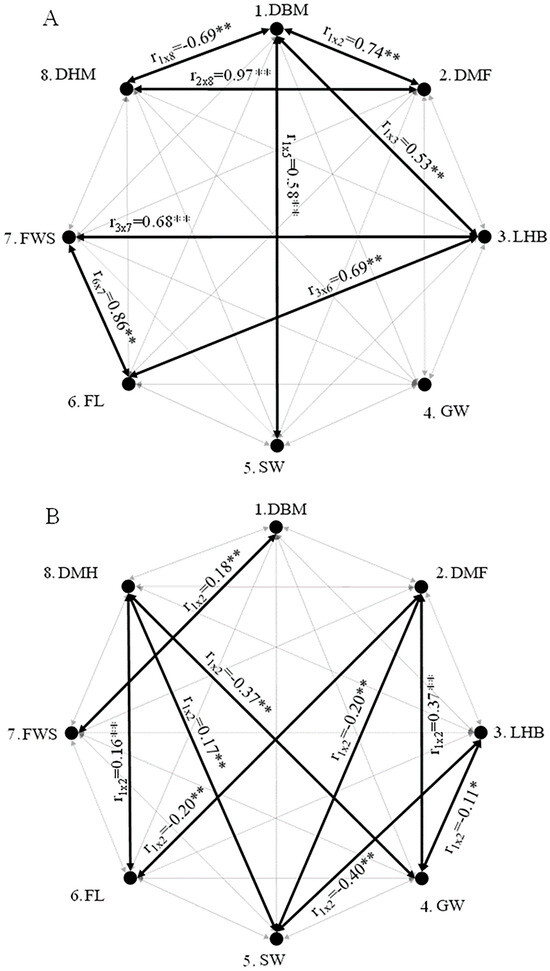
Figure 1.
Structure of partial correlations between fruit and bean traits, showing dry matter fruit at 12% (g) (DMF), hull dry matter per individual fruit at 12% moisture (DMH), fruit length (FL), smallest fruit width (FWS), length of hulled bean (LHB), hulled bean dry matter at 12% moisture 12% (DMB), greatest bean width (GW) (cm), smallest bean width (SW) (cm). (A) representation of significant correlation estimates of greater magnitudes (lower than −0.50 or greater than 0.50), and (B) representation of significant correlation estimates of lower magnitudes (−0.50 < × < 0.50). * and ** indicate statistical significance at the 5% and 1% probability levels, respectively.
Some of the associations observed had high positive correlation, such as DMF × DMH (0.97), FL × FWS (0.86), and DMB × DMF (0.74) (Figure 1). These associations indicate that the constituent parts of the fruit (i.e., hull weight, length, and width) increased in proportion to the increase in fruit weight. Positive associations between bean yield and bean size were also observed by Partelli et al. [44].
In this scenario of association between fruit and bean physical traits, the selection of one trait can result in changes in others. These associations can facilitate or hinder plant selection. Establishing that fruits of greater weights tend to produce beans of greater weights can favor plant selection. However, in this study, estimates of correlations of medium and high magnitudes were also observed, and such correlations can hinder the selection process (Figure 1). These types of correlation can complicate the selection process, as they indicate a strong relationship between these traits. Consequently, selecting for one desirable trait may inadvertently lead to the selection of another correlated trait which may not be equally desirable. The positive correlation between the hull weight and fruit weight (0.97) can favor the selection of plants with greater hull weights in relation to the total bean weight, in spite of the negative association between the bean weight and hull weight (−0.69).
In general, it was observed that in C. canephora coffee plants, different traits are associated with the coffee yield and output of hulled coffee, and they are correlated with each other in different magnitudes and directions. Under these conditions, the selection of a single trait may not be the best strategy for selection, as this may lead to undesirable changes in other traits [42].
The total gains obtained through the selection indices were similar to those obtained by direct selection for greater weights of coffee beans (Table 4). All of the selection indices allowed plants to be selected with greater bean dry matter values. However, the genotype-ideotype index resulted in a greater total gain, similar to direct selection. Greater gains obtained with this index were found for the bean weight (28.34%), fruit weight (24.07%), and bean length (10.03%).
Table 4.
Estimates of genetic progress (%) with the use of selection indices and with direct and indirect univariate selection.
Direct selection for the main DMB trait and selection using the genotype-ideotype selection index resulted in the selection of the same set of genotypes (27, 9, 8, 5, 3, and 30), and for this reason, they exhibited the same estimates for the gain (Table 4). Lower gains in the main DMB trait were estimated, considering the genotypes selected by the indices of Smith and Razel (27, 9, 5, 11, 3, and 30) and Mulamba and Mock (27, 9, 5, 8, 30, and 35).
Unlike the multiplicative indices and the sum of ranks (Mulamba and Mock), the index based on measurement of the distance (genotype-ideotype) has advantages because it allows the inclusion of variables whose values are not in the extremes but nevertheless of interest to the breeder [42].
Genotypes 27 and 9 generally had the highest estimates for the gain for bean physical traits, and they were selected in all of the strategies considered (Table 4). These results indicate that these genotypes stand out through their superior performance for the DMB, with increases of 45.58% and 39.15%, respectively. However, these clones had substantial differences in their fruit hull dry matter, considering that clone 27 showed an increase of 60.02% in hull weight compared with the increase of 15.83% observed for clone 9. This finding of a greater hull weight for clone 27 explains the results observed by Partelli et al. [44], who evaluated these same genotypes and observed bean yields during hulling of 26.74 for clone 27 and 29.07% for clone 9.
Genotypes 8, 5, 3, and 30 showed intermediate estimates for the total gains for the traits of a greater bean weight and size (Table 4). However, all the physical traits evaluated were more balanced for these clones. Partelli et al. [44] studied these same clones and observed that clones 8 and 5 had the highest correlations between the weight of the cherry fruit and the weight of hulled beans. Finally, genotypes 11 and 35 had lower gain estimates for the main trait (i.e., the weight of the coffee beans). In addition to lower estimates for gain for the main trait, clone 11 had considerable indirect gains (47.84%) for the hull weight, an undesirable trait in the selection of superior genotypes.
Environmental factors significantly influence the expression of genetic traits such as the hull dry matter, dried fruit volume, and other fruit and bean size parameters by impacting nutrient uptake, water availability, and temperature responses [48,49]. For instance, in regions with higher soil fertility and optimal moisture levels, these genetic traits tend to be expressed maximally, leading to increased hull dry matter and dried fruit volumes due to better nutrient and water utilization, which enhances cell expansion and tissue density. Conversely, under drought or nutrient-poor conditions, traits linked to fruit mass may be reduced due to restricted growth, which affects the volume and width of both the fruit and hulled beans, as plants prioritize survival over growth. Furthermore, temperature variations can directly influence the metabolic rates which affect the hull and bean dry matter, potentially leading to variations in yield and quality, depending on the adaptability of the genotype to specific environmental conditions [50]. This interaction underscores the importance of considering both genetic selection and site-specific management practices for optimized productivity across diverse growing environments [3].
The principle of the selection indices is to summarize information on various traits such that the best values can be used to determine the best genotypes. Although the sum of the estimates of the gain from direct selection and the sum from the selection indices were similar, the use of selection indices allowed the identification of clones with more balanced traits. Genotypes 27 and 11, with greater bean weights, had significantly greater hull weights than the other genotypes also selected for their greater bean weights, such as clone 9.
4. Conclusions
The genotypic variance surpassed the environmental variance for all coffee fruit and bean physical traits, except for the greatest fruit width (FWG). Trait associations may either support or hinder selection. Positive correlations between the bean weight and fruit weight contrasted with those between the fruit weight and hull weight. The total gains from the selection indices were comparable to direct selection for higher bean weights, yet the indices helped identify clones with more balanced traits. Notably, genotype 27, which had the highest bean weight, also had a greater hull weight, while genotype 9 combined a high bean weight with a lower hull weight.
Author Contributions
Conceptualization, J.R.D., R.B.R., G.O., L.F.B.d.A., M.C.E., W.P.R. and F.L.P.; methodology, J.R.D., R.B.R., G.O., L.F.B.d.A., M.C.E., W.P.R. and F.L.P.; validation, J.R.D., R.B.R., G.O., L.F.B.d.A., M.C.E. and W.P.R.; formal analysis, J.R.D., R.B.R., G.O., L.F.B.d.A., M.C.E., W.P.R. and F.L.P.; investigation, J.R.D., R.B.R., G.O., L.F.B.d.A., M.C.E., W.P.R. and F.L.P.; resources, F.L.P.; writing—original draft preparation, J.R.D., R.B.R., G.O., L.F.B.d.A., M.C.E., W.P.R. and F.L.P.; writing—review and editing, J.R.D., R.B.R., G.O., L.F.B.d.A., M.C.E., W.P.R. and F.L.P.; visualization, J.R.D., R.B.R., G.O., L.F.B.d.A., M.C.E., W.P.R. and F.L.P. All authors have read and agreed to the published version of the manuscript.
Funding
We thank to the Fundação de Amparo à Pesquisa e Inovação do Espírito Santo—FAPES (Proc. 2022-WTZQP for F.L.P.), and the Conselho Nacional de Desenvolvimento Científico e Tecnológico—CNPq (Proc. 309,535/2021–2 for F.L.P.).
Data Availability Statement
Data is contained within the article.
Acknowledgments
The authors thank the farmers who made the initial selection of the superior genotypes evaluated in this study and thank the farmer Thekson Pianissoli.
Conflicts of Interest
The authors declare no conflicts of interest.
References
- Davis, A.P.; Rakotonasolo, F. Six New Species of Coffee (Coffea) from Northern Madagascar. Kew Bull. 2021, 76, 497–511. [Google Scholar] [CrossRef]
- Salvador, H.P.; Berilli, A.P.C.G.; Rodrigues, W.P.; Mazzafera, P.; Partelli, F.L. A Climate Change Perspective on the Selection, Development, and Management of Coffea canephora Genotypes. Adv. Bot. Res. 2024, 10. [Google Scholar] [CrossRef]
- dos Santos, M.M.; Oliveira, M.G.; Cassol, D.; Rodrigues, W.P.; Falqueto, A.R.; Ramalho, J.C.; Partelli, F.L. Genotypic Diversity of Coffea canephora cv. Conilon Identified through Leaf Morpho- and Eco-Physiological Traits. Sci. Hortic. 2024, 324, 112603. [Google Scholar] [CrossRef]
- Silva, L.O.E.; Rodrigues, M.J.L.; Ferreira, M.F.d.S.; de Almeida, R.N.; Ramalho, J.C.; Rakocevic, M.; Partelli, F.L. Modifications in Floral Morphology of Coffea spp. Genotypes at Two Distinct Elevations. Flora 2024, 310, 152443. [Google Scholar] [CrossRef]
- Partelli, F.L.; Oliosi, G.; Farah, A.; Paula, J.d.; Oliveira, H.F.d.; Salvador, H. SALUTAR: First cultivar bred for soluble coffee production and health. Funct. Plant Breed. J. 2022, 4, 59–65. [Google Scholar] [CrossRef]
- Rocha, R.B.; Teixeira, A.L.; Ramalho, A.R.; Espindula, M.C.; Pereira Lunz, A.M.; Souza, F.D.F. Coffea canephora Breeding: Estimated and Achieved Gains from Selection in the Western Amazon, Brazil. Ciênc. Rural. 2021, 51, e20200713. [Google Scholar] [CrossRef]
- Conab, C.N.D.A. Acompanhamento da Safra Brasileira de Café; CONAB: Brasilia, Brazil, 2023; Volume 10. [Google Scholar]
- Damatta, F.M.; Ramalho, J.D.C. Impacts of Drought and Temperature Stress on Coffee Physiology and Production: A Review. Braz. J. Plant Physiol. 2006, 18, 55–81. [Google Scholar] [CrossRef]
- Charrier, A.; Eskes, A.B. Botany and Genetics of Coffee. In Coffee: Growing, Processing, Sustainable Production: A Guidebook for Growers, Processors, Traders, and Researchers; Wintgens, J.N., Ed.; WILEY-VCH: Darmstadt, Germany, 2004; pp. 25–56. ISBN 9783527307319. [Google Scholar]
- de Souza, C.A.; Rocha, R.B.; Dos Santos, M.R.A.; Lopes, T.A.; Teixeira, A.L.; Espindula, M.C. In Vitro Pollination and Fluorescence Microscopy for Characterization of Gametophytic Self-Incompatibility of Coffea canephora Pierre Ex A. Froehner. Crop Breed. Appl. Biotechnol. 2021, 21, e37692142. [Google Scholar] [CrossRef]
- Ferrão, M.A.G.; Souza, E.M.R.; Da Fonseca, A.F.A.; Ferrão, R.G. Self-Incompatibility and Sustainable Production of Conilon Coffee. In Conilon Coffee; Ferrão, R.G., Fonseca, A.F.A.d., Ferrão, M.A.G., De Muner, L.H., Eds.; INCAPER: Vitória, Brazil, 2019; pp. 203–221. ISBN 978-85-89274-32-6. [Google Scholar]
- Dubberstein, D.; Partelli, F.L.; Guilhen, J.H.S.; Rodrigues, W.P.; Ramalho, J.C.; Ribeiro-Barros, A.I. Biometric Traits as a Tool for the Identification and Breeding of Coffea canephora Genotypes. Genet. Mol. Res. 2020, 19, gmr18541. [Google Scholar] [CrossRef]
- Ferrão, M.A.G.; de Mendonça, R.F.; Fonseca, A.F.A.; Ferrão, R.G.; Senra, J.F.B.; Volpi, P.S.; Filho, A.C.V.; Comério, M. Characterization and Genetic Diversity of Coffea canephora Accessions in a Germplasm Bank in Espírito Santo, Brazil. Crop Breed. Appl. Biotechnol. 2021, 21, 36132123. [Google Scholar] [CrossRef]
- Oliveira, L.N.L.d.; Rocha, R.B.; Ferreira, F.M.; Spinelli, V.M.; Ramalho, A.R.; Teixeira, A.L. Selection of Coffea canephora Parents from the Botanical Varieties Conilon and Robusta for the Production of Intervarietal Hybrids. Ciênc. Rural. 2018, 48, 4. [Google Scholar] [CrossRef]
- Fonseca, A.F.A.d.; Sediyama, T.; Cruz, C.D.; Sakaiyama, N.S.; Gava Ferrão, M.A.; Ferrão, R.G.; Bragança, S.M. Divergência Genética Em Café Conilon. Pesqui. Agropecu. Bras. 2006, 41, 599–605. [Google Scholar] [CrossRef]
- Fonseca, A.F.A.d.; Ferrão, M.A.G.; Ferrão, R.G.; Verdin Filho, A.C.; Volpi, P.S.; Zucateli, F. ‘Conilon Vitória—Incaper 8142’: Improved Coffea canephora Var. Kouillou Clone Cultivar for the State of Espírito Santo. Crop Breed. Appl. Biotechnol. 2004, 4, 503–505. [Google Scholar] [CrossRef][Green Version]
- Bragança, S.M.; De Carvalho, C.H.S.; Da Fonseca, A.F.A.; Ferrão, R.G. Variedades Clonais de Café Conilon Para o Estado Do Espírito Santo. Pesqui. Agropecu. Bras. 2001, 36, 765–770. [Google Scholar] [CrossRef]
- de Morais, J.A.; Rocha, R.B.; Alves, E.A.; Espindula, M.C.; Teixeira, A.L.; de Souza, C.A. Beverage Quality of Coffea canephora Genotypes in the Western Amazon, Brazil. Acta Sci. Agron. 2021, 43, e52095. [Google Scholar] [CrossRef]
- Moraes, M.S.; Rocha, R.B.; Teixeira, A.L.; Espindula, M.C.; Silva, C.A.; Lunz, A.M.P. Adaptability and Stability of Coffea canephora Pierre Ex Froehner Genotypes in the Western Amazon. Ciênc. Rural. 2020, 50, e20190087. [Google Scholar] [CrossRef]
- Partelli, F.L.; Golynski, A.; Ferreira, A.; Martins, M.Q.; Mauri, A.L.; Ramalho, J.C.; Vieira, H.D. Andina—First Clonal Cultivar of High-Altitude Conilon Coffee. Crop Breed. Appl. Biotechnol. 2019, 19, 476–480. [Google Scholar] [CrossRef]
- Teixeira, A.L.; Rocha, R.B.; Espindula, M.C.; Ramalho, A.R.; Júnior, J.R.V.; Alves, E.A.; Lunz, A.M.P.; Souza, F.d.F.; Costa, J.N.M.; Fernandes, C.d.F. Amazonian Robustas—New Coffea canephora Coffee Cultivars for the Western Brazilian Amazon. Crop Breed. Appl. Biotechnol. 2020, 20, 1–5. [Google Scholar] [CrossRef]
- Ferrão, R.G.; Ferrão, M.A.G.; Volpi, P.S.; Verdin Filho, A.C.; da Fonseca, A.F.A.; Senra, J.F.B.; Comério, M.; de Mendonça, R.F.; Ferrão, L.M.V. ES 8152-CONQUISTA: Cultivar de café conilon propagada por sementes para os produtores de base familiar e sua utilização no melhoramento genético para o estado do Espírito Santo. Multi-Sci. Res. 2019, 2, 2595–6590. [Google Scholar]
- Bergo, C.L.; Miqueloni, D.P.; Lunz, A.M.P.; de Assis, G.M.L. Estimation of Genetic Parameters and Selection of Coffea canephora Progenies Evaluated in Brazilian Western Amazon. Coffee Sci. 2020, 15, e151663. [Google Scholar] [CrossRef]
- Caixeta, E.T.; Pestana, K.N.; Pestana, R.K.N. Melhoramento Do Cafeeiro: Ênfase Na Aplicação Dos Marcadores Moleculares. In Tópicos Especiais em Produção Vegetal V; Garcia, G.d.O., dos Reis, E.F., Lima, J.S.d.S., Xavier, A.C., Rodrigues, W.N., Eds.; CAUFES: Alegre, Brazil, 2015; Volume 5, pp. 154–179. ISBN 978-85-61890-69-8. [Google Scholar]
- Verdin Filho, A.C.; Volpi, P.S.; Colodetti, T.V.; Rodrigues, W.N.; Tomaz, M.A.; Martins, L.D.; Brinate, S.V.B.; Ferrao, R.G.; Fonseca, A.F.A.d.; Ferrao, M.A.G.; et al. The Permanence in the Plantation after Harvest Damages Physical Characteristics of Conilon Coffee Grains. Afr. J. Agric. Res. 2018, 13, 911–917. [Google Scholar] [CrossRef]
- Cruz, C.D.; Carneiro, P.C.S.; Regazzi, A.J. Modelos Biométricos Aplicados Ao Melhoramento Genético, 3rd ed.; UFV: Viçosa, Brazil, 2004; ISBN 8572691510. [Google Scholar]
- Souza, C.A.d.; Rocha, R.B.; Alves, E.A.; Teixeira, A.L.; Dalazen, J.R.; Fonseca, A.F.A.d. Characterization of Beverage Quality in Coffea canephora Pierre Ex A. Froehner. Coffee Sci. 2018, 13, 210–218. [Google Scholar] [CrossRef]
- Ramalho, A.R.; Rocha, R.B.; Souza, F.F.; Veneziano, W.; Teixeira, A.L. Progresso Genético Da Produtividade de Café Beneficiado Com a Seleção de Clones de Cafeeiro ‘Conilon.’ ver. Ciênc. Agron. 2016, 47, 516–523. [Google Scholar] [CrossRef]
- Vacarelli, V.N.; Medina Filho, H.P.; Fazuoli, L.C. Avaliacao de Frutos Chochos e de Sementes Do Tipo Moca No Rendimento de Hibridos Arabustas Tetraploides (Coffea crabica x C. canephora). Biosci. J. 2003, 19, 155–165. [Google Scholar]
- Ferreira, A.; Cecon, P.R.; Cruz, C.D.; Ferrão, R.G.; Da Silva, M.F.; Da Fonseca, A.F.A.; Ferrão, E.M.A.G. Seleção Simultânea de Coffea canephora Por Meio da Combinação de Análise de Fatores e Índices de Seleção. Pesqui. Agropecu. Bras. 2005, 40, 1189–1195. [Google Scholar] [CrossRef]
- Smith, H.F. A Discriminant Function for Plant Selection. Ann. Eugen. 1936, 7, 240–250. [Google Scholar] [CrossRef]
- Gonçalves, G.M.; Viana, A.P.; Neto, F.V.B.; Pereira, M.G.; Pereira, T.N.S. Seleção e Herdabilidade Na Predição de Ganhos Genéticos Em Maracujá-Amarelo. Pesqui. Agropecu. Bras. 2007, 42, 193–198. [Google Scholar] [CrossRef]
- Lessa, L.S.; Ledo, C.A.d.S.; Santos, V.d.S.; Silva, S.d.O.E.; Peixoto, C.P. Seleção de Híbridos Diplóides (AA) de Bananeira Com Base Em Três Índices Não Paramétricos. Bragantia 2010, 69, 525–534. [Google Scholar] [CrossRef]
- Mulamba, N.N.; Mock, J. Improvement of Yield Potential of the ETO Blanco Maize (Zea mays L.) Population by Breeding for Plant Traits [Mexico]. Egypt. J. Genet. Cytol. 1978. [Google Scholar]
- Wricke, G.; Weber, E. Quantitative Genetics and Selection in Plant Breeding; De Gruyter: Berlin, Germany, 1986; ISBN 978-3-11-007561-8. [Google Scholar]
- Alvares, C.A.; Stape, J.L.; Sentelhas, P.C.; De Moraes Gonçalves, J.L.; Sparovek, G. Köppen’s Climate Classification Map for Brazil. Meteorol. Zeitsch. 2013, 22, 711–728. [Google Scholar] [CrossRef]
- dos Santos, H.G.; Jacomine, P.K.T.; dos Anjos, L.H.C.; de Oliveira, V.Á.; Lumbreras, J.F.; Coelho, M.R.; de Almeida, J.A.; Araújo Filho, J.C.d.; de Oliveira, J.B.; Cunha, T.J.F. Sistema Brasileiro de Classificação de Solos, 5th ed.; Embrapa: Brasília, Brazil, 2018; ISBN 9788570358004. [Google Scholar]
- Ferrão, R.G.; da Fonseca, A.F.A.; Ferrão, M.A.G.; De Muner, L.H. Café Conilon, 2nd ed.; Incaper: Vitória, Brazil, 2017; Volume 2, ISBN 978-85-89274-26-5. [Google Scholar]
- Prezotti, L.C.; Gomes, J.A.; Dadalto, G.G.; Oliveira, J.A. Manual de Recomendação de Calagem e Adubação Para o Estado Do Espírito Santo—5° Aproximação; SEEA/INCAPER/CEDAGRO: Vitória, Brazil, 2007. [Google Scholar]
- Partelli, F.L.; Pereira, L.L.; Oliosi, G.; Campanharo, A.; Covre, A.M.; Alberto, N.J.; Salvador, H.P. Research and Development in Conilon and Robusta Coffee; Khas Editora: São Mateus, Brazil, 2024. [Google Scholar]
- Moreira, S.M.C.; Chaves, M.A.; Oliveira, L.M. Comparacao Da Eficiencia de Liquidos Na Determinacao Da Massa Especifica Aparente de Graos Agricolas. Ver. Bras. Armazen. 1985, 9–10, 22–24. [Google Scholar]
- Cruz, C.D.; Regazzi, A.; Carneiro, P.C.S. Modelos Biométricos Aplicados Ao Melhoramento Genético, 4th ed.; UFV: Viçosa, Brazil, 2012; Volume 1, ISBN 8572694331. [Google Scholar]
- De Resende, M.D.V. Biometric Genetics and Statistics in the Breeding of Perennial Crops (Portuguese); Embrapa Informação Tecnológica; Embrapa Florestas: Brasilia, Brazil, 2002; ISBN 85-7383-161-8. [Google Scholar]
- Partelli, F.L.; Oliosi, G.; Dalazen, J.R.; da Silva, C.A.; Vieira, H.D.; Espindula, M.C. Proportion of Ripe Fruit Weight and Volume to Green Coffee: Differences in 43 Genotypes of Coffea canephora. Agron. J. 2021, 113, 1050–1057. [Google Scholar] [CrossRef]
- Cecon, P.R.; Silva, F.F.; Ferreira, A.; Ferrão, R.G.; Carneiro, A.P.S.; Detmann, E.; Faria, P.N.; Morais, T.S.D.S. Análise de Medidas Repetidas Na Avaliação de Clones de Café “Conilon”. Pesqui. Agropecu. Bras. 2008, 43, 1171–1176. [Google Scholar] [CrossRef]
- Silva, D.O.d.; Ferreira, F.M.; Rocha, R.B.; Espindula, M.C.; Spinelli, V.M. Genetic Progress with Selection of Coffea canephora Clones of Superior Processed Coffee Yield. Ciênc. Rural 2018, 48, e20170443. [Google Scholar] [CrossRef]
- De Resende, M.D.V.; Furlani-Júnior, E.; de Moraes, M.L.T.; Fazuoli, L.C. Estimativas de Parâmetros Genéticos e Predição de Valores Genotípicos No Melhoramento Do Cafeeiro Pelo Procedimento Reml/Blup. Bragantia 2001, 60, 185–193. [Google Scholar] [CrossRef]
- Boote, K.J.; Hopf, N.; Jones, J.W.; Tsuji, G.Y.; White, J.W.; Singh, U.; Hwang, S.Y. Modeling Crop Growth and Yield as Affected by Temperature, Water, and Nutrients. Crop Sci. 2022, 62, 171–185. [Google Scholar]
- Kyriacou, M.C.; Rouphael, Y. Seasonal Variations and Environmental Effects on Crop Quality Traits: A Review of Horticultural Applications. J. Hort. Sci. 2018, 45, 489–500. [Google Scholar]
- Montillet, J.L.; Rumeau, D.; Leonhardt, N.; Rey, P. Abiotic Stress and Morphological Adaptations in Crop Plants: Implications for Fruit Development. Plant Cell Environ. 2021, 44, 1417–1435. [Google Scholar] [CrossRef]
Disclaimer/Publisher’s Note: The statements, opinions and data contained in all publications are solely those of the individual author(s) and contributor(s) and not of MDPI and/or the editor(s). MDPI and/or the editor(s) disclaim responsibility for any injury to people or property resulting from any ideas, methods, instructions or products referred to in the content. |
© 2024 by the authors. Licensee MDPI, Basel, Switzerland. This article is an open access article distributed under the terms and conditions of the Creative Commons Attribution (CC BY) license (https://creativecommons.org/licenses/by/4.0/).