Abstract
Phosphofructokinase 1 (PfkA) mediates the ATP-dependent phosphorylation of fructose-6-phosphate and is a key, controlling enzyme in glycolysis for Escherichia coli and other organisms. In this study, 22 chromosomally expressed PfkA variants were constructed in E. coli C. These variants, the wild-type strain, and the ∆pfkA strain were compared for growth rates using glucose as the sole carbon source. The majority of variants (14 of 22) attained a growth rate less than 20% of the growth rate of the wild-type strain (0.94 h−1) and thus similar to the knockout strain (0.12 h−1). Three variants (R171S, F76Y, and R77A), representing a range of growth phenotypes, and strains expressing the wild-type PfkA and the ∆pfkA deletion strain were additionally examined for key intracellular metabolites and gene expression under nitrogen-limited steady-state conditions. These five strains could be distinguished by two groupings: strains with relatively high growth rates under batch conditions (wild-type and R77A variant) showed the greatest glucose consumption rate and formed acetate, whereas strains with low growth rates (F76Y, R77A, and ∆pfkA) exhibited low glucose consumption and did not accumulate acetate. As the PfkA mutation severity increased, the intracellular concentrations of acetyl-CoA and fructose-1,6-bisphosphate and the sum of dihydroxyacetone and glyceraldehyde-3-phosphate greatly decreased. Although the mutation severity had a limited effect on the expression of maeB and icd genes expressing malic enzyme and isocitrate dehydrogenase, it correlated with reduced expression of zwf and pta genes expressing glucose-6P-dehydrogenase and phosphotransacetylase, respectively. The results highlight the great sensitivity of the enzyme to substitutions and the key role it plays in controlling glycolytic flux.
1. Introduction
The flux distribution of central carbon metabolism among the Embden–Meyerhof–Parnas Pathway (EMP), the Entner–Doudoroff Pathway (EDP), and/or the Pentose Phosphate Pathway (PPP) plays an important role in cellular physiology and metabolism [1]. For example, wild-type Escherichia coli growing on glucose at its maximum growth rate diverts about 78% of glucose-6-phosphate (glucose-6P) towards the EMP, about 22% to the PPP, and essentially no carbon into the EDP [1]. Because entry into the oxidative PPP generates 2 mol NADPH/mol glucose-6P in E. coli, whereas the EMP generates no NADPH, the flux distribution between the EMP and the PPP impacts NADPH availability for biosynthetic reactions [2].
Glycolytic flux and the partition of carbon between the EMP and PPP are relevant to microbial processes synthesizing many important biochemicals, including 3-hydroxypropionic acid, lycopene, bacitracin, and isobutanol. These biochemicals require NADPH as an electron donor for their synthesis and are thought to be limited by NADPH availability [3,4,5,6]. In wild-type E. coli, NADPH is primarily generated by three routes: (1) endogenous transhydrogenase activity, (2) from glucose-6P by sequential glucose-6P 1-dehydrogenase and 6-phosphogluconate dehydrogenase at entrance to the PPP, and (3) isocitrate dehydrogenase in the tricarboxylic acid (TCA) cycle [3,7]. Among these routes, the oxidative PPP typically dominates NADPH generation in E. coli during growth on glucose [8].
One strategy to alter the flux distribution between the EMP and the PPP is to increase or decrease the expression of key enzymes at the branchpoint. For example, the overexpression of glucose-6P dehydrogenase (coded by zwf gene), 6-phosphogluconolactonase (pgl), or 6-phosphogluconate dehydrogenase (gnd) in E. coli increases the generation of NADPH-dependent products [9,10,11]. Fortunately, the overexpression of these genes does not significantly affect the glucose uptake rate or specific growth rate in E. coli under batch conditions with glucose as the sole carbon source [12]. In contrast, a deletion in the pgi gene (phosphoglucose isomerase, Pgi) eliminates the EMP conversion of glucose-6P to fructose-6P, decreases the growth rate by 73% [7], and leads to the upregulation of the EDP, a pathway that generates 1 mol NADPH/mol glucose [13]. Similarly, a ∆pfkA strain (phosphofructokinase 1, PfkA), which maintains 20–30% residual activity as a result of the isoenzyme coded by the pfkB gene [2,14], directs 62% of glucose-6P towards the PPP [15]. However, a pfkA knockout reduces the availability of phosphoenolpyruvate (PEP), reduces the growth rate by more than 70%, and slows the glucose uptake rate by 64–75% [14]. The growth of ∆pfkA strains on glucose is accompanied by the partial cyclization of carbon through the PPP: flux is observed from fructose-6P back to glucose-6P via the reversible Pgi [14].
Deletions of either of the glycolytic genes pgi or pfkA do successfully divert flux towards PPP and increase NADPH formation but constitute an all-or-nothing approach, which severely decreases the cell growth rate and provides limited ability to modulate flux. Finer modulation of partitioning between the EMP and PPP could potentially serve as a means to control NADPH formation and glycolytic flux. Because the equilibrium catalyzed by Pgi is reversible, PfkA is a preferred target for affecting the partitioning between the EMP and PPP (Figure 1). Modulating PfkA expression in the context of myo-inositol formation has previously been examined using a promoter library [16]. Another approach is to alter the intrinsic activity of PfkA via site-directed mutagenesis to make targeted amino acid substitutions that decrease but do not eliminate the affinity of the substrate(s) (increasing apparent KM) or the catalytic activity (decreasing kCAT). This strategy has been examined previously as a means to reduce flux into the TCA cycle [17] and at the pyruvate node [18].
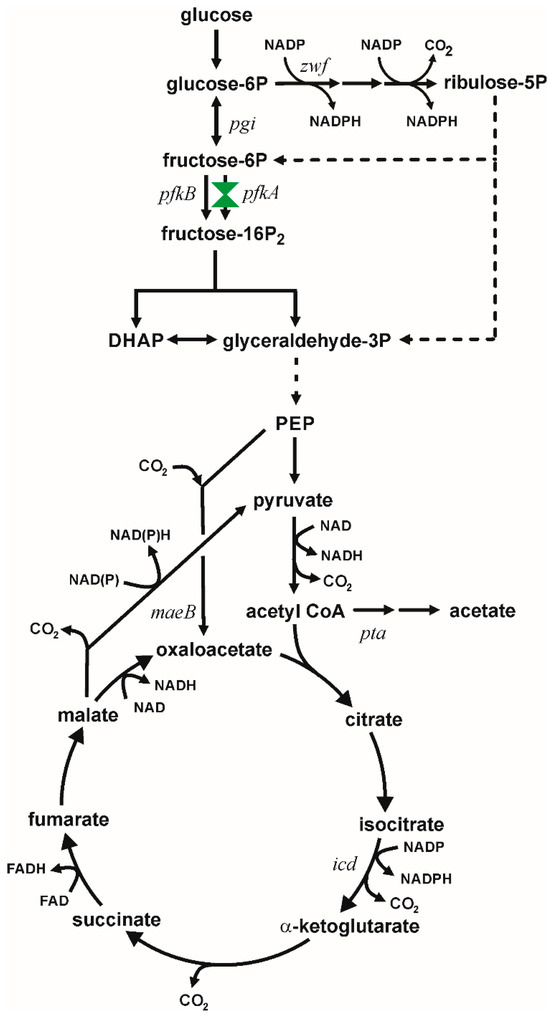
Figure 1.
Metabolism of glucose in Escherichia coli showing carbon flux partition at glucose-6P between the EMP and PPP. Dashed lines indicate multiple enzymatic steps. This study focuses on modulating metabolism by constructing variants in PfkA coded by the pfkA gene. Other relevant genes are indicated at the location of their encoded enzyme.
Phosphofructokinase 1 (EC 2.7.1.11) is an allosteric enzyme that catalyzes the phosphorylation of fructose-6P by ATP to fructose-1,6-bisphosphate (fructose-16P2) in the presence of magnesium [19]. This tetrameric enzyme shows cooperative kinetics with fructose-6P, hyperbolic kinetics with ATP, allosteric activation by ADP and GDP, and inhibition by PEP [20]. Because the deletion of pfkA alone reduces the growth rate on glucose significantly [2], the growth rate should be a convenient estimate of the severity of the effect of PfkA amino acid substitutions on activity. Intracellular fructose-16P2 regulates the transcription factor Cra, independent of the glycolytic carbon source, which in turn regulates the expression of lower glycolytic enzymes and controls glycolytic flux [21,22]. Thus, intracellular fructose-16P2 has been used as an indicator of glycolytic activity in living cells [23].
The goal of this study is to create and examine a suite of variants of PfkA that reduce the glycolytic flux. Such strains could be of use in redirecting glucose flux to other pathways such as the PPP for the production of biochemicals derived in that pathway or for increasing NAD(P)H availability for biochemicals generated by other pathways. Unlike a brute-force strategy of merely deleting the pgi or pfkA genes, such a collection of variants might offer a range of phenotypes to fine-tune glycolytic flux. We hypothesize that PfkA variants of E. coli having reduced activity would alter their metabolism in response to this perturbation, as determined based on glucose uptake, the expression of key glycolytic genes (e.g., zwf and pta), and the concentrations of intracellular metabolites (e.g., fructose-16P2 and acetyl-CoA).
2. Materials and Methods
2.1. Strains and Genetic Modifications
Strains used in this study are shown in Table 1. The pfkA gene knockout in E. coli C (ATCC 8739) and point-mutant integrations were performed using the λ-Red homologous recombination system as described by Datsenko and Wanner (2000) [24]. Knockouts were selected on Lysogeny Broth (LB) plates supplemented with 40 mg/L kanamycin (LB-Kan). Forward primers external to the target gene and reverse primers within the kanamycin-resistance cassette were used to confirm proper chromosomal integration (Table 2). The kanR marker was removed via the expression of FLP recombinase from pCP20 [25]. Gene knockouts and removal of the markers were verified via colony PCR using GoTaq® DNA polymerase (Promega, Madison, WI, USA).

Table 1.
Strains used in this study.
Table 2.
Primers used in this study.
A homologous recombination method was used to integrate point-mutated pfkA variants in MEC1013. pKSI-1 plasmids containing a point mutation in pfkA were used as donor DNA for chromosomal integration [26]. Plasmids (Table 3) were constructed using NE-Builder HiFi Assembly (New England Biolabs, Ipswich, MA, USA) or Escherichia coli DH5α-mediated assembly [27]. The point-mutated pfkA variant, kanamycin cassette, and more than 500 bp of the flanking homology region were amplified from the respective plasmid and used to transform electrocompetent MEC1013 expressing the λ-Red system from pKD46 [24], and positive transformants were selected on LB-Kan. Integration was confirmed via colony PCR with GoTaq® DNA polymerase, and point-mutated pfkA genes were amplified from the chromosome, gel purified, and sequenced to confirm proper substitutions (ACGT, Inc., Wheeling, IL, USA).
Table 3.
Plasmids used in this study.
2.2. Plasmid Construction
Phusion High-Fidelity Polymerase (New England Biolabs, Ipswich, MA, USA) or PrimeStar Max High-Fidelity Polymerase (Takara Bio, Mountain View, CA, USA) was used to amplify DNA for cloning and genome integration. Assembled plasmids with NEbuilder® Hifi assembly were chemically transformed into E. coli DH5α cells and were selected on LB plates containing appropriate antibiotics. The Quick-DNA Miniprep and Zyppy Plasmid Miniprep Kits were used to purify genomic and plasmid DNA (Zymo Research, Irvine, CA, USA). Zymoclean Gel DNA Recovery Kits were used to purify PCR fragments (Zymo Research, Irvine, CA, USA). Restriction enzymes were purchased from New England Biolabs. Plasmids were confirmed via restriction digestion and sequencing (ACGT, Inc., Wheeling, IL, USA). To construct pHR1, a kanamycin cassette was amplified from pKD4 [24], pfkA gene with 500 bp of flanking DNA in the upstream region and 78 bp downstream from ATCC 8739, 516 bp downstream of the pfkA gene from ATCC 8739 were cloned into the pKSI vector backbone. All plasmids harboring a single point-mutated pfkA gene were generated from pHR1 using mutagenic primers that incorporated mutations into homologous regions using PCR-based site mutagenesis (Table 2).
Residues targeted for modification were selected from the literature and via visual inspection of the PfkA atomic structure (1PFK) [19] using software for molecular visualization (Pymol Molecular Graphics System version 2.5.3, Schrödinger, Inc., New York, NY, USA). Factors such as the structure, charge, and polarity of amino acids and codon usage frequency of E. coli were considered to construct the pfkA variants.
2.3. Media and Growth Conditions
E. coli strains were routinely maintained and cultured in LB, though for strain comparisons, a defined medium was used. The defined medium contained (final concentrations, per L) the following: 5.0 g glucose, 3.50 g NH4Cl, 1.44 g KH2PO4, 2.51 g K2HPO4, 2.0 g K2SO4, 0.02 g Na2(EDTA)·2H2O, 0.45 g MgSO4·7H2O, 0.02 g thiamine HCl, 0.25 mg ZnSO4·7H2O, 0.125 mg CuCl2·2H2O, 1.25 mg MnSO4·H2O, 0.875 mg CoCl2·6H2O, 0.06 mg H3BO3, 0.25 mg Na2MoO4·2H2O, 5.5 mg FeSO4·7H2O, and 50 mg citric acid. Thiamine was filter sterilized, while other medium components were autoclaved in compatible mixtures, combined, and then adjusted to a pH of 7.2 with 30% (w/v) KOH. A nitrogen-limited (NLim) medium was identical except for containing 20.0 g/L glucose and 1.0 g/L NH4Cl. When necessary for plasmid maintenance, 100 µg/mL ampicillin or 40 µg/mL kanamycin was included in the medium.
2.4. Shake Flask Cultures
Each strain was first grown in 3 mL of LB medium to an optical density (OD) of 2, and then, 100 µL was used to inoculate 3 mL of defined medium. After growth, this culture was used to inoculate three 250 mL baffled flasks containing 50 mL defined medium to an initial OD of 0.02. Flasks were incubated at 37 °C at an agitation of 250 rpm. Approximately 6–8 periodic samples were used to calculate the growth rate.
2.5. Steady-State Process
Nitrogen-limited steady-state processes were conducted as chemostats. Each strain was initially cultured in LB and then inoculated into a 125 mL baffled shake flask containing 20 mL of NLim medium. When the shake flask culture reached an OD of 2, the 20 mL contents were used to inoculate a 1 L bioreactor (Bioflo 310, New Brunswick Scientific Co., New Brunswick, NJ, USA) containing 750 mL of NLim medium. After batch growth, the chemostat was initiated at a nominal dilution rate of 0.1 h−1. The process operated at 37 °C using 400 rpm agitation. Air and/or oxygen-supplemented air was sparged at 0.75 L/min to maintain a dissolved oxygen concentration above 40% of saturation. An additional 30% w/v KOH was used to fine-control the pH to 7.0, and antifoam 204 (Sigma, St. Louis, MI, USA) was used as necessary. To ensure a steady-state, measurements were initiated at least 5 residence times after the chemostat commenced, and multiple samples collected were separated by at least one residence time. Data represent the means of two or more steady-state measurements.
2.6. RT-qPCR
During each chemostat culture after achieving a steady-state, samples for total RNA were collected (109 cells) and centrifuged (16,000× g, 2 min), and the cell pellet was suspended in 1 × RNA protect (New England Biolabs, Ipswich, MA, USA) and stored at −80 °C until RNA extraction. The Monarch Total RNA Miniprep Kit (New England Biolabs, Ipswich, MA, USA) was used to prepare total RNA from frozen samples. RNA was used as a template for PCR to confirm the absence of genomic DNA. One-step quantitative reverse transcriptase PCR (RT-qPCR) was performed using the Luna Universal One-Step RT-qPCR Kit (New England Biolabs, Ipswich, MA, USA) on a StepOne Plus instrument (Applied Biosystems, Foster City, CA, USA). Gene-specific primers were designed to create amplicons of 150–200 bp of target genes by using Primer 3 software. Primer pairs for pfkA, zwf, icd, maeB, and pta and the housekeeping gene rpoD were confirmed to have similar efficiencies in the range of 2–6 ng. Triplicate 20 µL reactions containing the same amount of total RNA for each sample were analyzed. No-template and no-RT controls were included. The 2−ΔΔCT method was used to calculate the fold-change in expression from CT values generated by the StepOne Plus software version 2.3 [28]. Mean ΔCT values were then calculated for each variant and compared to the corresponding wild-type mean ΔCT to obtain ΔΔCT values. Statistical significance of gene expression differences between each variant and the wild-type was assessed using a paired, two-tailed Student’s t-test performed on ΔCT values, with p < 0.05 considered statistically significant.
2.7. Quenching and Extraction
During each chemostat culture, a sample was directly withdrawn to a sample tube containing 60% (v/v) methanol and 70 mM HEPES (2-[4-(2-hydroxyethyl)-1-piperazine-1-yl]ethanesulfonic, pH-7.4) buffer quenching solution at −80 °C [29,30]. Sample tubes containing quenching solution were weighed before and after the sampling. Quenched samples were centrifuged (10,000× g for 5 min at −5 °C), and the cell pellet was processed for the extraction of metabolites [29,31].
A perchloric acid extraction procedure was used to extract glucose-6P, fructose-6P, fructose-16P2, dihydroxyacetone-P (DHAP), glyceraldehyde-3P (GAP), ATP, ADP, AMP, and acetyl-CoA [29,31,32]. After centrifugation, an approximate 25% volume of 35% (v/v) perchloric acid (−20 °C) was added, and the cell pellet was resuspended and stored at −80 °C in aliquots. After one freeze–thaw cycle, proteins and cell fragments were removed via centrifugation (10,000× g for 30 min at −5 °C), the supernatant was neutralized with 5 M K2CO3, and then, it was centrifuged again (10,000× g for 10 min at −5 °C). The supernatant was stored at −80 °C in 900 μL aliquots until further analysis. Throughout the procedure, the temperature was maintained below 0 °C [29,31].
An acid/base quenching procedure was used to extract NAD(P)H [33]. A sample was directly withdrawn into twice the volume of 0.3 N HCl (to extract NADP) or 0.3 N KOH (to extract NADPH). Both acid- and base-extracted samples were incubated at 60 °C for 7 min to extract respective redox metabolites and then cooled to 0 °C in an ice bath. Extracts were stored at 4 °C prior to use [34]. Immediately before analysis, acid extracts were adjusted with 0.3 N KOH to pH 6.5, and base extracts were adjusted with 0.3 N HCl to pH 7.5, incubated for 10 min at 0 °C to precipitate proteins, and centrifuged (10,000× g for 15 min) [35]. The rapid quenching of labile intracellular metabolites minimized degradation.
2.8. Intracellular Metabolite Analyses
Enzymatic analyses of cell extracts based on NAD(P)H formation were performed at 37 °C using 0.2 M triethanolamine buffer (pH 7.6) [29]. Assays for intracellular metabolites were adapted from previous studies [29,31,32,33,35].
Intracellular glucose-6P and fructose-6P were measured in the presence of 5 mM MgCl2 and 0.4 mM NADP by sequentially adding glucose-6P dehydrogenase (0.17 U/mL) and phosphoglucose isomerase (0.7 U/mL) [36]. After the absorbance stabilized, 5 mM fructose and hexokinase (2.8 U/mL) were added to calculate ATP [37].
Intracellular fructose-16P2, DHAP, and GAP were assayed with 0.15 mM NADH in 1.5 M triethanolamine (pH 8.5) via the sequential addition of glycerol-3P dehydrogenase (0.15 U/mL), triosephosphate isomerase (2.5 U/mL), and aldolase (1 U/mL) [38].
Intracellular ADP was measured in 125 mM KCl, 10 mM MgSO4, 2.8 mM PEP, and 0.27 mM NADH based on the sequential addition of lactate dehydrogenase (2.4 U/mL) and pyruvate kinase (2.0 U/mL). Intracellular AMP was assayed in the sample via the addition of myokinase (1.4 U/mL) and 0.10 mM ATP [39].
Intracellular acetyl-CoA was measured in the presence of 0.2 mM tris-HCl, 1.5 mM NAD, and 5 mM malate via the sequential addition of malate dehydrogenase (0.9 U/mL) and citrate synthase (0.075 U/mL) [40].
Intracellular NADP and NADPH were quantified using a cycling assay [33,35]. NADPH and NADP+ were assayed in the presence of 1.12 M bicine buffer, 0.55 mM thiazolyl blue tetrazolium bromide, 2.45 mM phenazine ethosulfate, 10 mM glucose-6P, and 5 U/mL glucose-6P dehydrogenase [35]. The slope of the absorbance change was compared with standards prepared through the same extraction and assay procedures.
The redox state of nucleotides and energy charge may change during the extraction methodology. The measurements were made consistently, and the values determined in this study are mainly used for relative comparisons between different strains.
2.9. Analytical Methods
A spectrophotometer (UV-650 spectrophotometer, Beckman Instruments, San Jose, CA, USA) was used for the measurement of all intracellular metabolites and for the OD at 600 nm to monitor cell growth. For dry cell weight measurements of the chemostat culture, three 20.0 mL samples were centrifuged (3300× g, 10 min, 4 °C), and the pellets were washed/centrifuged three times with 20 mL deionized water and then dried at 60 °C for 24 h.
Samples were routinely frozen at −20 °C for glucose and organic acid analysis, and thawed samples were centrifuged (8000× g for 5 min) and filtered (0.45 µm nylon, Acrodisc, Pall Corporation, Port Washington, NY, USA). High-performance liquid chromatography (HPLC) using 4 mN H2SO4 at 60 °C and 0.6 mL/min with a Coregel 64-H ion-exclusion column (Transgenomic Ltd., Glasgow, United Kingdom) and a refractive index detector was used to quantify glucose and organic acids [41]. Carbon dioxide and oxygen in the gas streams were measured using a Tandem Pro gas analyzer (H.E.L. Ltd., Borehamwood, London, UK).
To confirm the absence of ammonium in the effluent for nitrogen-limited chemostats, triplicate samples (5 mL) were stored at −20 °C, thawed on ice, centrifuged (16,000× g, 5 min), and then analyzed using the hydroxybenzyl alcohol method (Ammonia-CHEMets, CHEMetrics LLC., Midland, VA, USA). Student’s t-test was used to compare data statistically, with the 95% confidence interval being the basis for significance.
3. Results
3.1. Construction of PfkA Variants
In this study, we sought to reduce the catalytic activity of phosphofructokinase (PfkA), and thereby alter microbial physiology generally, and the distribution of fluxes between the EMP and the PPP specifically during the growth of E. coli on glucose as the sole carbon source. In order to test the effect of modified PfkA, different point mutations in the pfkA gene, corresponding to targeted amino acid substitutions, were introduced into the chromosome. Certain amino acid substitutions were not examined, such as those within the active site, as they would be expected to eliminate catalytic activity. For example, D127 facilitates the nucleophilic attack of the 1-hydroxyl on fructose-6P on the γ-phosphate of ATP [20], and the substitutions D127E, D127Y [20], and D127S [42] lead to more than a 99% decrease in activity. Because of the strong reduction in activity anticipated with these modifications, D127 was not targeted for site-directed mutagenesis. Because the goal instead was to modulate activity to affect growth and metabolism, we targeted amino acid residues that are (1) in the mobile loops (G10 to P14, P123 to I137, M169 to L176), stabilizing the catalytic phosphoryl group transfer near the active site, or (2) associated with the pocket that stabilizes fructose-6P and ATP.
For example, D103 is an important residue to position Mg2+ and stabilize the transition state [19] and was targeted for mutagenesis. We also selected R171, which is spatially adjacent to the active site, and substitutions here are known to affect kCAT and KM without eliminating activity [19,42,43]. Residue I126 was also targeted because a substitution here affects both KM and kCAT and can induce the R252 residue to “flop” into the binding cleft [44]. Another small mobile loop (G10;G11;D12;P14) appears to be involved in catalysis. Specifically, G11 stabilizes the phosphoryl transfer from ATP to fructose-6P, as the amide group of G11 forms a hydrogen bond with the phosphate group of ATP during the transition stage [19]. Given the proximity of G10 and G11 to the active site, these residues were targeted for mutagenesis.
The α-helix (G248 to G254) is believed to stabilize fructose-6P, and H249 interacts with the phosphate of fructose-6P [19]. R72 also stabilizes the transition state by interacting with the phosphate of fructose-6P [44]. Thus, both H249 and R72 were targeted for amino acid substitutions.
Residues Y41, F76, and R77 are within 9Å of the N-3 of the adenosine ring of ATP at the active site [45]. The modification of these residues was previously studied for the selectivity of other nucleotide triphosphates, and substitutions at Y41 and F76 with similar bulky groups cause moderate changes in kinetic parameters [45]. Similarly, R77 supports the hydrophobic pocket and stabilizes the ATP through an arginine crown formed with R88 and R111 [45]. We therefore selected Y41, F76, and R77 for substitutions.
In summary, 10 residues (G10, G11, Y41, R72, F76, R77, D103, I126, R171, H249) were selected to generate 22 PfkA variants (single-point mutations), which were chromosomally integrated into E. coli. Table 4 summarizes these residues, their proposed role in native enzyme catalysis, the specific substitutions examined in the current study, and any previously determined kinetic parameters. These PfkA variants were examined for their impact on microbial physiology (specific growth rate) and metabolic activity (transcription and metabolites).
Table 4.
Phosphofructokinase (PfkA) residues targeted for substitutions in E. coli, the role of the residue in the native enzyme, and, if previously determined, the effect of each of the substitutions of the kinetic parameters.
3.2. Substitutions in PfkA Affect Cell Growth Rate
E. coli ΔpfkA has previously been observed to have an 80% lower growth rate (0.11 h−1) on glucose as the sole carbon source compared to the wild-type strain [14] and therefore, the maximum specific growth rate (µmax) is believed to be a direct indicator of glycolytic flux [47]. We measured the specific growth rate of wild-type E. coli on glucose to be 0.94 ± 0.13 h−1 and the ΔpfkA strain to be 0.12 ± 0.01 h−1 (Figure 2). Many examined amino acid substitutions resulted in a specific growth rate only slightly greater than the knockout strain: R72K/S/V (0.15–0.17 h−1), D103A/E/V (0.17–0.19 h−1), I126A/E/K/S (0.13–0.14 h−1), G10A (0.13 h−1), and G11A (0.15 h−1). The growth rate of strains with a substitution at H249 depended on the amino acid: substitution of a bulky residue (H249F) resulted in a strain having more than 2× the growth rate (0.38 h−1) as one having an H249 substitution with a smaller residue (H249D, 0.14 h−1 and H249A, 0.18 h−1). Similarly, the growth rate of variants with a R171 substitution was influenced by the size and polarity/charge: R171K (0.46 h−1) resulted in a 20% greater growth rate than a small hydrophobic substitution (R171A, 0.38 h−1) and 80% greater than a small polar substitution (R171S, 0.26 h−1). Four variants with substitutions in the hydrophobic pocket, which stabilize ATP (Y41F, F76Y, R77A, and R77K), showed intermediate growth rates (0.33–0.57 h−1). We consider the reduced growth rate compared to the wild-type strain to be an indicator of the “mutation severity” and selected strains with a range of growth rates to investigate the effect of the mutation severity on cell physiology.
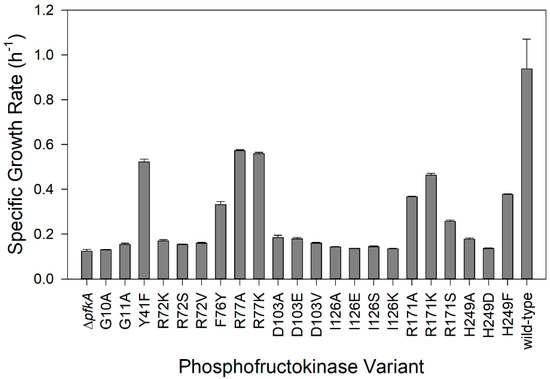
Figure 2.
Specific growth rates of E. coli PfkA variants using glucose as the sole carbon source. The ∆pfkA strain and strains expressing wild-type PfkA and 22 single amino acid substitutions were examined (error bars indicate standard deviation of triplicate experiments).
3.3. Steady-State Process
Cells growing in shake flasks experience dynamic conditions of pH and oxygenation, and each strain has a different specific growth rate. In order to examine variants having a range of mutation severity during growth under the identical conditions, we compared the wild-type strain, three pfkA variants, and ∆pfkA under steady-state conditions in a controlled bioreactor. We selected nitrogen (N)-limited conditions in a chemostat and a dilution rate (i.e., growth rate) of 0.1 h−1, by necessity just below the maximum specific growth rate of the ∆pfkA strain, to compare five strains showing a range of maximum specific growth rates and mutation severity: MEC1012 (ΔpfkA, 0.12 h−1), PfkA[R171S], 0.26 h−1, PfkA[F76Y], 0.33 h−1, PfkA[R77A], 0.57 h−1 and MEC1356 (wild-type PfkA, 0.94 h−1). Importantly, by growing at the same growth rate, any observed difference between the strains can be attributed to the presence of the variant enzyme and not due to a difference in the growth rate.
Nitrogen-limited, aerobic conditions were confirmed based on (a) the dissolved-oxygen (DO) concentration maintained above 40% saturation, (b) the absence of anaerobic products such as formate, succinate, and lactate, (c) the presence of glucose in the effluent, and (d) the absence of dissolved ammonium in the effluent.
3.4. Physiology and Respiration
The PfkA variant biomass yield on glucose (YX/Glu) at the same dilution rate of 0.1 h−1 under nitrogen limitation was related to the mutation severity (Table 5). The biomass yield on glucose of 0.26–0.31 g/g was the greatest for the three strains with the greatest mutation severity: PfkA[F76Y], PfkA[R171S] and the ΔpfkA strain. MEC1356 expressing the wild-type pfkA and PfkA[R77A] showed identical yields at 0.19 g/g (p > 0.05). Similarly, the specific glucose consumption rates (qGlu) could be divided into two groups: the three strains with the greatest mutation severity showed low glucose consumption rates (1.7–2.1 mmol g−1 h−1), whereas the two strains with low mutation severity exhibited about 50% greater glucose consumption rates (2.9–3.0 mmol g−1 h−1). The three strains with the greatest mutation severity furthermore generated very little acetate under nitrogen-limited steady-state conditions (qAce). This observation is noteworthy as nitrogen-limited conditions correspond with glucose-excess conditions, which are understood to promote acetate formation in E. coli [48]. PfkA[R77A] generated the most acetate, followed by the wild-type pfkA strain. No trend was observed for the oxygen consumption rate or carbon dioxide evolution rate. The respiratory quotients for PfkA variants and the ∆pfkA strain were close to 1 (Table 5). Only PfkA[F76Y] differed statistically from 1, and its low value, together with a carbon balance of 89%, suggests the formation of an undetected metabolite. Previous studies have noted that nitrogen-limited conditions with E. coli elevate the expression of genes involved in the formation of overflow metabolites, such as formate and ethanol [13]. Although we did not observe these specific compounds in the HPLC analyses, it is possible that volatile compounds were partly lost in the highly aerated process or that compounds were generated but not observed using the standard methodology.
Table 5.
Physiology and respiration parameters of nitrogen-limited steady-state cultures of the E. coli wild-type PfkA C strain (MEC1356), the PfkA knockout strain (MEC1012), and three PfkA variants. All strains were grown at 0.1 h−1 using glucose as the sole carbon source. Specific rates of consumption and generation (q) are in mmoles of substance per hour per gram of dry cell weight. Data represent the means of two or more steady-state measurements.
3.5. Intracellular Metabolites
Tuning PfkA activity by the use of targeted amino acid substitutions on this enzyme is anticipated to alter metabolism. Because a PfkA modification cannot be measured directly via a biochemical product such as pyruvate or acetate [17,18], we measured selected glycolytic metabolites and the adenylate charge through the rapid quenching of samples (Figure 3).
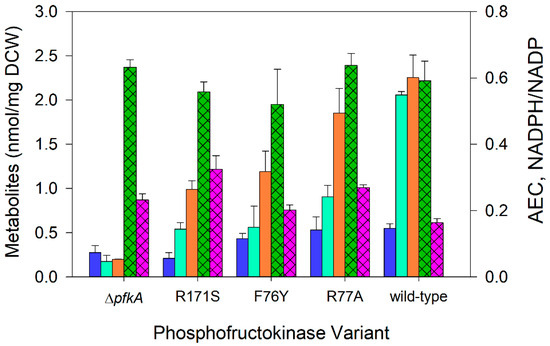
Figure 3.
Intracellular acetyl-CoA, fructose-16P2, GAP + DHAP concentrations (nmol mg−1), NADPH/NADP ratio, and adenylate charge during nitrogen-limited chemostats at a dilution rate of 0.1 h−1 using glucose as the sole carbon source: acetyl-CoA (⏹), fructose-16P2 (⏹), GAP+DHAP (⏹), adenylate charge (AEC, hatched ⏹), and NADPH/NADP ratio (hatched ⏹). E. coli expressing wild-type PfkA, three variant strains, and a ΔpfkA strains are arranged in ascending order of their maximum specific growth rate. Data represent the means of two or more steady-state measurements.
The acetyl-CoA pool is associated with increased acetate formation during nitrogen-limited cultures compared to glucose-limited cultures [13]. For the five strains examined under nitrogen-limited conditions at a dilution rate of 0.1 h−1, we observed a decrease in acetyl-CoA with increased mutation severity: PfkA[R77A] and the wild-type PfkA, the strains with the highest specific growth rate in batch culture, resulted in 0.53–0.55 nmol acetyl CoA/mg, compared to 0.21–0.27 nmol acetyl CoA/mg for the two slowest growing strains, PfkA[R171A] and ∆pfkA (Figure 3). The intermediate strain, PfkA[F76Y], showed an intermediate pool of acetyl CoA at 0.43 nmol/mg.
Fructose-16P2 is the direct product of phosphofructokinase [19], and unsurprisingly, the fructose-16P2 concentration also strongly correlated with the mutation severity (Figure 3). The wild-type PfkA strain showed 2.1 nmol fructose-16P2/mg under nitrogen-limited steady-state conditions. In order of increasing mutation severity, PfkA[R77A] showed 0.91 nmol fructose-16P2/mg, while PfkA[F76Y] and PfkA[R171S] had steady-state concentrations of 0.54–0.56 nmol fructose-16P2/mg. The ∆pfkA strain showed a steady-state concentration of 0.17 nmol fructose-16P2/mg.
The metabolites DHAP and GAP are interconvertible products of fructose-16P2, and the sum of their concentrations (DHAP + GAP) was also related to the mutation severity (Figure 3). Specifically, DHAP + GAP levels were lowest in the ΔpfkA strain (0.2 nmol/mg), intermediate in the variants (1.0–1.9 nmol/mg), and greatest in the wild-type strain (2.3 nmol/mg) (Figure 3).
The adenine nucleotides, adenosine triphosphate (ATP), adenosine diphosphate (ADP), and adenosine monophosphate (AMP) stoichiometrically couple energy producing and energy-consuming metabolic reactions. The Adenylate Energy Charge (AEC), defined as [(ATP) + 1/2 (ADP)]/[(ATP) + (ADP) + (AMP)], is directly correlated with the metabolically available energy stored in the adenylate system [49,50]. Under the nitrogen-limited conditions, all strains exhibited an AEC of 0.52–0.63 (Figure 3). We also measured NADPH/NADP in the five strains. The NADPH/NADP ratio was significantly greater (p < 0.05) in each variant (25–100%) compared to the ratio of NADPH/NADP in the wild-type strain (Figure 3).
3.6. qRT-PCR
Transcription patterns for the genes pfkA, zwf, icd, maeB, and pta relative to the housekeeping gene rpoD, expressing RNA polymerase sigma factor RpoD, were analyzed for three variant strains (PfkA[F76Y], PfkA[R77A], PfkA[R171S]), the ∆pfkA strain (MEC1012), and the wild-type strain (MEC1356) growing under nitrogen-limited conditions at 0.1 h−1. The pfkA gene was selected to analyze transcripts of PfkA variants compared to the wild-type and deletion strains. Other genes were selected for their importance for entry into the PPP (zwf), NADPH formation (maeB, icd), and the phosphorylation of acetyl-CoA (pta).
Transcript levels of the pfkA gene in MEC1012 (ΔpfkA) were similar to the no-template control confirming no PfkA expression in the knockout strain. The two variants with greater mutation severity, PfkA[R171S] and PfkA[F76Y], showed a significant 2.1- to 2.8-fold increase in the PfkA transcript (p < 0.05), while the variant with the lowest mutation severity, PfkA[R77A], showed a PfkA transcript indistinguishable from wild-type expression (Figure 4).
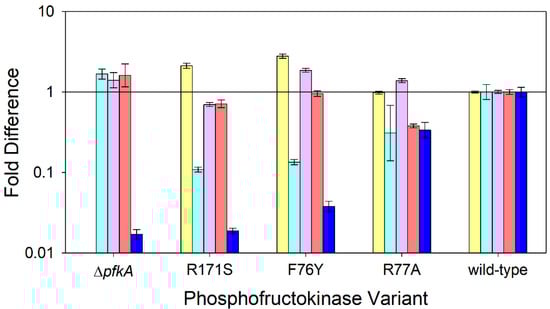
Figure 4.
Relative expression of selected genes compared to the wild-type strain during nitrogen-limited chemostats at a dilution rate of 0.1 h−1 using glucose as the sole carbon source: pfkA (⏹), zwf (⏹), maeB (⏹), icd (⏹), and pta (⏹). E. coli expressing wild-type PfkA, three variant strains, and the ΔpfkA strain are arranged in ascending order of their maximum specific growth rate. Data represent the means of two or more steady-state measurements.
MEC1012 (ΔpfkA) showed a 1.7-fold increase in the zwf transcript compared to the wild-type strain. In contrast, each of the three PfkA variants showed 70–90% less transcript compared to the wild-type strain (Figure 4). Previous research showed that a pfkA knockout redirected 60% of glycolytic flux towards the PPP compared to the wild-type [15]. Moreover, under N-limited steady-state conditions at 0.1 h−1, 93% of flux was directed towards the PPP in E. coli ∆pgi strains compared to 11% in wild-type strain [13]. The chromosomal deletion of pfkA alleviates the catabolite repression in E. coli, severely restricts growth on glucose, and allows the simultaneous uptake of other carbon sources [15]. Therefore, the observed increased zwf transcript in E. coli ∆pfkA is expected. Unexpectantly, all variants showed a decreased zwf transcript compared to both the wild-type and ∆pfkA strains.
The transcript for the maeB gene expressing the NADP-dependent malic enzyme did not show a trend among the five strains. While PfkA[R171S] showed a slightly lower transcript, PfkA[F76Y] and PfkA[R77A] showed a slightly greater transcript than the wild-type gene (p < 0.05) (Figure 4). Similarly, the transcript levels for the icd gene coding the TCA cycle enzyme isocitrate dehydrogenase did not show a trend among the variants and the ΔpfkA strain, and the transcripts for the ∆pfkA strain and PfkA[F76Y] were not significantly different than the icd transcript in the wild-type strain. Only PfkA[R77A] and PfkA[R171S] showed a significantly lower icd transcript (30–60%) than the wild-type strain (p < 0.05).
The results suggest that reducing the activity of PfkA through targeted substitutions, which would presumably tend to increase NADPH generation via the PP pathway, has a limited effect on NADPH generation via these two other enzymatic steps. Zhao et al. (2004) showed that a zwf knockout led to less than a 20% increase in TCA cycle flux during glucose-limited chemostats and a 35% increase in ICDH activity [51]. Furthermore, for both the wild-type and Δzwf strains in that previous study, malic enzyme was a minor contributor to NADPH generation. Although these observations were made with a zwf knockout rather than with PfkA variants, our results similarly suggest that a significant modification in metabolism near the onset of glycolysis has a limited impact on NADPH generation in lower metabolism. It is furthermore possible that in these PfkA variants NADPH/NADH is largely controlled by transhydrogenase activities. Additional studies will be needed to understand the routes these variants use to balance these cofactors.
Phosphotransacetylase (Pta), coded by the pta gene, is the first step in the pathway to form acetate in E. coli. A consistent trend was observed for the transcript of the pta gene: the greater the mutation severity, the lower the relative pta transcript. The ΔpfkA, PfkA[R171S], and PfkA[F76Y] strains each showed an expression level 96–98% lower than the wild-type pta, while PfkA[R77A] showed a 66% lower pta transcript relative to the wild-type strain (Figure 4).
4. Discussion
4.1. PfkA Plays a Key Role in Glycolysis
The phosphorylation of fructose-6P mediated by phosphofructokinase 1 (PfkA) is the rate-controlling reaction in glycolysis in diverse organisms [52,53], and with its unique allosteric properties and regulation, PfkA has been extensively studied [52,53,54,55,56]. In E. coli, two isoenzymes mediate the conversion: PfkA accounts for about 90% of the activity and non-allosteric PfkB plays a minor role [55,56,57]. PfkA is allosterically inhibited by PEP and shows cooperativity with fructose-6P and hyperbolic kinetics with ATP [53]. Monophosphonucleosides (AMP) and fructose-6P, diphosphonucleosides (ADP, GDP) are the activators of PfkA [54]. ADP also inhibits the enzyme by binding at the ATP site and affects the cooperativity of enzyme to fructose-6P [52]. The deletion of PfkA was reported to cause a 90% reduction in the growth rate of E. coli on glucose under aerobic conditions [16,55], and our observations using ATCC 8739 similarly showed an 87% decrease in the maximum specific growth rate of the ∆pfkA strain compared to the wild-type (Figure 2).
Various strategies have been examined to upregulate or downregulate PfkA expression. Overexpressing PfkA in E. coli previously led to a 2× increase in lactate formation due to activation of the methylglyoxal pathway, though glycolytic intermediates such as pyruvate and PEP did not increase [58]. The activity of Pfk1 in Aspergillus niger was improved by truncating the C-terminal residues that contain sites for allosteric inactivation by citrate. Alone, this strategy required phosphorylation of the enzyme [59], while an additional T89E PfkA substitution removed the requirement for phosphorylation of the truncated protein [60]. The post-translational reduction of PfkA activity and glycolytic flux has been accomplished using the well-characterized SsrA tag, which promotes the degradation of a target protein via induction of the SspB adaptor protein, which tethers ssrA-tagged proteins to the ClpXP protease [16].
In the current work, a modest set of single-substitution PfkA E. coli variants was created having altered activity. Because the EDP and PPP do not compensate for growth on glucose in the absence of PfkA [15], and because of the tight control PfkA has on glycolytic flux, we hypothesized that the severity of the substitution and its effect on activity would be correlated with the maximum specific maximum growth rate using glucose as the sole carbon source.
4.2. PfkA Variants Display a Range of Growth Rate Phenotypes
We targeted a variety of amino acid residues associated with the active site or the mobile loops. For example, we selected highly conserved residues G10, G11, and I126 in the mobile loops, which are not directly involved in catalytic activity [19,61,62,63]. In eukaryotic PfkA, alanine occupies the residue corresponding with E. coli G11 [61], and thus, a G10A or G11A substitution might be anticipated to have minor effects on the enzyme and cell growth. I126 stabilizes R252, a residue that orients the guanidinium group with fructose-6P but that is not involved in catalysis [44]. The substitution I126A leads to a 600× increase in KM for fructose-6P, while kCAT is reduced by only 50% [44]. Remarkably, G10A, G11A, or I126A/E/S/K substitutions in our current study each resulted in growth rates only slightly greater than the ∆pfkA strain (MEC1012), over 85% lower than the strain (MEC1356) expressing the wild-type enzyme (Figure 2), demonstrating the importance of these mobile loops for activity and suggesting that the mobile loops might not be ideal targets for the mild modulation of PfkA activity.
Amino acid substitutions at other conserved sites D103 (associated with magnesium ion binding) and R72 (bridge between ATP and fructose-6P) also severely restricted the growth rate regardless of the specific substitution (Figure 2). The D103A substitution has previously been measured to lower the kCAT by 95% with no change in KM [20], and in the current study, the D103A showed an 80% lower growth rate than the wild-type strain (Figure 2). The substitution of aspartate with identically charged glutamate (D103E) or with a hydrophobic side-chain (D103V) also resulted in variants having growth rates similar to the ΔpfkA strain. Similarly, we altered the R72 residue, which stabilizes phosphoryl group transfer and interacts with the 1-phosphoryl group of the reaction product fructose-16P2, and this was selected. The R72S substitution decreases kCAT by 95%, increases the fructose-6P KM by 3×, and reduces the Hill constant by 50% [46]. However, all three R72 variants, even the similarly charged R72K substitution, showed a severe decrease in growth rate in the current study, 81–84% lower than the wild-type strain. The alteration of certain residues close to the active site results in strains that behave like a ΔpfkA knockout.
In contrast, other highly conserved residues, such as R171 and H249, appear to be more amenable to substitutions that modulate the enzyme mildly and thus might lead to a broader range of growth rate phenotypes. Previous studies have shown that the R171S substitution causes a negligible change in KM and a nearly 75% decrease in kCAT compared to the wild-type [42]. Because of this comparatively modest change in kinetic parameters, R171 was selected to test the effect of size (R171A) and polarity of the amino acid (R171K/S). Figure 5 shows PYMOL representations of these R171 substitutions and the resulting interactions. In the native enzyme, positively charged arginine interacts with the negatively charged 1-phosphate on fructose-16P2 [19] (Figure 5a), and this interaction is largely maintained in R171K (Figure 5b) but lost in R171S or R171A (Figure 5c,d). Consistent with the change in this interaction, the R171K variant showed a 51% lower growth rate than the wild-type, while R171A was 61% lower and R171S was 73% lower than the wild-type strain. The R171 residue therefore would be a preferred single site to generate a broad range of growth rate phenotypes (compared to D103, G10, G11, and R72). The H249 residue in E. coli PfkA binds with fructose-6P via a hydrogen bond between a side-chain nitrogen with a negatively charged 6-o-phosphoryl group of fructose-6P [19]. Previously, a H298A substitution in human Pfk-M that is sequentially similar to E. coli PfkA H249, increased the fructose-6P KM by a factor of 5 with a negligible change in kCAT [64], and therefore, H249 was selected as a target for modification. Although the H249A substitution decreased the growth rate by 81% compared to the wild-type, a substitution with a bulkier phenylalanine (H249F) decreased the growth rate by only 60% (Figure 2). Substituting the basic histidine with the negatively charged aspartate (H249D) resulted in a strain having a growth rate close to the ΔpfkA knockout.
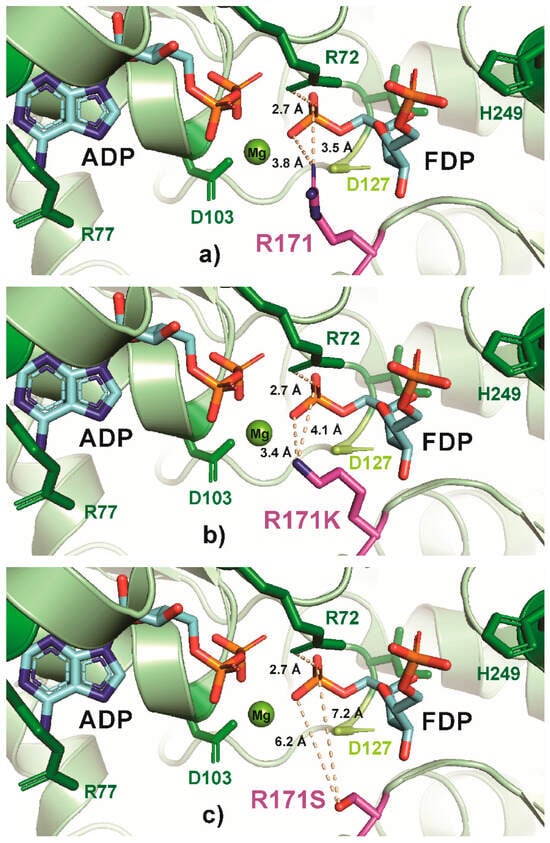
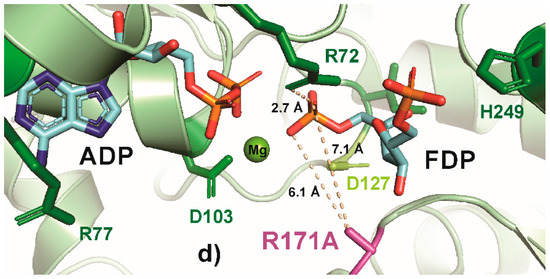
Figure 5.
PyMOL cartoon-stick representation of PfkA with a focus on residue R171 (a) and substitutions R171K (b), R171S (c) and R171A (d), and the interactions between this residue and the product fructose-16P2 (FDP). Direct interactions between the R171 residue and the substrate are shown in wheat-colored dash lines. The PfkA structure illustrated contains the products ADP and fructose-16P2.
Another conserved residue, R77, was selected for its role in the formation of an arginine crown (with R82 and R111), which interacts with the N-1 or N-6 of the adenine group on ATP [45] and is a located at the end of the hydrophobic pocket for ATP. The R77A substitution causes a 2.5× increase in the KM for ATP and a 30% reduction in kCAT compared to the wild-type [45]. In the native enzyme, the arginine provides a structural element to the pocket and interacts with adenine (Figure 6a), and this interaction is maintained in R77K (Figure 6b) but lost in R77A (Figure 6). Moreover, the substitution of alanine for arginine (R77A) leaves a gap. Surprisingly, the anticipated difference between these interactions was not reflected in the growth rate, as both R77A and R77K showed similar growth rates, only 40% lower than the wild-type; indeed, the R77A and R77K attained the highest growth rate among all the variants examined (Figure 2). Substitutions at R77 with negatively charged amino acids (R77E and R77D) were not examined, and since these substitutions increase the KM for ATP by 10–20×, they would be anticipated to lower growth rates significantly [45].
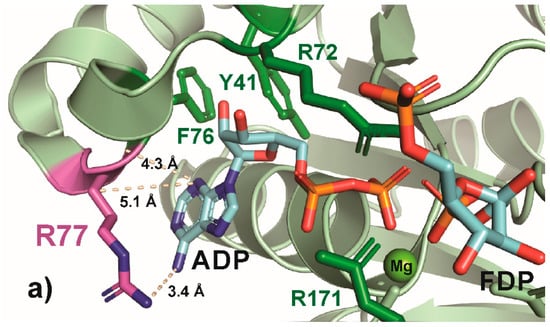
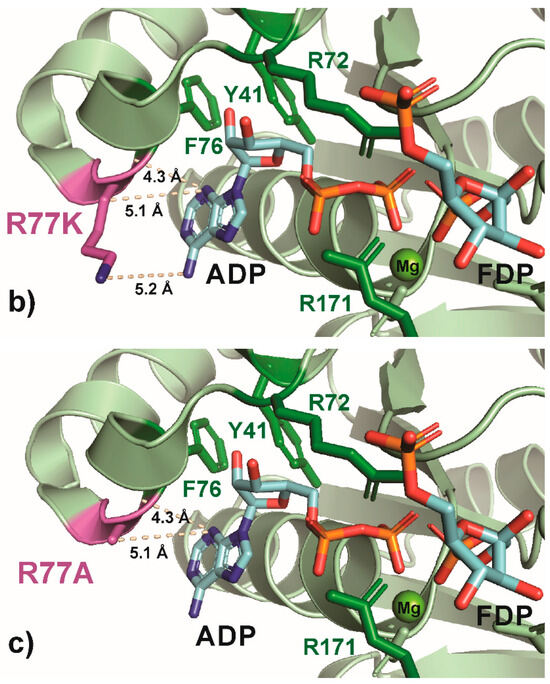
Figure 6.
PyMOL cartoon-stick representation of PfkA with a focus on residue R77 (a) and substitutions R77K (b) and R77A (c), and the interactions between this residue and the product ADP. Direct interactions between the R77 residue and the substrate are shown in wheat-colored dash lines. The PfkA structure illustrated contains the products ADP and fructose-16P2.
4.3. Substitutions in PfkA Affect Glycolytic Intermediates and Glycolytic Flux
Modifications of phosphofructokinase (PfkA) affect glycolytic flux and intracellular concentrations of glycolytic metabolites. Although the intracellular metabolite concentration is not always correlated with pathway flux [65], environmental or genetic changes in metabolism can be assessed based on key flux signaling metabolites [66]. In mouse models, increased glycolytic flux correlates with elevated levels of several intermediates, including fructose-16P2, DHAP, and GAP [50]. Fructose-16P2 is widely recognized as an important flux signaling metabolite whose intracellular concentration is linearly correlated with the glycolytic flux in numerous microbial species, including Bacillus subtilis [67], E. coli [21], and Saccharomyces cerevisiae [68]. In E. coli, fructose-16P2 has been thought to interact with the transcription factor Cra as part of a flux-sensing system reporting the glycolytic flux [21], and its inhibition of Cra [69] regulates central metabolic genes, including crr (glucose PTS system), icd (isocitrate dehydrogenase), aceA (isocitrate lyase), gapA (glyceraldehyde-3P dehydrogenase), and ppsA (PEP synthase) [70,71,72]. Recent work demonstrated that Cra does not bind to fructose-16P2 but to fructose-1P [73], raising the question of a relationship between fructose-16P2 and glycolytic flux. For E. coli growing on fructose, fructose kinase (FruK) converts fructose-1P to fructose-16P2 [74]. FruK binds to Cra and also catalyzes the reverse reaction from fructose-16P2 to fructose-1P [75]. Because of this interconversion, one can speculate that fructose-16P2 indirectly modulates the fructose-1P concentration to effect Cra. It is furthermore possible that certain substitutions, particularly at residues directly associated with ATP binding, like R77, uniquely alter the regulation and signaling of PfkA and affect this enzyme beyond a simple change in kinetic parameters. While these results suggest altered regulatory behavior, they do not yet clarify the underlying glycolytic control mechanisms, as differences between variants could also be a consequence of stress responses, redox effects, or alternative mechanisms. Intracellular measurements of fructose-1P and a deeper regulatory study of these variants could clarify these relationships.
Because fructose-16P2 is the product of PfkA, increasing the mutation severity of this enzyme would be expected to curtail the fructose-16P2 pool. Like previous studies using glucose-limited conditions [21], the current study using nitrogen-limited conditions generally demonstrated a correlation between intracellular fructose-16P2 (Figure 4) and the glucose uptake rate (Table 4). For example, under steady-state conditions, the ΔpfkA knockout maintained about a 90% lower fructose-16P2 and 30% lower glucose uptake rate than the wild-type strain (MEC1365), while PfkA variants consistently showed intermediate levels of fructose-16P2 (Figure 3). Most other studies modify glycolytic flux by altering the dilution rate under glucose-limited conditions [21,48,76,77]. However, altering the dilution rate in carbon-limited processes changes the steady-state concentration of the carbon source [78,79] and impacts the expression of a wide range of genes involved in carbon metabolism and regulation [77]. Thus, the challenge of distinguishing between glucose-uptake-related and growth-rate-related phenomena, strictly speaking, remains. In this study, glycolytic flux was altered by modifying the PfkA enzyme while holding the dilution rate at a fixed low rate of 0.10 h−1. Our results using PfkA variants therefore further demonstrate the central relationship between fructose-16P2 and glycolytic flux. The perturbation of metabolism through the construction of variants at PfkA and other key enzymatic conversions offers a new complementary strategy for studying metabolism at differing glycolytic fluxes, but at the same dilution rate. zomplete metabolic flux analysis using labeled substrates would provide additional important details for the consequences of altering the activity of PfkA [13].
The lower glycolytic reaction products of fructose-16P2 are also associated with glycolytic flux [21]. In particular, the concentrations of both fructose-16P2 and the sum of DHAP + GAP increase with the dilution rate under glucose-limited conditions from 0.1 h−1 to 0.4 h−1 [80]. The reversible products of aldolase, DHAP, and GAP are themselves interchangeable by triosephosphate isomerase (Figure 1). Analogous to fructose-16P2, we observed a direct correlation at a single dilution rate between the severity of the PfkA modification and intracellular DHAP + GAP (Figure 3). For example, the strain expressing wild-type PfkA maintained 11.3× greater DHAP + GAP than the ΔpfkA strain, while variants R77A, F76Y, and R171S exhibited 5.0–9.3 times the level of the ΔpfkA strain (Figure 3). Previous research has reported that a glucose pulse during glucose-limited conditions alters the concentration of glycolytic metabolites [29,30,80]. In this study, reduced triose and fructose-16P2 levels occurred despite the presence of glucose at the same growth rate during nitrogen-limited growth.
Modifications of PfkA also affect the expression of key genes, as measured based on the transcript. Unfortunately, the direct measurement of PfkA enzyme “activity” for the different variants is not informative because of the differing and unknown kinetic parameters. Thus, the level of the transcript was used as an indirect indicator of the enzyme level. Furthermore, the measurement of kinetic parameters of these variants (some of which have been previously determined, Table 4) does not determine the in vivo activity, which depends not only on the expression level but also on other potential introduced characteristics of the variant enzyme (allosteric binding, inhibition, etc.). It is not surprising that cells respond to a significant decrease in intrinsic PfkA activity (e.g., PfkA[R171S] and PfkA[F76Y]) by increasing the level of the PfkA transcript (Figure 4). A similar result has been observed for pyruvate dehydrogenase variants in E. coli [18]. The expression level of the PfkA[R77A] variant, on the other hand, did not differ from the wild-type PfkA, suggesting that the perturbation was insufficient for the cells to respond at the gene level. Of the other genes examined, only zwf and pta showed any changes in the level of expression with differing mutation severity. Interestingly, the expression of zwf, which controls the entry of glucose-6P into the PPP, decreased with increasing mutation severity, except for in the ΔpfkA strain. Measurements of fluxes through this and the glycolytic pathways would clarify this counterintuitive result.
4.4. Substitutions in PfkA Affect Acetate Formation
Substitutions in PfkA surprisingly resulted in transcriptional changes in the pta gene coding phosphoacetyltransferase and in acetate formation at steady-state under nitrogen-limited conditions. Wild-type E. coli is widely known to accumulate acetate when grown under carbon-excess conditions, including under nitrogen limitation [13,48,81] and iron limitation [81,82]. Acetate accumulation also occurs in E. coli during carbon-limited steady-state growth at a high glucose-uptake rate [77,83,84]. However, pta expression is not strongly influenced by the dilution rate under carbon-limited conditions in E. coli [76] and Corynebacterium glutamicum [85]. Acetate accumulation at a high glycolytic flux instead has been proposed to be influenced by the repression of acs, coding for acetyl-CoA synthetase [86], which was not measured in this study. In the current study, acetate accumulation was related to mutation severity: acetate was observed in the two strains with the highest maximum specific growth rate (R77A and wild-type PfkA), but essentially no acetate was observed in the three strains with lowest maximum specific growth rate (∆pfkA, R171S and F76Y). Furthermore, acetate formation (Table 4) correlated with higher intracellular acetyl-CoA (Figure 3) and greater transcription of the pta gene, coding for phosphotransacetylase (Figure 4). In previous studies, a Δpgi strain similarly exhibited 30% less acetyl-CoA than a wild-type strain under glucose-limited conditions [87], and metabolic flux analysis showed 64% lower acetate formation in a Δpgi strain than in wild-type E. coli under nitrogen-limited conditions [13]. As noted above from glucose-limited studies, acetate formation occurs under high glycolytic flux, and one effect of the increased mutation severity of PfkA is a reduction in glycolytic flux (Table 4). Thus, the diminished formation of acetate in strains with the greatest mutation severity could merely be a consequence of lower glycolytic flux. Since acetate formation at a high glycolytic flux has not been attributed to pta expression, the relationship between metabolism in PfkA variants and pta is less clear. The reduced expression of pta in ∆pfkA (and variant strains) and the low acetyl-CoA concentration reported here could explain the poor performance of the ∆pfkA strain in the biochemical production of mevalonate, a product of acetyl-CoA [88,89,90]. Interestingly, fructose-16P2 has been demonstrated to be involved in pta activation in B. subtilis [91].
4.5. Adenylate Charge Indicates Metabolic State
Adenine nucleotides are an indicator of cellular metabolic energy [50], and the stored energy in adenine nucleotide pools is quantified based on the adenylate energy charge (AEC) [49]. Cells growing under unrestricted batch conditions with excess nutrients show an AEC above 0.8 [49,50]. Several studies of E. coli under glucose-limited steady-state conditions report AECs of 0.72–0.85 [87,92], while a Δpgi strain maintained 50% lower ATP leading to an AEC of 0.78 [87]. In one shake flask study, a low nitrogen medium showed a similar AEC (0.9), which decreased (0.6) as nitrogen was depleted and decreased further as culture viability diminished [49]. Although pH was controlled in this study, acid stress impacts the adenylate charge and is associated with glycolytic enzymes and oxidative phosphorylation [93]. Further work using these PfkA variants in different environments would help elucidate the role of PfkA in the stress response and glycolytic regulation. Nitrogen-limited cultures of Azotobacter beijerinckii at 0.1 h−1 maintained an AEC of 0.72 [94], identical to E. coli as the culture depletes nitrogen [95]. During a phosphate-limited constant-feed fed-batch E. coli culture, the AEC decreased from 0.8 to 0.5 over 10 h, suggesting the depletion of low-energy reserves [96]. Phosphate limitation also leads to growth uncoupling, due to increased energy demand, and elevates the glucose-uptake rate [96,97]. In this work using nitrogen-limited conditions, the AEC was 0.52–0.64 in all variants (Figure 3); substitutions did not affect this value. However, the R77A variant showed an ATP/ADP ratio of 3.3, compared to ATP/ADP values of 1–2 for all other strains, similar to the 2.0 ratio observed in the nitrogen-limited growth of A. beijerinckii [94]. This observation is noteworthy because the R77A variant showed the greatest steady-state acetate formation, nearly twice that of the wild-type (Table 3), and was the only variant studied under steady-state conditions in which the substitution was associated with the ATP-binding pocket (Figure 6a). Additional research will be needed to clarify the relationship among PfkA, acetate formation, and ATP.
Having a collection of strains with a spectrum of PfkA intrinsic activities to modulate glycolytic flux provides an advantage over mere deletion of the pfkA or pgi genes. These strains provide a scalable strategy that can be readily applied with other techniques to fine tune expression further, such as the use of promoter libraries or dynamic tuning. Although our results show that the PfkA protein is very sensitive to substitution, with the majority of single-residue substitutions resulting in strains having the ΔpfkA growth rate phenotype, some variants do possess moderate changes that might be exploited for future metabolic engineering strategies.
Author Contributions
H.R. conducted the experiments, performed data analysis, and drafted the manuscript. M.A.E. and H.R. designed the experiments. M.A.E. acquired funding, prepared the final version of the manuscript, and was responsible for the overall project administration. All authors have read and agreed to the published version of the manuscript.
Funding
The authors acknowledge financial support of the U.S. National Science Foundation (CBET-1802533) and the U.S. Department of Agriculture, National Institute of Food and Agriculture (2017-06510).
Institutional Review Board Statement
Not applicable.
Informed Consent Statement
Not applicable.
Data Availability Statement
Strains and data can be obtained from the corresponding author.
Acknowledgments
The authors thank Sarah Lee and W. Chris Moxley for technical support for this project. We also thank Ellen Neidle and Chantel Duscent-Maitland for facilitating the qRT-PCR work.
Conflicts of Interest
The authors declare no conflicts of interest.
References
- Holms, W.H. The central metabolic pathways of Escherichia coli: Relationship between flux and control at a branch point, efficiency of conversion to biomass and excretion of acetate. Curr. Top. Cell. Regul. 1986, 28, 69–105. [Google Scholar] [CrossRef]
- Siedler, S.; Bringer, S.; Bott, M. Increased NADPH availability in Escherichia coli: Improvement of the product per glucose ratio in reductive whole-cell biotransformation. Appl. Microbiol. Biotechnol. 2011, 92, 929–937. [Google Scholar] [CrossRef] [PubMed]
- Reynolds, T.S.; Courtney, C.M.; Erickson, K.E.; Wolfe, L.M.; Chatterjee, A.; Nagpal, P.; Gill, R.T. ROS mediated selection for increased NADPH availability in Escherichia coli. Biotechnol. Bioeng. 2017, 114, 2685–2689. [Google Scholar] [CrossRef] [PubMed]
- Alper, H.; Miyakou, K.; Stephanopolous, G. Construction of lycopene-overproducing E. coli strains by combining systematic and combinatorial gene knockout targets. Nat. Biotechnol. 2005, 23, 612–616. [Google Scholar] [CrossRef]
- Zhu, S.; Cai, D.; Liu, Z.; Zhang, B.; Li, J.; Chen, S.; Ma, X. Enhancement of bacitracin production by NADPH generation via overexpressing glucose-6-phosphate dehydrogenase Zwf in Bacillus licheniformis. Appl. Biochem. Biotechnol. 2019, 187, 1502–1514. [Google Scholar] [CrossRef]
- Shi, A.; Zhu, X.; Lu, J.; Zhang, X.; Ma, Y. Activating transhydrogenase and NAD kinase in combination for improving isobutanol production. Metabol. Eng. 2013, 16, 1–10. [Google Scholar] [CrossRef]
- Sauer, U.; Canonaco, F.; Heri, S.; Perrenoud, A.; Fischer, E. The soluble and membrane-bound transhydrogenases UdhA and PntAB have divergent functions in NADPH metabolism of Escherichia coli. J. Biol. Chem. 2004, 279, 6613–6619. [Google Scholar] [CrossRef]
- Matsuoka, Y.; Kurata, H. Computer-aided rational design of efficient NADPH production system by Escherichia coli pgi mutant using a mixture of glucose and xylose. Front. Bioeng. Biotechnol. 2020, 8, 227. [Google Scholar] [CrossRef]
- Lim, S.-J.; Jung, Y.-M.; Shin, H.-D.; Lee, Y.-H. Amplification of the NADPH-related genes zwf and gnd for the oddball biosynthesis of PHD in an E. coli transformant harboring a cloned phbCAB operon. J. Biosci. Bioeng. 2002, 93, 543–549. [Google Scholar] [CrossRef]
- Lin, Z.; Xu, Z.; Li, Y.; Wang, Z.; Chen, T.; Zhao, X. Metabolic engineering of Escherichia coli for the production of riboflavin. Microb. Cell Fact. 2014, 13, 104. [Google Scholar] [CrossRef] [PubMed]
- Perez-Zabaleta, M.; Sjöberg, G.; Guevara-Martínez, M.; Jarmander, J.; Gustavsson, M.; Quillaguamán, J.; Larsson, G. Increasing the production of (R)-3-hydroxybutyrate in recombinant Escherichia coli by improved cofactor supply. Microb. Cell Fact. 2016, 15, 91. [Google Scholar] [CrossRef] [PubMed]
- Nicolas, C.; Kiefer, P.; Letisse, F.; Krömer, J.; Massou, S.; Soucaille, P.; Wittmann, C.; Lindley, N.D.; Portais, J.C. Response of the central metabolism of Escherichia coli to modified expression of the gene encoding the glucose-6-phosphate dehydrogenase. FEBS Lett. 2007, 581, 3771–3777. [Google Scholar] [CrossRef]
- Hua, Q.; Yang, C.; Baba, T.; Mori, H.; Shimizu, K. Responses of the central metabolism in Escherichia coli to phosphoglucose isomerase and glucose-6-phosphate dehydrogenase knockouts. J. Bacteriol. 2003, 185, 7053–7067. [Google Scholar] [CrossRef]
- Siedler, S.; Bringer, S.; Blank, L.M.; Bott, M. Engineering yield and rate of reductive biotransformation in Escherichia coli by partial cyclization of the pentose phosphate pathway and PTS-independent glucose transport. Appl. Microbiol. Biotechnol. 2012, 93, 1459–1467. [Google Scholar] [CrossRef] [PubMed]
- Hollinshead, W.D.; Rodriguez, S.; Martin, H.G.; Wang, G.; Baidoo, E.E.K.; Sale, K.L.; Keasling, J.D.; Mukhopadhyay, A.; Tang, Y.J. Examining Escherichia coli glycolytic pathways, catabolite repression, and metabolite channeling using Δpfk mutants. Biotechnol. Biofuels 2016, 9, 212. [Google Scholar] [CrossRef]
- Brockman, I.M.; Prather, K.L.J. Dynamic knockdown of E. coli central metabolism for redirecting fluxes of primary metabolites. Metabol. Eng. 2015, 28, 104–113. [Google Scholar] [CrossRef]
- Tovilla-Coutiño, D.B.; Momany, C.; Eiteman, M.A. Engineered citrate synthase alters acetate accumulation in Escherichia coli. Metabol. Eng. 2020, 61, 171–180. [Google Scholar] [CrossRef]
- Moxley, W.C.; Eiteman, M.A. Pyruvate production by Escherichia coli by use of pyruvate dehydrogenase variants. Appl. Environ. Microbiol. 2021, 87, e00487-21. [Google Scholar] [CrossRef] [PubMed]
- Shirakihara, Y.; Evans, P.R. Crystal structure of the complex of phosphofructokinase from Escherichia coli with its reaction products. J. Mol. Biol. 1988, 204, 973–994. [Google Scholar] [CrossRef]
- Berger, S.A.; Evans, P.R. Site-directed mutagenesis identifies catalytic residue in the active site of Escherichia coli phosphofructokinase. Biochemistry 1992, 31, 9237–9242. [Google Scholar] [CrossRef]
- Kochanowski, K.; Volkmer, B.; Gerosa, L.; Haverkorn van Rijsewijk, B.R.; Schmidt, A.; Heinemann, M. Functioning of a metabolic flux sensor in Escherichia coli. Proc. Natl. Acad. Sci. USA 2013, 110, 1130–1135. [Google Scholar] [CrossRef] [PubMed]
- Lehning, C.E.; Siedler, S.; Ellabaan, M.M.H.; Sommer, M.O.A. Assessing glycolytic flux alterations resulting from genetic perturbations in E. coli using a biosensor. Metabol. Eng. 2017, 42, 194–202. [Google Scholar] [CrossRef]
- Koberstein, J.N.; Stewart, M.L.; Smith, C.B.; Tarasov, A.I.; Ashcroft, F.M.; Stork, P.J.S.; Goodman, R.H. Monitoring glycolytic dynamics in single cells using a fluorescent biosensor for fructose 1,6-bisphosphate. Proc. Natl. Acad. Sci. USA 2022, 119, e2204407119. [Google Scholar] [CrossRef]
- Datsenko, K.A.; Wanner, B.L. One-step inactivation of chromosomal genes in Escherichia coli K-12 using PCR products. Proc. Natl. Acad. Sci. USA 2000, 97, 6640–6645. [Google Scholar] [CrossRef]
- Cherepanov, P.P.; Wackernagel, W. Gene disruption in Escherichia coli: TcR and KmR cassettes with the option of Flp-catalyzed excision of the antibiotic-resistance determinant. Gene 1995, 158, 9–14. [Google Scholar] [CrossRef]
- Yang, J.; Sun, B.; Huang, H.; Jiang, Y.; Diao, L.; Chen, B.; Xu, C.; Wang, X.; Liu, J.; Jiang, W. High-efficiency scarless genetic modification in Escherichia coli by using lambda red recombination and I-SceI cleavage. Appl. Environ. Microbiol. 2014, 80, 3826–3834. [Google Scholar] [CrossRef] [PubMed]
- Kostylev, M.; Otwell, A.E.; Richardson, R.E.; Suzuki, Y. Cloning should be simple: Escherichia coli DH5a- mediated assembly of multiple DNA fragments with short end homologies. PLoS ONE 2015, 10, e0137466. [Google Scholar] [CrossRef]
- Livak, K.J.; Schmittgen, T.D. Analysis of relative gene expression data using real-time quantitative PCR and the 2−ΔΔCT method. Methods 2001, 25, 402–408. [Google Scholar] [CrossRef]
- Hoque, M.A.; Ushiyama, H.; Tomita, M.; Shimizu, K. Dynamic responses of the intracellular metabolite concentrations of the wild type and pykA mutant Escherichia coli against pulse addition of glucose or NH3 under those limiting continuous cultures. Biochem. Eng. J. 2005, 26, 38–49. [Google Scholar] [CrossRef]
- Faijes, M.; Mars, A.E.; Smid, E.J. Comparison of quenching and extraction methodologies for metabolome analysis of Lactobacillus plantarum. Microb. Cell. Fact. 2007, 6, 27. [Google Scholar] [CrossRef] [PubMed]
- Schaefer, U.; Boos, W.; Takors, R.; Weuster-Botz, D. Automated sampling device for monitoring intracellular metabolite dynamics. Anal. Biochem. 1999, 270, 88–96. [Google Scholar] [CrossRef]
- de Koning, W.; van Dam, K. A method for the determination of changes of glycolytic metabolites in yeast on a subsecond time scale using extraction at neutral pH. Anal. Biochem. 1992, 204, 118–123. [Google Scholar] [CrossRef] [PubMed]
- Lilius, E.-M.; Multanen, V.-M.; Toivenen, V. Quantitative extraction and estimation of intracellular nicotinamide nucleotide of Escherichia coli. Anal. Biochem. 1979, 99, 22–27. [Google Scholar] [CrossRef]
- Lowry, O.H.; Passonneau, J.V.; Rock, M.K. The stability of pyridine nucleotides. J. Biol. Chem. 1961, 236, 2756–2759. [Google Scholar] [CrossRef] [PubMed]
- Beri, D.; Olson, D.G.; Holwerda, E.K.; Lynd, L.R. Nicotinamide cofactor ratios in engineered strains of Clostridium thermocellum and Thermoanaerobacterium saccharolyticum. FEMS Microbiol. Lett. 2016, 363, fnw091. [Google Scholar] [CrossRef] [PubMed]
- Lang, G.; Michal, G. Methods for determination of metabolites (Carbohydrate metabolites: D-glucose-6-phosphate and D-fructose-6-phosphate). In Methods of Enzymatic Analysis, 2nd ed.; Bergmeyer, H.-U., Ed.; Verlag Chemie Academic Press: Weinheim, Germany, 1974; Volume 3, pp. 1238–1242. [Google Scholar]
- Trautschold, I.; Lamprecht, W.; Schweitzer, G. UV-method with hexokinase and glucose-6P dehydrogenase. In Methods of Enzymatic Analysis, 3rd ed.; Bergmeyer, H.-U., Ed.; Verlag Chemie Academic Press: Weinheim, Germany, 1985; Volume 7, pp. 342–350. [Google Scholar]
- Michal, G.; Beutler, H.-O. D-fructose-1,6-diphosphate, dihydroxyacetone phosphate and D-glyceraldehyde-3-6-phosphate. In Methods of Enzymatic Analysis; Bergmeyer, H.-U., Ed.; Verlag Chemie Academic Press: Weinheim, Germany, 1974; Volume 3, pp. 1315–1319. [Google Scholar]
- Jaworek, D.; Welsch, J. Adenosine 5′-diphosphate and adenosine 5′-monophosphate: UV-method. In Methods of Enzymatic Analysis, 3rd ed.; Bergmeyer, H.-U., Ed.; Verlag Chemie Academic Press: Weinheim, Germany, 1985; Volume 7, pp. 365–370. [Google Scholar]
- Decker, K. Acetyl Coenzyme A: UV-method. In Methods of Enzymatic Analysis, 2nd ed.; Bergmeyer, H.-U., Ed.; Verlag Chemie Academic Press: Weinheim, Germany, 1974; Volume 4, pp. 1988–1993. [Google Scholar]
- Eiteman, M.A.; Chastain, M.J. Optimization of the ion-exchange analysis of organic acids from fermentation. Anal. Chim. Acta 1997, 338, 69–75. [Google Scholar] [CrossRef]
- Hellinga, H.W.; Evans, P.R. Mutations in the active site of Escherichia coli phosphofructokinase. Nature 1987, 327, 437–439. [Google Scholar] [CrossRef]
- Zheng, R.-L.; Kemp, R.G. Identification of interactions that stabilize the transition state in Escherichia coli phosphofructo-1-kinase. J. Biol. Chem. 1994, 269, 18475–18479. [Google Scholar] [CrossRef]
- Zheng, R.-L.; Kemp, R.G. The mechanism of ATP inhibition of wild type and mutant phosphofructo-1-kinase from Escherichia coli. J. Biol. Chem. 1992, 267, 23640–23645. [Google Scholar] [CrossRef]
- Wang, X.; Kemp, R.G. Identification of residues of Escherichia coli phosphofructokinase that contribute to nucleotide binding and specificity. Biochemistry 1999, 38, 4313–4318. [Google Scholar] [CrossRef]
- Berger, S.A.; Evans, P.R. Active-site mutants altering the cooperativity of E. coli phosphofructokinase. Nature 1990, 343, 575–576. [Google Scholar] [CrossRef]
- Paalme, T.; Elken, R.; Kahru, A.; Vanatulu, K.; Vilu, R. The growth rate control in Escherichia coli at near to maximum growth rates: The A-stat approach. Ant. Van Leeuwen. 1997, 71, 217–230. [Google Scholar] [CrossRef]
- Hua, Q.; Yang, C.; Oshima, T.; Mori, H.; Shimizu, K. Analysis of gene expression in Escherichia coli in response to changes of growth-limiting nutrient in chemostat cultures. Appl. Environ. Microbiol. 2004, 70, 2354–2366. [Google Scholar] [CrossRef]
- Chapman, A.G.; Fall, L.; Atkinson, D.E. Adenylate energy charge in Escherichia coli during growth and starvation. J. Bacteriol. 1971, 108, 1072–1086. [Google Scholar] [CrossRef]
- Passonneau, J.V.; Lowry, O.H. The role of phosphofructokinase in metabolic regulation. Adv. Enzym. Regul. 1964, 2, 265–274. [Google Scholar] [CrossRef]
- Zhao, J.; Baba, T.; Mori, H.; Shimizu, K. Effect of zwf knockout on the metabolism of Escherichia coli grown on glucose or acetate. Metabol. Eng. 2004, 6, 164–174. [Google Scholar] [CrossRef] [PubMed]
- Swedes, J.S.; Sedo, R.J.; Atkinson, D.E. Relation of growth and protein synthesis to the adenylate energy charge in an adenine-requiring mutant of Escherichia coli. J. Biol. Chem. 1975, 250, 6930–6938. [Google Scholar] [CrossRef] [PubMed]
- Blangy, D.; Buc, H.; Monod, J. Kinetics of the allosteric interactions of phosphofructokinase from Escherichia coli. J. Mol. Biol. 1968, 31, 13–35. [Google Scholar] [CrossRef]
- Atkinson, D.E.; Walton, G.M. Kinetics of regulatory enzymes: Escherichia coli phosphofructokinase. J. Biol. Chem. 1965, 240, 757–763. [Google Scholar] [CrossRef]
- Robinson, J.P.; Fraenkel, D.G. Allosteric and non-allosteric E. coli phosphofructokinases: Effects on growth. Biochem. Biophys. Res. Comm. 1978, 81, 858–863. [Google Scholar] [CrossRef]
- Kotlarz, D.; Buc, H. Two Escherichia coli fructose-6-phosphate kinases. Preparative purification, oligomeric structure and immunological studies. Biochim. Biophys. Acta 1977, 484, 35–48. [Google Scholar] [CrossRef]
- Babul, J. Phosphofructokinases from Escherichia coli. Purification and characterization of the nonallosteric isozyme. J. Biol. Chem. 1978, 253, 4350–4355. [Google Scholar] [CrossRef]
- Emmerling, M.; Bailey, J.E.; Sauer, U. Glucose catabolism of Escherichia coli strains with increased activity and altered regulation of key glycolytic enzymes. Metabol. Eng. 1999, 1, 117–127. [Google Scholar] [CrossRef]
- Mlakar, T.; Legiša, M. Citrate inhibition-resistant form of 6-phosphofructo-1-kinase from Aspergillus niger. Appl. Environ. Microbiol. 2006, 72, 4515–4521. [Google Scholar] [CrossRef]
- Capuder, M.; Šolar, T.; Benčina, M.; Legiša, M. Highly active, citrate inhibition resistant form of Aspergillus niger 6-phosphofructo-1-kinase encoded by a modified pfkA gene. J. Biotechnol. 2009, 144, 51–57. [Google Scholar] [CrossRef]
- Wu, L.-F.; Reizer, A.; Reizer, J.; Cai, B.; Tomich, J.M.; Saier, M.H., Jr. Nucleotide sequence of the Rhodobacter capsulatus fruK gene, which encodes fructose-1-phosphate kinase: Evidence for a kinase superfamily including both phosphofructokinases of Escherichia coli. J. Bacteriol. 1991, 173, 3117–3127. [Google Scholar] [CrossRef]
- Ronimus, R.S.; Morgan, H.W. The biochemical properties and phylogenies of phosphofructokinases from extremophiles. Extremophiles 2001, 5, 357–373. [Google Scholar] [CrossRef]
- Kemp, R.G.; Gunasekera, D. Evolution of the allosteric ligand sites of mammalian phosphofructo-1-kinase. Biochemistry 2002, 41, 9426–9430. [Google Scholar] [CrossRef]
- Ferreras, C.; Hernández, E.D.; Martínez-Costa, O.H.; Aragón, J.J. Subunit interactions and composition of the fructose 6-phosphate catalytic site and the fructose 2,6-bisphosphate allosteric site of mammalian phosphofructokinase. J. Biol. Chem. 2009, 284, 9124–9131. [Google Scholar] [CrossRef]
- Hackett, S.R.; Zanotelli, V.R.T.; Xu, W.; Goya, J.; Park, J.O.; Perlman, D.H.; Gibney, P.A.; Botstein, D.; Stoery, J.D.; Rabinowitz, J.D. Systems-level analysis of mechanisms regulating yeast metabolic flux. Science 2016, 354, 432. [Google Scholar] [CrossRef]
- Litsios, A.; Ortega, Á.D.; Wit, E.C.; Heinemann, M. Metabolic-flux dependent regulation of microbial physiology. Curr. Opin. Microbiol. 2018, 42, 71–78. [Google Scholar] [CrossRef] [PubMed]
- Chubukov, V.; Uhr, M.; Le Chat, L.; Kleijen, R.J.; Jules, M.; Link, H.; Aymerich, S.; Stelling, J.; Sauer, U. Transcriptional regulation is insufficient to explain substrate-induced flux changes in Bacillus subtilis. Mol. Syst. Biol. 2013, 9, 709. [Google Scholar] [CrossRef]
- Przybylski, F.; Otto, A.; Nissler, K.; Schellenberger, W.; Hofmann, E. Effects of fructose 1,6-bisphosphate on the activation of yeast phosphofructokinase by fructose 2,6-bisphosphate and AMP. Biochim. Biophys. Acta 1985, 831, 350–352. [Google Scholar] [CrossRef]
- Ramseier, T.M.; Nègre, D.; Cortay, J.-C.; Scarabel, M.; Cozzone, A.J.; Saier, M.H., Jr. In vitro binding of the pleiotrophic transcriptional regulatory protein, FruR, to the fru, pps, ace, pts and icd operons of Escherichia coli and Salmonella typhimurium. J. Mol. Biol. 1993, 234, 28–44. [Google Scholar] [CrossRef]
- Ramseier, T.M. Cra and the control of carbon flux via metabolic pathways. Res. Microbiol. 1996, 147, 489–493. [Google Scholar] [CrossRef]
- Shimada, T.; Yamamoto, K.; Ishihama, A. Novel members of the Cra regulon involved in carbon metabolism in Escherichia coli. J. Bacteriol. 2011, 193, 649–659. [Google Scholar] [CrossRef]
- Shimada, T.; Fujita, N.; Maeda, M.; Ishihama, A. Systematic search for the Cra-binding promoters using genomic SELEX system. Genes Cells 2005, 10, 907–918. [Google Scholar] [CrossRef]
- Folly, B.B.; Ortega, A.D.; Hubmann, G.; Bonsing-Vedelaar, S.; Wijma, H.J.; van der Meulen, P.; Milias-Argeitis, A.; Heinemann, M. Assessment of the interaction between the flux-signaling metabolite fructose-1,6-bisphosphate and the bacterial transcription factors CggR and Cra. Mol. Microbiol. 2018, 109, 278–290. [Google Scholar] [CrossRef]
- Ferenci, T.; Kornberg, H.L. Pathway of fructose utilization by Escherichia coli. FEBS Lett. 1971, 13, 127–130. [Google Scholar] [CrossRef]
- Weeranmange, C.; Menjivar, C.; O’Neil, P.T.; El Qaidi, S.; Harrison, K.S.; Meinhardt, S.; Bird, C.L.; Sreenivasan, S.; Hardwidge, P.R.; Fenton, A.W.; et al. Fructose-1-kinase has pleiotropic roles in Escherichia coli. Biol. Chem. 2024, 200, 107352. [Google Scholar] [CrossRef]
- Nanchen, A.; Schicker, A.; Sauer, U. Nonlinear dependency of intracellular fluxes on growth rate in miniaturized continuous cultures of Escherichia coli. Appl. Environ. Microbiol. 2006, 72, 1164–1172. [Google Scholar] [CrossRef]
- Vemuri, G.N.; Altman, E.; Sangurdekar, D.P.; Khodursky, A.B.; Eiteman, M.A. Overflow metabolism in Escherichia coli during steady-state growth: Transcriptional regulation and effect of the redox ratio. Appl. Environ. Microbiol. 2006, 72, 3653–3661. [Google Scholar] [CrossRef]
- de Vries, W.; Kapteijn, W.M.C.; van der Beek, E.G.; Stouthamer, A.H. Molar growth yields and fermentation balances of Lactobacillus casei L3 in batch cultures and in continuous cultures. J. Gen. Microbiol. 1970, 63, 333–345. [Google Scholar] [CrossRef]
- Harder, W.; Dijkhuizen, L. Physiological responses to nutrient limitation. Ann. Rev. Microbiol. 1983, 37, 1–23. [Google Scholar] [CrossRef]
- Schaub, J.; Reuss, M. In vivo dynamics of glycolysis in Escherichia coli shows need for growth-rate dependent metabolome analysis. Biotechnol. Prog. 2008, 24, 1402–1407. [Google Scholar] [CrossRef]
- Folsom, J.P.; Carlson, R.P. Physiological, biomass elemental composition and proteomic analyses of Escherichia coli ammonium-limited chemostat growth, and comparison with iron- and glucose-limited chemostat growth. Microbiology 2015, 161, 1659–1670. [Google Scholar] [CrossRef]
- Baez, A.; Sharma, A.K.; Bryukhanov, A.; Anderson, E.D.; Rudack, L.; Olivares-Hernández, R.; Quan, D.; Shiloach, J. Iron availability enhances the cellular energetics of aerobic Escherichia coli cultures while upregulating anaerobic respiratory chains. New Biotechnol. 2022, 71, 11–20. [Google Scholar] [CrossRef]
- Valgepea, K.; Adamberg, K.; Vilu, R. Decrease of energy spilling in Escherichia coli continuous cultures with rising specific growth rate and carbon wasting. BMC Syst. Biol. 2011, 5, 106. [Google Scholar] [CrossRef]
- Kayser, A.; Weber, J.; Hecht, V.; Rinas, U. Metabolic flux analysis of Escherichia coli in glucose-limited continuous cultures. I. Growth-rate-dependent metabolic efficiency at steady state. Microbiology 2005, 151, 693–706. [Google Scholar] [CrossRef]
- Graf, M.; Haas, T.; Teleki, A.; Feith, A.; Cerff, M.; Wiechert, W.; Nöh, K.; Busche, T.; Kalinowski, J.; Takors, R. Revisiting the growth modulon of Corynebacterium glutamicum under glucose limited chemostat conditions. Front. Bioeng. Biotechnol. 2020, 8, 584614. [Google Scholar] [CrossRef] [PubMed]
- Valgepea, K.; Adamberg, K.; Nahku, R.; Lahtvee, P.-J.; Arike, L.; Vilu, R. Systems biology approach reveals that overflow metabolism of acetate in Escherichia coli is triggered by carbon catabolite repression of acetyl-CoA synthetase. BMC Syst. Biol. 2010, 4, 166. [Google Scholar] [CrossRef] [PubMed]
- Hoque, M.A.; Fard, A.T.; Rahman, M.; Alattas, O.; Akazawa, K.; Merican, A.M. Comparison of dynamic responses of cellular metabolites in Escherichia coli to pulse addition of substrates. Biologia 2011, 66, 954–966. [Google Scholar] [CrossRef]
- Satowa, D.; Fujiwara, R.; Uchio, S.; Nakano, M.; Otomo, C.; Hirata, Y.; Matsumoto, T.; Noda, S.; Tanaka, T.; Kondo, A. Metabolic engineering of E. coli for improving mevalonate production to promote NADPH regeneration and enhance acetyl-CoA supply. Biotechnol. Bioeng. 2020, 117, 2153–2164. [Google Scholar] [CrossRef] [PubMed]
- Wang, Y.; Zhou, S.; Li, R.; Liu, Q.; Shao, X.; Zhu, L.; Kang, M.-K.; Wei, G.; Kim, S.-W.; Wang, C. Reassessing acetyl-CoA supply and NADPH availability for mevalonate biosynthesis from glycerol in Escherichia coli. Biotechnol. Bioeng. 2022, 119, 2868–2877. [Google Scholar] [CrossRef]
- Dodelin, J.K.; Rose, A.E.; Rajpurohit, H.; Eiteman, M.A. Increased mevalonate production using engineering citrate synthase and phosphofructokinase variants of Escherichia coli. Biotechnol. Bioeng. 2025, 122, 548–560. [Google Scholar] [CrossRef]
- Presecan-Siedel, E.; Galinier, A.; Longin, R.; Deutscher, J.; Danchin, A.; Glaser, P.; Martin-Verstraete, I. Catabolite regulation of the pta as a part of carbon flow pathways in Bacillus subtilis. J. Bacteriol. 1999, 181, 6889–6897. [Google Scholar] [CrossRef]
- Kahru, A.; Paalme, T.; Vilu, R. Effect of temperature on the ATP pool and adenylate energy charge in Escherichia coli. FEMS Microbiol. Lett. 1987, 41, 305–308. [Google Scholar] [CrossRef]
- Zhang, W.; Chen, X.; Sun, W.; Nie, Y.; Quanquin, N.; Sun, Y. Escherichia coli increases its ATP concentration in weakly acidic environments principally through the glycolytic pathway. Genes 2020, 11, 991. [Google Scholar] [CrossRef]
- Marriott, I.D.; Dawes, E.A.; Rowley, B.I. Effect of growth rate and nutrient limitation on the adenine nucleotide content, energy charge and enzymes of adenylate metabolism in Azotobacter beijerinckii. J. Gen. Microbiol. 1981, 125, 375–382. [Google Scholar] [CrossRef][Green Version]
- Dietzler, D.N.; Lais, C.J.; Leckie, M.P. Simultaneous increases of the adenylate energy charge and the rate of glycogen synthesis in nitrogen-starved Escherichia coli W4597(K). Arch. Biochem. Biophys. 1974, 160, 14–25. [Google Scholar] [CrossRef] [PubMed]
- Schuhmacher, T.; Löffler, M.; Hurler, T.; Takors, R. Phosphate limited fed-batch processes: Impact on carbon usage and energy metabolism in Escherichia coli. J. Biotechnol. 2014, 190, 96–104. [Google Scholar] [CrossRef] [PubMed]
- Rajpurohit, H.; Eiteman, M.A. Nutrient-limited operational strategies for the microbial production of biochemicals. Microorganisms 2022, 10, 2226. [Google Scholar] [CrossRef] [PubMed]


Disclaimer/Publisher’s Note: The statements, opinions and data contained in all publications are solely those of the individual author(s) and contributor(s) and not of MDPI and/or the editor(s). MDPI and/or the editor(s) disclaim responsibility for any injury to people or property resulting from any ideas, methods, instructions or products referred to in the content. |
© 2026 by the authors. Licensee MDPI, Basel, Switzerland. This article is an open access article distributed under the terms and conditions of the Creative Commons Attribution (CC BY) license.