1. Introduction
Due to the current development and expansion in the availability of high-throughput sequencing technologies, microbial ecology has experienced a huge increase in its use for the characterization of the diversity of microbial communities in different environments [
1,
2]. In soil, it is known that pH is the main factor modulating the composition of bacterial communities [
3,
4,
5,
6]. However, other factors, such as oxygen, moisture, nutrient content, texture and aboveground plant species, also influence these communities [
7,
8]. One main problem when studying natural systems that vary in several factors simultaneously is that it is hard to disentangle the effects of a single variable of interest. For example, in Rath and colleagues’ (2019) work [
4], while studying two transects encompassing a salinity gradient near a lake, they found that one area also co-varied in pH, which overshadowed the effects of salinity on microbial composition and trait distribution, causing ambiguity regarding the effects of salinity in this transect.
In soil, the rhizosphere, a region that surrounds and is influenced by the roots, is a hotspot of activity and abundance [
9,
10]. In this region, plants benefit microorganisms with the exudation of molecules, while microorganisms interact positively with plants by facilitating resource acquisition, modulating or producing phytohormones or antagonizing pathogens. While we have much information regarding the impact of pH selection on soil bacterial communities, fewer studies have addressed pH-induced changes in the rhizosphere, and some have done so but without control of confounding factors [
11,
12]. In these studies, acidification [
11] or alkalinization [
12] of soils majorly contributed to modifications in the microbial composition and abundance in the rhizosphere. Understanding how different factors change microbial communities associated with plants is an important step towards successful microbiome manipulation, aiming to increase crop yield, especially in alkaline or acidic pH ranges [
10,
13].
In the context of agricultural practices, understanding the interaction between crops and their associated microbiomes is crucial for optimizing productivity. Common bean (
Phaseolus vulgaris L.) and maize (
Zea Mays L.) are two major crops cultivated in Brazil. The annual production of common dry beans in Brazil is approximately 2.8 million tons, contributing around 10% to global production and placing Brazil as the second-highest-producing country. For maize, Brazil’s annual production is around 109 million tons, representing about 9.4% of the world’s total maize production, ranking Brazil third in global production [
14]. These crops are not only important for Brazil’s economy and dietary needs but also play a significant role in global agriculture. As global food security faces threats from growing populations and climate change [
15], more studies need to focus on leveraging crop–microbiome interactions, aiming to enhance crop resilience against environmental stressors and phytopathogens and to improve nutrient uptake. By focusing on key crops such as beans and maize, advancements could lead to knowledge that is transferable to other plants or conditions, thereby having a cascading positive effect for global food security.
To address pH effects in the rhizospheric microbiome in isolation from different physicochemical characteristics, an acidic soil pH was modulated to four different ranges (4.7, 5.4, 7.5 and 8.2, as most bacterial diversity in soils varies within this range), while also correcting for fertility differences among them. Then, we planted two crops with distinct metabolisms (maize and bean, with C4 and C3 metabolisms, respectively) for 90 days, and subsequently, we assessed plant growth parameters and soil physicochemical characteristics and explored the rhizosphere bacteriome structure with 16S rRNA gene sequencing. The hypotheses were that (i) pH and plant species would affect the rhizospheric bacteriome, but with different strengths; (ii) rhizospheric communities would form a gradient of dissimilarity from the lower to the higher pH; and (iii) pH would consistently enrich and deplete specific taxa in the rhizosphere regardless of plant species.
2. Materials and Methods
2.1. Soil Collection, pH Curves’ Construction and Soil Fertility Correction
In order to modulate the pH of the soil to desirable ranges, an acidic soil (0–15 cm) was collected from the Embrapa Agrobiology field (22°45′26.36″ S, 43°40′22.29″ W, Seropédica, Rio de Janeiro, Brazil). This soil was classified as a Planosol, according to the World Reference Base (WRB) classification by the Food and Agriculture Organization of the United Nations (FAO) [
16], and had a starting pH of 4.7 in 1:2.5 KCl 1 N. Additional physicochemical characteristics are summarized in
Table 1. The collected soil was then air-dried, sieved through a 2 mm sieve, homogenized, and had its field capacity determined according to a previously established method [
17].
To achieve the desired pH ranges, a curve with different doses of CaCO3 (0 mg, 37 mg, 110 mg, 438 mg, and 657 mg) in 200 g of soil was constructed, which was conditioned in 600 mL containers and maintained at 70% of field capacity. pH was measured daily for two weeks, until stability was achieved. After two weeks, a pH per CaCO3 response curve was constructed, guiding modulation in pots’ mesocosms. Following the curve construction, soil was divided into four portions, and four pH ranges were established: 4.7 (no CaCO3 addition), 5.4 (0.2187 g of CaCO3 per Kg of soil), 7.5 (1.2407 g of CaCO3 per Kg of soil) and 8.2 (3.978 g of CaCO3 per Kg of soil).
Fertility corrections were performed by adding (in g per Kg of soil) 0.34 of potassium phosphate (K
3PO
4), 0.16 of sodium phosphate (Na
3PO
4), 0.626 of urea (CH
4N
2O) and 0.8 g of micronutrient mixture, according to Freire [
18]. In addition, magnesium oxide (MgO) was added in different concentrations according to the amount of CaCO
3 added (0, 0.25, 1.375 and 4.625, respectively, for the pH ranges of 4.7, 5.4, 7.5 and 8.2).
After application of amendments, 32 pots of 6L each were filled with 4 Kg of soil and maintained at around 70% field capacity for one month, to stabilize pH and nutrients.
2.2. Greenhouse Experiment and Sample Collection
After stability was achieved, each pot received 4 seeds of either maize (Zea mays) or bean (Phaseolus vulgaris), not previously tested for germination. A total of 32 pots were created, with 4 replicates per treatment. After germination, the two most developed seedlings were maintained in each pot. The greenhouse experiment was performed at the Federal University of Rio de Janeiro (UFRJ), Brazil (22°50′25.6″ S, 43°14′03.1″ W), and lasted 90 days.
At the end of the experiment, the plants were separated into roots and aerial parts, dried in an oven at 50 °C for 72 h, and weighed to determine the biomass. Rhizosphere soil (approximately 50 g) was collected into sterile plastic bags by gently tapping the roots after removing non-firmly attached soil by shaking. Rhizosphere samples were stored at −20 °C until DNA extraction, while plant roots were washed with tap water and placed in paper bags. The remaining soil was collected for physicochemical characterization. Soil fertility and final pH were characterized following the procedures described by Teixeira and colleagues [
19]. Briefly, pH was determined through a 1:2.5 soil-to-KCl solution, and read by a potentiometer. Ca
2+, Mg
2+ and Al
3+ were extracted using 1 M KCl and measured by atomic absorption spectrophotometry (Ca
2+ and Mg
2+) and titration with NaOH solution (Al
3+). For P, K
+ and Na
+, the Mehlich-1 extraction method was used, followed by flame spectrophotometry. Organic carbon (C
org) was determined through the Walkley–Black wet oxidation method, while N was quantified through the Kjeldahl method.
2.3. DNA Extraction, 16S rRNA Gene Sequencing and Bioinformatic Analysis
About 500 mg of each rhizospheric soil was sorted for DNA extraction using a FastDNA Spin Kit for Soil (MP Biomedicals, Santa Ana, CA, USA), according to the manufacturer’s guidelines. Extracted DNA was quantified with a Qubit fluorometer (Thermo Fisher Scientific, Waltham, MA, USA) and had its quality assessed with a NanoDrop 1000 (Thermo Fisher Scientific, Waltham, MA, USA). DNA samples were subjected to sequencing of the V4 region of the 16S rRNA gene, using primers 515F (GTGYCAGCMGCCGCGGTAA) [
20] and 806R (GGACTACNVGGGTWTCTAAT) [
21] in an Illumina MiSeq (Illumina, San Diego, CA, USA) with paired-end 150 bp reads at the Biophysics Institute in the Federal University of Rio de Janeiro.
The obtained sequences were processed using Mothur v.1.41.1 [
22]. In brief, contigs were joined, barcodes and primers removed, and sequences screened for quality (no ambiguities, less than 8 homopolymers and unexpected sizes). Sequences were then aligned with the SILVA database v. 128 [
23], after a virtual PCR using the 515F-806R primer pair. Badly or unaligned sequences were removed. Resulting sequences were merged within 4 bp of difference, and chimeras were detected and removed via chimera.vsearch [
24]. Sequences were then classified with the Ribosomal Database Project v. 16 (RDP) [
25] database with an 80% bootstrap threshold, and mitochondria, chloroplasts, Eukarya, Archaea and unknown sequences were removed. Then, OTUs were constructed with a 3% dissimilarity cutoff, and singleton OTUs were removed. Finally, normalization based on the number of sequences of the smallest sample (6170) was performed. Due to a low number of sequences after procedures, a sample from maize in the pH range of 4.7 was eliminated from the analysis, and data were exported from the software. Raw sequences were deposited in the NCBI SRA database, under the Bioproject PRJNA1005761.
2.4. Data Analysis
Differences in shoot and root dry biomass, soil physicochemical characteristics and alpha diversity were assessed through a two-way ANOVA with Tukey’s post hoc test, using plant species and pH range as factors. For beta diversity, data were tested through a two-way PERMANOVA and plotted using non-metric multidimensional scaling (nMDS), with physicochemical characteristics of the soils and plant growth plotted as vectors in the ordinations to assess their correlation with beta diversity. Observed F values from PERMANOVA were used to infer the magnitude of the difference between factors. Using phyla (and proteobacterial class) abundances and pH values, linear models were fitted. Using the most abundant OTUs (above 0.5% average relative abundance among samples) in each plant species and pH values, Spearman correlations were performed. Only those above 0.8 or below −0.8 correlation coefficient and with a p value below 0.05 are reported. Unclassified bacterial sequences were not considered. All analyses were performed and the nMDS plot was generated using Past4 software v. 4.13 [
26].
3. Results
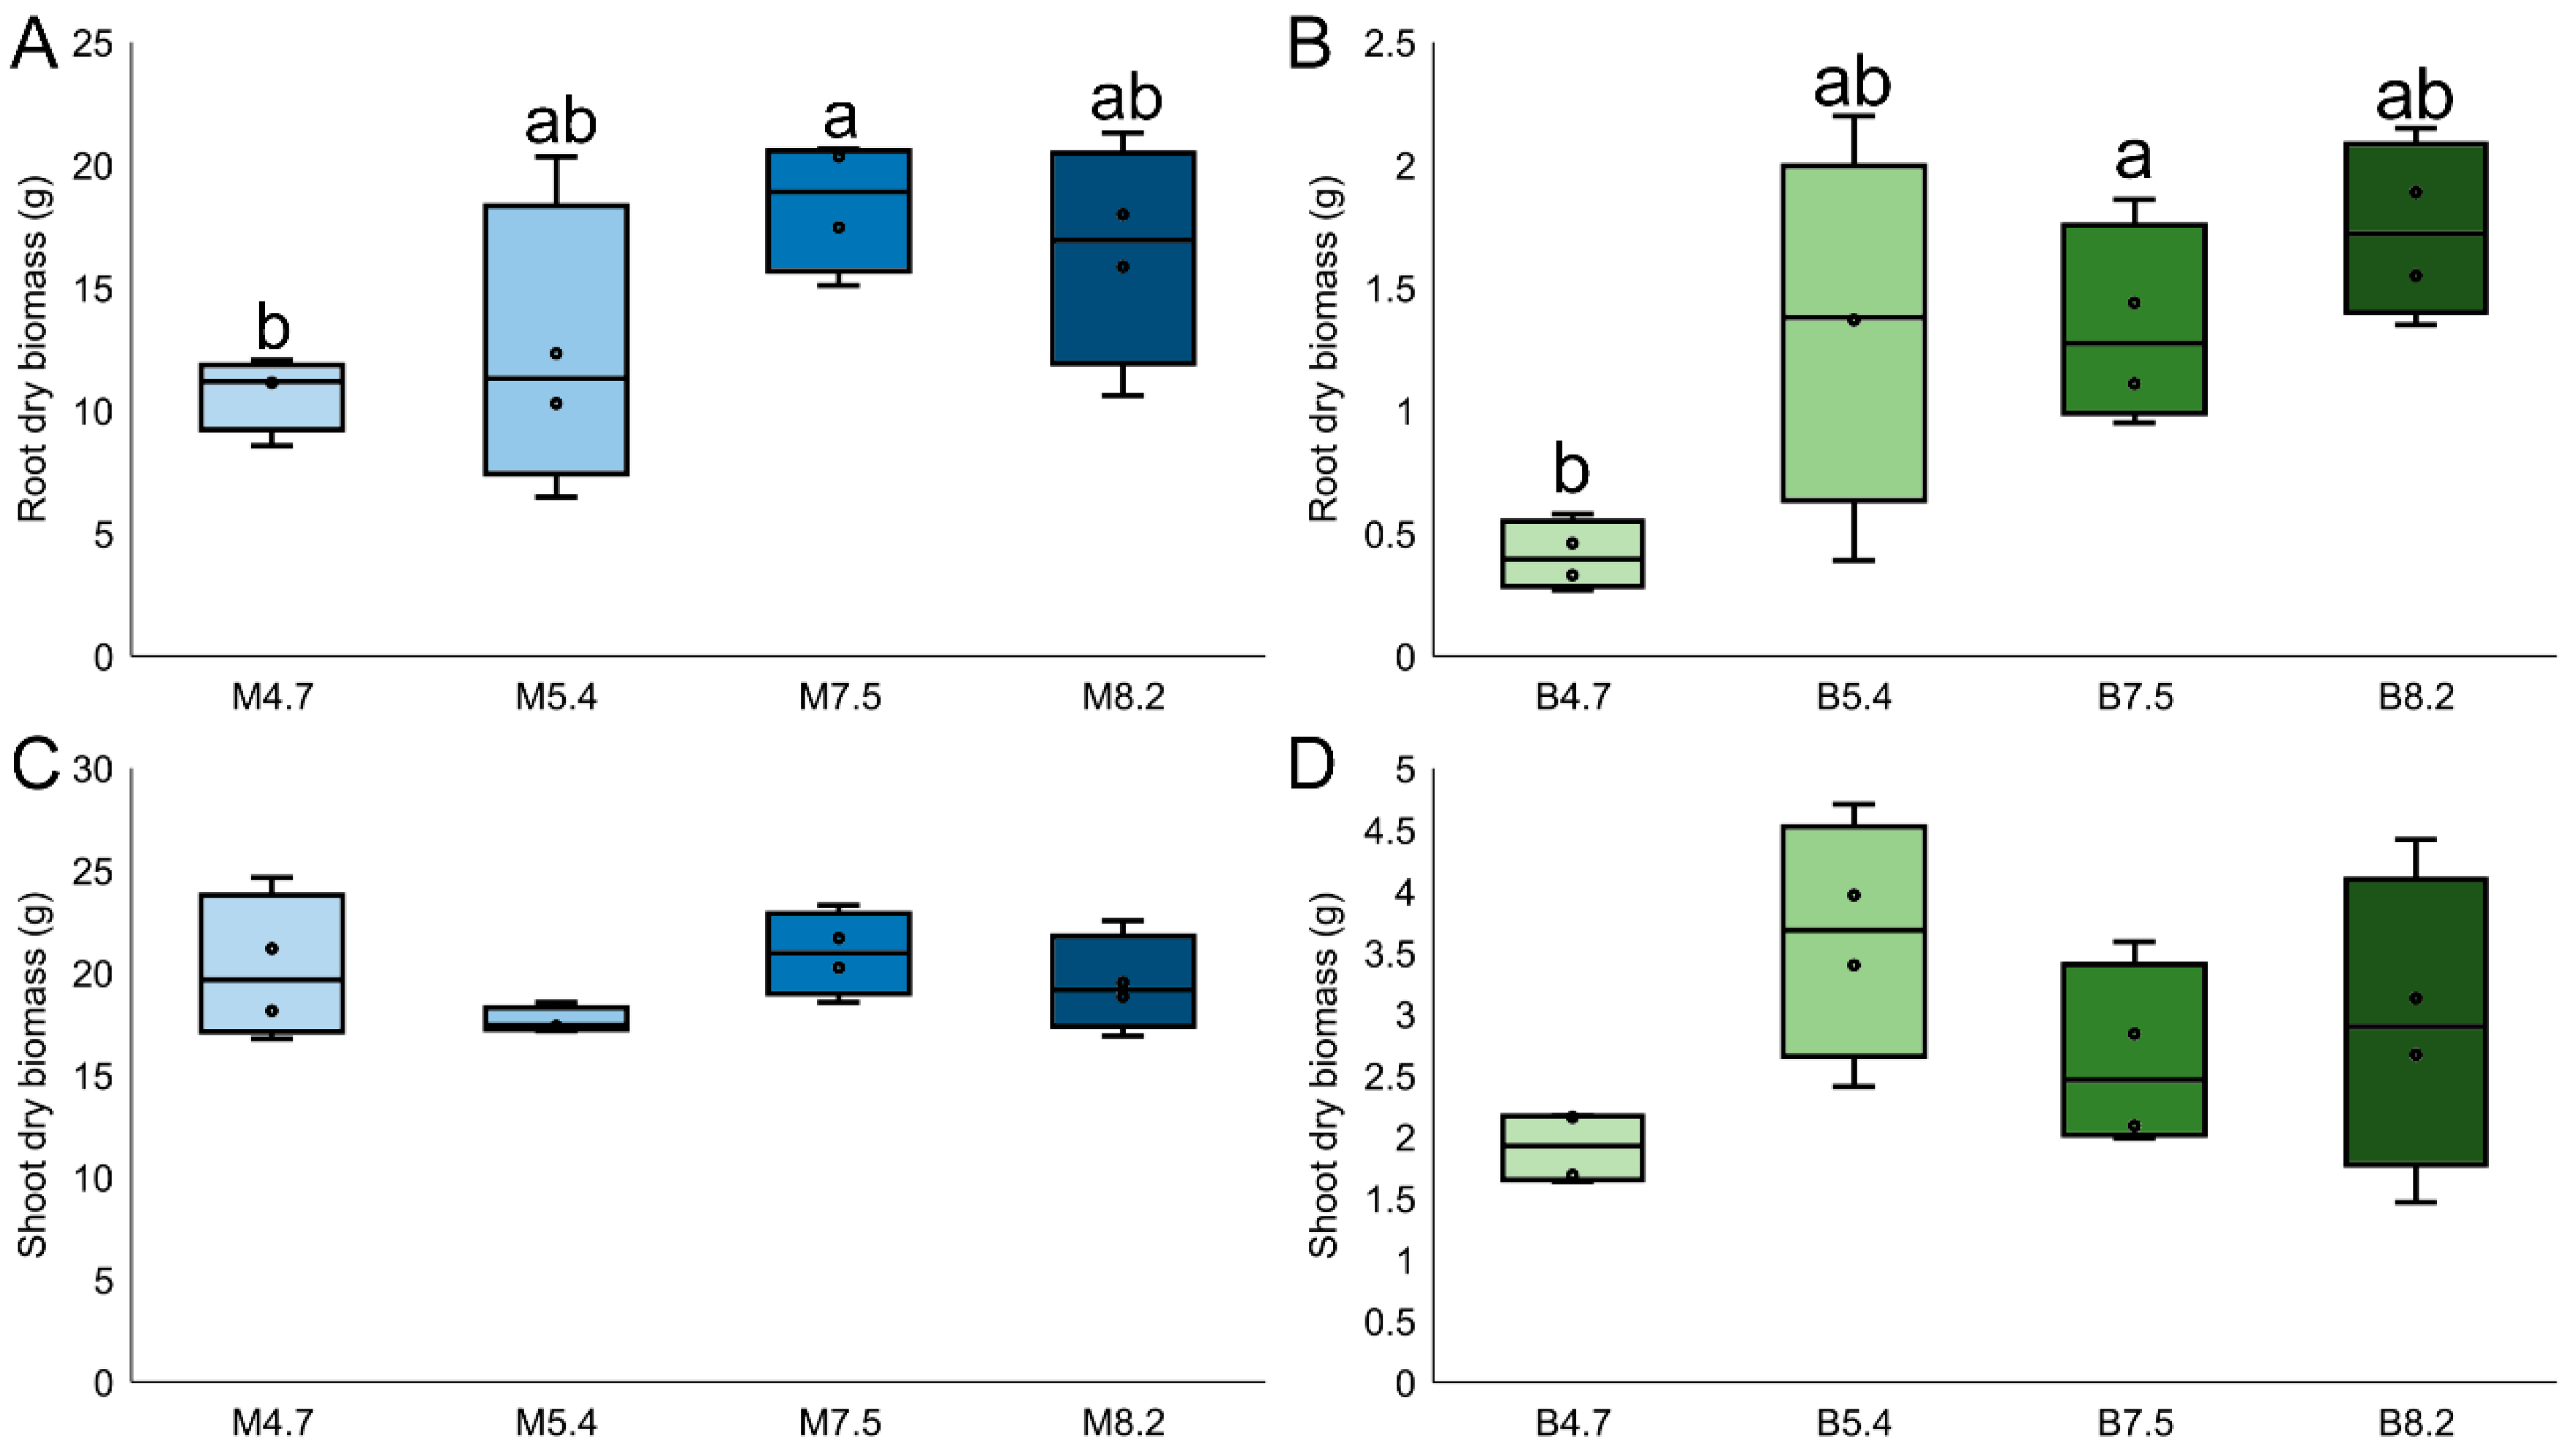
Firstly, plant growth parameters and soil physicochemical characteristics were assessed after 90 days of growth within desirable pH ranges. Maize biomass was considerably higher than that of bean, both for root dry biomass (12 times bigger;
p < 0.001, F
1,31 = 175.5) and shoot dry biomass (5.12 times bigger;
p < 0.001, F
1,31 = 713.7) (
Figure 1). When assessing differences between pH ranges, the only statistical difference was found for bean’s root dry biomass, which was higher in pH 8.2 compared to 4.7 (1.53 times higher; Tukey,
p < 0.01). For the physicochemical characteristics of the soil after the experiment, differences were found both between plant species and pH ranges (
Table 1). Most interestingly, K
+, Na
+ and P were higher in content in bean’s soils compared to maize’s, while organic C had the opposite trend (Tukey,
p < 0.05). Amongst pH ranges, Mg
2+, Al
3+, and H
+ had a negative relationship with increasing pH levels, while Ca
2+ and P displayed a positive relationship (Tukey,
p < 0.05).
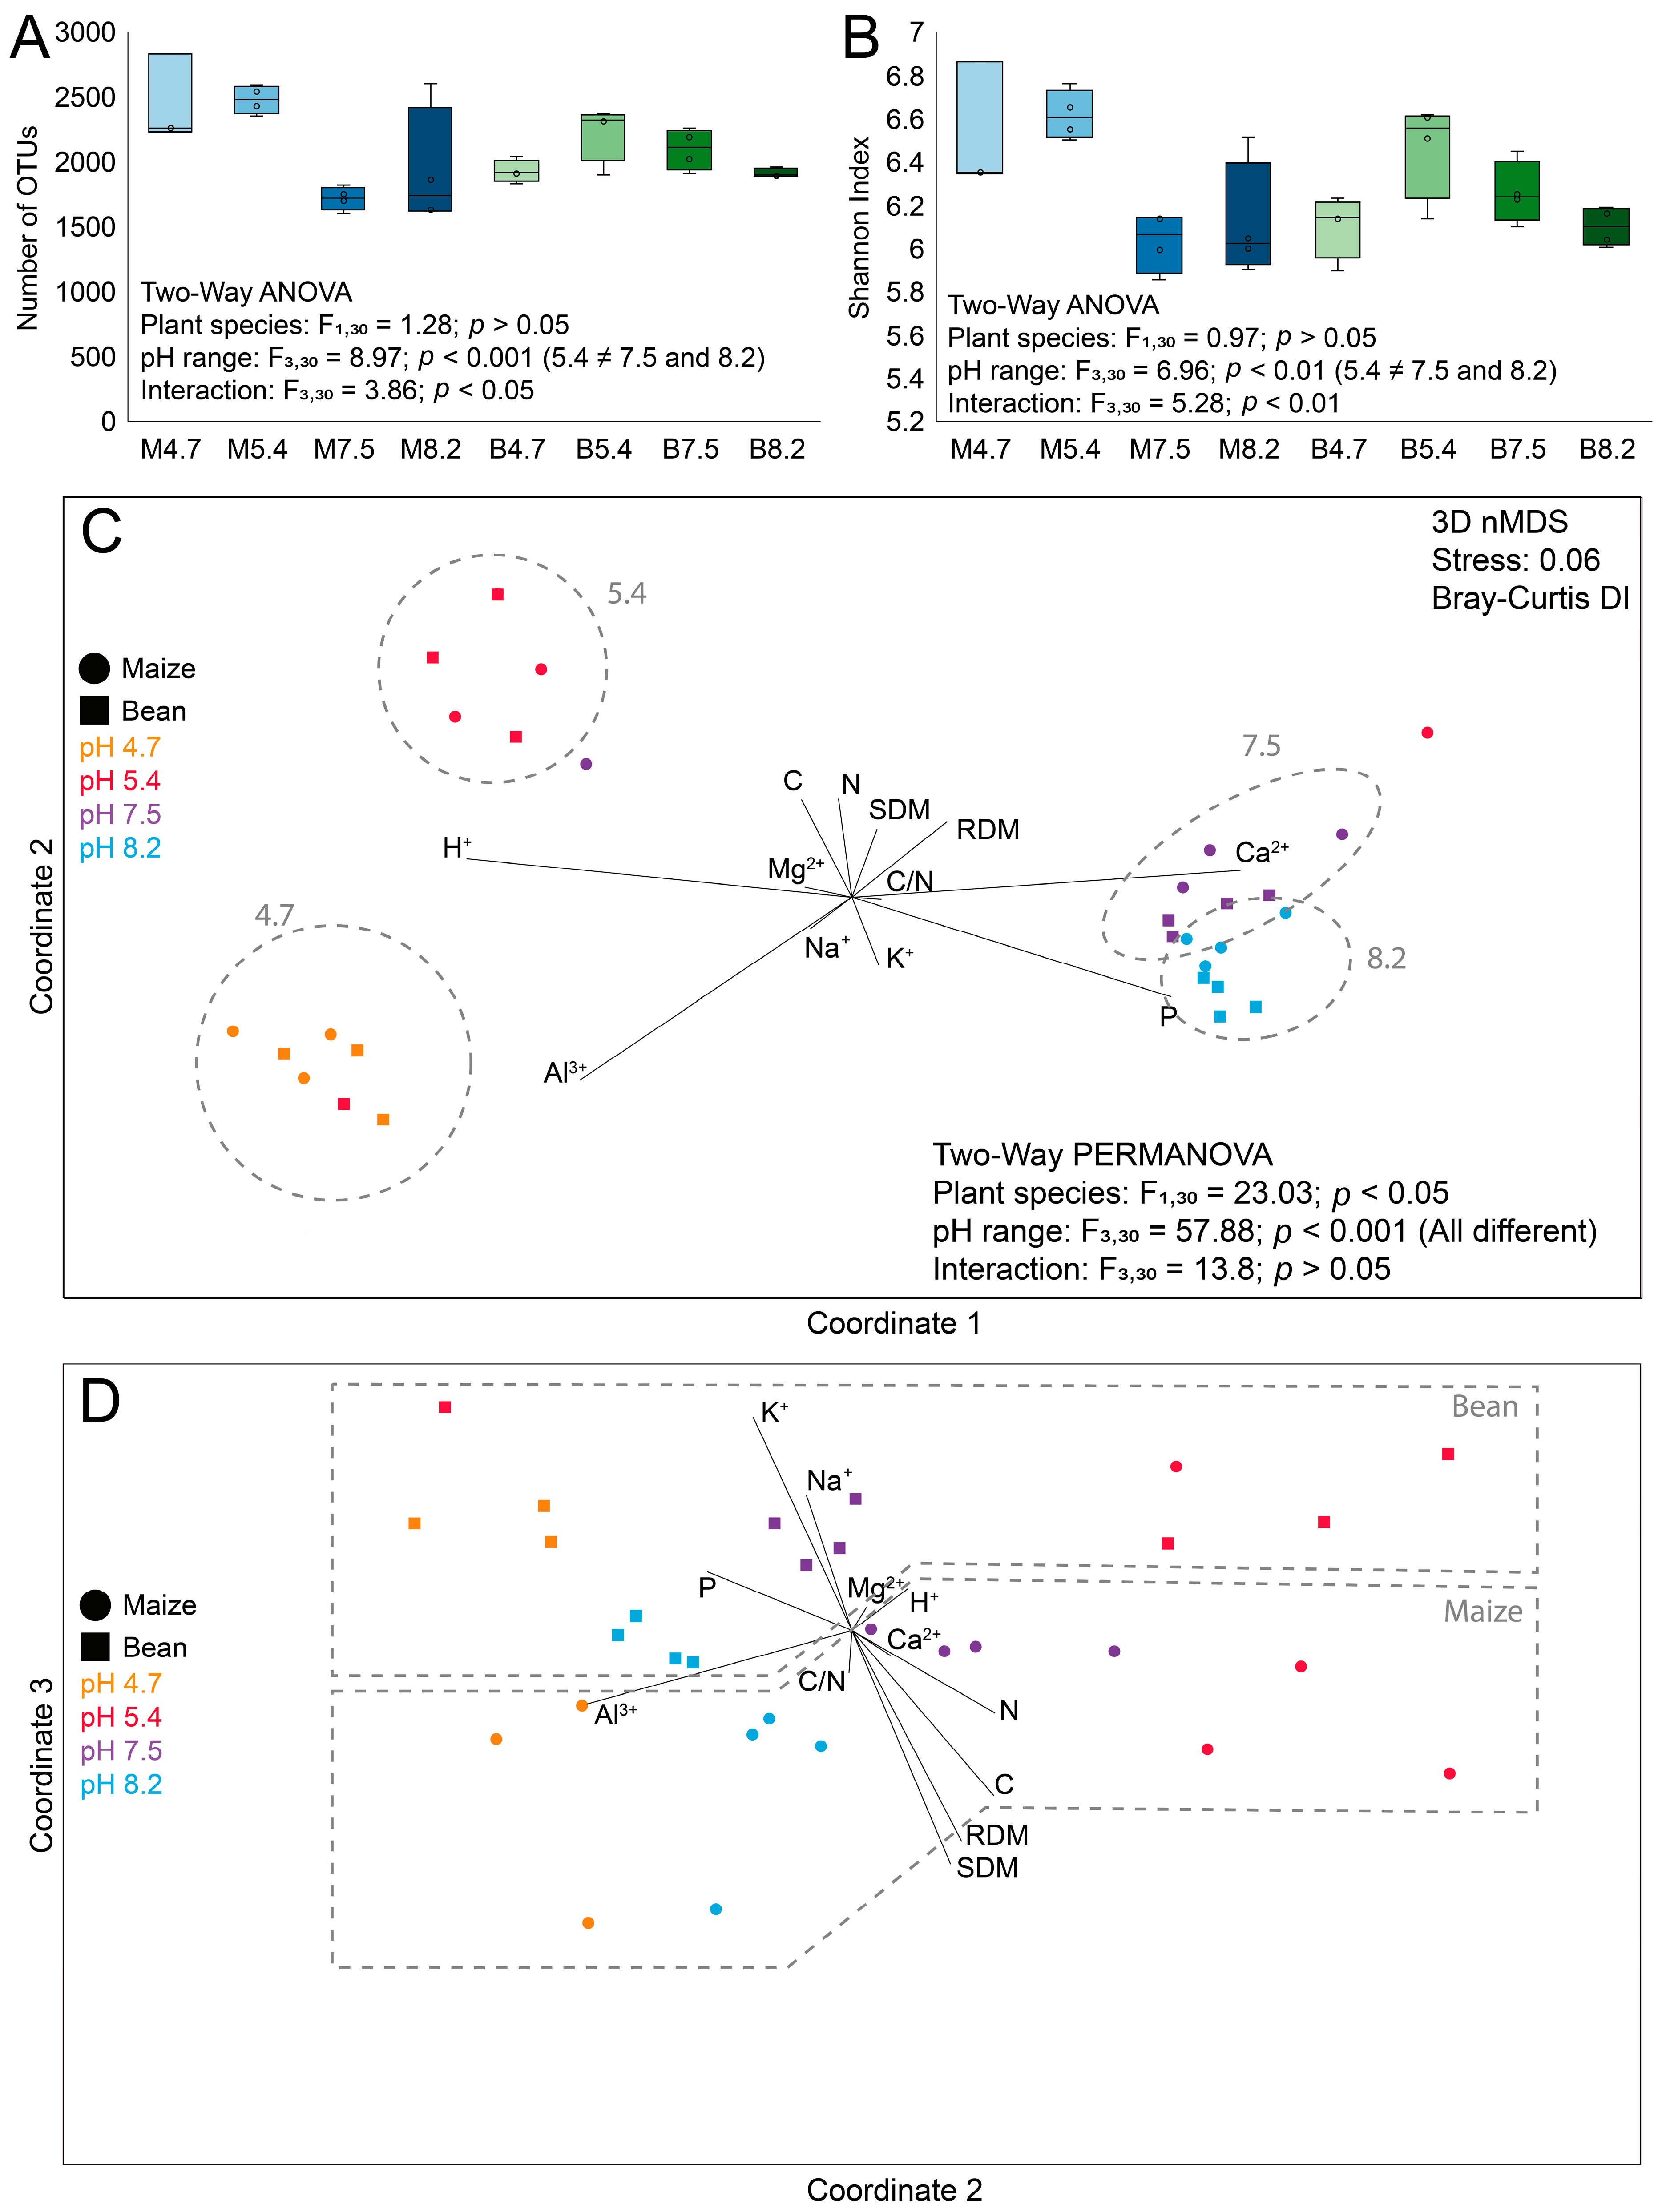
In order to explore structural and ecological differences in the bacteriome of maize and bean rhizospheres, high-throughput 16S rRNA gene sequencing was performed (
Figure S1). As indicated by both alpha diversity metrics (OTU richness and Shannon index;
Figure 2A,B), the maize and bean rhizospheres were neither different in richness (M: 2121.4 ± 427.7 and B: 2041 ± 184.7;
p > 0.05, F
1,30 = 1.28) nor diversity (M: 6.3 ± 0.32 and B: 6.23 ± 0.21;
p > 0.05, F
1,30 = 0.97). As for pH ranges, both richness and diversity were statistically significant, with pairwise differences between 5.4. × 7.5 and 5.4 × 8.2 ranges (Tukey,
p < 0.05). Both metrics were statistically significant for the interaction among factors (richness:
p < 0.05, F
3,30 = 3.86; diversity:
p < 0.01, F
3,30 = 5.28), indicating that the pH responses between plant species were different. While maize seemed to have a big drop from 5.4 and 7.5, bean had an increase in intermediate values (5.4 and 7.5) and was lower in both extreme values.
For beta diversity, both plant species (
p < 0.05, F
1,30 = 23.03) and pH ranges (
p < 0.001, F
3,30 = 57.88) were different, without an interaction among factors (
p > 0.05, F
3,30 = 13.8), indicating a similar response for pH for both plant species in the bacterial community structure. As indicated by pairwise analysis, all pH ranges were different among themselves (one-way PERMANOVA,
p < 0.05). When considering F values for plant species and pH ranges, we observed an effect of the pH that was 2.51 times greater in the rhizosphere bacterial community structure than the effect of plant species. In NMDS analysis (
Figure 2C,D), differences among pH ranges were observed in coordinate 1, and differences among plant species in coordinate 3.
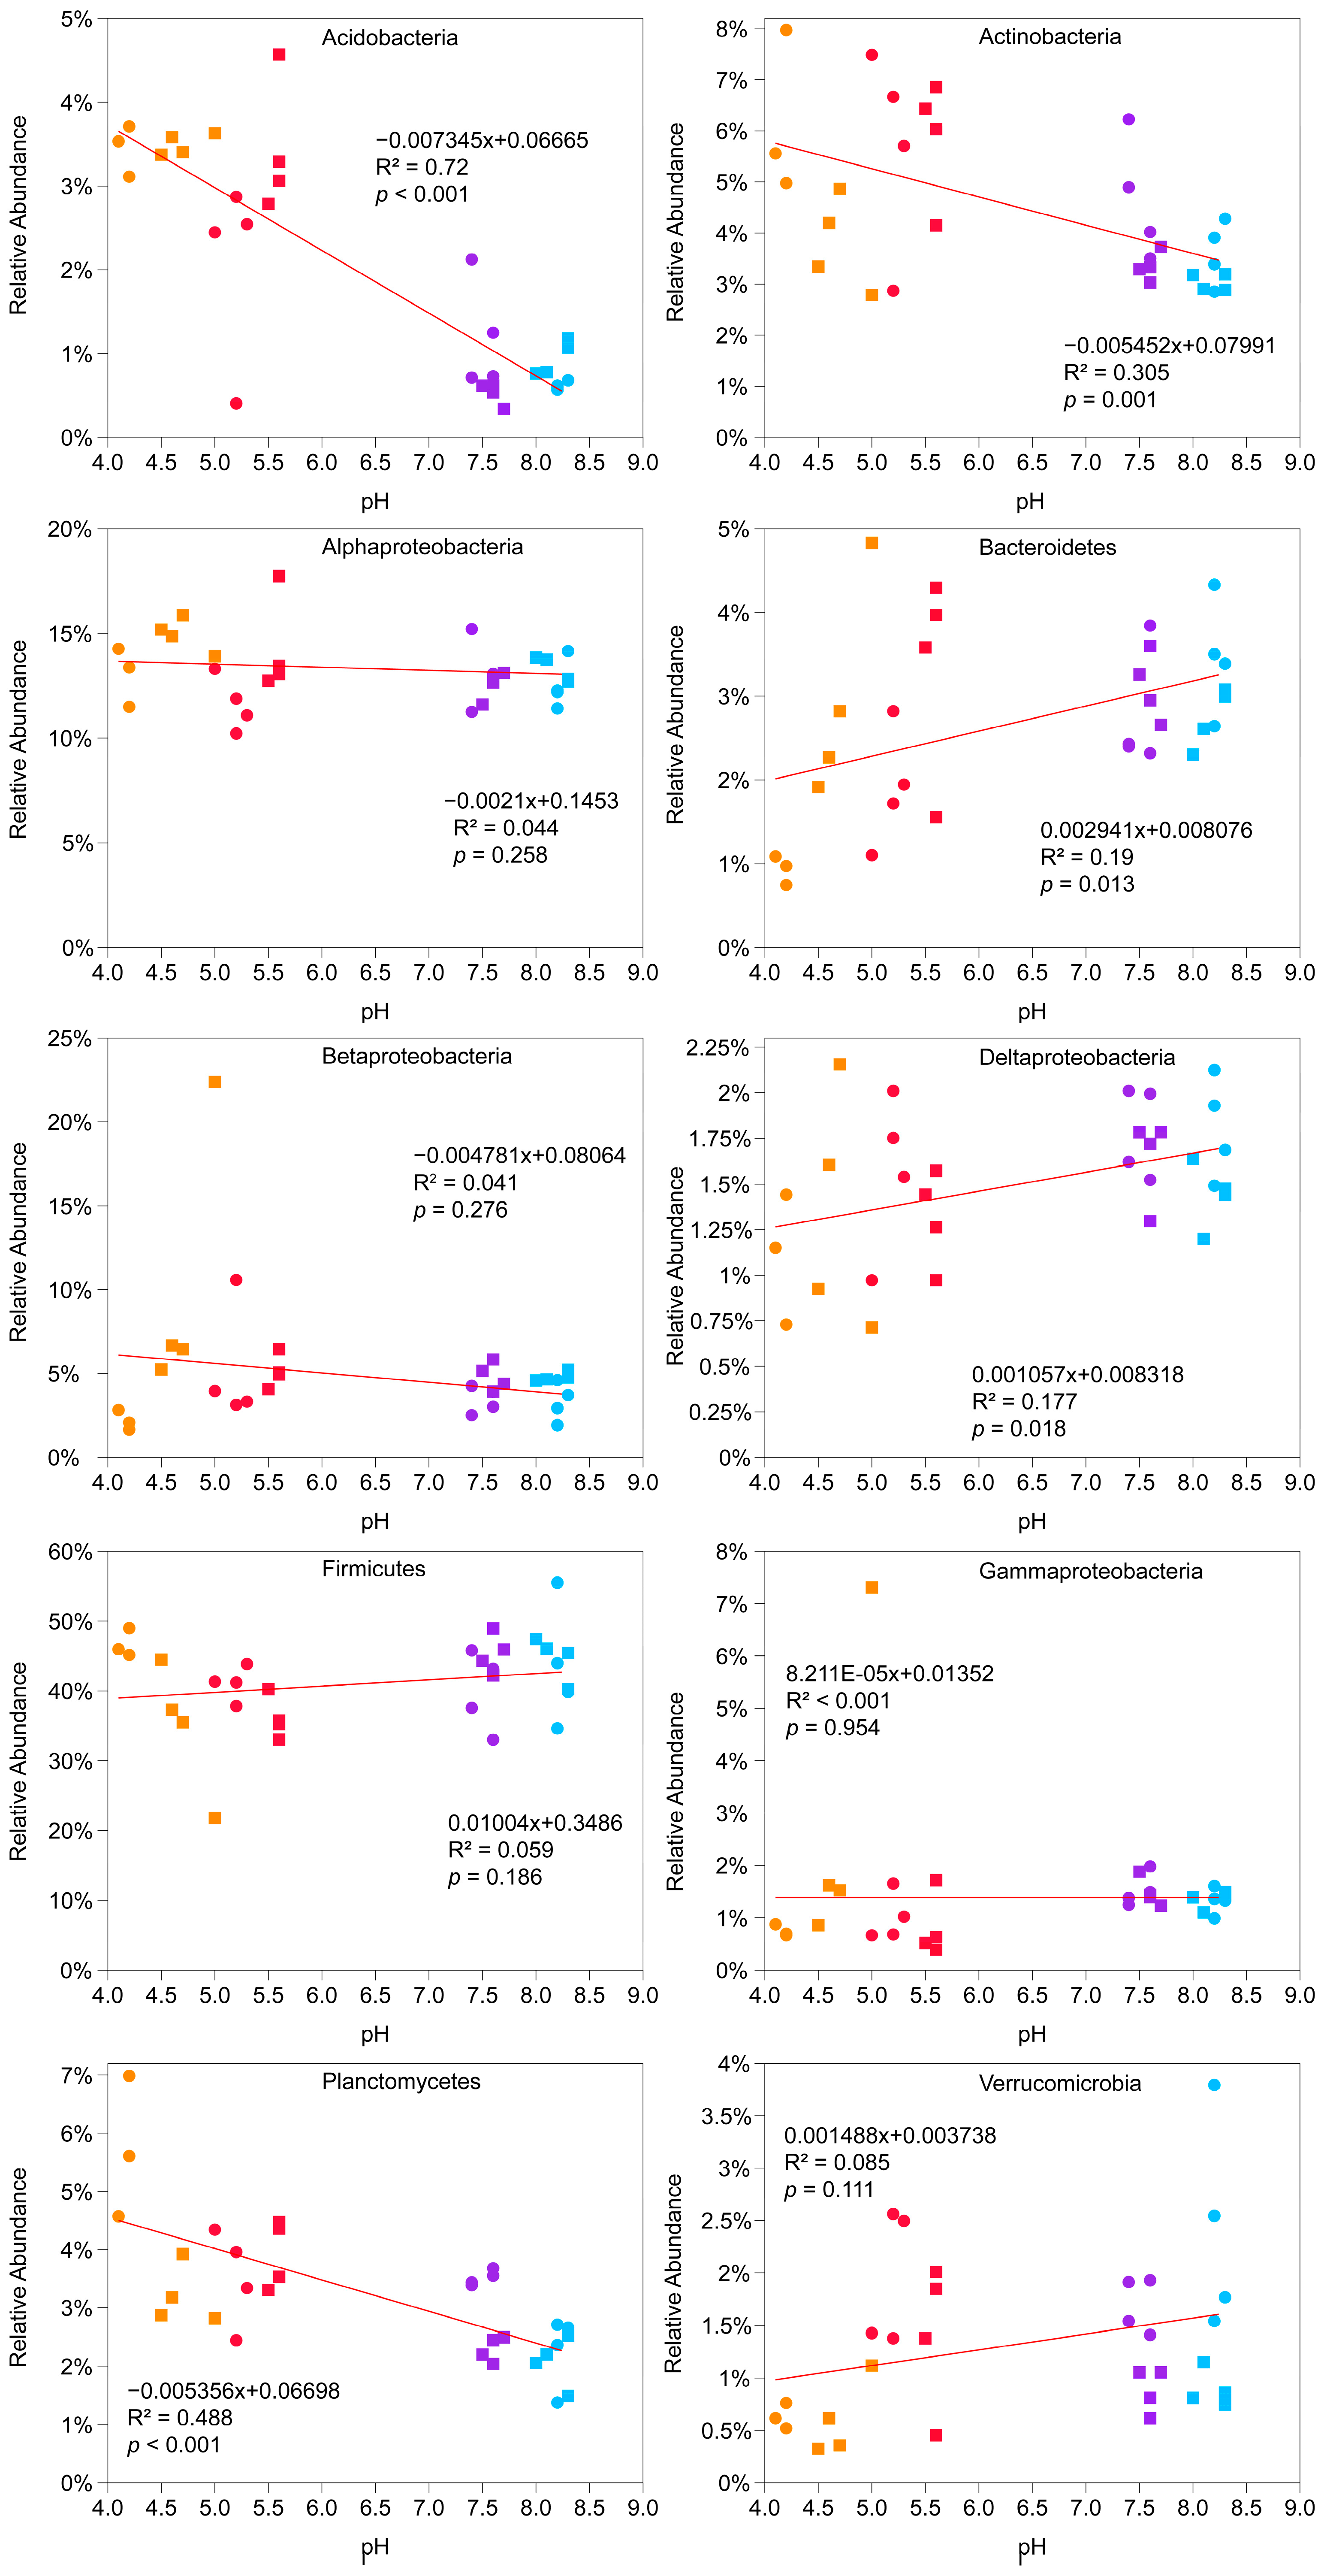
To test the association of the most abundant phyla and proteobacterial classes and pH levels, linear models were fitted (
Figure 3). Positive and significant relationships were found for Bacteroidetes (R
2 = 0.19,
p = 0.013) and Deltaproteobacteria (R
2 = 0.177,
p = 0.018), while negative and significant relationships were discovered for Actinobacteria (R
2 = −0.305,
p = 0.001), Planctomycetes (R
2 = −0.488,
p < 0.001) and Acidobacteria (R
2 = −0.72,
p < 0.001). Firmicutes, Alphaproteobacteria, Betaproteobacteria and Gamaproteobacteria, which accounted on average for 75% of the known bacteria, did not change due to pH variations.
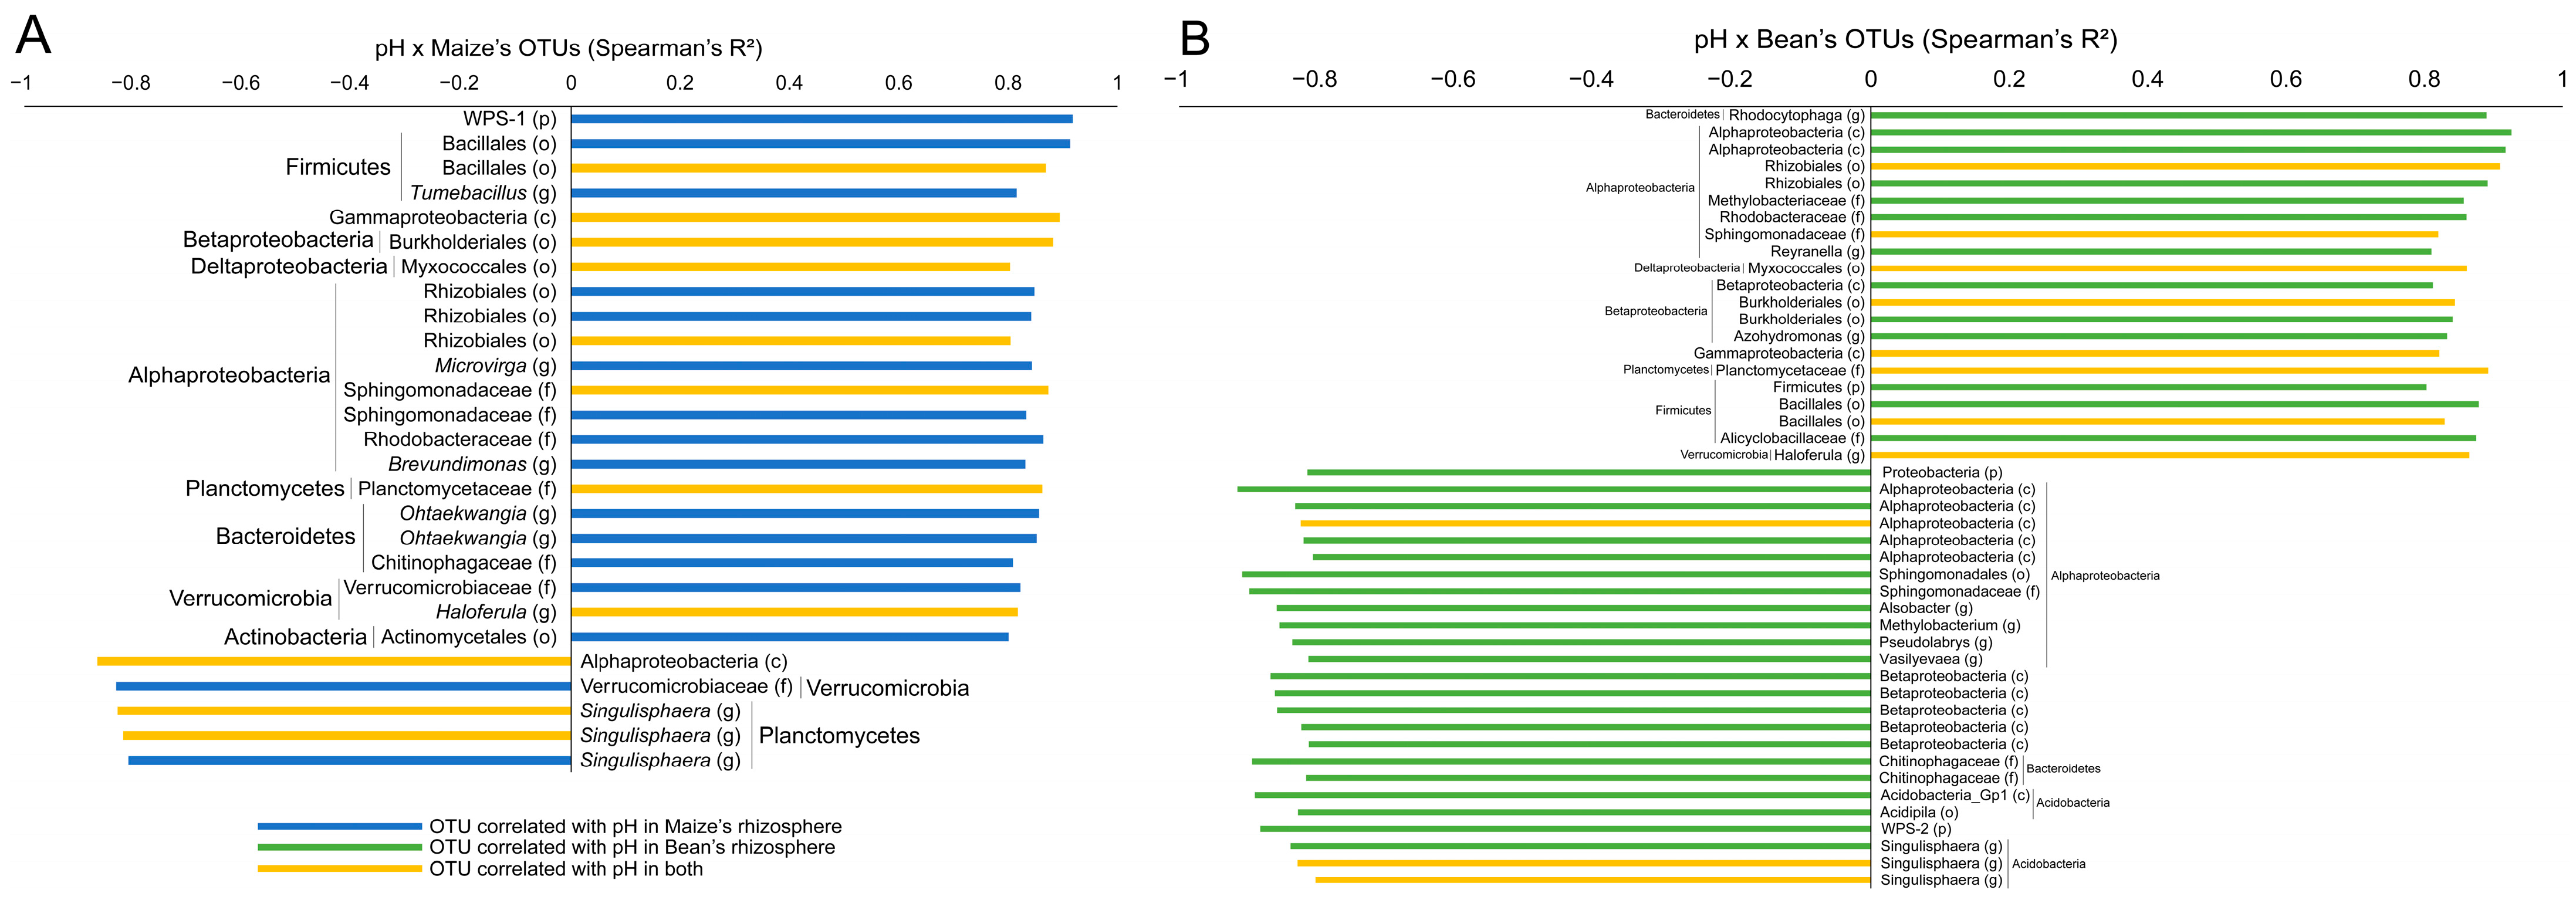
Regarding the association of pH and OTUs in maize and bean rhizospheres analyzed separately (
Figure 4), we found that 22 and 21 OTUs were positively correlated with pH (Spearman,
p < 0.05, R > 0.8), while 5 and 25 were negatively correlated (Spearman,
p < 0.05, R < −0.8), respectively. OTUs of the genera
Tumebacillus,
Microvirga,
Brevundimonas,
Ohtaekwangia and
Haloferula were positively associated with maize, while
Rhodocytophaga,
Reyranella,
Azohydromonas and
Haloferula were represented in bean. For negative correlations, the genus
Singulisphaera was associated with maize, while
Alsobacter,
Methylobacterium,
Pseudolabrys,
Vasilyevaea and
Singulisphaera were associated with bean. Eight OTUs were shared among the positive correlations for both plant species (one Bacillalles, one Gammaproteobacteria, one Burkholderiales, one Myxococcales, one Rhizobiales, one Sphingomonadaceae, one Planctomycetaceae and one
Haloferula), while three were shared for negative correlations (one Alphaprotebacteria and two
Singulisphaera).
4. Discussion
As most studies establishing the relationship between pH and the microbial structure are performed in natural systems [
2,
3,
4,
5,
6,
27], causal and quantitative effects are confounded by a myriad of varying factors, such as physicochemical characteristics of the system or biological influences. To overcome this limitation and better describe the effect of pH on soil bacterial communities, this experiment was designed so that pH in an acidic soil was modulated to achieve different ranges. We also corrected for different fertility differences between the pH ranges and assessed its effect in the rhizosphere of two different commonly used crops with distinct metabolisms.
In summary, it was expected that there would be growth differences between species due to the superior growth rate of maize compared to bean. Surprisingly, soil pH differences did not restrict growth, as indicated by the lack of statistical differences between pH ranges for both plants (with the exception of bean’s root dry biomass between pH 8.2 and 4.7, which could have been caused by a higher bioavailability of P in more alkaline soils, or the toxic effect of H
+ and Al
3+ or insufficiency of Ca
2+ in more acidic soils) [
28]. The correction of soil fertility between pH ranges may have prevented growth restrictions caused by differences in nutrient bioavailability due to pH, which was beneficial in this case, as it allowed us to isolate possible confounding factors such as disparities in plant growth.
It is noteworthy that while alpha diversity indexes exhibited an interaction among factors, beta diversity indexes did not. These results indicate that the richness and evenness of the communities in the rhizosphere are modulated differentially by pH depending on the plant species, but the overall composition of the communities will be consistently influenced by both pH and plant species. Plant exudation profiles and root morphology are known to differ between species and change due to different biotic and abiotic factors, such as pH [
29,
30]. However, according to Lauber and colleagues (2013) [
7], alpha diversity indexes should be interpreted with care, as temporal variability can overshadow treatment effects due to fluctuating soil properties, such as moisture or temperature. Meanwhile, beta diversity is more consistent across temporal dynamics, providing a better representation of differences across treatments. Also, it was possible to note a close community between the pH 7.5 and 8.2 ranges, even though it spanned the same 0.7 range as pH 4.7 and 5.4. A possible explanation is that the soils in the more alkaline range were closer in physicochemical characteristics than the more acidic ones. Still, communities from the distinct pH ranges could be qualitatively separated into two distinct groups, one that merges the two acidic ranges and one that joins the two alkaline ranges. This derives from the narrow range of pH suitable for each bacterial taxon, greatly restricting the possibilities for each pH condition. In Fernández-Calviño and Bååth (2010) [
31], five soil samples with pH ranging from 4.5 to 7.8 were collected. Then, the researchers incubated these samples in a gradient spanning from 3.0 to 8.7 with different buffers, and they measured bacterial growth through leucine and thymidine incorporation. The key finding was that the optimum pH for bacterial growth was usually around 0.5 units higher than the soil’s original pH, with 50% of maximal growth spanning 3.4 units around the optimal pH. These results indicate that most of the soil community members are highly adapted to a specific range and incapable of living outside their range.
Interestingly, pH effects on the bacteriome composition were about 2.5 times bigger than effects of the plant species. According to Fierer [
1], soil pH stands as the biggest modulator of the composition of bacterial communities in soil, where plant identity can or cannot structure belowground communities, depending on factors such as time to evidentially alter the community and the abundance of cosmopolitan taxa able to associate with several different plant species in the soil. In this study, plant identity proved to be an important factor modulating the bacterial community structure, although smaller in influence than soil pH. In contrast to these results, Wan and colleagues (2020) [
11] studied the rhizospheric soil from six plots under different soil pH values and crop species, and they discovered that pH accounted for 67.2% and 29.9% of variations in species diversity indexes (Shannon and OTU richness) and community composition, respectively, while vegetation cover was not a significant modulator of these metrics. These disparities potentially indicate how difficult it is to disentangle smaller effects in natural systems.
Another line of reasoning arises when this environment, the rhizosphere, is combined with nitrogen fertilizer application. As is well-known, continuous application of fertilizers significantly decreases soil pH due to increased nutrient cycling, which can indirectly promote changes in microbial communities. For example, Ren and colleagues (2020) [
32] explored the effects of 10 years of continuous N fertilization on the rhizospheric communities of wheat with different levels of application. While no changes were observed for alpha diversity indexes, beta diversity showed an evident clustering of the fertilized treatments over the years, while the opposite occurred for the control, where these changes correlated with a decrease in pH. In terms of correlations between taxa and pH, Actinobacteria, Nitrospirae, Firmicutes and Entotheonellaeota were negatively correlated with pH, whereas phyla such as Elusimicrobia, Planctomycetes, Acidobacteria, Verrucomicrobia and Armatimonadetes were positively correlated with pH. The disparities between their results and our findings, particularly where this study indicates negative correlations of Acidobacteria and Planctomycetes with pH, have potentially arisen from the different ranges of pH values studied, since their study explored within one unit of pH (7–7.44), which is insufficient to cover the full responses of some phyla to pH variations, as can be seen in
Figure 3. Yet, these results show how small variations in pH can lead to significant changes in microbial communities, especially when considered over long periods of time. It would be interesting to observe the effects of long-term N fertilization in the rhizospheres of different plants through an experiment that spans a wide range of pH values. For example, the Park Grass experiment has been ongoing since 1856 in the UK, and through the application of various inorganic fertilizers, its original value of 5.6–5.8 now ranges from 3.6 to 7. While soil communities from these areas have been thoroughly studied, the rhizospheric effect upon these has not been [
33]. These findings could prove useful for future management of crop rhizosphere communities under fertilization regimes since drops in pH can rearrange entire communities, hampering their artificial manipulation.
In conclusion, it has been shown that when modulating an acidic soil to different pH ranges, the rhizosphere communities of two different crops were mainly influenced by pH, with differences being plant-dependent for richness and alpha diversity but consistent for beta diversity. In general, acidic ranges and alkaline ranges were close among themselves, while there were still compositional differences among all ranges. For alpha diversity, maize showed a decrease in richness and diversity from lower to high pH, while the diversity of bean’s rhizosphere spiked in mid pH levels. Correlational analysis showed an enrichment and depletion of taxa consistent with those reported in the literature while also providing several bioindicators sensitive to pH in the rhizosphere. Altogether, these results provide valuable information that helps us understand how pH influences plant–microbe interactions, advancing the knowledge required for microbiome manipulation to achieve improved crop production.


 ,
, 
