Article

Antimycobacterial Drugs as a Novel Strategy to Inhibit Pseudomonas aeruginosa Virulence Factors and Combat Antibiotic Resistance: A Molecular Simulation Study

Department of Pathology, College of Medicine, Imam Mohammad Ibn Saud Islamic University (IMSIU), Riyadh 13317-4233, Saudi Arabia
Microbiol. Res. 2024, 15(1), 290-313; https://doi.org/10.3390/microbiolres15010020
Submission received: 27 December 2023 / Revised: 28 January 2024 / Accepted: 14 February 2024 / Published: 17 February 2024

Abstract

:
Antimicrobial resistance poses a severe threat, particularly in developing countries where the ready availability of drugs and increased consumption lead to improper antibiotic usage, thereby causing a surge in resistance levels compared to developed areas. Despite the past success of antibiotics, their effectiveness diminishes with regular use, posing a significant threat to medical efficacy. Pseudomonas aeruginosa, an opportunistic pathogen, triggers various infection-related issues, occurring on occasions including chronic wounds, burn injuries, respiratory problems in cystic fibrosis, and corneal infections. Targeting the quorum sensing (QS) of P. aeruginosa emerges as a strategic approach to combat infections caused by this bacterium. The objective of this study was to check the effect of antimycobacterial drugs against the potential QS targets in P. aeruginosa and identify lead candidates. The antimycobacterial drugs were first examined for the toxicological and pharmacokinetic profile. By virtual screening through molecular docking, delamanid and pretomanid stood out as major candidates. The binding energies of delamanid and pretomanid with LasR were determined to be −8.3 and −10.9 kcal/mol, respectively. The detailed analysis of the complexes of lead compounds were examined through molecular dynamics simulations. The molecular simulations data validated a sustained interaction of lead drugs with target proteins (PqsR, LasI, and LasA) in a physiological environment. The negligible changes in the secondary structure of proteins in presence of hit antimycobacterial drugs further strengthened the stability of the complexes. These findings highlight the potential repurposing of delamanid and pretomanid, specifically in targeting P. aeruginosa quorum-sensing mechanisms.

1. Introduction

The challenge of antimicrobial resistance looms large, especially in developing nations, where the confluence of easily accessible medications and heightened drug consumption has led to a disproportionately high incidence of improper antibiotic use [1,2]. This has resulted in a more significant increase in antimicrobial resistance levels compared to developed countries [3,4]. Over the past century, we have seen the discovery of groundbreaking medicines—antibiotics. However, we are now confronted with the looming threat of losing these antibiotics. Antibiotics, which have consistently cured numerous patients, paradoxically lose their efficacy with regular use [5]. The dwindling availability of antibiotics poses a serious threat to modern medicine [4]. New antibiotic discovery is slowing down, and the escalation of antibiotic resistance is primarily attributed to their extensive use in both environmental and medical sectors. The combined rapid emergence of resistance and short treatment regimens makes investing in the development of new antibiotics economically less attractive within the current business scenario [4,6].
Traditionally, bacterial cells were thought to be autonomous entities, each with self-regulating systems [7]. However, contemporary understanding emphasizes quorum sensing, a process where bacteria both synthesize and detect signaling molecules to communicate [8]. QS signals govern the release of extracellular factors, influencing immune suppression, nutrient scavenging, biofilm formation, virulence, and mobility [7,8]. These factors enhance local bacterial populations that are crucial to the bacterial ecosystem [9]. QS also enables the individual cells to monitor their community size, regulating resource-intensive features based on cell density and concentration of signaling molecule [8,10]. As a result, bacteria can coordinate cooperative behaviors beyond the reach of isolated cells. From the initial identification of QS systems in pathogenic bacteria, there has been considerable interest in deciphering the ability of QS to control the transcription of genes associated with virulence [11]. In early investigations, researchers often employed strains with mutations in genes responsible for signal synthases, highlighting the significance of QS in governing virulence across a diverse range of Gram-negative organisms [12].
Pseudomonas aeruginosa (P. aeruginosa), an opportunistic pathogen, exhibits the tendency to infect a diverse array of hosts, spanning insects, plants, and animals [13,14]. In humans, P. aeruginosa assumes a pivotal role in health problems, including chronic wounds [15], burn wounds, corneal infections [16,17], and respiratory cystic fibrosis patients [18,19]. Notably, P. aeruginosa produces various extracellular products, such as proteases, inducing tissue damage and aiding infection spread. The regulation of these products involves a complex hierarchical quorum sensing cascade [8]. Two AHL circuits, LasR-LasI and RhlR-RhlI, both comprising a LuxR-type receptor and a LuxI-type synthase, exist within this QS system. LasI produces 3OC12-HSL, while RhlI produces C4-HSL [8]. In the P. aeruginosa PAO1, LasR circuit holds a hierarchical position, governing the RhlR circuit [7]. Beyond AHL-based QS, P. aeruginosa generates the quinolone signals (PQS), synthesized through the pqsABCDE operon, intricately connected to AHL-based QS [20]. PQS, positively regulated by LasR, influences the virulence factors production like elastase, pyocyanin, and LecA lectin, impacting biofilm formation. PQS-governed QS system substantially contributes to the pathogenicity and virulence in P. aeruginosa [7]. Several emerging therapies directed against P. aeruginosa focus on the manipulation of virulence factors and their regulators [21]. In this regard, numerous compounds have been identified as potential inhibitors of QS by either obstructing AHL sensing and/or production or acting as structural analogs of PQS to impede quinolone signaling in P. aeruginosa [22]. A promising avenue involves disrupting iron homeostasis for treating P. aeruginosa infections, employing iron mimics, chelators, and utilizing iron-acquisition mechanisms to deliver antibiotics through the ‘Trojan-horse’ strategy [23]. Ongoing efforts also include the development of drugs targeting other key virulence features of P. aeruginosa, such as biofilm formation, secretion systems, and effectors [24]. Overall, targeting various QS circuits is an effective strategy for combating P. aeruginosa infection and reducing the risk of antimicrobial resistance.
Tuberculosis, an ancient and persistently dangerous infectious disease, continues to exert a serious and widespread threat across the globe. Its historical roots are deep, yet its impact remains alarmingly relevant today, with an annual increase in cases fueled in part by the formidable drug resistance demonstrated by Mycobacterium tuberculosis [25]. The existing arsenal of antimycobacterial drugs is categorized into first, second, and third line, classifications based on their respective discovery timelines and effectiveness in treatment. These antibiotics exert their influence across a broad spectrum of targets, ranging from the cell wall to various metabolic processes [26].
Antimycobacterial drugs are known to work against Mycobacterium species. However, the exploration of their effect on the QS of P. aeruginosa has been limited. Due to the relative lack of focused endeavors in this direction, the effects of antimycobacterial drugs on diverse potential targets within P. aeruginosa was examined in this study. The drugs were first tested for their pharmacokinetic and toxicological profiles. Moreover, the ADME properties were also predicted using standard web server. Molecular docking was employed for the virtual screening of drugs. Employing molecular simulations, further investigations were conducted to examine the dynamics and stability of the lead antimycobacterial drugs.

2. Materials and Methods

2.1. Preparation of Library of Antimycobacterial Drugs

A collection of 14 antimycobacterial drugs was compiled from the diverse literature sources. Following this, SDF files of antimycobacterial drugs were obtained from PubChem, and their specifics can be found in Supplementary Materials Table S1. Subsequently, the SDF files were transformed into PDB files using UCSF Chimera (version 1.14). The resultant PDB files were utilized to produce PDBQT files through AutoDockTools (version 1.5.6) for the molecular docking [27].

2.2. Prediction of the ADMET Properties Using pkCSM

For the prediction of ADMET (A—absorption; D—distribution; M—metabolism; E—excretion; T—toxicity) properties, the Canonical SMILES of antimycobacterial drugs were obtained from the PubChem. The Canonical SMILES of antituberculosis drugs were utilized as input for these predictions. A variety of parameters belonging ADMET properties were acquired from pkCSM in which subset of these parameters were chosen for further analysis [28]. The properties offer useful insights regarding the efficacy and safety of the compounds, essential considerations in drug development. Additionally, they aid in evaluating the toxicological potential of compounds in both human and animal models, a crucial aspect in drug design [29].

2.3. Pharmacokinetics and Drug Likeliness Assessment

The likelihood of being a drug (drug likeliness) and pharmacokinetic predictions of antimycobacterial drugs were conducted using SwissADME. The input for SwissADME consisted of Canonical SMILES that were obtained from PubChem [30]. SwissADME provided predictions in two categories, encompassing assessments of pharmacokinetics and drug-like properties. In the selection process for potential hit/lead antibiotics, various rules, including Lipinski’s Rule and Ghose’s Rule, were taken into account.

2.4. Selection of the Target Proteins of Pseudomonas aeruginosa

This study involved the selection of target proteins from different quorum sensing targets in P. aeruginosa. The aim was to gain insights into the ability of antimycobacterial drugs to target at the multiple QS mechanisms in P. aeruginosa. Five unique proteins, LasA virulence factor (PDB ID: 3IT7), AHL synthase LasI (PDB ID: 1RO5), RhlR transcriptional regulator (PDB ID: 8DQ1), transcriptional activator LasR (PDB ID: 2UV0), and PqsR transcriptional regulator (PDB ID: 4JVI), were sourced from Protein Data Bank. The protein structures were cleaned by eliminating non-protein atoms, like ions, inhibitors, and water molecules, while preserving the essential protein coordinates.

2.5. Molecular Docking Studies

To conduct the virtual screening of antimycobacterial drugs, we used molecular docking. The docking involved five targets in P. aeruginosa associated with quorum sensing and biofilms. For docking, AutoDock Vina was utilized [31]. The protein coordinates were taken from the PDB database, while the antimycobacterial drugs’ structures were sourced from PubChem; detailed information can be found in Supplementary Materials Table S2. The flexibility of ligands was maintained to achieve the most optimal binding conformation.
Molecular docking was validated by extracting the inhibitor from the PqsR crystal structure and then redocking it to check the binding site. The inhibitor PqsR is 3NH2-7Cl-C9QZN. Remarkably, after docking, the same binding position of the inhibitor was present as that earlier in crystal structure, confirming the reliability of the docking method. This validated docking method consisting of the same parameters was applied for virtual screening. The preparation of receptor/protein involved cleaning by non-protein atoms, adding polar hydrogen atoms, and applying Kollman charges, all performed with AutoDockTools [32]. A grid spacing of 1 Å was set, and detailed information of grid boxes are provided in Supplementary Materials Table S2. The docking analysis was carried out using Discovery Studio and PyMOL.

2.6. Molecular Dynamics Simulations

For further comprehensive examination, the complexes of delamanid and pretomanid with LasA, PqsR, and LasI were chosen for molecular simulations. Based on virtual screening, delamanid and pretomanid emerged as hit antimycobacterial drugs. Gromacs 2018.1 with amber99sb-ILDN force field was utilized for the molecular simulations [33,34]. Protein topologies were produced in Gromacs, and ligand topologies were generated in Antechamber package employing AM1-BCC charge model in AmberTools22 [35]. The resulting topologies of ligand and protein were joined manually. Subsequently, the coordinates of proteins/complexes were kept in boxes (triclinic shape) and the addition of TIP3P water was carried out. After neutralization, 150 mM NaCl was introduced to achieve physiological salt strength. To meet the periodic boundary conditions (PBCs), a consistent distance of 1.0 nm was maintained between the box edges of the box and the structures. The energy was minimized utilizing steepest descent minimization method, halting when Fmax became <10.0 kJ/mol. The first equilibration (NVT ensemble) was achieved at a temperature of 310 K for 1 ns, implementing V-rescale thermostat [36]. This was followed by second equilibration (NPT ensemble) at a constant pressure and temperature for an additional 1 ns, employing the barostat (Parrinello-Rahman) [37]. Afterward, the systems were simulated for 100 ns, saving 10,000 frames for each trajectory. Before analysis, PBC corrections were applied. The energy of the interactions between antimycobacterial drugs and proteins was computed through MM-PBSA analysis [38].

3. Results and Discussion

3.1. Prediction of Toxicity of the Antimycobacterial Drugs

First, we employed pkCSM to forecast the toxicity of antimycobacterial drugs, spanning a spectrum of toxicity parameters such as AMES toxicity, minnow toxicity, hERG I inhibition, skin sensitization, maximum tolerance dose, and T. pyriformis toxicity. The data were interpreted by the instructions provided by the server, and the resulting insights of forecasted toxicological attributes is listed in Table 1. Notably, only two antimycobacterial drugs (pretomanid and clofazimine) exhibited AMES toxicity, while none were anticipated to be hERG I inhibitors. Three of tested antimycobacterial drugs had higher maximum tolerance dose. Likewise, three drugs (protionamide, ethionamide, and ethambutol) also showcased sensitivity to the skin. None of the drugs were found to show toxicity in the T. pyriformis toxicity model. On the other side, three antimycobacterial drugs (delamanid, pretomanid, and clofazimine) were projected to have toxicity in minnow model. It is worth highlighting that pkCSM extended its predictions to encompass LC50 values linked with Flathead Minnow mortality, and the foundational framework of the model was laid using LC50 measurements derived from an extensive pool of 554 compounds [28].
Antituberculosis drugs undergo significant metabolism and detoxification primarily in the liver, involving both Phase I and Phase II groups of drug-metabolizing enzymes. This metabolic process is crucial for the breakdown of these drugs and their metabolites, but it comes at the cost of potential liver injury [39]. The current standard for tuberculosis treatment involves a combination therapy comprising rifampicin, isoniazid, ethambutol, and pyrazinamide. However, this combination has been associated with adverse reactions, notably hepatotoxicity. Hepatotoxicity is a known side effect of these antitubercular drugs and their metabolic byproducts. The occurrence of hepatotoxic effect varies widely, ranging from two to twenty-eight percent in different populations, when the drugs are administered at recommended doses [40]. In the Indian population, nearly 10% of patients undergoing antitubercular therapy have been reported to experience hepatotoxicity [41]. A study conducted on HepG2 cell line involved subjecting the cells to varied doses of antimycobacterial drugs, specifically rifampicin, pyrazinamide, and isoniazid, for different periods. The evaluation, performed through MTT assay and phase contrast microscopy, revealed that these antimycobacterial drugs did not exhibit cytotoxic effects on the HepG2 cell line. Interestingly, when the cells were pre-treated with sub-cytotoxic concentrations of isoniazid and pyrazinamide, the subsequent exposure to the same drugs led to an increase in toxicity [39]. This suggests a potential interaction or sensitization effect, where prior exposure to lower concentrations of isoniazid and pyrazinamide rendered the cells more susceptible to the toxic effects of these drugs during subsequent treatments.
In another study, focusing on the pulmonary tuberculosis (TB) patients and the impact of anti-TB drugs on hematologic parameters and liver enzyme levels, noteworthy associations were observed. Following the administration of drug treatments, hematological parameters, including hemoglobin, red blood cell count, mean corpuscular volume, hematocrit, mean corpuscular hemoglobin concentration, and mean corpuscular hemoglobin, experienced significant changes. However, the platelet count did not show a significant alteration. In tandem with the hematological changes, liver enzyme activities, specifically alanine transaminase, aspartate transaminase, and alkaline phosphatase, demonstrated a significant decrease after the treatment [42]. These findings underscore the potential hazardous impact of anti-TB drugs on the liver, contributing to hepatotoxicity. Hepatotoxicity remains a major concern in TB patients, highlighting the importance of monitoring and managing liver-related effects in TB treatment. This insight contributes to the broader understanding of the challenges associated with anti-TB drugs and their potential consequences on hematological and hepatic parameters in patients undergoing TB treatment.

3.2. Prediction of ADME Properties of the Antimycobacterial Drugs

Utilizing the pkCSM web server, the ADME properties of antimycobacterial drugs was predicted. This in-depth analysis includes two parameters for absorption, intestinal absorption, and solubility in water. Likewise, two distribution parameters, namely fraction unbound and volume of distribution (VDss), were scrutinized, while the metabolism parameters included CYP3A4 inhibition and CYP3A4 substrate evaluation. The excretion parameters involved assessments of renal OCT2 substrate characteristics and total clearance. The forecasted ADME properties of antimycobacterial drugs are exhaustively delineated in Table 2. Significantly, a noteworthy revelation emerged within the cohort of antimycobacterial drugs: none of tested drugs displayed markedly low levels of intestinal absorption.
The data revealed that three drugs (pretomanid, clofazimine, and bedaquiline) exhibited a low water solubility, while the remainder demonstrated a pronounced solubility in water. The VDss for all tested antimycobacterial drugs were either moderate or high. Within this spectrum, three drugs manifested low fraction unbound values, four displayed a moderate range for values of fraction unbound, and the remainder exhibited commendable fraction unbound levels. Notably, the lead antimycobacterial drugs, delamanid and pretomanid, deviated from the norm by not displaying low fraction unbound levels. It is imperative to underscore that the pharmacological impact of a drug is predominantly steered by its free or unbound fraction [43]. A reduction in protein binding equates to a more substantial proportion of the free drug at any given drug concentration. This increased availability of free fraction holds the potential to amplify the drug’s efficacy [44]. Within the subset of antimycobacterial drugs, a three six emerged as CYP3A4 substrates, with two of them falling under lead antimycobacterial drugs. Cytochrome P450 enzymes, particularly the abundant CYP3A subfamily, assume a pivotal role in metabolizing a diverse array of natural compounds and medications within the physiological milieu. Notably, CYP3A4, the preeminent member of this subfamily, serves a multitude of essential functions, including participating in detoxification of bile acids, orchestrating the cessation of steroid hormone effects, and contributing to the elimination of phytoconstituents derived from dietary sources, along with many pharmaceutical drugs [45,46,47]. Of the 14 antituberculosis drugs, 4 (amithiozone, dapsone, protionamide, and ethionamide) exhibited characteristics indicative of CYP3A4 inhibition. Among the parameters of distribution, i.e., renal OCT2 substrate, only one (pretomanid) of the drugs was found as the substrate for the renal OCT2.

3.3. Evaluation of Drug-Like and Pharmacokinetic Parameters

SwissADME was used in forecasting the pharmacokinetics and drug-like properties of antimycobacterial drugs; the important attributes are listed in detail in Table 3. The Lipinski’s Rule of Five is a common trait in the drugs that are orally administered; most such drugs are relatively small molecules with a moderate degree of lipophilicity [48]. IT is noteworthy that the majority of the tested antimycobacterial drugs adhered to Lipinski’s rule. Two drugs (delamanid and clofazimine) violated a single rule, while one (bedaquiline) was found to be in violation of two rules within the Lipinski’s criteria. In addition to Lipinski’s Rule of Five, the Ghose filter, an additional knowledge-based filter employed in shaping chemistry libraries for drug discovery, was also examined [49]. This filter imposes stringent criteria, including a molecular weight within the range of 160 to 480 Daltons, number atoms in 20–70 range, logP spanning from −0.4 to 5.6, and a molar refractivity between 40 and 130. Known for its increased stringency when compared to Lipinski’s Rule, the Ghose filter often results in more stringent criteria and, consequently, more instances of rule violations. Even within the Ghose filter framework, five antimycobacterial drugs showed three or more violations, while six drugs did not violate any Ghose filter.
Additionally, SwissADME was enlisted to scrutinize pharmacokinetic attributes, with a focus on three pivotal parameters: blood–brain barrier permeability, P-glycoprotein substrate status, and gastrointestinal absorption (Table 3). Only four of the tested antimycobacterial drugs were found to have low gastrointestinal absorption, while remaining exhibited high gastrointestinal absorption. Importantly, only one (protionamide) compound exhibited permeability to the blood–brain barrier. In short, the majority of the tested antimycobacterial drugs exhibited favorable drug-like properties and pharmacokinetics.

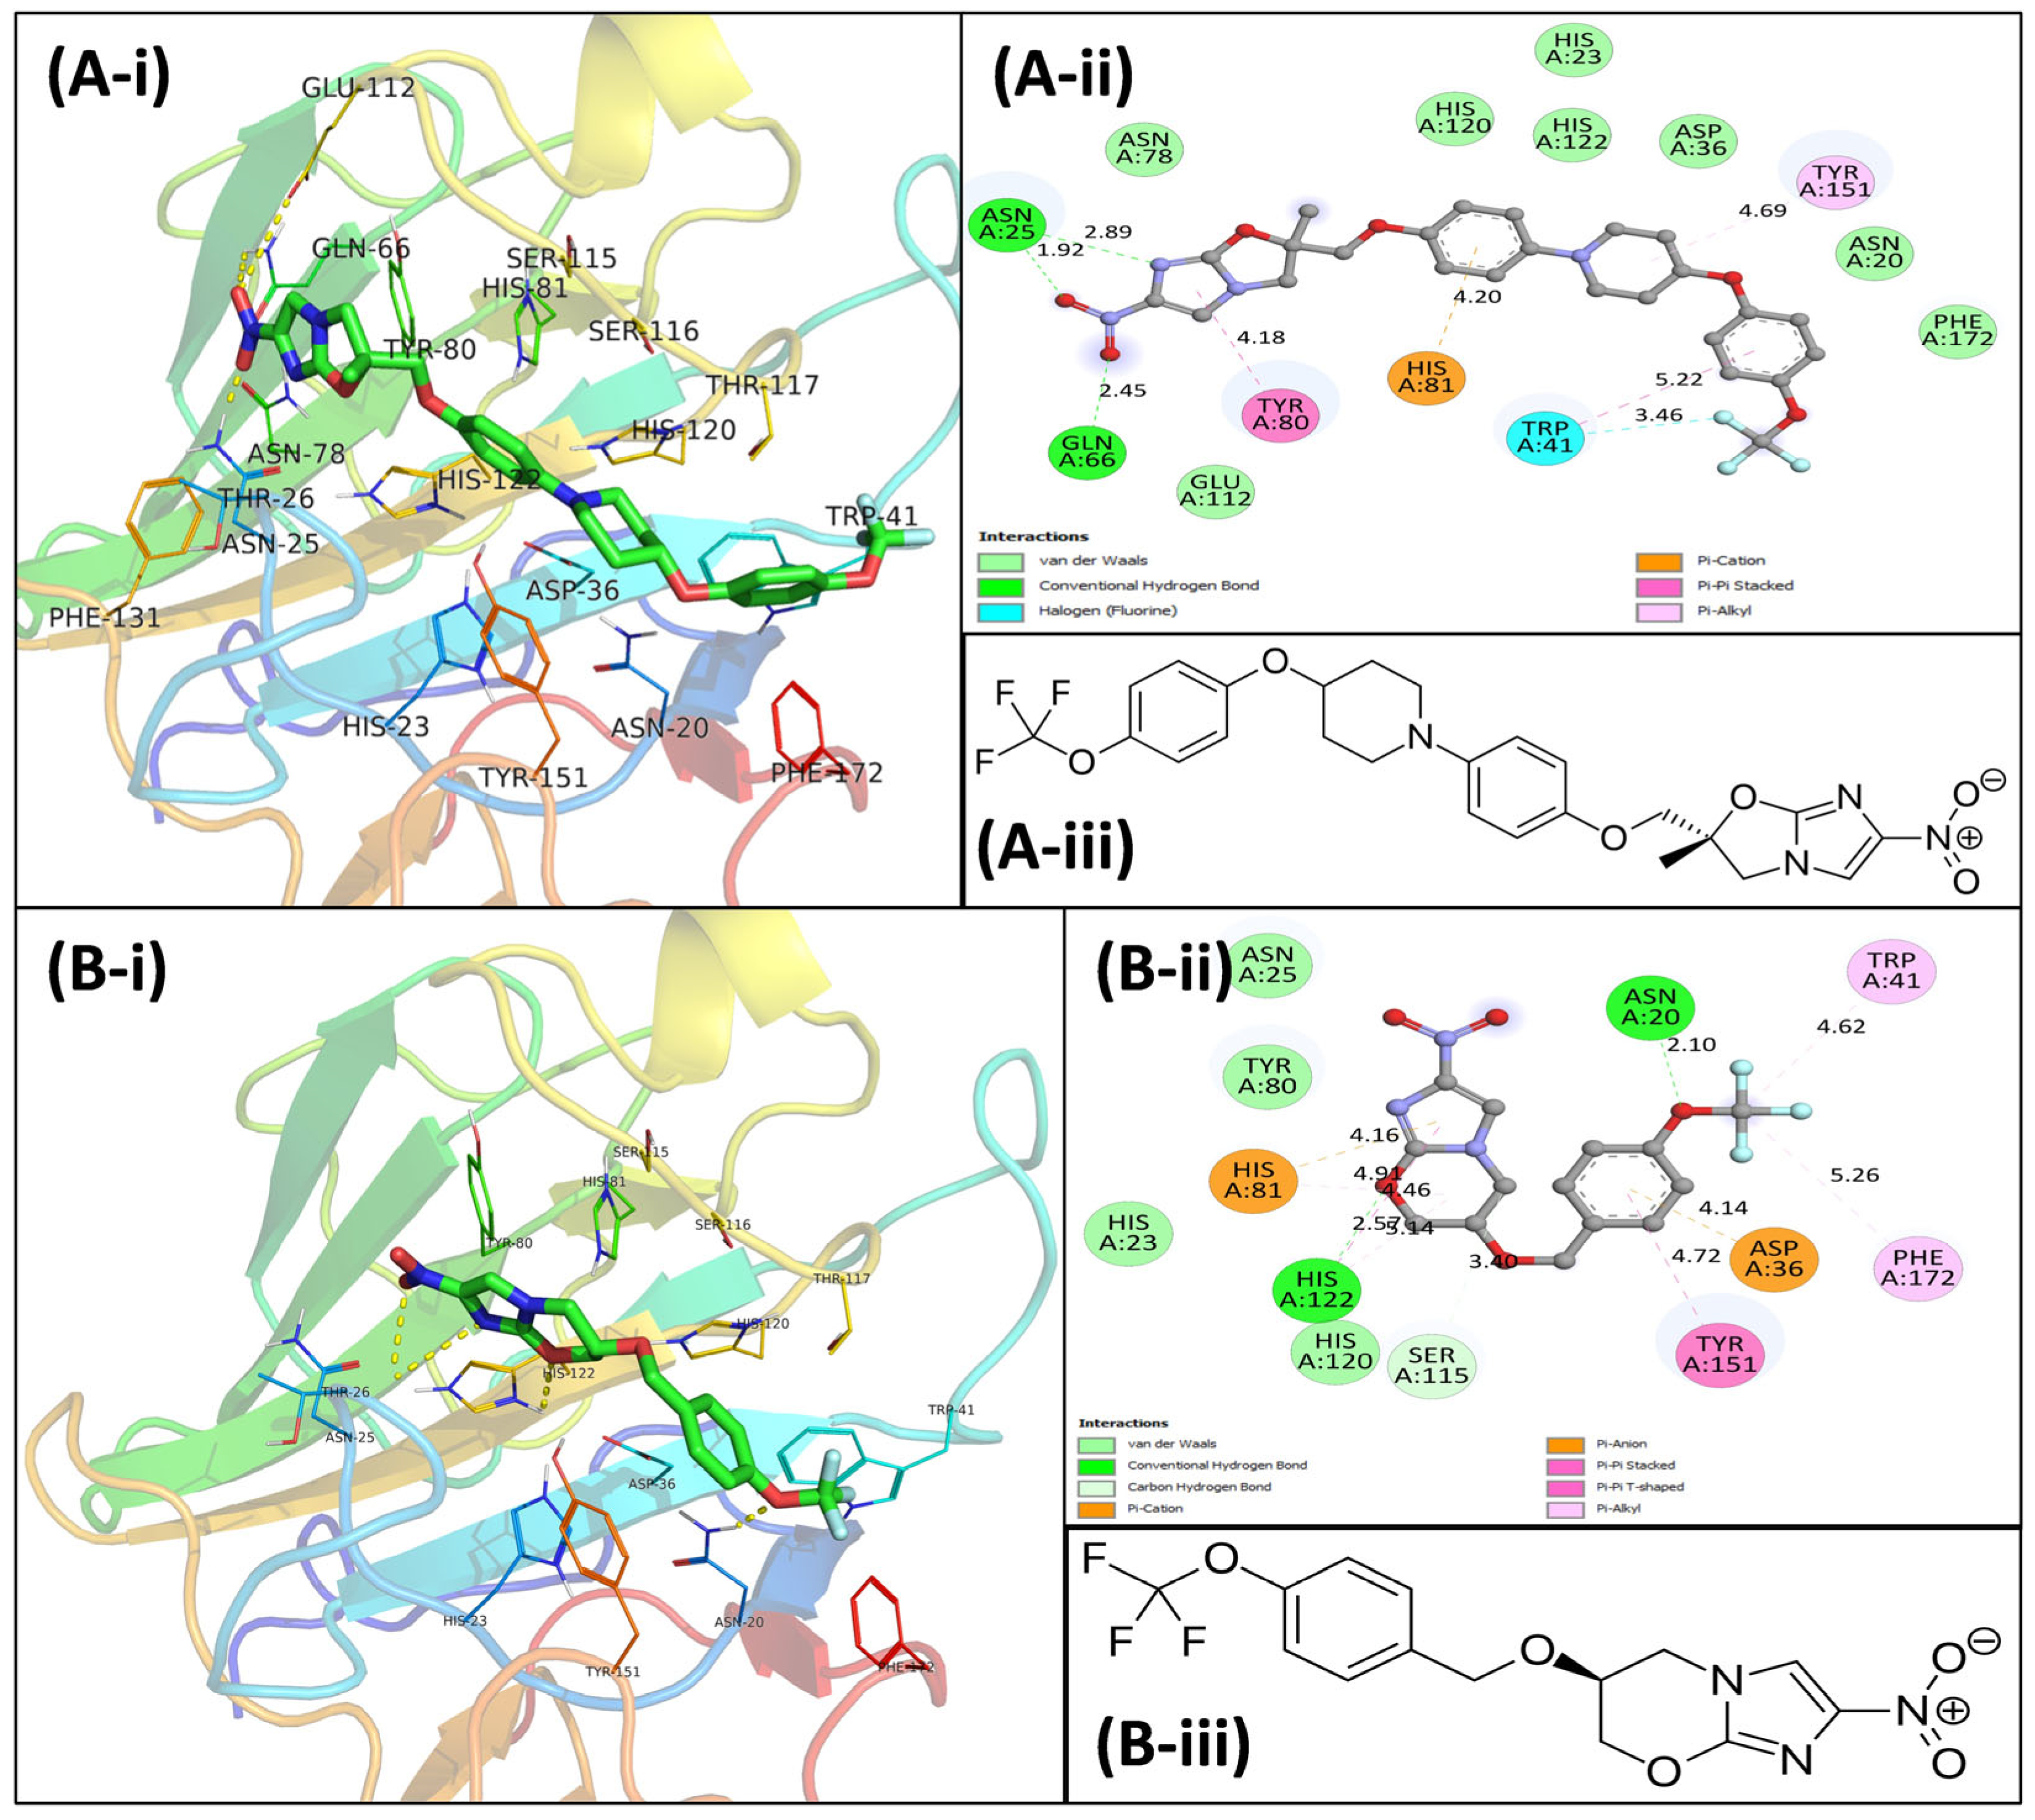
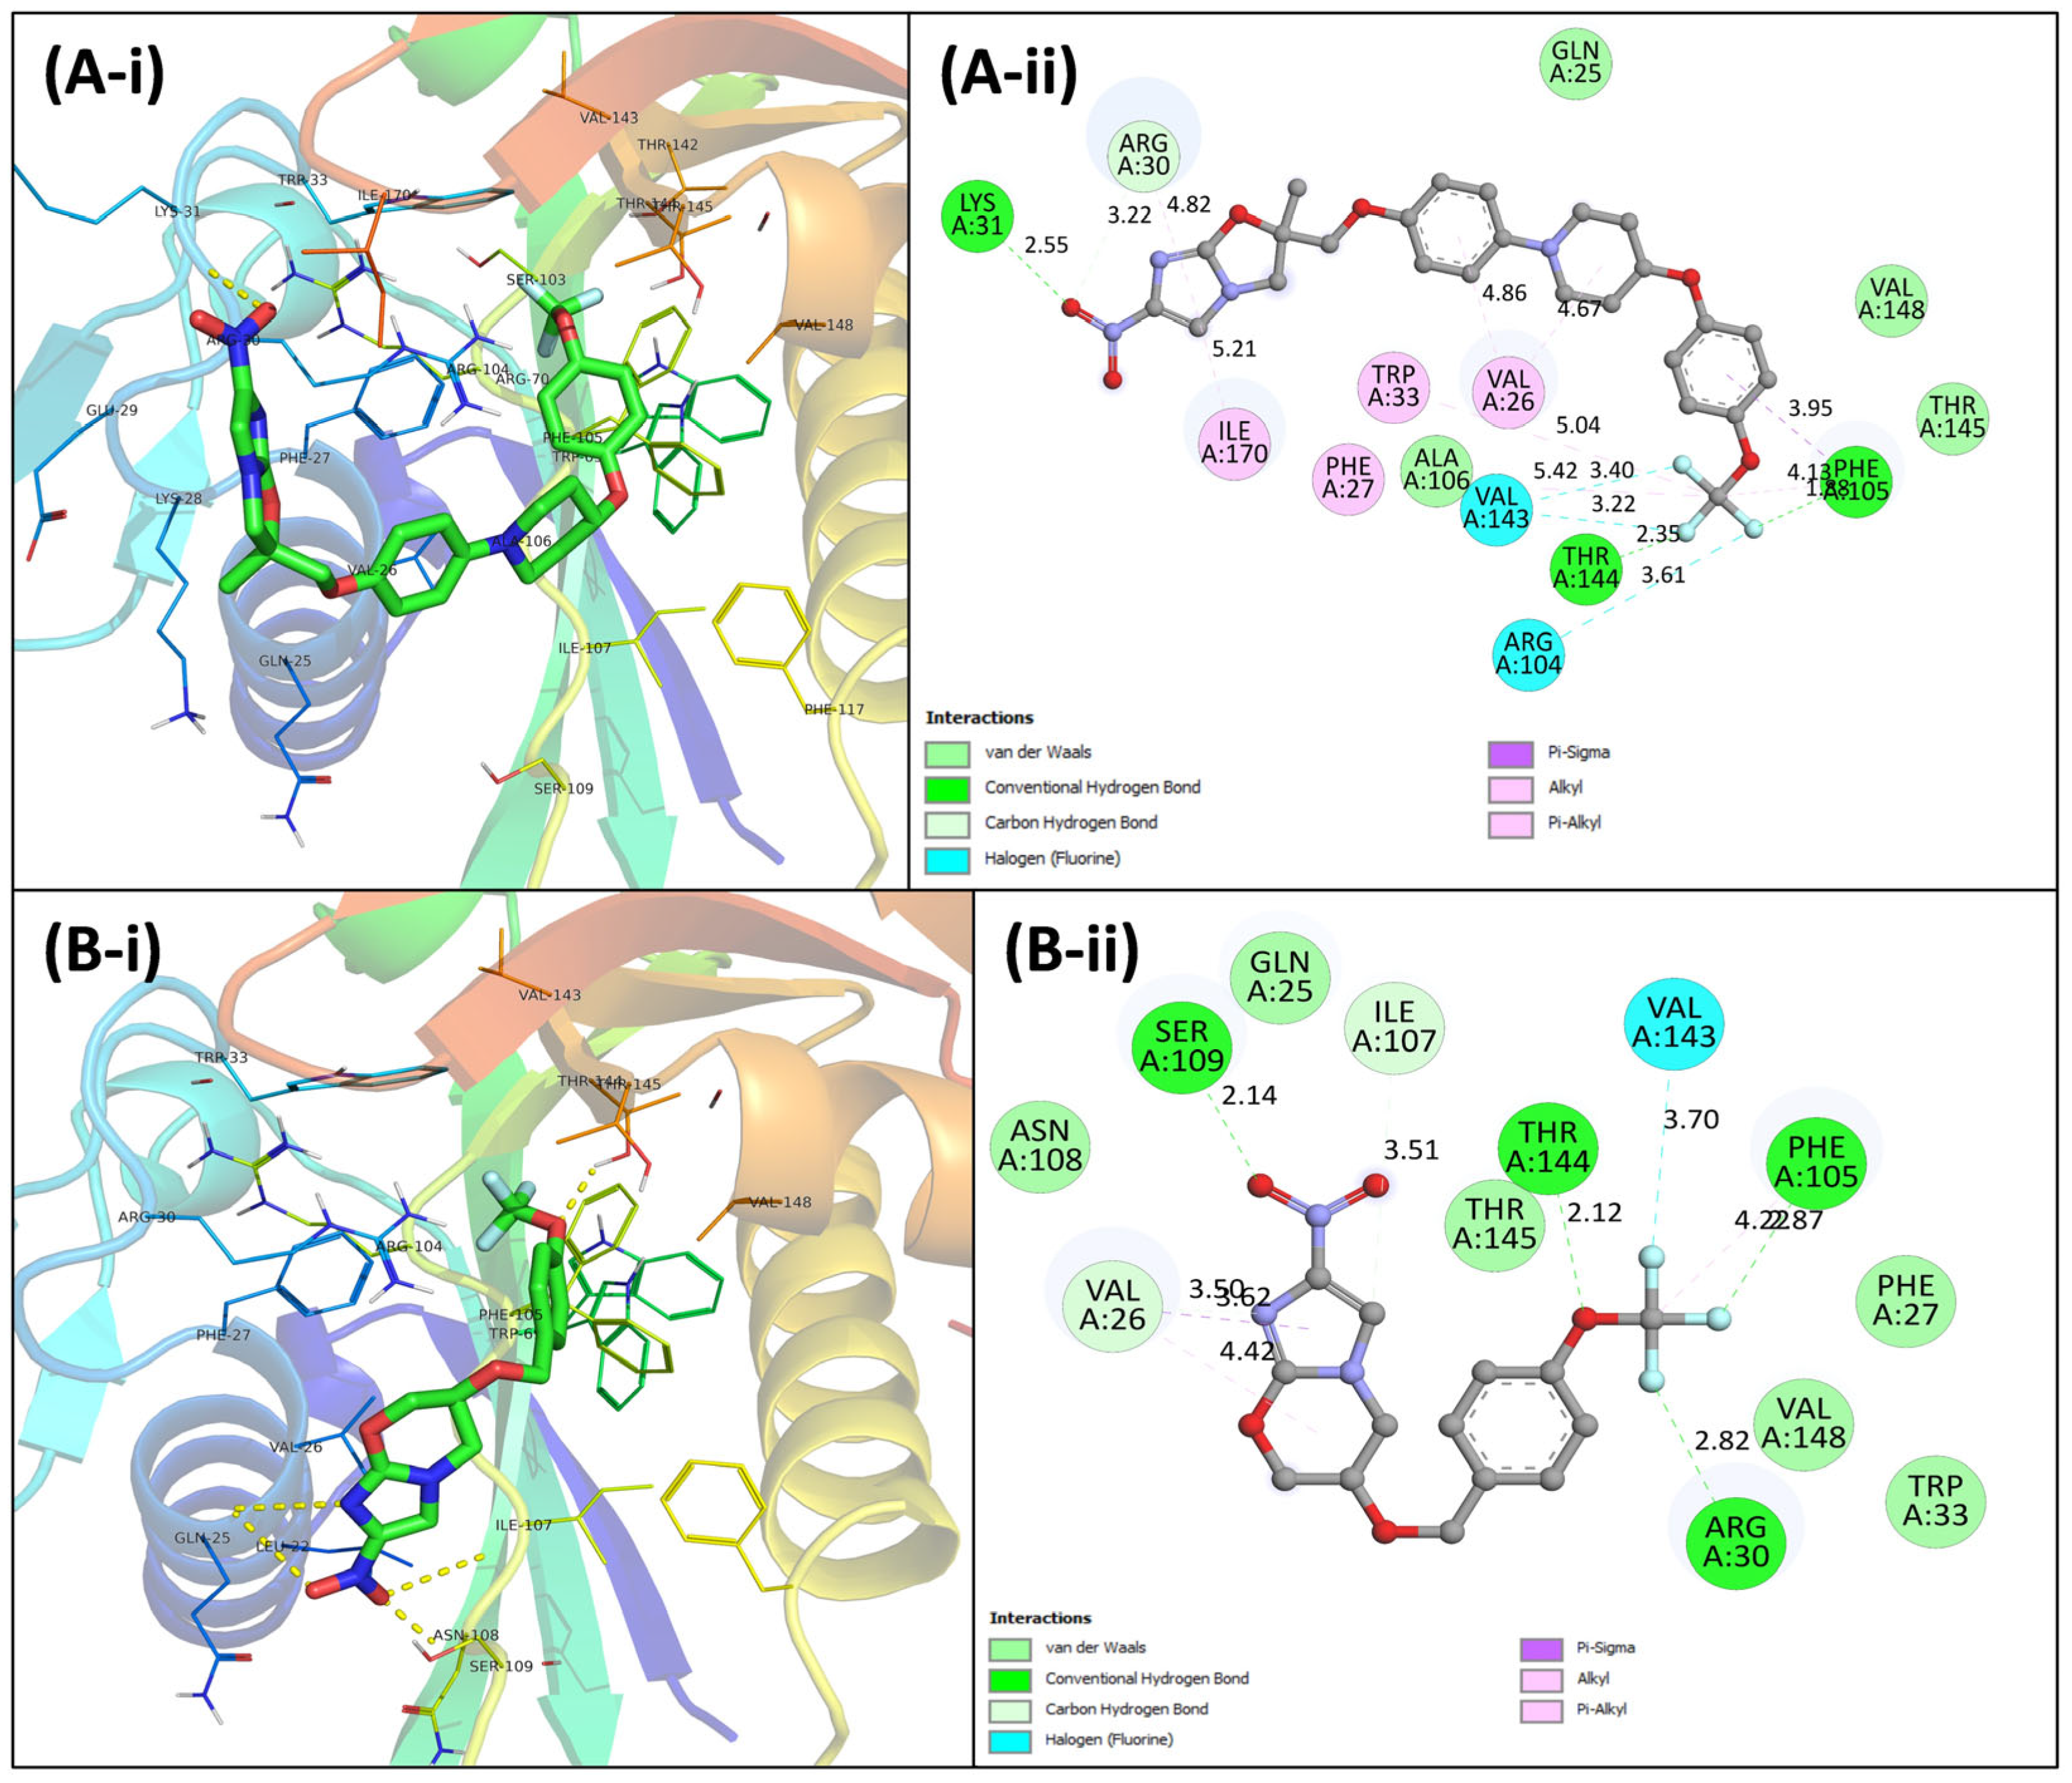
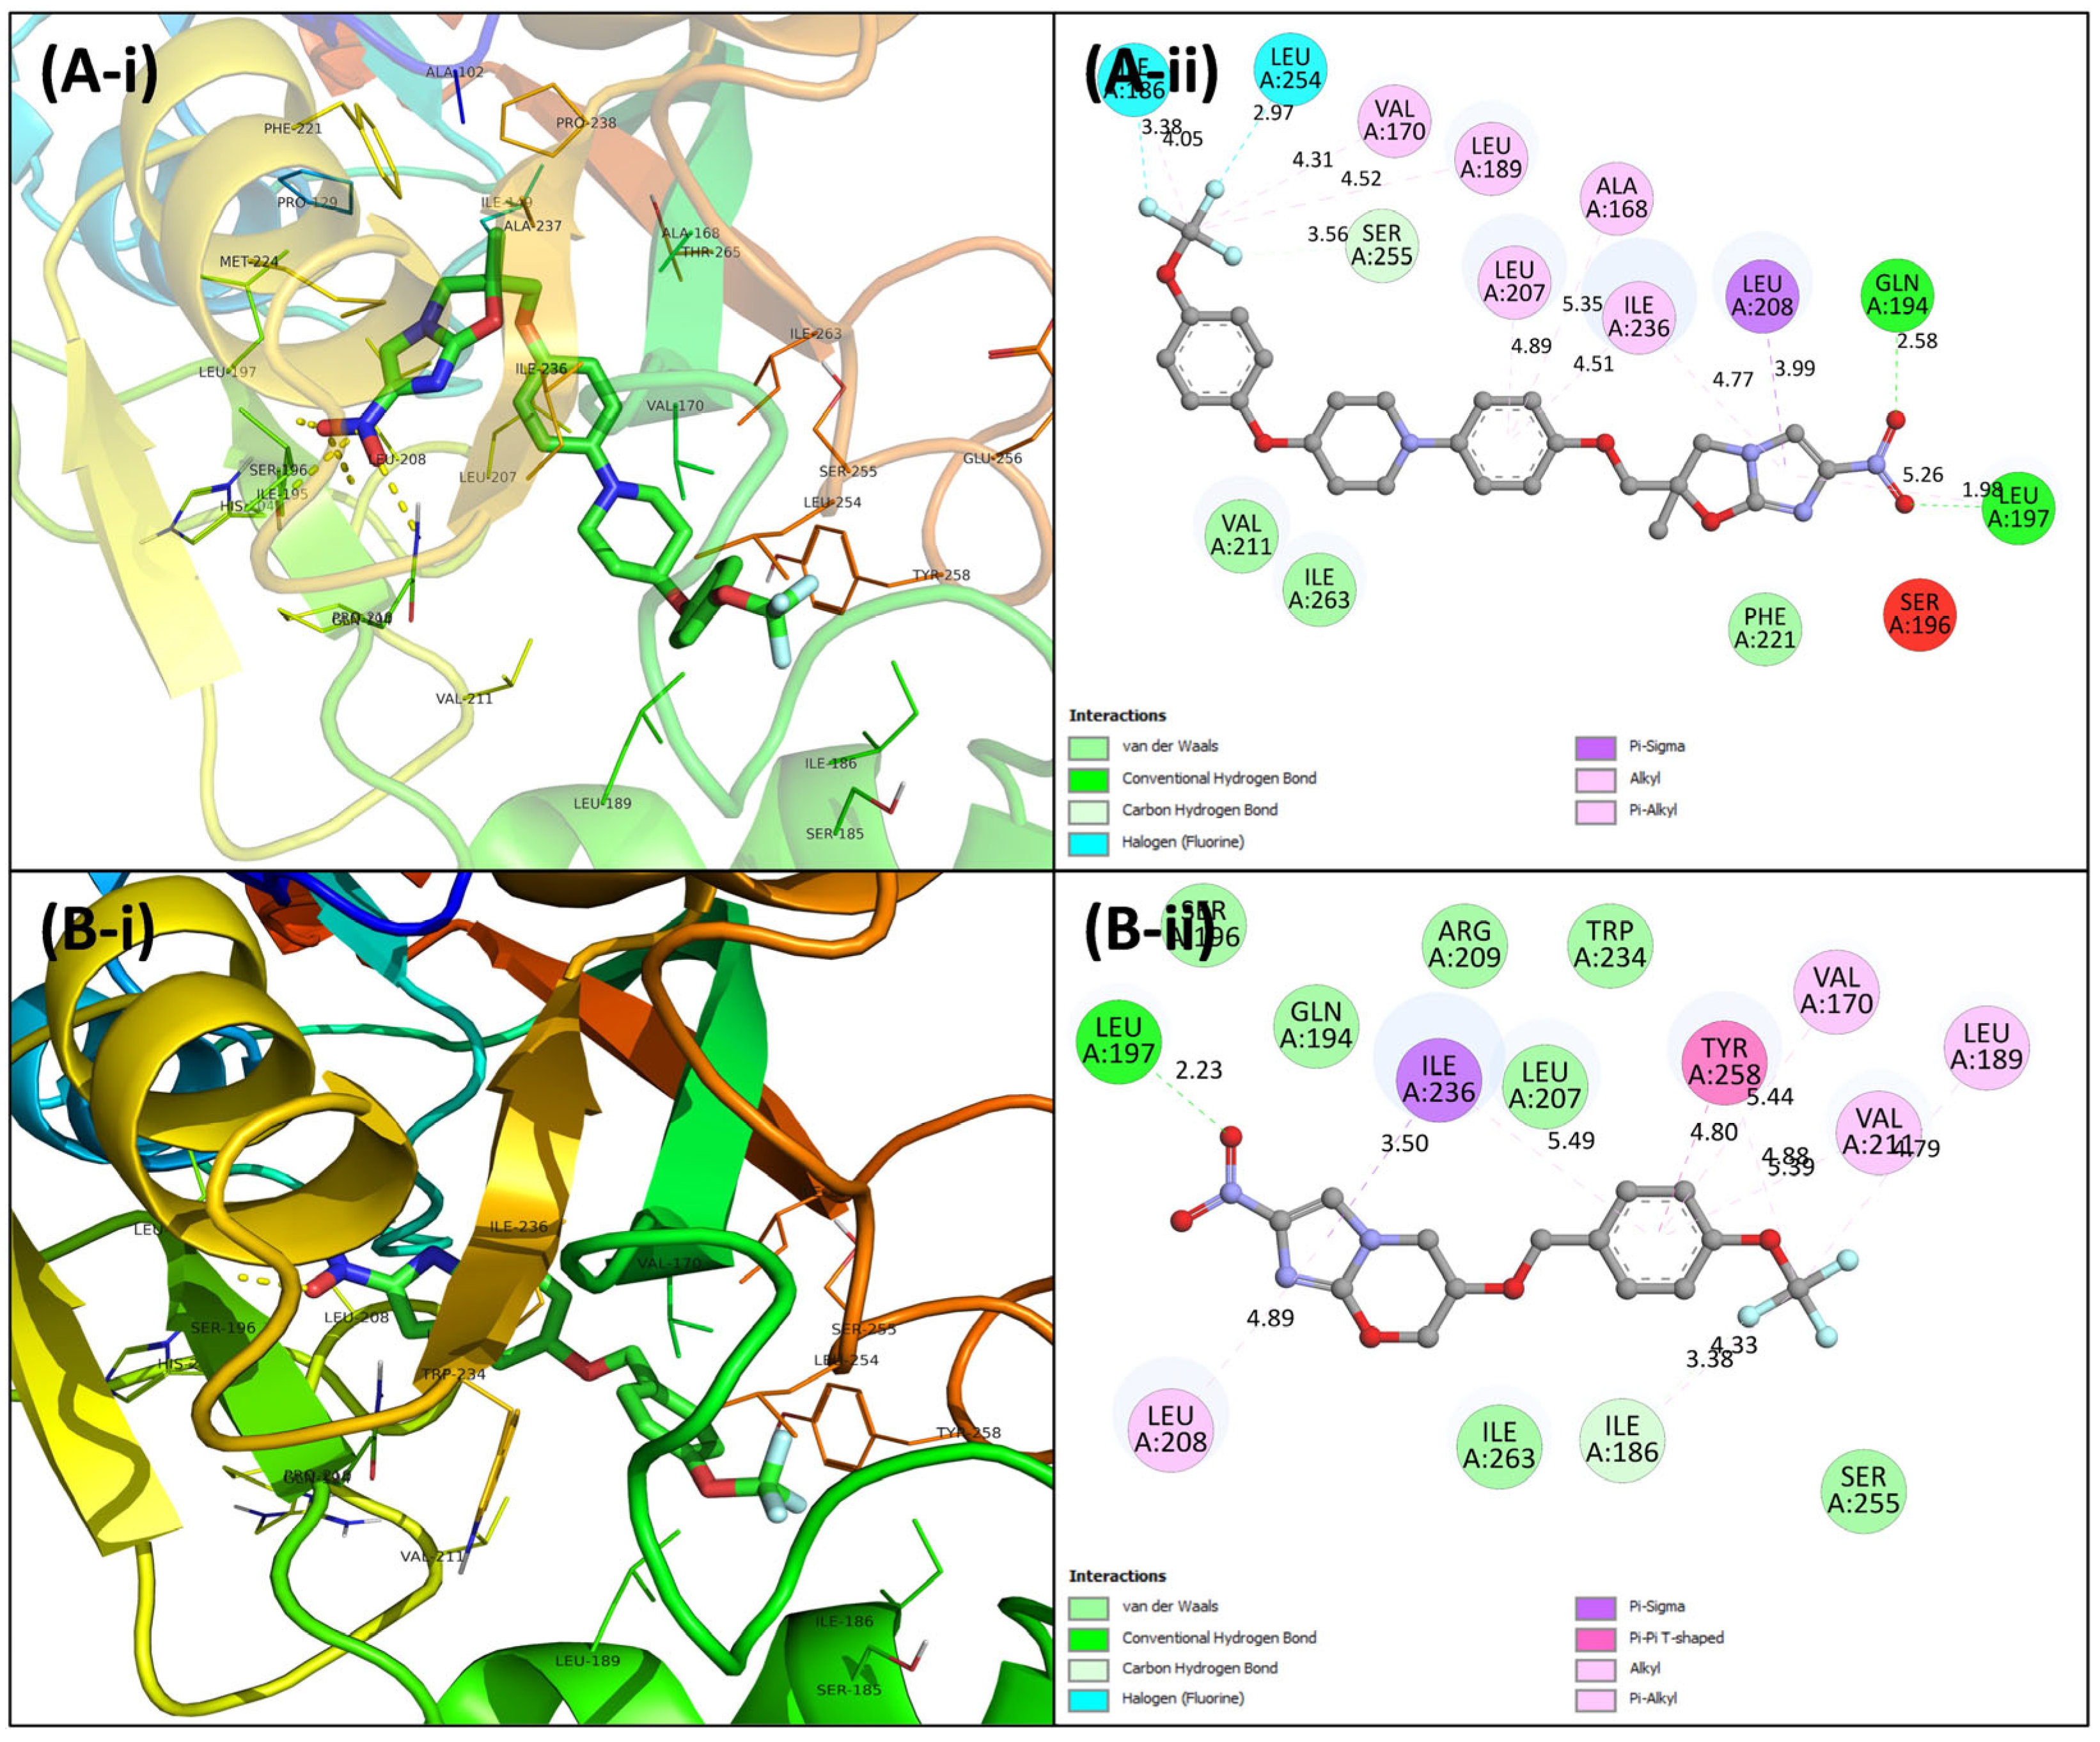
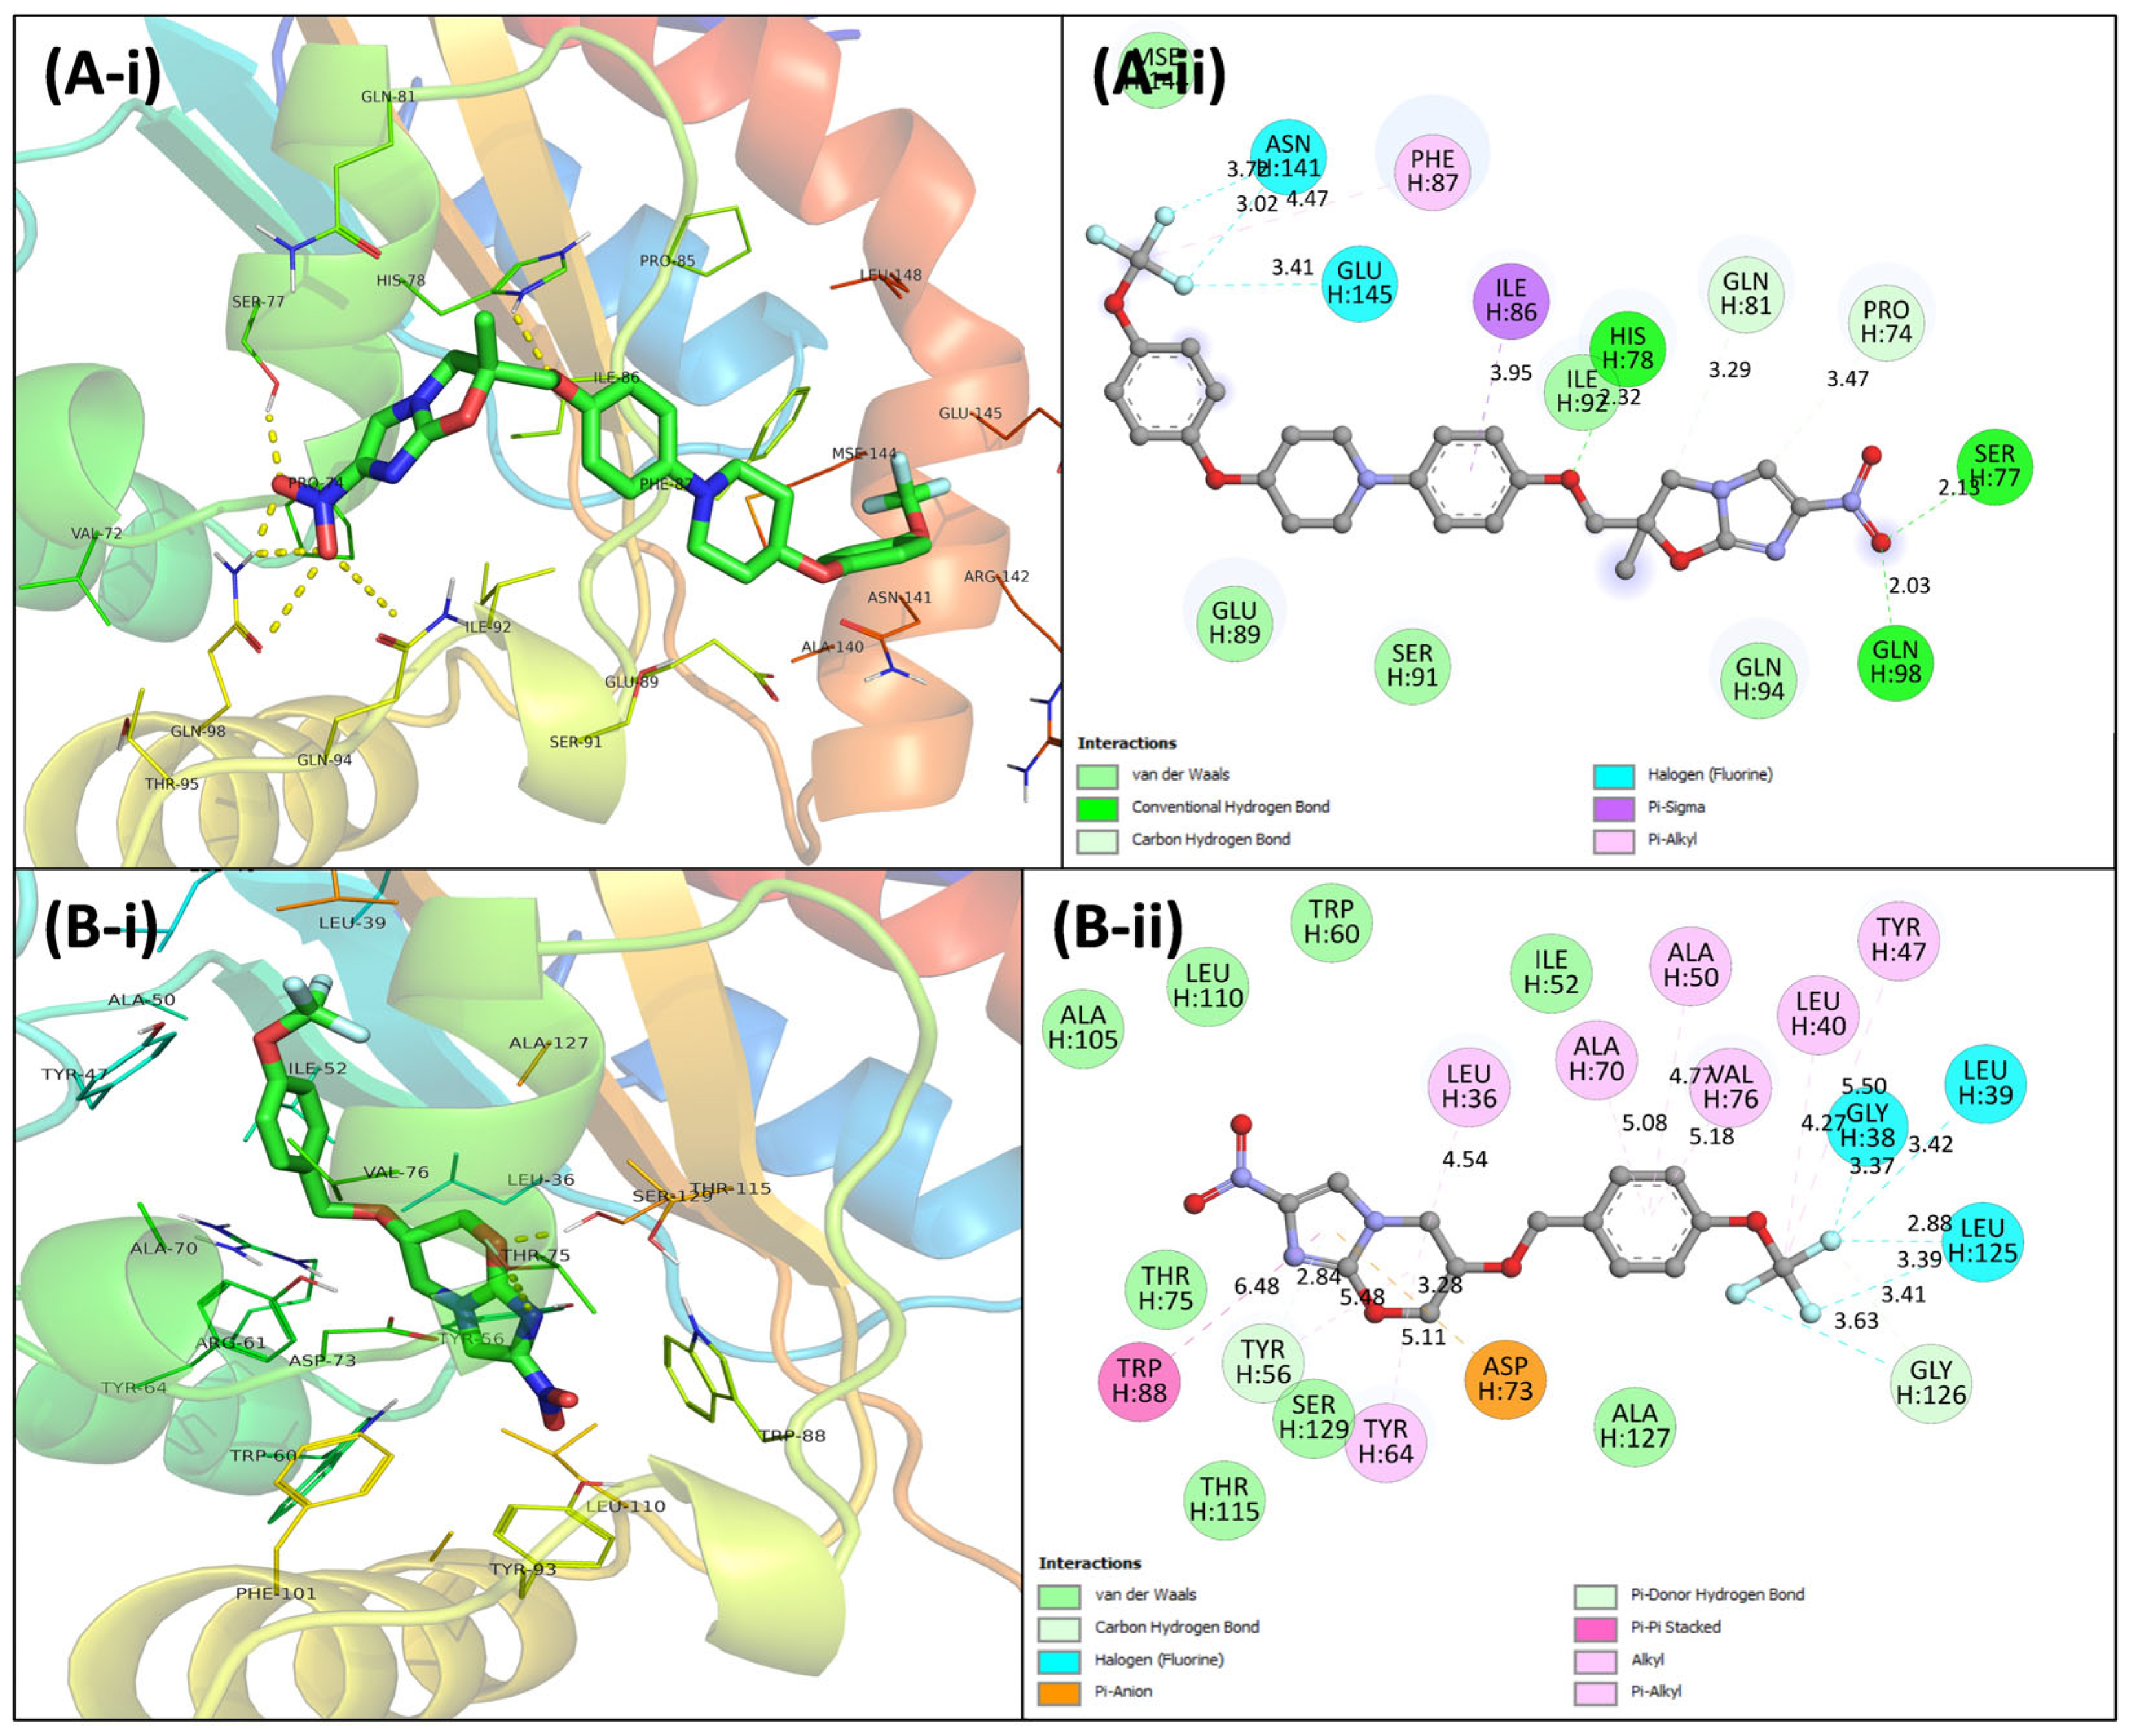
3.4. Virtual Screening Using Molecular Docking

First, the docking method was validated and then these parameters were used in virtual screening of 14 antimycobacterial drugs against 5 distinct QS targets of P. aeruginosa. The comprehensive dataset, inclusive of binding energies, inhibition constants, binding constants, and identified binding sites, is presented in Table 4. Within the spectrum of drugs tested, delamanid emerged with the highest energy for LasI, showcasing a strong affinity, having binding energy of −9.1 kcal/mol. Delamanid displayed the highest affinity for LasA also, while pretomanid demonstrated the maximum affinity for LasR among all drugs. Delamanid was also found to exhibit higher affinities towards PqsR and RhlR among all tested antimycobacterial drugs, with binding energies −9.6 and −7.3 kcal/mol, respectively. Considering the average binding affinity, two specific antimycobacterial drugs—delamanid and pretomanid—stood out as lead candidates. In light of these considerations, the ensuing discussion focuses exclusively on the interaction of two lead antimycobacterial drugs with the specified target proteins.
The docking analysis revealed a binding energy of −8.2 kcal/mol for the interaction of delamanid with LasA, analogous to a binding constant (Kb) of 2.03 × 10⁶ M−1. The binding energy less than −8 kcal/mol obtained by molecular docking is considered to be a strong affinity between the ligand and protein. Delamanid was successfully docked at LasA’s active site. The resulting LasA–delamanid complex was stabilized by three hydrogen bonds with Asn25 and Gln66 (Figure 1A). The complex showed van der Waals forces that involved Glu112, Asn78, His120, His23, His122, Asp36, Asn20, and Phe172, while hydrophobic forces involved Tyr80 and Tyr151. Delamanid also made one ionic bond with His81 of LasA. The energy for the complexation of pretomanid with LasA was −7.4 kcal/mol, and the complex is illustrated in Figure 1B. In the LasA–pretomanid complex, three hydrogen bonds were found with Ser115, His23, and Asn20. Further stabilization ensued via van der Waals interactions (His120, His23, Tyr80, and Asn25) and hydrophobic forces (Trp41, Phe172, and Tyr151). LasA is known for its proteolytic and elastolytic functions [50]. Operating as staphylolytic endopeptidase, LasA is known to cleave the pentaglycine bridge of peptidoglycan, alongside exhibiting elastinolytic activity [51]. Previous research documented the interaction of plumbagin with LasA, displaying binding energy of −7.3 kcal/mol, with interacting residues in this case were Arg12, Trp117, Tyr39, Tyr49, and Tyr15 [52]. These findings enrich our understanding of the molecular interactions of delamanid and pretomanid with LasA, shedding light on the potential therapeutic implications of these interactions.
LasI, an AHL synthase integral to P. aeruginosa, serves a key role in generating the autoinducer molecule crucial for QS [53]. The docking of delamanid with LasI yielded free energy of −9.1 kcal/mol, and the complex is depicted in Figure 2A. Delamanid engaged in the formation of five hydrogen bonds with Arg30, Lys31, Ala106, Thr144, and Phe105 of LasI. The ensuing stability of the LasI–delamanid complex was augmented by van der Waals bonds (involving Gln25, Val148, and Thr145) and hydrophobic forces (involving Ile170, Phe27, Trp33, and Val26). Likewise, the binding energy for the LasI–pretomanid complex was −7.9 kcal/mol, as depicted in Figure 2B. Within this complex, pretomanid established six hydrogen bonds with Ser109, Thr144, Phe105, Arg30, Val26, and Ile107, featuring distinct bond lengths. Additionally, van der Waals forces exerted influence through interactions with Asn108, Gln25, Thr145, Val148, Trp33, and Phe27. Hydrophobic bonds were formed with Phe105, further contributing to the overall stabilization of the complex. A study on the phytocompounds of green tea has found that estragole interacted with Trp33, Phe105, and Phe27, of LasI via hydrophobic forces [54]. A closer examination of the crystal structure highlights the pivotal role played by the LasI’s N-terminal residues, particularly Arg30, Trp33, and Phe27, in shaping the S-adenosyl methionine (SAM) pocket. Additionally, Phe105 is a conserved amino acid with essential contributions to the acyl-chain binding tunnel [53]. In previous research, the interaction of coumarin with key residues such as Arg30, Phe105, Trp69, Ile107, Phe117, and Val148 of LasI was documented, featuring −5.7 kcal/mol binding energy [55]. These insights enhance our understanding of the complex molecular interplay between LasI and the lead antimycobacterial drugs, offering valuable perspectives on potential therapeutic applications.
PqsR, functioning as a quorum-sensing (QS) receptor, undergoes activation by binding of HHQ and PQS, crucially controlling the pathogenicity in P. aeruginosa [56]. In the interaction between delamanid and PqsR, −9.6 kcal/mol binding energy was observed. The interaction diagram for the PqsR–delamanid complex is presented in Figure 3A. This complex found stability through three hydrogen bonds with Gln195, Leu197, and Ser255. Additionally, van der Waals bonds (involving Val211, Ile263, and Phe221) and hydrophobic forces (involving Val170, Leu189, Leu207, Ala168, Ile236, and Leu208) further contributed to its stability. For the PqsR–pretomanid complex, the binding energy was determined to be −7.8 kcal/mol, and the corresponding binding constant value was calculated as 5.25 × 10⁵ M−1 (Figure 3B). Within this complex, Leu197 and Ile186 made hydrogen bonds with pretomanid. The stability of complex was further sustained by hydrophobic interactions (involving Leu208, Ile236, Tyr258, Val170, Val211, and Leu189) and van der Waals interactions (involving Ser196, Gln194, Arg209, Trp234, Leu207, Ile263, and Ser255). A study on virtual screening of beta-lactam antibiotics have found that azlocillin interacted with PqsR, in which Arg209, Asn206, Leu207, Ile263, Leu208, Ala168, Trp234, Tyr258, Leu189, Val211, Val170, and Ile236 were found as the interacting residues and −7.5 kcal/mol binding energy [57]. Research on PQS biosynthetic pathways has revealed that PqsR plays a regulatory role in the polycistronic operon (pqsABCDE), housing the major synthase genes [58]. Importantly, both the antimycobacterial drugs, delamanid and pretomanid, demonstrated interactions at active/inhibitor-binding site of PqsR. This suggests that the binding of these drugs with PqsR may potentially lead to downregulation of downstream genes controlled by this transcriptional regulator. This finding aligns with previous results where umbelliferone interacted with specific residues such as Ile249, Ala102, Pro238, Leu208, Ala168, Leu207, and Ile236 of PqsR, docked at active sites [59]. These insights contribute to a deeper understanding of the molecular interactions of delamanid and pretomanid with PqsR, offering implications for potential therapeutic interventions.
RhlR, a transcriptional regulator in P. aeruginosa, assumes a pivotal role in activating the transcription of various virulence genes through its complexation with butanoyl-homoserine lactone [60]. Examining the interaction between delamanid and RhlR revealed a binding energy of −7.3 kcal/mol. The interaction diagram for the RhlR–delamanid complex is visually depicted in Supplementary Materials Figure S1A. The complex’s stability was achieved through one hydrogen bond with Trp10. Furthermore, van der Waals forces (involving Leu14, Glu34, Arg37, Leu9, Arg154, and Gly6) and other interactions (involving Ile151, Leu38, Aglu150, and Glu147) contributed to this complex. These insights underscore delamanid’s potential as an inhibitor of RhlR-mediated QS. For the RhlR–pretomanid complex, the binding energy was determined to be −6.3 kcal/mol, accompanied by a binding constant value of 4.18 × 10⁴ M−1 (Supplementary Materials Figure S1B). Within this complex, Phe53 and Asn177 formed hydrogen bonds with pretomanid. Stability was further bolstered by hydrophobic forces (involving Leu230 and Tyr234) and van der Waals interactions (involving Ala233, Thr229, and Ile52). These revelations accentuate the potential of delamanid and pretomanid as candidates for inhibiting RhlR-mediated processes, providing nuanced insights into their therapeutic applications against P. aeruginosa infections.
In addition to this, the docking analysis revealed that energy of delamanid with LasR was −8.3 kcal/mol, binding constant as 1.22 × 10⁶ M−1. To validate the docking procedure, redocking of 3O-C12-HSL to LasR yielded a free energy of −8.4 kcal/mol, consistent with previously reported values [61]. Delamanid formed hydrogen bonds with His78, Gln98, Ser77, Gln81, and Pro74 at bond lengths of 2.82, 2.03, 2.13, 3.29, and 3.47 Å, respectively (Figure 4A). Surrounding amino acids, including Ser91, Gln94, Glu89, Mse144, and Ile92, contributed to van der Waals interactions with delamanid. Additionally, delamanid was engaged in hydrophobic interactions with Phe87 and Ile86. The docking analysis showed that pretomanid docked in the same binding cavity in LasR as 3-oxo-C12-HSL, i.e., natural ligand (Figure 4). Given that the binding of LasR and 3-oxo-C12HSL initiates the expression of QS-controlled virulent genes in P. aeruginosa [62], the competition of molecules like delamanid with 3-oxo-C12HSL should result in a reduction in the production of QS-mediated factors [63].

3.5. Molecular Dynamics Simulations

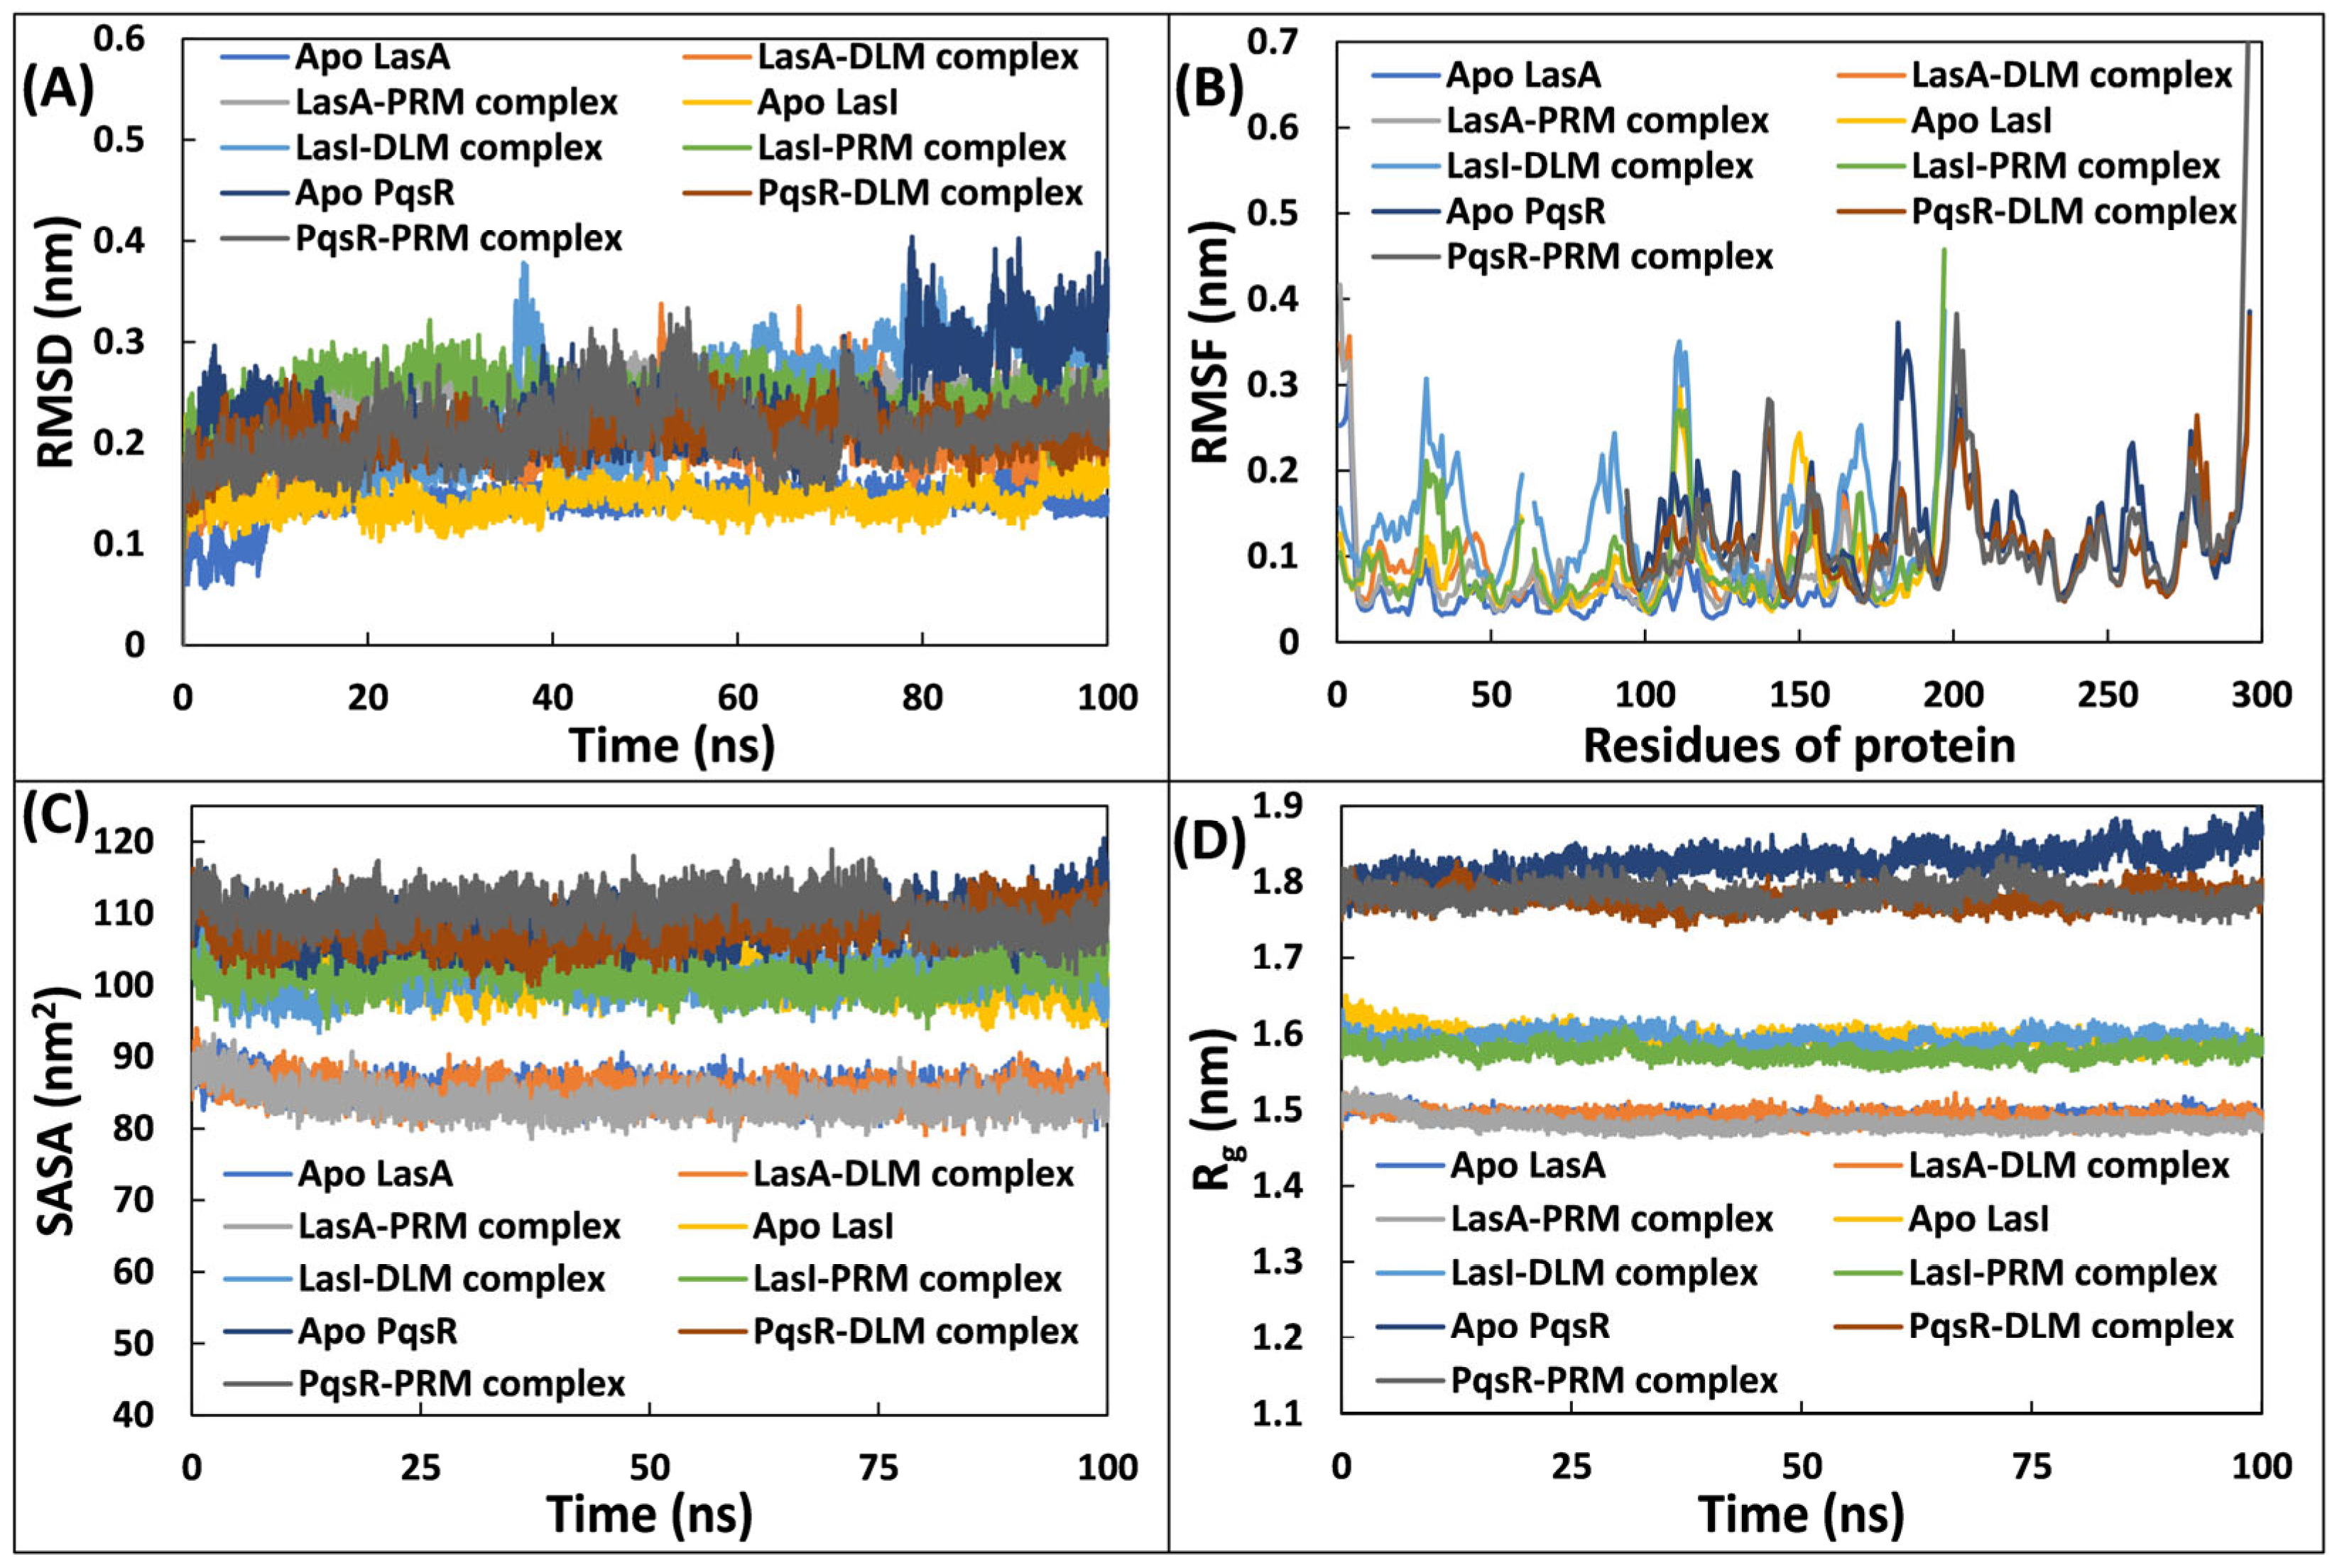
3.5.1. Examination of Deviations and Fluctuations

The selection of the most potent antimycobacterial drugs (delamanid and pretomanid) was based on molecular docking’s average binding energy. Subsequently, these antituberculosis drugs were simulated. Control simulations were run for all proteins without ligands. The initial analysis simulation data involved RMSD calculation in comparison to their initial structures. The RMSD provides insights into the system’s stability during MD simulation. Figure 5A depicts RMSD, showing that the systems attained equilibrium within the first few nanoseconds of the simulation [64]. Average RMSD of apo LasA was 0.141 nm. Likewise, the RMSDs of LasA–delamanid complex and LasA–pretomanid complex were 0.191 and 0.247 nm, respectively. This slight differences in the RMSDs between the apo LasA and LasA–delamanid complexes indicate the stability of the delamanid with the protein. The LasA–pretomanid complex exhibited slightly higher RMSD which may be due to movement of pretomanid at the binding site. Similar results were observed for PqsR, with average RMSDs of 0.144, 0.241, and 0.246 nm for the apo LasI, LasI–delamanid complex, and LasI–pretomanid complex, respectively. This is consistent with the previous literature, where stable complexes were formed in molecular dynamics simulations [59]. The average RMSDs of apo PqsR, the PqsR–delamanid complex, and the PqsR–pretomanid complex were 0.235, 0.208, and 0.209 nm, respectively. It is worth noting that the RMSD of PqsR was decreased in presence of delamanid and pretomanid, suggesting that these ligands stabilized the protein.
The RMSF of the Cα residues was calculated to assess the fluctuation in residues of the test proteins and their complexes (Figure 5B). The RMSF values were generally <0.20 nm, denoting the system’s stable nature with minimal fluctuations in residues. Spikes in RMSF is associated with dynamic fluctuations in coils and loops within an aqueous environment [65]. The RMSF values for all complexes remained similar to that of respective apo proteins. For example, average RMSF for apo PqsR was 0.133 nm, which remained nearly the same after complexation with delamanid (0.117 nm) and pretomanid (0.122 nm). The RMSF data verify the stability of both antimycobacterial drugs complexes [66]. Similarly, the RMSF of atoms of delamanid and pretomanid were below 0.2 nm, reflecting some movements at the binding/active site of target proteins [67]. The data also suggest that the antimycobacterial drugs exhibited some dynamic shifts from their initial positions at active site, possibly due to alterations in interactions at the binding site or the rotation of ligands flexible bonds [64]. Importantly, the two antimycobacterial drugs interacted at active sites of target proteins.

3.5.2. Examination of and Physicochemical Parameters Structural Compactness

To ensure further stability, an additional evaluation was undertaken. A comprehensive analysis of physicochemical parameters, encompassing both potential energy and total energy, was carried out, as presented in Supplementary Materials Figure S2. Throughout the simulation, a consistent pattern emerged in the energies of all systems, indicating a sustained and reliable stability in the trajectory. Notably, the potential energies of the drug–protein complexes closely mirrored those of their respective uncomplexed protein counterparts. Furthermore, the total energies of both the drug–protein complexes and the uncomplexed proteins were found to be similar. These detailed assessments collectively underscore the robust stability of the systems under physiological conditions [68].
Furthermore, the SASA for all systems was calculated for entire trajectory, as illustrated in Figure 5C. The average SASA of uncomplexed LasA was approximately 85.480 nm2, which remained nearly constant when complexed with delamanid (85.137 nm2) or pretomanid (83.935 nm2). The average SASAs of apo LasI, LasI–delamanid complex, and LasI–pretomanid complex were 101.161, 101.005, and 101.379 nm2, respectively. Similarly, average SASAs of apo PqsR, PqsR–delamanid complex, and PqsR–pretomanid complex were 108.345, 107.879, and 110.351 nm2, respectively. These findings suggest minimal alterations in SASA when complexed with antimycobacterial drugs, further affirming the system’s stability. The finding corroborates with literature where average SASA of uncomplexed LasI was 101.711 nm2 [57].
The radius of gyration (Rg) values serves as crucial parameters for investigating the structural compactness and the stability during MD simulations [64]. Compact proteins, such as globular ones, typically exhibit minor Rg fluctuations compared to the extended form of proteins. Rg values of uncomplexed and complexed proteins are presented in Figure 5D. The Rg of systems remained constant during the simulation trajectory, indicating their stable nature under physiological conditions [69]. For instance, the average Rg of apo LasA was approximately 1.492 nm. In the presence of ligands (delamanid and pretomanid), the average Rg was not altered. Similarly, very less differences were found in the Rg values of the two other proteins (LasI and PqsR) in complex with the antimycobacterial drugs (delamanid and pretomanid). Previous studies with coumarin and umbelliferone have been documented to form stable complexes with other quorum sensing targets during molecular simulations [55,59].

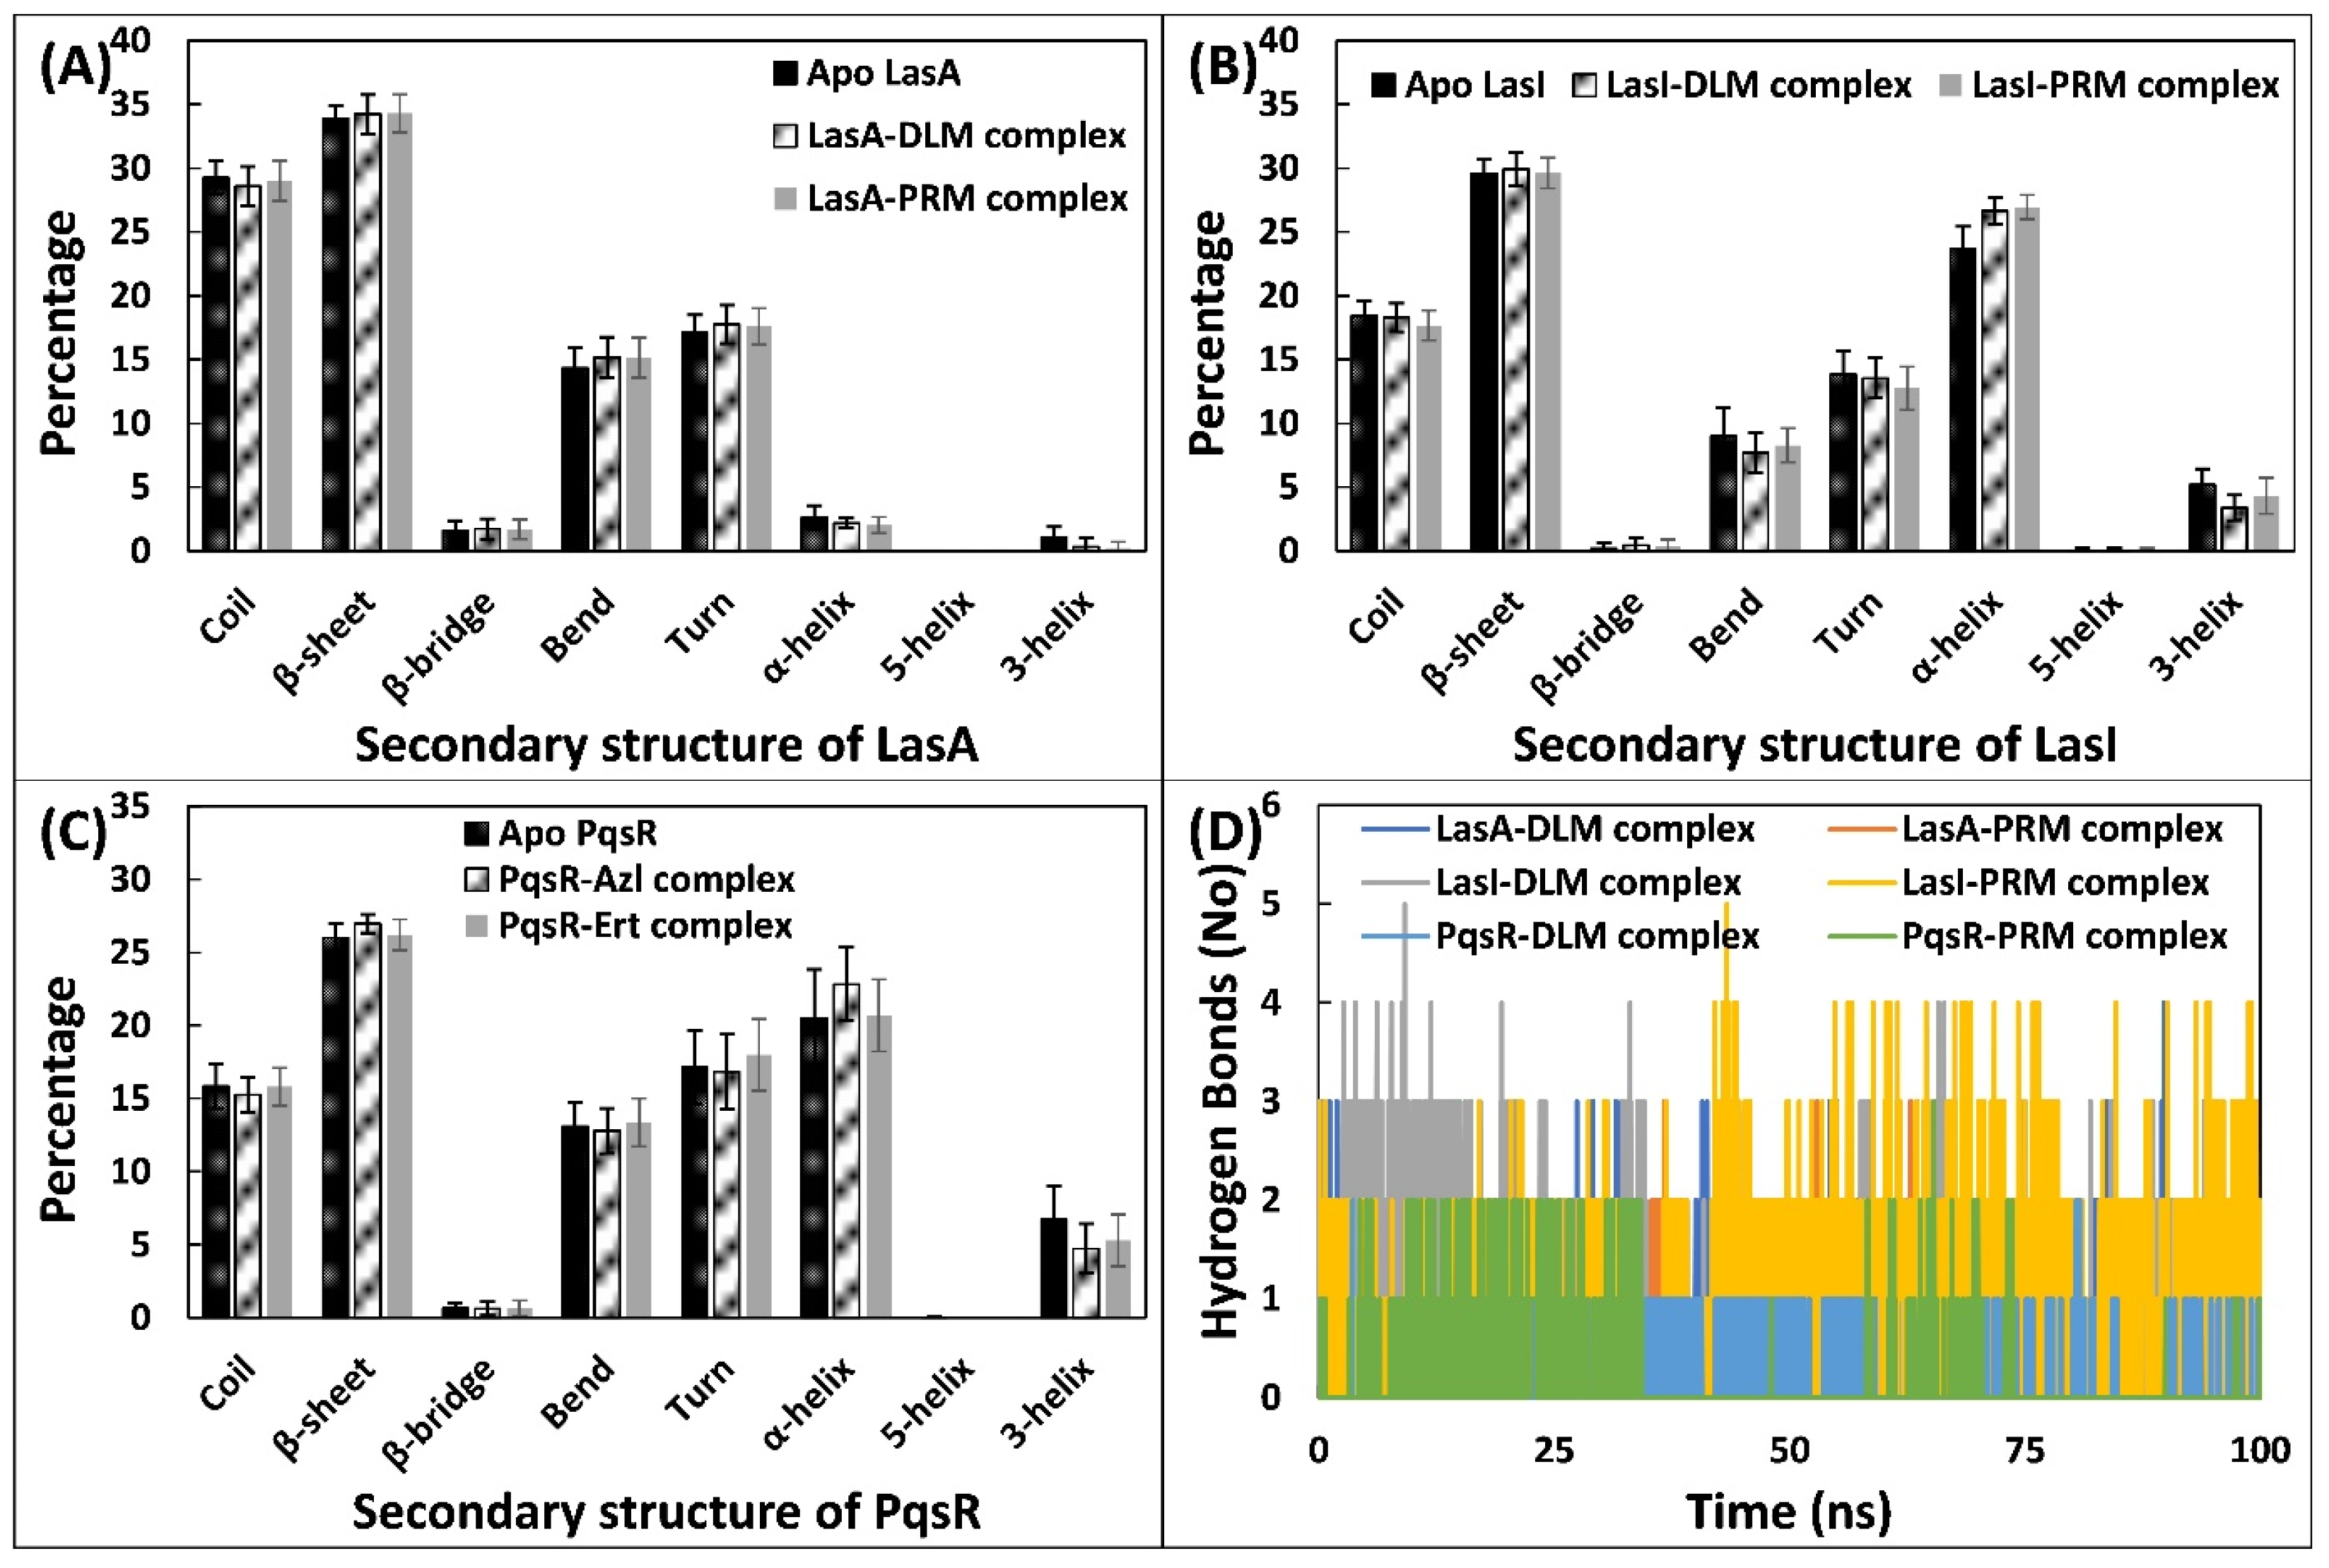
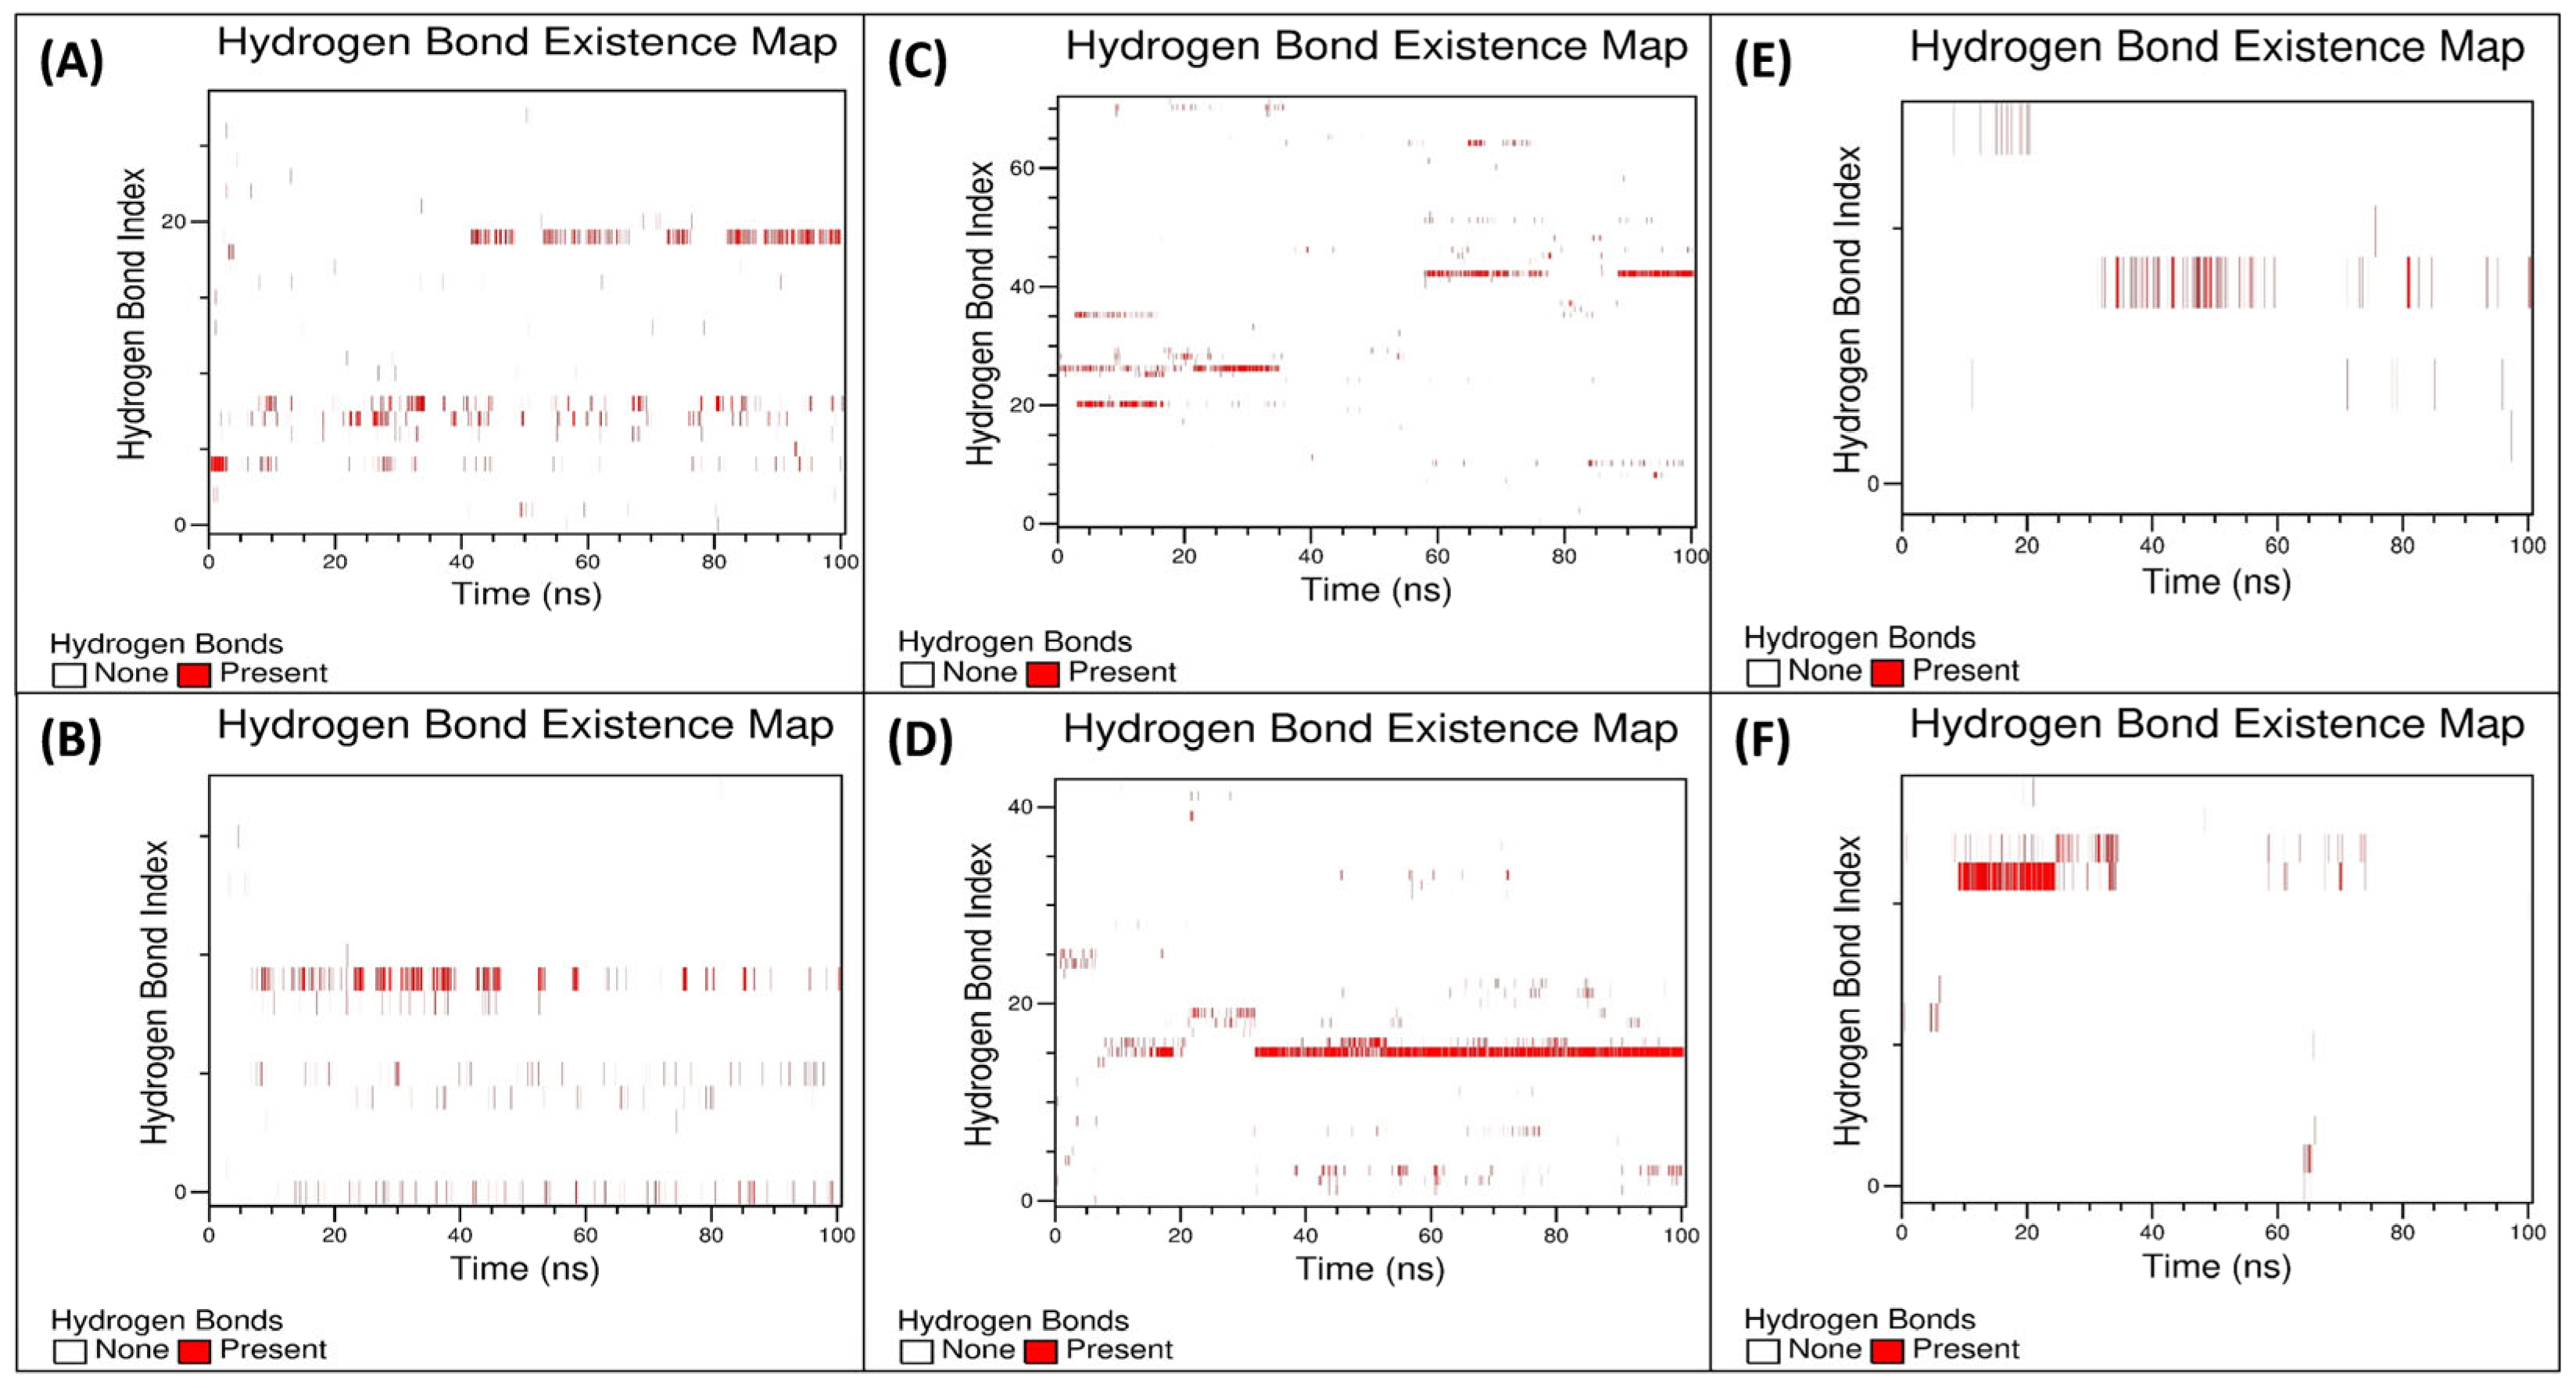
3.5.3. Examination of the Secondary Structural Components and Hydrogen Bonds

The influence of antimycobacterial drugs on the secondary structural stability of proteins (LasA, PqsR, and LasI) was investigated by assessing the secondary structure. Figure 6A–C illustrates each secondary structural component in LasA, PqsR, and LasI in uncomplexed forms and in complex with delamanid and pretomanid. The interaction with lead antimycobacterial drugs, namely delamanid and pretomanid, did not result in major alterations in secondary structure of target proteins. For instance, in uncomplexed LasA, the average amount of β-sheets, coils, β-bridges, bends, turns, 3-helices, and α-helices were determined to be 33.93, 29.25, 1.59, 14.35, 17.17, 1.09, and 2.61%, respectively, which are consistent with the literature [57]. These proportions remained unchanged after complexation with delamanid or pretomanid. Similarly, apo LasI exhibited the mean percentage of β-sheets, coils, bends, turns, 3-helices, and α-helices at 29.59%, 18.42%, 9.01%, 13.83%, 5.21%, and 23.70%, respectively; the data are on par with those in the literature [57]. These percentages showed no significant changes in the LasI–delamanid complex, remaining at 18.29%, 29.93%, 7.69%, 13.56%, 26.64%, and 3.39%, respectively. Similarly, there was negligible effect on the binding of antimycobacterial drugs on the structure of PqsR also. In summary, the presence of tested antimycobacterial drugs (delamanid or pretomanid) did not induce major protein’s secondary structures, affirming and validating the structural integrity target proteins when complexed with antituberculosis drugs.
The analysis of binding between antimycobacterial drugs and target proteins involved the examination of profiles of hydrogen bond and hydrogen bond numbers. Firstly, the number of hydrogen bonds during entire trajectories was calculated (Figure 6D). The average numbers of hydrogen bonds made by delamanid and pretomanid with LasI were 0.68 and 0.91, respectively. Similarly, the average numbers of hydrogen bonds for delamanid and pretomanid with LasA were 0.42 and 0.25, respectively. A comparable outcome was observed in the case of PqsR.
The examination of the patterns of hydrogen bonds indicated the consistent presence of hydrogen bonds during the simulation, as illustrated in Figure 7. The dynamic nature of the interactions between the antimycobacterial drugs and the target proteins was evident from the evolving patterns of these hydrogen bonds over time [70]. Additionally, variabilities in hydrogen bond profiles were observed, which may be due to influence of the water molecules present at ligand binding site [71]. The occupancy of hydrogen bonds was computed for further analysis. In the formation of the LasA–delamanid complex, Ser115 exhibited the maximum hydrogen bond occupancy at 16.9%, followed by Asn25 (8.8%). Similarly, in the complexation of pretomanid with LasA also, Ser115 showed the highest hydrogen bond occupancy. In the binding of delamanid and pretomanid with LasI, Ser109 (20.9%), and Ile107 (61.4%) demonstrated the highest hydrogen bond occupancies, respectively. Likewise, in the interaction of delamanid and pretomanid with PqsR, Gln194 (5.2%), and Thr265 (14.5%) were found to have highest hydrogen bond occupancies, respectively.

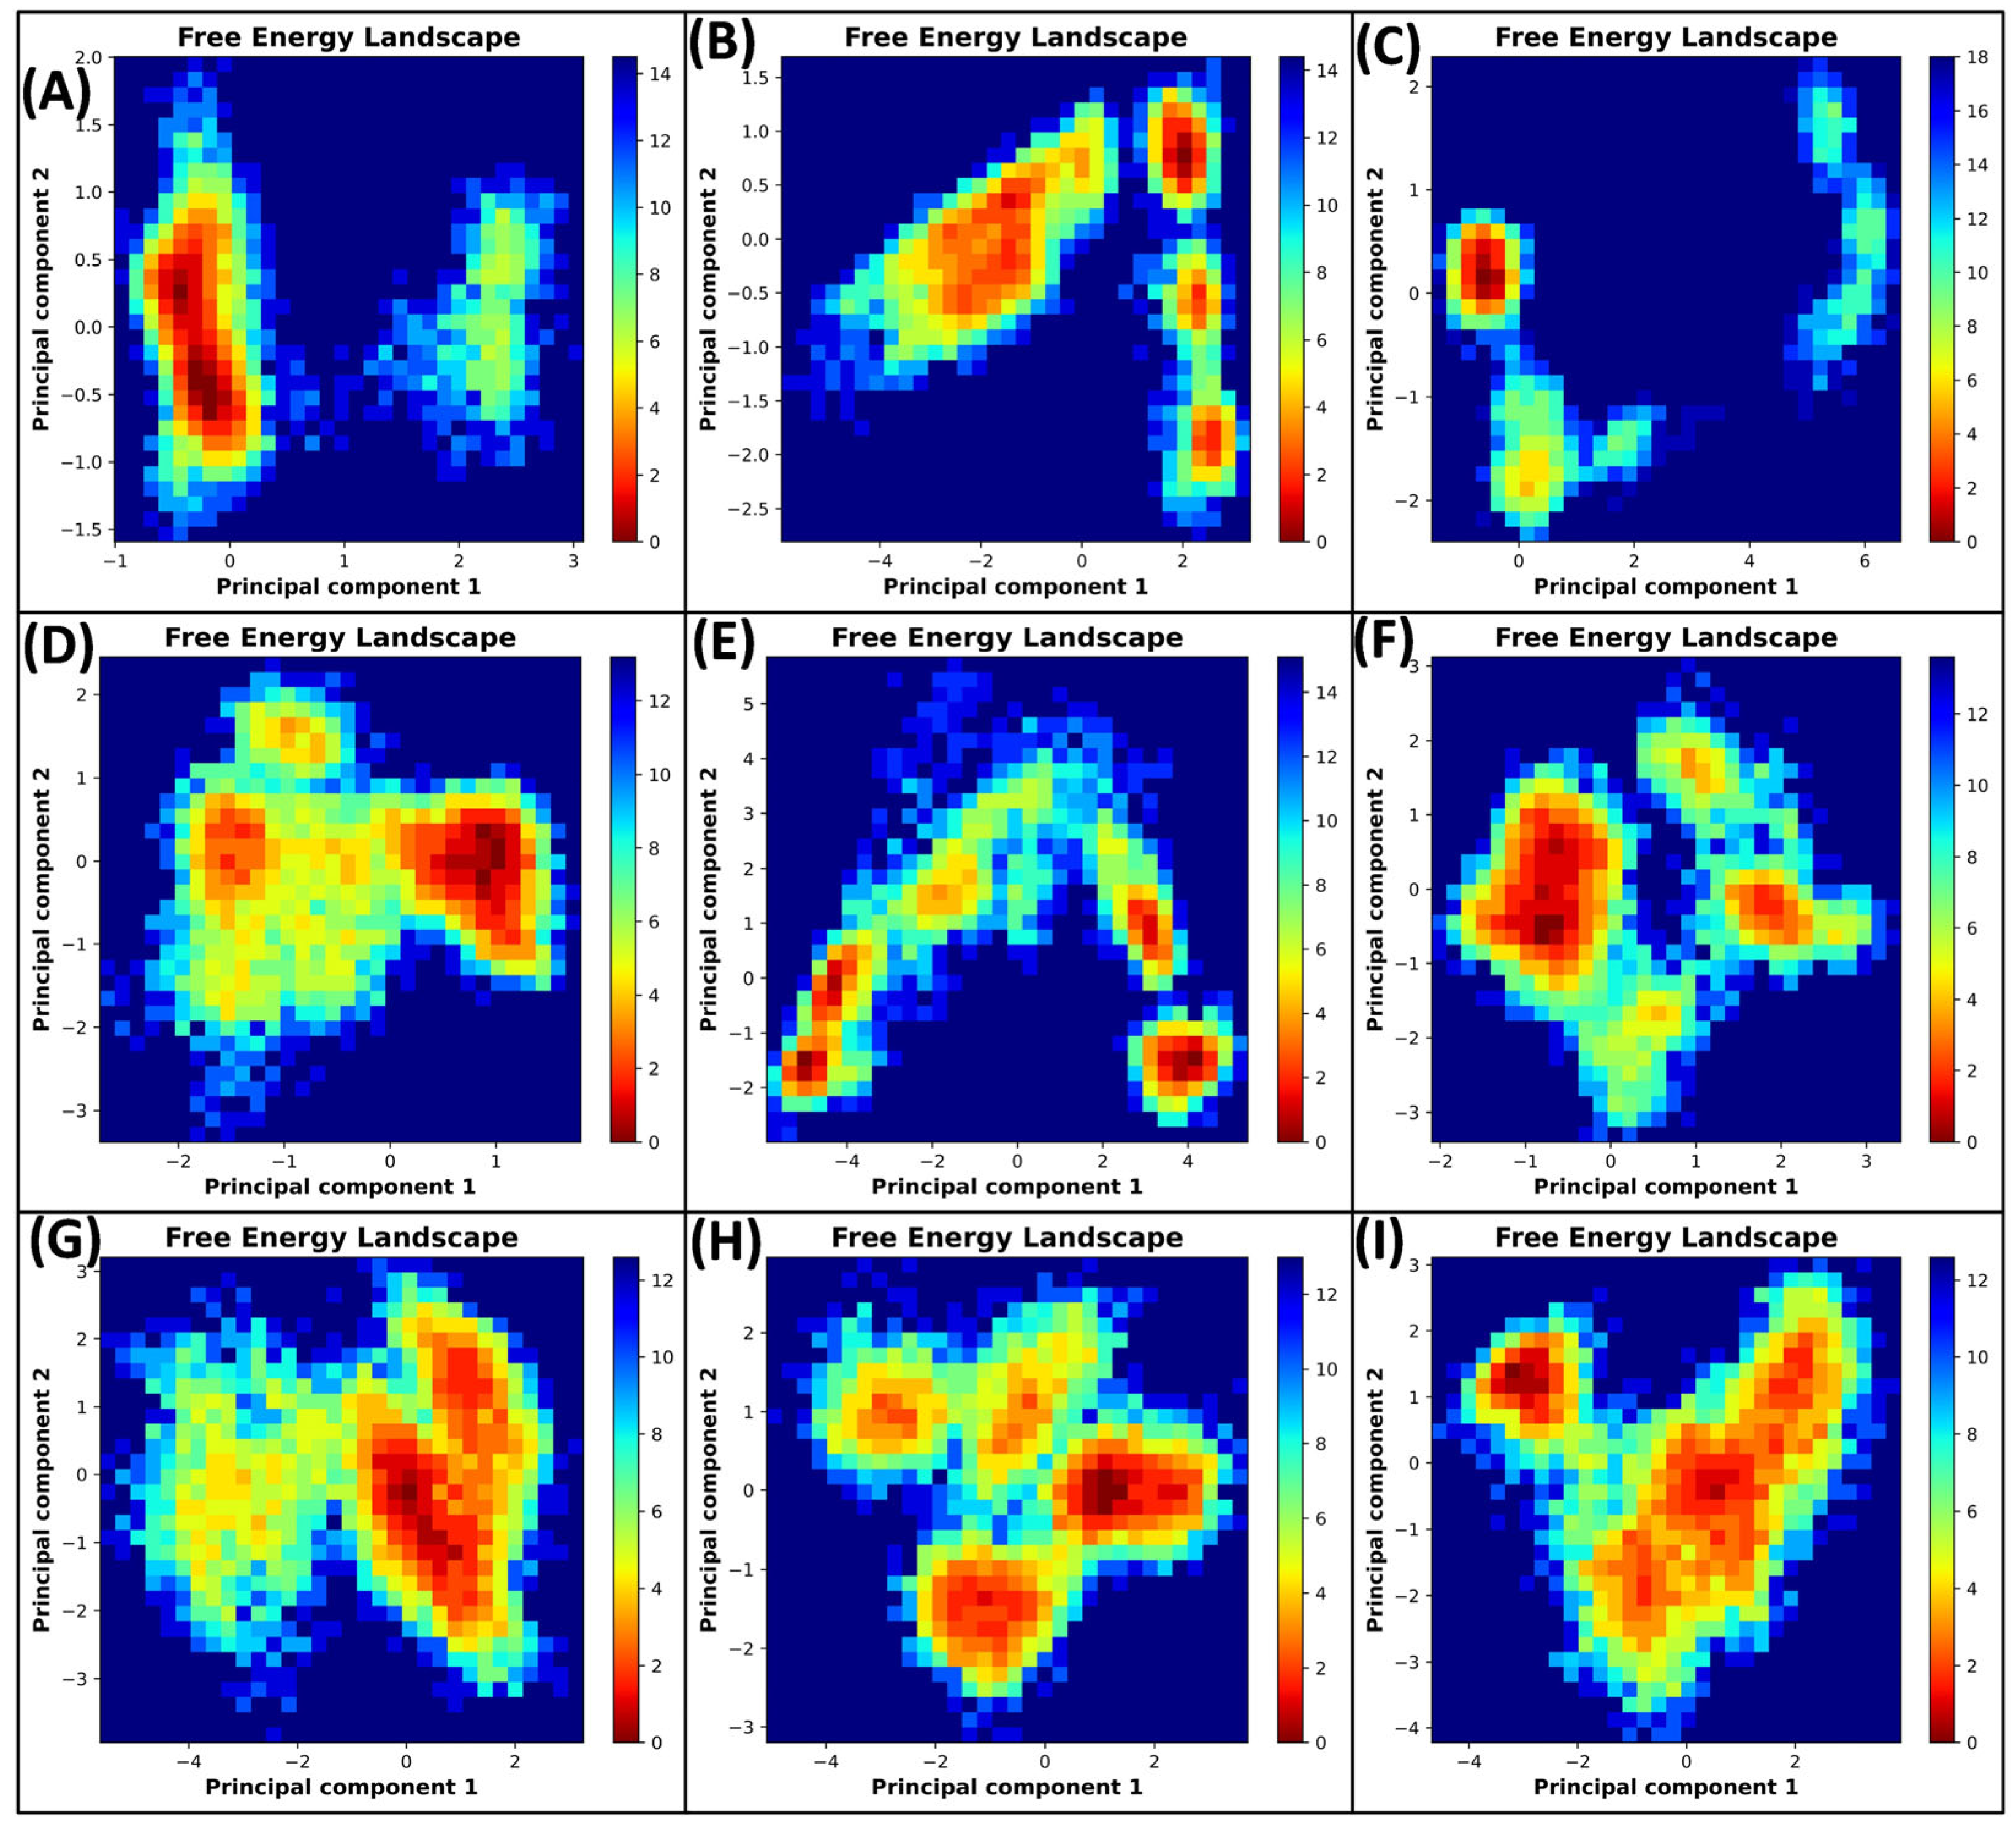
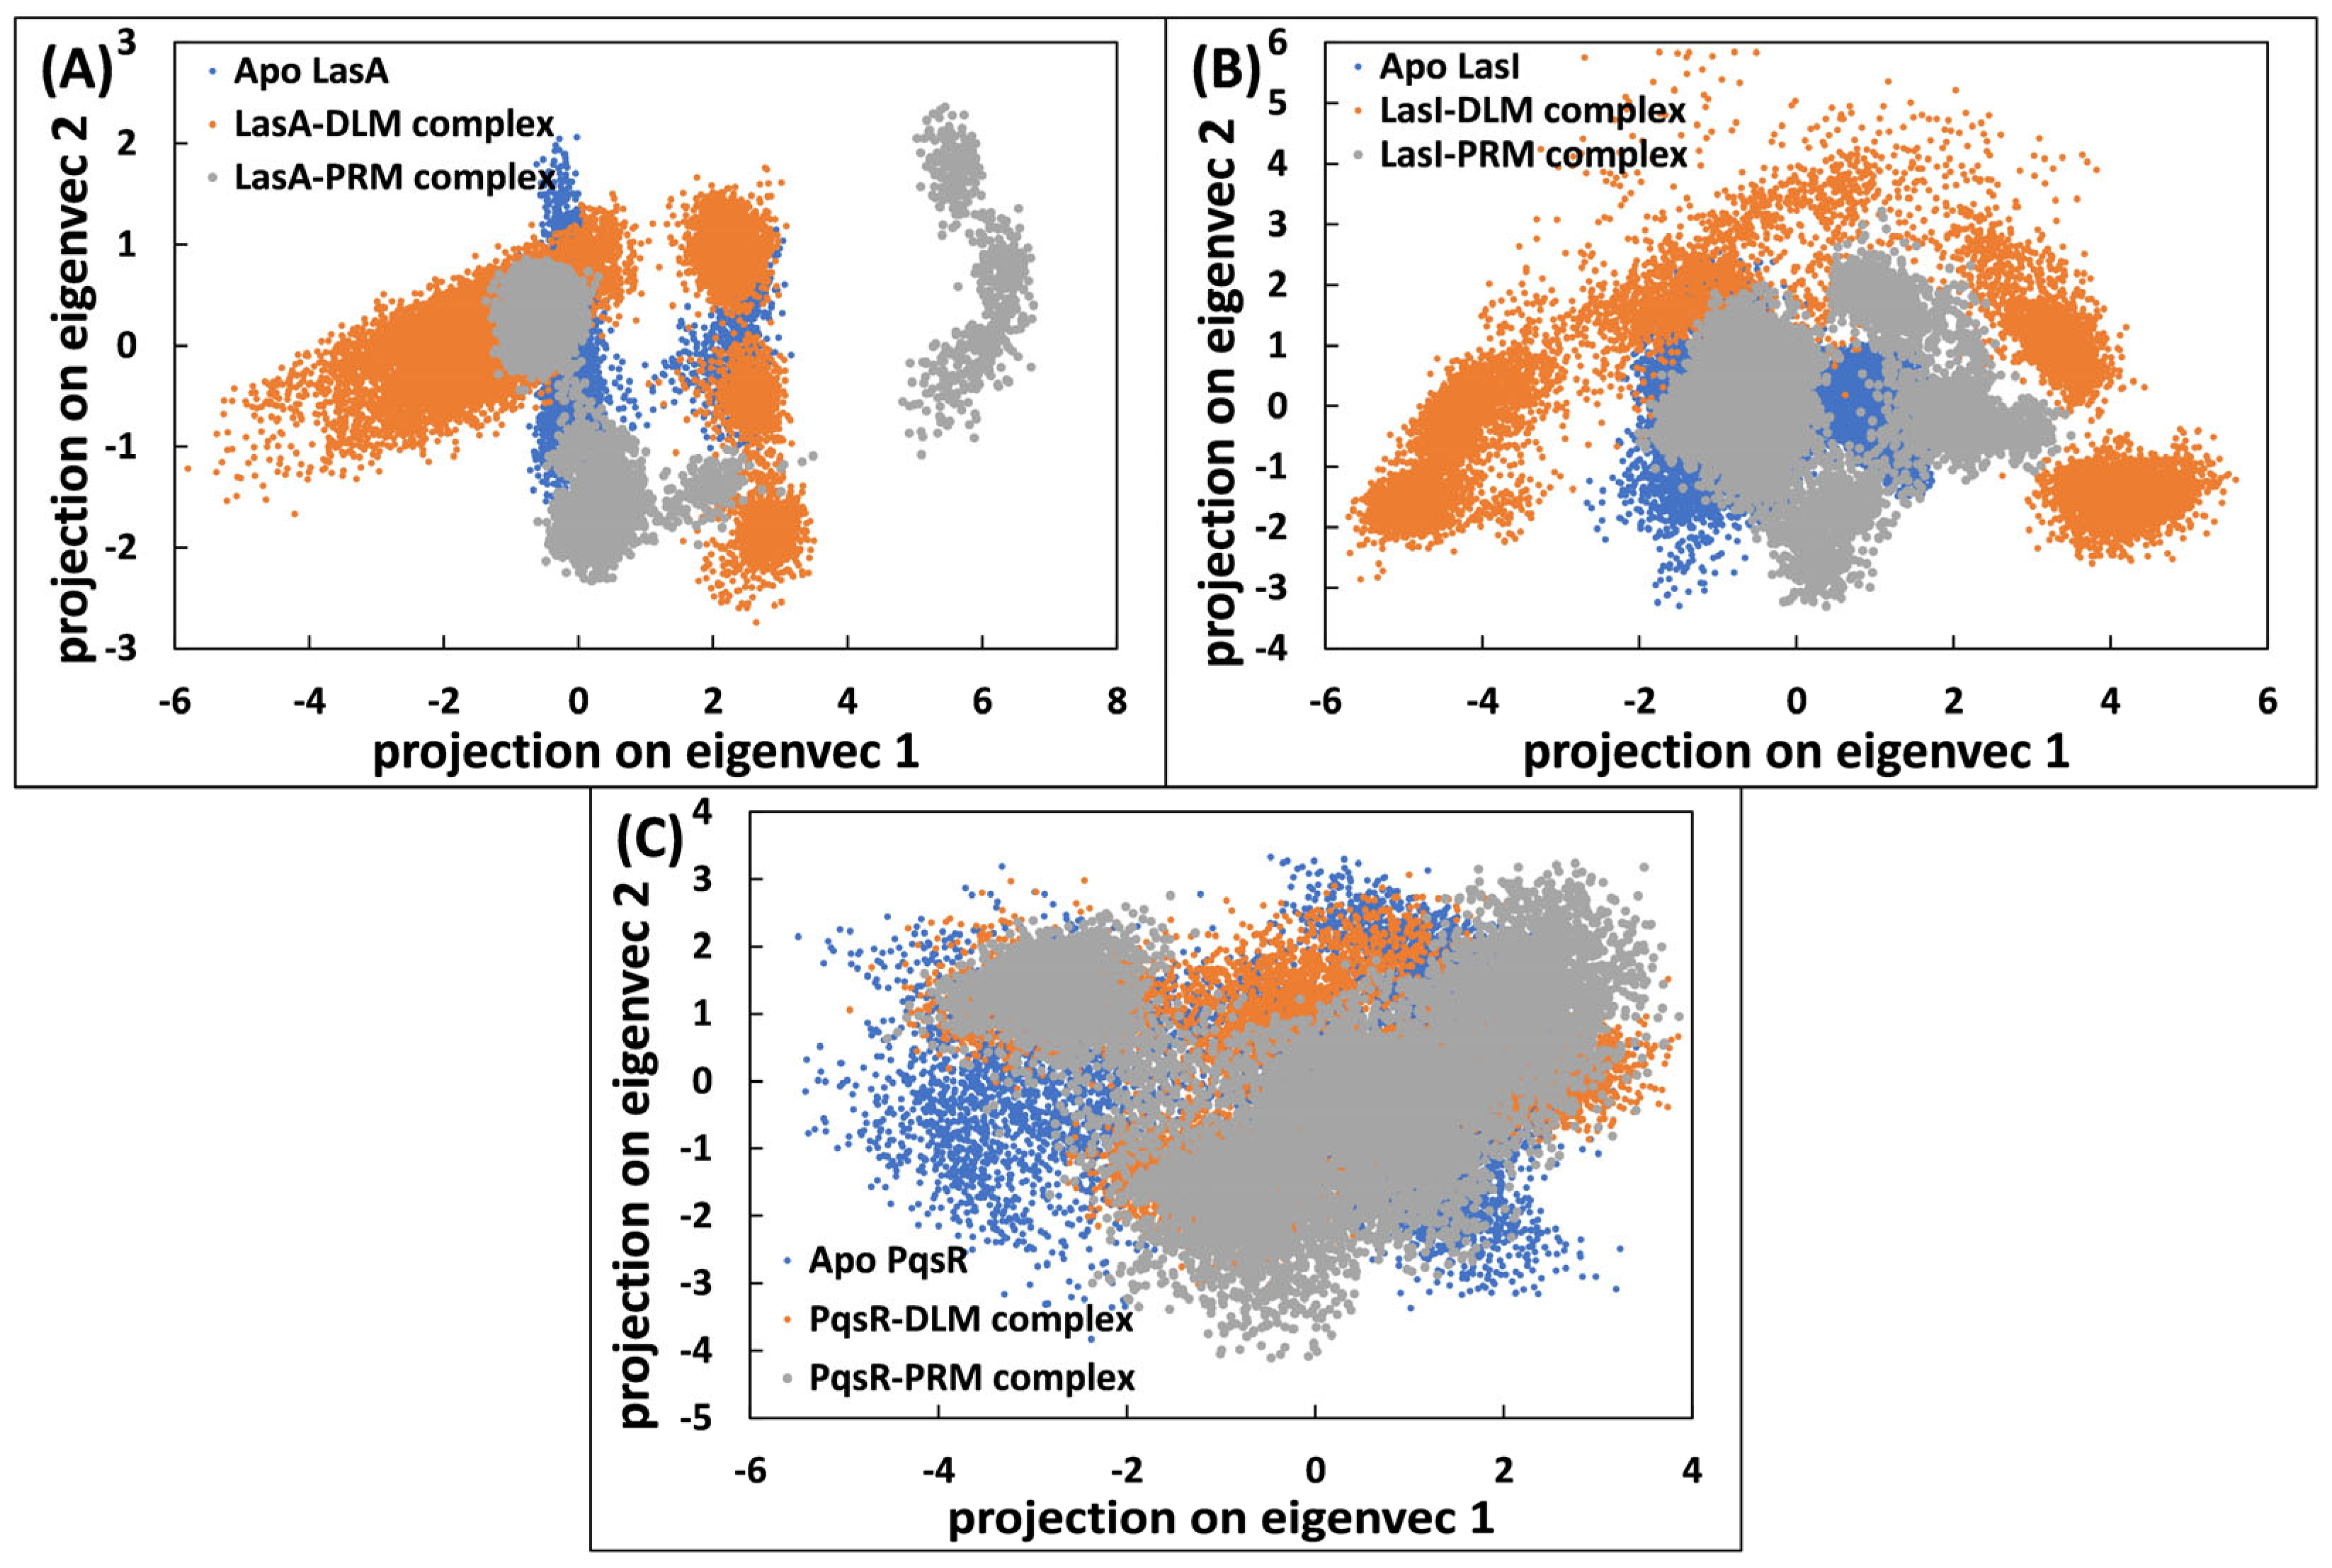
3.5.4. Principal Component Analysis

Principal component analysis (PCA) is a widely employed statistical method for exploring the protein’s extensive dynamics or movements. This analysis reduces dimensionality and gives principal components, termed as eigenvectors [72]. PCA was employed in this study to assess variations in protein’s flexibility in absence and presence of antimycobacterial drugs. The projection of eigenvectors in 2D space is illustrated in Figure 8. In PCA analysis, occupation of wider conformational space shows structural flexibility in proteins.
Both complexes of PqsR took almost the same conformational space in 2D projection when compared to apo PqsR. This indicates that the flexibility in PqsR’s complexes is similar to that of the apo state. However, flexibility in the LasA–delamanid complex and the LasA–pretomanid complex was greater compared to apo LasA. The LasI–pretomanid complex occupied higher conformational space compared to apo LasI and the LasI–delamanid complex. This shows that flexibility of LasI increased following the complexation of pretomanid. FELs (free-energy landscapes) were made utilizing eigenvectors for subsequent analysis. The PCA results provide valuable insights into the dynamic behavior and flexibility of the proteins in the presence of antimycobacterial drugs.
In Figure 9, FELs for all proteins and complexes are displayed. The landscapes show that all systems reached the energy minimum during MD simulations. However, differences in position of energy minima were found, indicating differences in the conformations. In short, slight differences in energy minima of PqsR compared to its complexes suggest that the protein did not undergo major structural transitions following the binding with antimycobacterial drugs [64].
The lowest energy structures, corresponding to the energy minima, were extracted from respective trajectories to make Ramachandran plots (Supplementary Materials Figure S3). Three residues in apo LasA and two residues in the LasA–delamanid complex lied in the generously allowed region, while one residue was found in the generously allowed region in the LasA–pretomanid complex. No residue was found to lie in the disallowed region of LasA either in uncomplexed or complexed form. Similarly, one residue was found in the generously allowed region in apo LasI and only two residues occurred in the generously allowed region in the LasI–pretomanid complex. No residue was found in the disallowed region for apo LasI or both the complexes of LasI. Likewise, residue was found in the disallowed region of PqsR in both the uncomplexed and complexed forms. The findings from the Ramachandran plots further support the structural integrity and stability of the complexes during the molecular dynamic simulations.

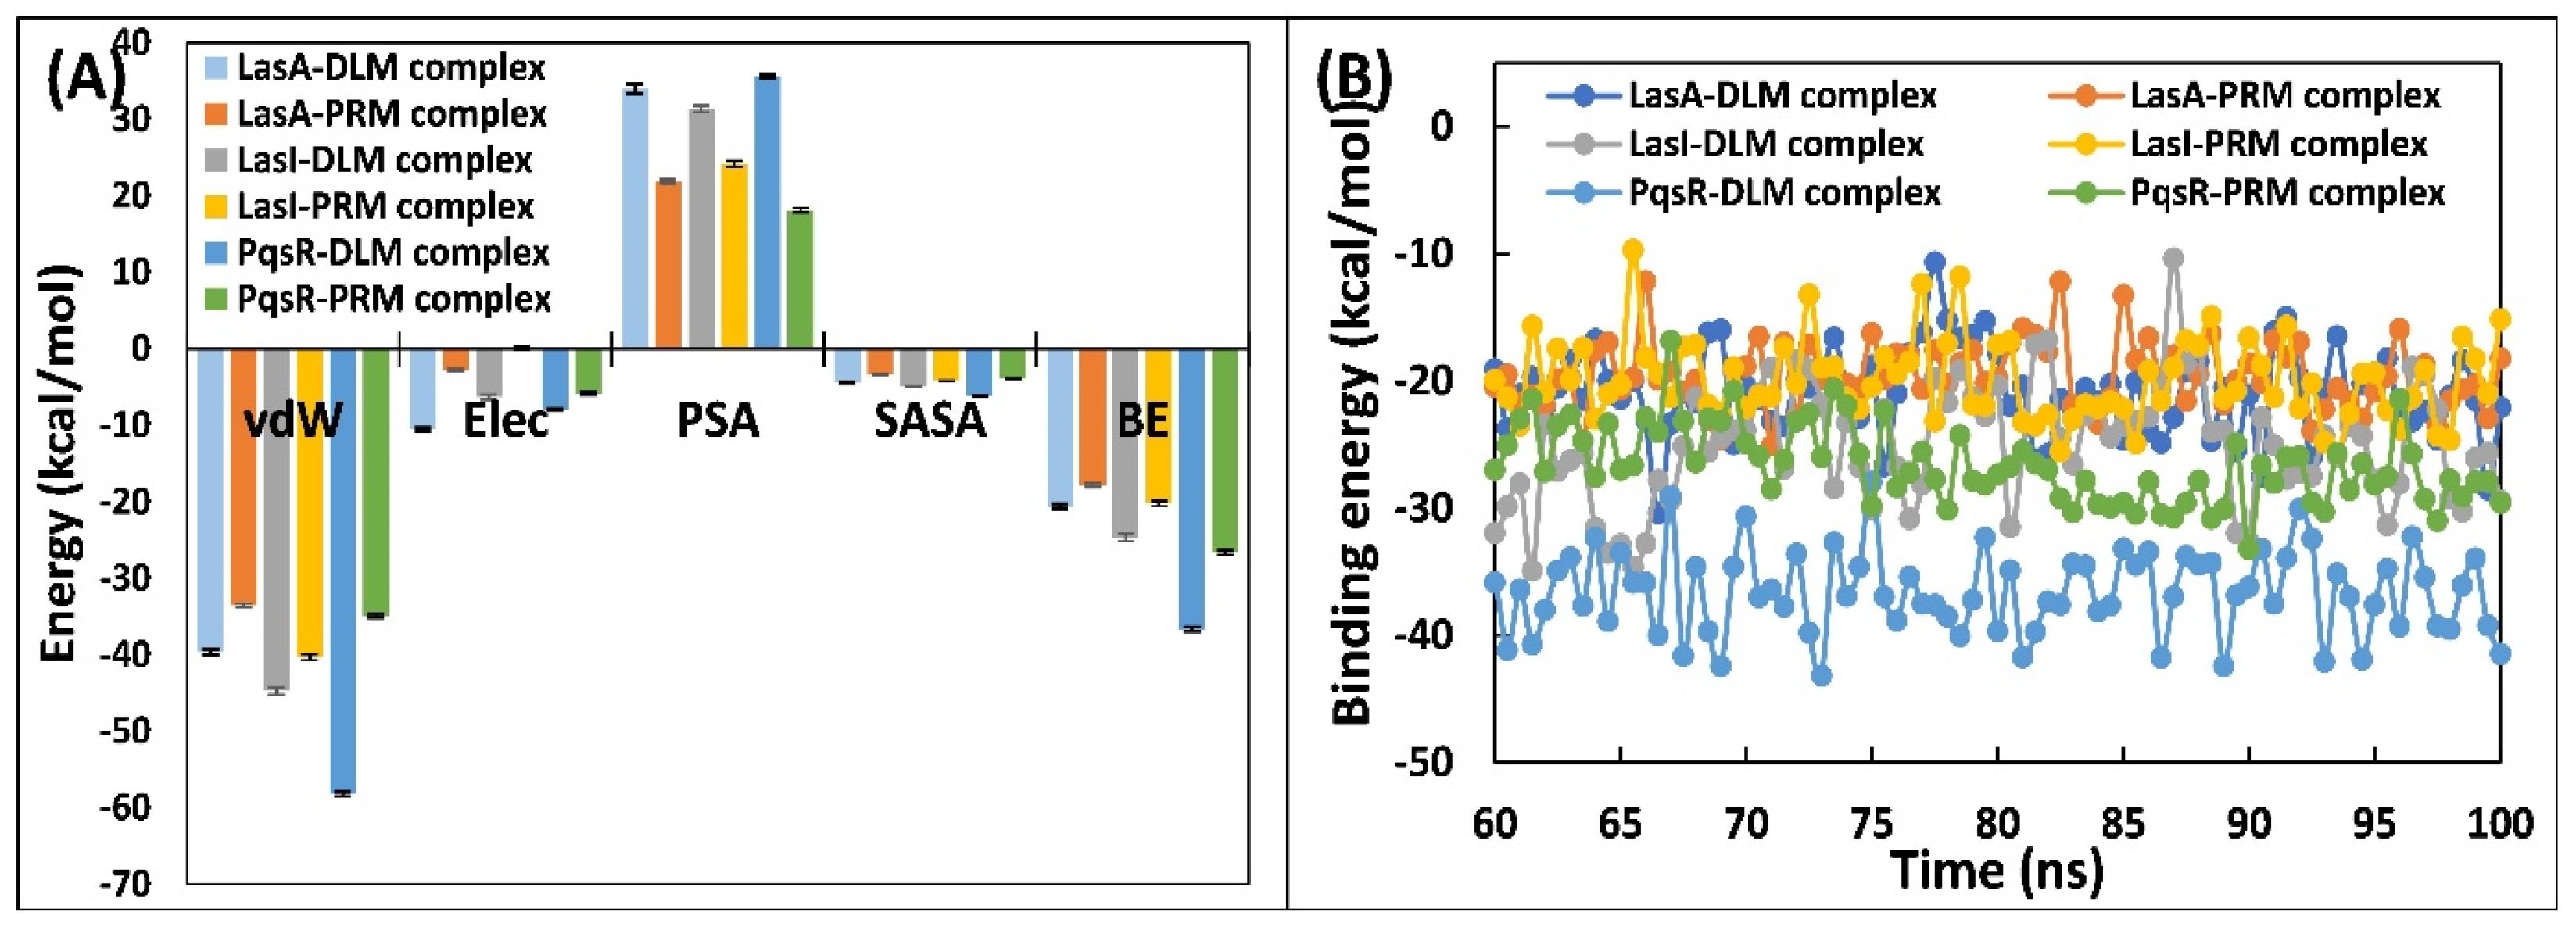
3.5.5. Examination of Binding Energies

The examination binding energetic antimycobacterial drugs with test proteins was extended using MM-PBSA calculations. In MM-PBSA calculations, 100 frames/snapshots were extracted from the trajectory of each complex, covering the time span 50–100 ns, with 0.5 ns intervals. In protein–ligand complexations, non-covalent interactions such as hydrophobic, van der Waals forces, electrostatic, and hydrogen bonds were identified as significant contributors. These forces played a crucial role in influencing the overall binding dynamics. Employing MM-PBSA, diverse binding energies were computed and are outlined in Figure 10A. In binding of both the lead antimycobacterial drugs and target proteins, van der Waals forces emerged as the primary driving force. Electrostatic forces also had some role in shaping the overall binding. Additionally, a minor contribution from SASA energy was observed. The PSA (polar solvation energy) impeded the binding of antimycobacterial drugs to target proteins, as shown by their positive values. The cumulative energies for binding of delamanid with LasA, PqsR, and LasI were determined to be −20.66, −36.65, and −24.66 kcal/mol, respectively. Similarly, the total energies for complexation of pretomanid with LasA, PqsR, and LasI were −17.83, −26.59, and −20.23 kcal/mol, respectively. A comparative study on anti-QS effects of coumarin reported the MM-PBSA energies for binding of coumarin with LasR, CviR, and LasI as −14.2, −10.3, and −8.6 kcal/mol, respectively. Further, analysis involved the calculation of energy per frame for a series of 100 snapshots extracted from the trajectory spanning 50 ns to 100 ns, with intervals of 0.5 ns (Figure 10B). Throughout this trajectory period, the data portraying energy per frame exhibited a noteworthy degree of stability, manifesting minimal fluctuations. Taking the LasA–delamanid complex as an example, the energy for a single frame ranged from a minimum of −30.34 to a maximum of −10.63 kcal/mol. Similarly, in the LasA–pretomanid complex, the energy span for a single frame extended from a minimum of −25.06 to a maximum of −12.15 kcal/mol. These subtle energy shifts are likely to be due to the dynamic movement of the ligand within the confines of the binding site.
Further utilization of the MM-PBSA calculations aimed to identify the main residues of target proteins that significantly contributed to the overall energy (Table 5). In the complexation of delamanid with LasA, Tyr80 emerged as the major residue making the highest energy contributions (−2.14 kcal/mol). Similarly, in the LasA–pretomanid complex, the highest energy contribution was given by Tyr80 (−1.63 kcal/mol). Concerning the binding of delamanid and pretomanid with LasI, the most influential amino acids in terms of energy contribution were Val26. Likewise, in the interaction of delamanid and pretomanid with PqsR, the most energy contributing residues were Ile236. Notably, certain high energy contributing residues had positive polar energy values, suggesting that their polar counterparts hindered the overall interaction.

4. Conclusions

From the beginning of the 21st century, a health issue due to escalation in AMR has been reported, posing a substantial threat to public health. This has now reached a critical threshold, where the very effectiveness of antibiotics is on the brink of being entirely compromised. The exploration of impact of antimycobacterial drugs on QS mechanisms in P. aeruginosa has been notably limited. This study aims to comprehensively investigate the effect of antimycobacterial drugs on diverse potential QS targets in P. aeruginosa. Through virtual screening, we found delamanid and pretomanid to be the foremost antimycobacterial drugs. These two drugs exhibited higher binding energies against the five target proteins. Moreover, molecular simulation data have conclusively verified the enduring interaction of both delamanid and pretomanid with target proteins and their stability under physiological environments. This research highlights the ability of delamanid and pretomanid in counteracting QS in P. aeruginosa. As a result, there emerges a promising avenue for repurposing these antimycobacterial drugs, with the specific intent of targeting the QS mechanism of P. aeruginosa.

Supplementary Materials

The following supporting information can be downloaded at: https://www.mdpi.com/article/10.3390/microbiolres15010020/s1, Figure S1. (A) Docked pose of the RhlR-delamanid complex; Figure S2. Total energy and potential energy of apo LasA; Figure S3. (A) Ramachandran plot of energy minima structure of apo LasA; Table S1. Details of the antimycobacterial drugs used in this study; Table S2. Details of the target proteins of P. aeruginosa used in this study.

Funding

This research received no external funding.

Institutional Review Board Statement

Not applicable.

Informed Consent Statement

Not applicable.

Data Availability Statement

Data are contained within the article and supplementary materials.

Conflicts of Interest

The author declares no conflicts of interest.

References

  1. Darby, E.M.; Trampari, E.; Siasat, P.; Gaya, M.S.; Alav, I.; Webber, M.A.; Blair, J.M.A. Molecular Mechanisms of Antibiotic Resistance Revisited. Nat. Rev. Microbiol. 2023, 21, 280–295. [Google Scholar] [CrossRef]
  2. Akram, F.; Imtiaz, M.; Haq, I.L. Emergent Crisis of Antibiotic Resistance: A Silent Pandemic Threat to 21st Century. Microb. Pathog. 2023, 174, 105923. [Google Scholar] [CrossRef]
  3. Kumar, S.; Adithan, C.; Harish, B.; Roy, G.; Malini, A.; Sujatha, S. Antimicrobial Resistance in India: A Review. J. Nat. Sci. Biol. Med. 2013, 4, 286. [Google Scholar] [CrossRef] [PubMed]
  4. Nathan, C. Resisting Antimicrobial Resistance. Nat. Rev. Microbiol. 2020, 18, 259–260. [Google Scholar] [CrossRef] [PubMed]
  5. Rehman, S. A Parallel and Silent Emerging Pandemic: Antimicrobial Resistance (AMR) amid COVID-19 Pandemic. J. Infect. Public Health 2023, 16, 611–617. [Google Scholar] [CrossRef]
  6. Nathan, C.; Cars, O. Antibiotic Resistance—Problems, Progress, and Prospects. N. Engl. J. Med. 2014, 371, 1761–1763. [Google Scholar] [CrossRef]
  7. Azimi, S.; Klementiev, A.D.; Whiteley, M.; Diggle, S.P. Bacterial Quorum Sensing During Infection. Annu. Rev. Microbiol. 2020, 74, 201–219. [Google Scholar] [CrossRef] [PubMed]
  8. Whiteley, M.; Diggle, S.P.; Greenberg, E.P. Progress in and Promise of Bacterial Quorum Sensing Research. Nature 2017, 551, 313–320. [Google Scholar] [CrossRef]
  9. West, S.A.; Griffin, A.S.; Gardner, A.; Diggle, S.P. Social Evolution Theory for Microorganisms. Nat. Rev. Microbiol. 2006, 4, 597–607. [Google Scholar] [CrossRef]
  10. Schuster, M.; Joseph Sexton, D.; Diggle, S.P.; Peter Greenberg, E. Acyl-Homoserine Lactone Quorum Sensing: From Evolution to Application. Annu. Rev. Microbiol. 2013, 67, 43–63. [Google Scholar] [CrossRef]
  11. Warrier, A.; Satyamoorthy, K.; Murali, T.S. Quorum-Sensing Regulation of Virulence Factors in Bacterial Biofilm. Future Microbiol. 2021, 16, 1003–1021. [Google Scholar] [CrossRef]
  12. Rahme, L.G.; Stevens, E.J.; Wolfort, S.F.; Shao, J.; Tompkins, R.G.; Ausubel, F.M. Common Virulence Factors for Bacterial Pathogenicity in Plants and Animals. Science 1995, 268, 1899–1902. [Google Scholar] [CrossRef] [PubMed]
  13. Turner, K.H.; Everett, J.; Trivedi, U.; Rumbaugh, K.P.; Whiteley, M. Requirements for Pseudomonas Aeruginosa Acute Burn and Chronic Surgical Wound Infection. PLoS Genet. 2014, 10, e1004518. [Google Scholar] [CrossRef] [PubMed]
  14. Zegans, M.E.; DiGiandomenico, A.; Ray, K.; Naimie, A.; Keller, A.E.; Stover, C.K.; Lalitha, P.; Srinivasan, M.; Acharya, N.R.; Lietman, T.M. Association of Biofilm Formation, Psl Exopolysaccharide Expression, and Clinical Outcomes in Pseudomonas Aeruginosa Keratitis. JAMA Ophthalmol. 2016, 134, 383. [Google Scholar] [CrossRef] [PubMed]
  15. Zhu, H.; Bandara, R.; Conibear, T.C.R.; Thuruthyil, S.J.; Rice, S.A.; Kjelleberg, S.; Givskov, M.; Willcox, M.D.P. Pseudomonas Aeruginosa with LasI Quorum-Sensing Deficiency during Corneal Infection. Investig. Opthalmology Vis. Sci. 2004, 45, 1897. [Google Scholar] [CrossRef] [PubMed]
  16. Mowat, E.; Paterson, S.; Fothergill, J.L.; Wright, E.A.; Ledson, M.J.; Walshaw, M.J.; Brockhurst, M.A.; Winstanley, C. Pseudomonas Aeruginosa Population Diversity and Turnover in Cystic Fibrosis Chronic Infections. Am. J. Respir. Crit. Care Med. 2011, 183, 1674–1679. [Google Scholar] [CrossRef] [PubMed]
  17. Bjarnsholt, T.; Jensen, P.Ø.; Fiandaca, M.J.; Pedersen, J.; Hansen, C.R.; Andersen, C.B.; Pressler, T.; Givskov, M.; Høiby, N. Pseudomonas Aeruginosa Biofilms in the Respiratory Tract of Cystic Fibrosis Patients. Pediatr. Pulmonol. 2009, 44, 547–558. [Google Scholar] [CrossRef] [PubMed]
  18. Pesci, E.C.; Milbank, J.B.J.; Pearson, J.P.; McKnight, S.; Kende, A.S.; Greenberg, E.P.; Iglewski, B.H. Quinolone Signaling in the Cell-to-Cell Communication System of Pseudomonas Aeruginosa. Proc. Natl. Acad. Sci. USA 1999, 96, 11229–11234. [Google Scholar] [CrossRef] [PubMed]
  19. Sánchez-Jiménez, A.; Llamas, M.A.; Marcos-Torres, F.J. Transcriptional Regulators Controlling Virulence in Pseudomonas Aeruginosa. Int. J. Mol. Sci. 2023, 24, 11895. [Google Scholar] [CrossRef]
  20. Miranda, S.W.; Asfahl, K.L.; Dandekar, A.A.; Greenberg, E.P. Pseudomonas Aeruginosa Quorum Sensing; Springer International Publishing: Cham, Switzerland, 2022; pp. 95–115. [Google Scholar]
  21. Sánchez-Jiménez, A.; Marcos-Torres, F.J.; Llamas, M.A. Mechanisms of Iron Homeostasis in Pseudomonas Aeruginosa and Emerging Therapeutics Directed to Disrupt This Vital Process. Microb. Biotechnol. 2023, 16, 1475–1491. [Google Scholar] [CrossRef]
  22. Reig, S.; Le Gouellec, A.; Bleves, S. What Is New in the Anti–Pseudomonas Aeruginosa Clinical Development Pipeline Since the 2017 WHO Alert? Front. Cell Infect. Microbiol. 2022, 12, 862. [Google Scholar] [CrossRef]
  23. Waller, N.J.E.; Cheung, C.-Y.; Cook, G.M.; McNeil, M.B. The Evolution of Antibiotic Resistance Is Associated with Collateral Drug Phenotypes in Mycobacterium Tuberculosis. Nat. Commun. 2023, 14, 1517. [Google Scholar] [CrossRef]
  24. Chauhan, A.; Kumar, M.; Kumar, A.; Kanchan, K. Comprehensive Review on Mechanism of Action, Resistance and Evolution of Antimycobacterial Drugs. Life Sci. 2021, 274, 119301. [Google Scholar] [CrossRef] [PubMed]
  25. Morris, G.M.; Huey, R.; Lindstrom, W.; Sanner, M.F.; Belew, R.K.; Goodsell, D.S.; Olson, A.J. AutoDock4 and AutoDockTools4: Automated Docking with Selective Receptor Flexibility. J. Comput. Chem. 2009, 30, 2785–2791. [Google Scholar] [CrossRef] [PubMed]
  26. Pires, D.E.V.; Blundell, T.L.; Ascher, D.B. PkCSM: Predicting Small-Molecule Pharmacokinetic and Toxicity Properties Using Graph-Based Signatures. J. Med. Chem. 2015, 58, 4066–4072. [Google Scholar] [CrossRef]
  27. Wang, Y.; Xing, J.; Xu, Y.; Zhou, N.; Peng, J.; Xiong, Z.; Liu, X.; Luo, X.; Luo, C.; Chen, K.; et al. In Silico ADME/T Modelling for Rational Drug Design. Q. Rev. Biophys. 2015, 48, 488–515. [Google Scholar] [CrossRef]
  28. Daina, A.; Michielin, O.; Zoete, V. SwissADME: A Free Web Tool to Evaluate Pharmacokinetics, Drug-Likeness and Medicinal Chemistry Friendliness of Small Molecules. Sci. Rep. 2017, 7, 42717. [Google Scholar] [CrossRef]
  29. Trott, O.; Olson, A.J. AutoDock Vina: Improving the Speed and Accuracy of Docking with a New Scoring Function, Efficient Optimization, and Multithreading. J. Comput. Chem. 2009, 31, 455–461. [Google Scholar] [CrossRef]
  30. Morris, G.M.; Goodsell, D.S.; Halliday, R.S.; Huey, R.; Hart, W.E.; Belew, R.K.; Olson, A.J. Automated Docking Using a Lamarckian Genetic Algorithm and an Empirical Binding Free Energy Function. J. Comput. Chem. 1998, 19, 1639–1662. [Google Scholar] [CrossRef]
  31. Berendsen, H.J.C.; van der Spoel, D.; van Drunen, R. GROMACS: A Message-Passing Parallel Molecular Dynamics Implementation. Comput. Phys. Commun. 1995, 91, 43–56. [Google Scholar] [CrossRef]
  32. Hornak, V.; Abel, R.; Okur, A.; Strockbine, B.; Roitberg, A.; Simmerling, C. Comparison of Multiple Amber Force Fields and Development of Improved Protein Backbone Parameters. Proteins Struct. Funct. Bioinform. 2006, 65, 712–725. [Google Scholar] [CrossRef]
  33. Sousa da Silva, A.W.; Vranken, W.F. ACPYPE—AnteChamber PYthon Parser InterfacE. BMC Res. Notes 2012, 5, 367. [Google Scholar] [CrossRef]
  34. Bussi, G.; Donadio, D.; Parrinello, M. Canonical Sampling through Velocity Rescaling. J. Chem. Phys. 2007, 126, 014101. [Google Scholar] [CrossRef]
  35. Parrinello, M.; Rahman, A. Polymorphic Transitions in Single Crystals: A New Molecular Dynamics Method. J. Appl. Phys. 1981, 52, 7182–7190. [Google Scholar] [CrossRef]
  36. Kumari, R.; Kumar, R.; Lynn, A. G_mmpbsa—A GROMACS Tool for High-Throughput MM-PBSA Calculations. J. Chem. Inf. Model. 2014, 54, 1951–1962. [Google Scholar] [CrossRef] [PubMed]
  37. Singh, M.; Sasi, P.; Rai, G.; Gupta, V.H.; Amarapurkar, D.; Wangikar, P.P. Studies on Toxicity of Antitubercular Drugs Namely Isoniazid, Rifampicin, and Pyrazinamide in an in Vitro Model of HepG2 Cell Line. Med. Chem. Res. 2011, 20, 1611–1615. [Google Scholar] [CrossRef]
  38. Tostmann, A.; Boeree, M.J.; Aarnoutse, R.E.; De Lange, W.C.M.; Van Der Ven, A.J.A.M.; Dekhuijzen, R. Antituberculosis Drug-induced Hepatotoxicity: Concise Up-to-date Review. J. Gastroenterol. Hepatol. 2008, 23, 192–202. [Google Scholar] [CrossRef] [PubMed]
  39. Agal, S.; Baijal, R.; Pramanik, S.; Patel, N.; Gupte, P.; Kamani, P.; Amarapurkar, D. Monitoring and Management of Antituberculosis Drug Induced Hepatotoxicity. J. Gastroenterol. Hepatol. 2005, 20, 1745–1752. [Google Scholar] [CrossRef] [PubMed]
  40. Mirlohi, M.-S.; Ekrami, A.; Shirali, S.; Ghobeishavi, M.; Pourmotahari, F. Hematological and Liver Toxicity of Anti-Tuberculosis Drugs. Electron. Physician 2016, 8, 3005–3010. [Google Scholar] [CrossRef] [PubMed]
  41. Illamola, S.M.; Hirt, D.; Tréluyer, J.M.; Urien, S.; Benaboud, S. Challenges Regarding Analysis of Unbound Fraction of Highly Bound Protein Antiretroviral Drugs in Several Biological Matrices: Lack of Harmonisation and Guidelines. Drug Discov. Today 2015, 20, 466–474. [Google Scholar] [CrossRef] [PubMed]
  42. Cervelli, M.J.; Russ, G.R. PPrinciples of Drug Therapy, Dosing, and Prescribing in Chronic Kidney Disease and Renal Replacement Therapy. In Comprehensive Clinical Nephrology; Elsevier: Amsterdam, The Netherlands, 2010; pp. 871–893. [Google Scholar]
  43. Ince, I.; Knibbe, C.A.J.; Danhof, M.; de Wildt, S.N. Developmental Changes in the Expression and Function of Cytochrome P450 3A Isoforms: Evidence from In Vitro and In Vivo Investigations. Clin. Pharmacokinet. 2013, 52, 333–345. [Google Scholar] [CrossRef]
  44. Kacevska, M.; Robertson, G.R.; Clarke, S.J.; Liddle, C. Inflammation and CYP3A4-Mediated Drug Metabolism in Advanced Cancer: Impact and Implications for Chemotherapeutic Drug Dosing. Expert. Opin. Drug Metab. Toxicol. 2008, 4, 137–149. [Google Scholar] [CrossRef]
  45. Zanger, U.M.; Schwab, M. Cytochrome P450 Enzymes in Drug Metabolism: Regulation of Gene Expression, Enzyme Activities, and Impact of Genetic Variation. Pharmacol. Ther. 2013, 138, 103–141. [Google Scholar] [CrossRef]
  46. Lipinski, C.A. Lead- and Drug-like Compounds: The Rule-of-Five Revolution. Drug Discov. Today Technol. 2004, 1, 337–341. [Google Scholar] [CrossRef]
  47. Ghose, A.K.; Viswanadhan, V.N.; Wendoloski, J.J. A Knowledge-Based Approach in Designing Combinatorial or Medicinal Chemistry Libraries for Drug Discovery. 1. A Qualitative and Quantitative Characterization of Known Drug Databases. J. Comb. Chem. 1999, 1, 55–68. [Google Scholar] [CrossRef]
  48. Toder, D.S.; Ferrell, S.J.; Nezezon, J.L.; Rust, L.; Iglewski, B.H. LasA and LasB Genes of Pseudomonas Aeruginosa: Analysis of Transcription and Gene Product Activity. Infect. Immun. 1994, 62, 1320–1327. [Google Scholar] [CrossRef] [PubMed]
  49. Spencer, J.; Murphy, L.M.; Conners, R.; Sessions, R.B.; Gamblin, S.J. Crystal Structure of the LasA Virulence Factor from Pseudomonas Aeruginosa: Substrate Specificity and Mechanism of M23 Metallopeptidases. J. Mol. Biol. 2010, 396, 908–923. [Google Scholar] [CrossRef] [PubMed]
  50. Qais, F.A.; Khan, M.S.; Ahmad, I.; Husain, F.M.; Al-kheraif, A.A.; Arshad, M.; Alam, P. Plumbagin Inhibits Quorum Sensing-Regulated Virulence and Biofilms of Gram-Negative Bacteria: In Vitro and in Silico Investigations. Biofouling 2021, 37, 724–739. [Google Scholar] [CrossRef]
  51. Gould, T.A.; Schweizer, H.P.; Churchill, M.E.A. Structure of the Pseudomonas Aeruginosa Acyl-Homoserinelactone Synthase LasI. Mol. Microbiol. 2004, 53, 1135–1146. [Google Scholar] [CrossRef] [PubMed]
  52. Qais, F.A.; Khan, M.S.; Ahmad, I. Broad-Spectrum Quorum Sensing and Biofilm Inhibition by Green Tea against Gram-Negative Pathogenic Bacteria: Deciphering the Role of Phytocompounds through Molecular Modelling. Microb. Pathog. 2019, 126, 379–392. [Google Scholar] [CrossRef] [PubMed]
  53. Qais, F.A.; Khan, M.S.; Ahmad, I.; Husain, F.M.; Khan, R.A.; Hassan, I.; Shahzad, S.A.; AlHarbi, W. Coumarin Exhibits Broad-Spectrum Antibiofilm and Antiquorum Sensing Activity against Gram-Negative Bacteria: In Vitro and In Silico Investigation. ACS Omega 2021, 6, 18823–18835. [Google Scholar] [CrossRef]
  54. Wade, D.S.; Calfee, M.W.; Rocha, E.R.; Ling, E.A.; Engstrom, E.; Coleman, J.P.; Pesci, E.C. Regulation of Pseudomonas Quinolone Signal Synthesis in Pseudomonas Aeruginosa. J. Bacteriol. 2005, 187, 4372–4380. [Google Scholar] [CrossRef]
  55. Qais, F.A.; Parveen, N.; Ahmad, I.; Husain, F.M.; Khan, A.; Adil, M. Multi-Targeting of Virulence Factors of P. Aeruginosa by β-Lactam Antibiotics to Combat Antimicrobial Resistance. J. Biomol. Struct. Dyn. 2023, 1–19. [Google Scholar] [CrossRef] [PubMed]
  56. McGrath, S.; Wade, D.S.; Pesci, E.C. Dueling Quorum Sensing Systems in Pseudomonas Aeruginosa Control the Production of the Pseudomonas Quinolone Signal (PQS). FEMS Microbiol. Lett. 2004, 230, 27–34. [Google Scholar] [CrossRef] [PubMed]
  57. Qais, F.A.; Ahmad, I.; Husain, F.M.; Arshad, M.; Khan, A.; Adil, M. Umbelliferone Modulates the Quorum Sensing and Biofilm of Gram− ve Bacteria: In Vitro and in Silico Investigations. J. Biomol. Struct. Dyn. 2023, 1–14. [Google Scholar] [CrossRef]
  58. Medina, G.; Juarez, K.; Valderrama, B.; Soberon-Chavez, G. Mechanism of Pseudomonas Aeruginosa RhlR Transcriptional Regulation of the RhlAB Promoter. J. Bacteriol. 2003, 185, 5976–5983. [Google Scholar] [CrossRef] [PubMed]
  59. Al-Yousef, H.M.; Ahmed, A.F.; Al-Shabib, N.A.; Laeeq, S.; Khan, R.A.; Rehman, M.T.; Alsalme, A.; Al-Ajmi, M.F.; Khan, M.S.; Husain, F.M. Onion Peel Ethylacetate Fraction and Its Derived Constituent Quercetin 4′-O-β-D Glucopyranoside Attenuates Quorum Sensing Regulated Virulence and Biofilm Formation. Front. Microbiol. 2017, 8, 1675. [Google Scholar] [CrossRef]
  60. Packiavathy, I.I.A.S.V.I.; Agilandeswari, P.; Musthafa, K.K.S.K.; Pandian, S.S.K.S.; Ravi, A.A.V.; Sybiya Vasantha Packiavathy, I.A.; Agilandeswari, P.; Musthafa, K.K.S.K.; Karutha Pandian, S.; Veera Ravi, A.; et al. Antibiofilm and Quorum Sensing Inhibitory Potential of Cuminum Cyminum and Its Secondary Metabolite Methyl Eugenol against Gram Negative Bacterial Pathogens. Food Res. Int. 2012, 45, 85–92. [Google Scholar] [CrossRef]
  61. Yang, L.; Rybtke, M.T.; Jakobsen, T.H.; Hentzer, M.; Bjarnsholt, T.; Givskov, M.; Tolker-Nielsen, T. Computer-Aided Identification of Recognized Drugs as Pseudomonas Aeruginosa Quorum-Sensing Inhibitors. Antimicrob. Agents Chemother. 2009, 53, 2432–2443. [Google Scholar] [CrossRef]
  62. Qais, F.A.; Alomar, S.Y.; Imran, M.A.; Hashmi, M.A. In-Silico Analysis of Phytocompounds of Olea Europaea as Potential Anti-Cancer Agents to Target PKM2 Protein. Molecules 2022, 27, 5793. [Google Scholar] [CrossRef]
  63. Hosen, M.A.; Qais, F.A.; Chtita, S.; Rahman, I.A.; Almehdi, A.M.; Ali, F.; Almalki, F.A.; Hadda, T.B.; Laaroussi, H.; Kawsar, S.M.A. In Silico and POM Analysis for Potential Antimicrobial Agents of Thymidine Analogs by Using Molecular Docking, Molecular Dynamics and ADMET Profiling. Nucleosides Nucleotides Nucleic Acids 2023, 42, 877–918. [Google Scholar] [CrossRef]
  64. Samreen; Qais, F.A.; Ahmad, I. In Silico Screening and in Vitro Validation of Phytocompounds as Multidrug Efflux Pump Inhibitor against E. Coli. J. Biomol. Struct. Dyn. 2023, 41, 2189–2201. [Google Scholar] [CrossRef]
  65. Chtita, S.; Fouedjou, R.T.; Belaidi, S.; Djoumbissie, L.A.; Ouassaf, M.; Qais, F.A.; Bakhouch, M.; Efendi, M.; Tok, T.T.; Bouachrine, M.; et al. In Silico Investigation of Phytoconstituents from Cameroonian Medicinal Plants towards COVID-19 Treatment. Struct. Chem. 2022, 33, 1799–1813. [Google Scholar] [CrossRef]
  66. Liao, S.-Y.; Mo, G.-Q.; Chen, J.-C.; Zheng, K.-C. Exploration of the Binding Mode between (−)-Zampanolide and Tubulin Using Docking and Molecular Dynamics Simulation. J. Mol. Model. 2014, 20, 2070. [Google Scholar] [CrossRef]
  67. Riaz, S.; Siddiqui, S.; Qais, F.A.; Mateen, S.; Moin, S. Inhibitory Effect of Baicalein against Glycation in HSA: An in Vitro Approach. J. Biomol. Struct. Dyn. 2023, 1–13. [Google Scholar] [CrossRef] [PubMed]
  68. Siddiqui, S.; Ameen, F.; Jahan, I.; Nayeem, S.M.; Tabish, M. A Comprehensive Spectroscopic and Computational Investigation on the Binding of the Anti-Asthmatic Drug Triamcinolone with Serum Albumin. N. J. Chem. 2019, 43, 4137–4151. [Google Scholar] [CrossRef]
  69. Ding, K.; Zhang, H.; Wang, H.; Lv, X.; Pan, L.; Zhang, W.; Zhuang, S. Atomic-Scale Investigation of the Interactions between Tetrabromobisphenol, A.; Tetrabromobisphenol, S. Bovine Trypsin by Spectroscopies and Molecular Dynamics Simulations. J. Hazard. Mater. 2015, 299, 486–494. [Google Scholar] [CrossRef]
  70. Siddiqui, S.; Ameen, F.; Kausar, T.; Nayeem, S.M.; Ur Rehman, S.; Tabish, M. Biophysical Insight into the Binding Mechanism of Doxofylline to Bovine Serum Albumin: An in Vitro and in Silico Approach. Spectrochim. Acta A Mol. Biomol. Spectrosc. 2021, 249, 119296. [Google Scholar] [CrossRef] [PubMed]
  71. Rath, B.; Qais, F.A.; Patro, R.; Mohapatra, S.; Sharma, T. Design, Synthesis and Molecular Modeling Studies of Novel Mesalamine Linked Coumarin for Treatment of Inflammatory Bowel Disease. Bioorg Med. Chem. Lett. 2021, 41, 128029. [Google Scholar] [CrossRef]
  72. Qais, F.A.; Ahmad, I. Mechanism of Non-Enzymatic Antiglycation Action by Coumarin: A Biophysical Study. N. J. Chem. 2019, 43, 12823–12835. [Google Scholar] [CrossRef]
Figure 1. (A) Docked pose of the LasA–delamanid complex (LasA PDB ID: 3IT7). (A-i) Three-dimensional representation of the LasA–delamanid complex; delamanid is shown as sticks. LasA is shown as a colored ribbon in which interacting residues are labelled. (A-ii) Two-dimensional representation of the LasA–delamanid complex, prepared using Discovery Studio 2021. (A-iii) Structure of delamanid. (B) Docked pose of the LasA–pretomanid complex. (B-i) Three-dimensional representation of the LasA–pretomanid complex; pretomanid is shown as sticks. LasA is shown as a colored ribbon in which interacting residues are labelled. (B-ii) Two-dimensional representation of the LasA–pretomanid complex, prepared using Discovery Studio 2021. (B-iii) Structure of pretomanid.
Microbiolres 15 00020 g001
Figure 2. (A) Docked pose of the LasI–delamanid complex (LasI PDB ID: 1RO5). (A-i) Three-dimensional representation of the LasI–delamanid complex; delamanid is shown as sticks. LasI is shown as a colored ribbon in which interacting residues are labelled. (A-ii) Two-dimensional representation of the LasI–delamanid complex, prepared using Discovery Studio 2021. (B) Docked pose of the LasI–pretomanid complex. (B-i) Three-dimensional representation of the LasI–pretomanid complex; pretomanid is shown as sticks. LasI is shown as a colored ribbon in which interacting residues are labelled. (B-ii) Two-dimensional representation of the LasI–pretomanid complex, prepared using Discovery Studio 2021.
Microbiolres 15 00020 g002
Figure 3. (A) Docked pose of the PqsR–delamanid complex (PqsR PDB ID: 4JVI). (A-i) Three-dimensional representation of the PqsR–delamanid complex; delamanid is shown as sticks. PqsR is shown as a colored ribbon in which interacting residues are labelled. (A-ii) Two-dimensional representation of the PqsR–delamanid complex, prepared using Discovery Studio 2021. (B) Docked pose of the PqsR–pretomanid complex. (B-i) Three-dimensional representation of the PqsR–pretomanid complex; pretomanid is shown as sticks. PqsR is shown as a colored ribbon in which interacting residues are labelled. (B-ii) Two-dimensional representation of the PqsR–pretomanid complex, prepared using Discovery Studio 2021.
Microbiolres 15 00020 g003
Figure 4. (A) Docked pose of the LasR–delamanid complex (LasR PDB ID: 2UV0). (A-i) Three-dimensional representation of the LasR–delamanid complex; delamanid is shown as sticks. LasR is shown as a colored ribbon in which interacting residues are labelled. (A-ii) Two-dimensional representation of the LasR–delamanid complex, prepared using Discovery Studio 2021. (B) Docked pose of the LasR–pretomanid complex. (B-i) Three-dimensional representation of the LasR–pretomanid complex; pretomanid is shown as sticks. LasR is shown as a colored ribbon in which interacting residues are labelled. (B-ii) Two-dimensional representation of the LasR–pretomanid complex, prepared using Discovery Studio 2021.
Microbiolres 15 00020 g004
Figure 5. (A) RMSD of apo LasA, LasA–delamanid complex, LasA–pretomanid complex, apo LasI, LasI–delamanid complex, LasI–pretomanid complex, apo PqsR, PqsR–delamanid complex, and PqsR–pretomanid complex as a function of time. (B) RMSF of Cα atoms of LasA, LasI, and PqsR in the absence and presence of delamanid and pretomanid. (C) SASA of apo LasA, LasA–delamanid complex, LasA–pretomanid complex, apo LasI, LasI–delamanid complex, LasI–pretomanid complex, apo PqsR, PqsR–delamanid complex, and PqsR–pretomanid complex as a function of time. (D) Rg of apo LasA, LasA–delamanid complex, LasA–pretomanid complex, apo LasI, LasI–delamanid complex, LasI–pretomanid complex, apo PqsR, PqsR–delamanid complex, and PqsR–pretomanid complex as a function of time. RMSD—root mean square deviation; RMSF—root mean square fluctuation; SASA—solvent-accessible surface area; Rg—radius of gyration; DLM—delamanid; PRM—pretomanid.
Microbiolres 15 00020 g005
Figure 6. (A) Average secondary structural components of LasA in the absence and presence of delamanid or pretomanid. (B) Average secondary structural components of LasI in the absence and presence of delamanid or pretomanid. (C) Average secondary structural components of PqsR in the absence and presence of delamanid or pretomanid. (D) Number of hydrogen bonds formed by the ligands and proteins as function of time. DLM—delamanid; PRM—pretomanid.
Microbiolres 15 00020 g006
Figure 7. (A) Hydrogen bond existence map of LasA–delamanid complex. (B) Hydrogen bond existence map of LasA–pretomanid complex. (C) Hydrogen bond existence map of LasI–delamanid complex. (D) Hydrogen bond existence map of LasI–pretomanid complex. (E) Hydrogen bond existence map of PqsR–delamanid complex. (F) Hydrogen bond existence map of PqsR–pretomanid complex.
Microbiolres 15 00020 g007
Figure 8. (A) Two−dimensional projection of eigenvectors of apo LasA, LasA−delamanid complex, and LasA−pretomanid complex. (B) Two-dimensional projection of eigenvectors of apo LasI, LasI−delamanid complex, and LasI−pretomanid complex. (C) Two−dimensional projection of eigenvectors of apo PqsR, PqsR−delamanid complex, and PqsR−pretomanid complex. DLM−delamanid; PRM−pretomanid.
Microbiolres 15 00020 g008
Figure 9. (A) Free-energy landscape of apo LasA. (B) Free-energy landscape of LasA–delamanid complex. (C) Free-energy landscape of LasA–pretomanid complex. (D) Free-energy landscape of apo LasI. (E) Free-energy landscape of LasI–delamanid complex. (F) Free-energy landscape of LasI–pretomanid complex. (G) Free-energy landscape of apo PqsR. (H) Free-energy landscape of PqsR–delamanid complex. (I) Free-energy landscape of PqsR–pretomanid complex.
Microbiolres 15 00020 g009
Figure 10. (A) MM−PBSA analysis for different energies of LasA−delamanid complex, LasA−pretomanid complex, LasI−delamanid complex, LasI−pretomanid complex, PqsR−delamanid complex, and PqsR−pretomanid complex. (B) Total energy per frame of LasA–delamanid complex, LasA–pretomanid complex, LasI−delamanid complex, LasI−pretomanid complex, PqsR−delamanid complex, and PqsR−pretomanid complex. DLM—delamanid; PRM—pretomanid.
Microbiolres 15 00020 g010
Table 1. Toxicological parameters of antimycobacterial drugs predicted using pkCSM server.
Antimycobacterial DrugsAMES ToxicityMax. Tol. DosehERG I InhibitorSkin SensitisationT. pyriformis ToxicityMinnow Toxicity
DelamanidNo0.741NoNo0.285−1.301
PretomanidYes1.071NoNo0.285−0.032
ClofazimineYes0.429NoNo0.286−3.215
BedaquilineNo0.509NoNo0.2852.32
TerizidoneNo0.043NoNo0.4542.61
AmithiozoneNo0.714NoNo0.1361.98
DapsoneNo−0.126NoNo0.6121.846
MorinamideNo0.685NoNo0.0832.797
ProtionamideNo0.845NoYes0.271.361
IsoniazidNo1.166NoNo−0.1343.12
EthionamideNo0.902NoYes0.0841.643
PyrazinamideNo1.354NoNo−0.4822.869
EthambutolNo0.987NoYes−0.3623.107
CycloserineNo1.049NoNo0.0213.465
Max. tolerated dose is for human in log mg/kg/day; T. pyriformis toxicity is in log ug/L; Max. tol. dose is Max. tolerated dose; Minnow toxicity is in log mM.
Table 2. ADME (absorption, distribution, metabolism, and excretion) properties of antimycobacterial drugs predicted using pkCSM server.
Antimycobacterial DrugsAbsorptionDistributionMetabolismExcretion
Int AbsWater SolVDssFrac UnbCYP3A4 SubstrateCYP3A4 InhibitorTotal ClearR-OCT2
Delamanid1000.251−0.1130.058YesNo−0.047No
Pretomanid92.6410.070−0.1490.294NoNo0.13Yes
Clofazimine94.1880.002−0.4010.082YesNo−0.036No
Bedaquiline94.3840.0003−0.9040.255YesNo0.522No
Terizidone71.5412.144−0.3690.449NoNo0.435No
Amithiozone78.8150.396−0.1850.401NoYes−0.215No
Dapsone94.3910.5630.2890.167NoYes0.484No
Morinamide85.0294.100−0.1570.659NoNo0.912No
Protionamide95.1250.7320.0920.534NoYes0.055No
Isoniazid92.6013.444−0.3520.728NoNo0.722No
Ethionamide99.4281.8310.0210.582NoYes0.035No
Pyrazinamide92.81329.87−0.3380.773NoNo0.666No
Ethambutol66.16822.040.290.851NoNo1.234No
Cycloserine84.675124.160.0010.87NoNo0.891No
Int abs—intestinal absorption for humans; Water sol—water solubility in mg/mL; VDss—volume of distribution for human in log L/kg; Frac unb—fraction unbound for humans; Total Clear—total clearance; R-OCT2—renal OCT2 substrate.
Table 3. Drug likeness and pharmacokinetic properties of antimycobacterial drugs predicted using SwissADME server.
Antimycobacterial DrugsDrug LikenessPharmacokinetics
Lipinski ViolationsGhose ViolationsGI AbsorptionBBB PermeantPgp Substrate
Delamanid13LowNoNo
Pretomanid00HighNoNo
Clofazimine12LowNoNo
Bedaquiline23LowNoYes
Terizidone01HighNoNo
Amithiozone00HighNoNo
Dapsone00HighNoNo
Morinamide01HighNoNo
Protionamide00HighYesNo
Isoniazid03HighNoNo
Ethionamide00HighNoNo
Pyrazinamide04HighNoNo
Ethambutol00HighNoNo
Cycloserine04LowNoNo
GI—gastrointestinal; BBB—blood–brain barrier; Pgp—P-glycoprotein.
Table 4. Binding energies, binding constants, inhibition constants, and binding sites of antimycobacterial drugs using AutoDock Vina 1.1.2.
Antimycobacterial Drugs LasILasRLasAPqsRRhlRAv BE
BEKbKiBSBEKbKiBSBEKbKiBSBEKbKiBSBEKbKiBS
Delamanid−9.1472.40.21AS−8.3122.30.82OS−8.6203.00.49AS−9.61099.30.09AS−7.322.64.42OS−8.58
Pretomanid−7.962.271.61AS−10.998760.01AS−7.426.763.74AS−7.852.591.90AS−6.34.1823.95OS−8.06
Clofazimine−8.187.291.15AS−7.322.604.42OS−8.187.291.15AS−9.4784.20.13AS−7.219.05.24OS−8.02
Bedaquiline−8.9337.050.30AS−7.116.126.20OS−7.322.604.42AS−8.5171.50.58AS−6.34.1823.95OS−7.62
Terizidone−7.637.522.67AS−9.713010.08AS−7.531.693.16AS−713.627.34OS−5.81.7955.72OS−7.52
Amithiozone−6.55.8517.08AS−8.5171.50.58AS−5.71.5265.97AS−6.23.5328.35AS−6.89.7210.29AS−6.74
Dapsone−7.219.095.24AS−8.3122.30.82AS−6.23.5328.35AS−62.5239.75AS−5.30.77129.6OS−6.6
Morinamide−62.5239.75AS−7.852.591.90AS−6.12.9833.57AS−5.61.2878.11OS−6.12.9833.57AS−6.32
Protionamide−62.5239.75AS−6.44.9420.23AS−5.92.1247.06OS−5.71.5265.97AS−6.12.9833.57AS−6.02
Isoniazid−5.71.5265.97AS−6.78.2112.19AS−5.30.77129.6AS−5.92.1247.06AS−5.61.2878.11AS−5.84
Ethionamide−5.71.5265.97AS−6.12.9833.57AS−5.71.5265.97OS−5.71.5265.97AS−62.5239.75AS−5.84
Pyrazinamide−5.20.65153.4AS−62.5239.75AS−50.46215.1AS−4.80.33301.6OS−4.80.33301.6AS−5.16
Ethambutol−5.20.65153.48AS−5.81.7955.72AS−4.80.33301.6AS−4.30.14701.7OS−5.61.2878.11AS−5.14
Cycloserine−4.50.20500.58AS−4.90.39254.74AS−4.20.12830.8AS−4.70.28357.1OS−4.30.14701.7AS−4.52
BE—binding energy; Kb—binding constant in ×104 M−1; Ki—inhibition constant in µM; Av BE—average binding energy; BS—binding site; AS—active site; OS—site other than active site.
Table 5. Total energies of the major energy contributing residues of target protein of P. aeruginosa when in complex with delamanid or pretomanid obtained by MM-PBSA calculations.
LasA–delamanid ComplexLasI–delamanid ComplexPqsR–delamanid Complex
ResiduesTotal EnergyResiduesTotal EnergyResiduesTotal Energy
His23−0.289 ± 0.025Leu22−0.692 ± 0.053Ala102−0.776 ± 0.043
Asp40−0.191 ± 0.008Arg23−0.312 ± 0.023Ile149−0.916 ± 0.026
Tyr79−0.240 ± 0.011Gln25−0.454 ± 0.118Ala168−0.721 ± 0.032
Tyr80−2.143 ± 0.036Val26−2.120 ± 0.071Leu189−0.750 ± 0.030
Asp83−0.323 ± 0.011Phe27−0.533 ± 0.026Leu208−1.457 ± 0.045
Gly113−0.198 ± 0.029Glu29−0.339 ± 0.041Val211−1.280 ± 0.032
Gly114−0.275 ± 0.042Glu40−0.339 ± 0.042Ile236−2.248 ± 0.035
His122−0.258 ± 0.045Arg104−0.215 ± 0.057Ala237−1.076 ± 0.023
Ser124−0.177 ± 0.039Ile107−0.824 ± 0.064Pro238−1.688 ± 0.029
Leu126−0.236 ± 0.023Asn108−0.667 ± 0.062Glu259−0.763 ± 0.015
Phe131−0.479 ± 0.022Gly110−0.834 ± 0.056Ile263−1.217 ± 0.029
Tyr151−0.695 ± 0.047Val148−0.629 ± 0.030Asp264−0.726 ± 0.012
LasA-pretomanid complexLasI–pretomanid complexPqsR–pretomanid complex
ResiduesTotal energyResiduesTotal energyResiduesTotal energy
His23−0.522 ± 0.046Lys21−0.327 ± 0.009Ile149−0.957 ± 0.033
Ser24−0.438 ± 0.029Gln25−0.614 ± 0.042Glu151−0.698 ± 0.020
Thr26−0.398 ± 0.015Val26−2.738 ± 0.052Ala168−0.743 ± 0.023
Gly27−0.435 ± 0.015Phe27−0.639 ± 0.026Val170−0.500 ± 0.023
Ser34−0.361 ± 0.032Glu29−0.306 ± 0.018Leu207−0.659 ± 0.068
Arg60−0.247 ± 0.007Trp33−0.605 ± 0.045Leu208−1.160 ± 0.040
Arg64−0.246 ± 0.008Ala106−1.414 ± 0.027Ile236−2.193 ± 0.048
Tyr80−1.634 ± 0.049Ile107−0.591 ± 0.046Ala237−0.533 ± 0.026
Gly113−0.520 ± 0.035Asn108−0.622 ± 0.037Pro238−1.073 ± 0.030
Phe131−0.597 ± 0.022Phe117−0.690 ± 0.029Glu259−0.597 ± 0.032
Asp152−0.290 ± 0.004Thr145−0.364 ± 0.046Ile263−1.518 ± 0.049
Asp154−0.249 ± 0.002Val148−0.711 ± 0.039Asp264−0.530 ± 0.037
Disclaimer/Publisher’s Note: The statements, opinions and data contained in all publications are solely those of the individual author(s) and contributor(s) and not of MDPI and/or the editor(s). MDPI and/or the editor(s) disclaim responsibility for any injury to people or property resulting from any ideas, methods, instructions or products referred to in the content.

