Abstract
To address the low-speed starting noise in a small electric vehicle, this study proposes and validates a systematic diagnostic and optimization methodology. A novel objective testing method, based on energy tracking and matching, is first employed for precise noise source localization. Combined with electromagnetic force wave analysis, this method identifies the coupling between a 24th-order motor excitation and a powertrain structural mode as the root cause. Subsequently, a low-cost, integrated optimization scheme is presented, which synergistically combines three strategies: motor control refinement, powertrain natural frequency tuning, and mount isolation enhancement. Experimental validation demonstrates that this multi-domain approach reduces the sound pressure level at the driver’s ear by 4–6 dB(A), effectively eliminating the abnormal audible noise during starting and significantly improving the in-cabin sound quality. This paper offers a cost-effective engineering framework for resolving low-speed, low-frequency noise problems in electric vehicles.
1. Introduction
Electric vehicles (EVs) have captured an increasingly significant share of the automotive market in recent years. This surge is driven by their inherent advantages, including zero tailpipe emissions, low operating costs, and superior dynamic performance, such as strong acceleration at low speeds [1]. Unlike internal combustion engine vehicles, EVs rely on electric motors for propulsion, thereby eliminating traditional intake and exhaust systems [2]. Consequently, overall vehicle vibration and noise levels are typically 3–6 dB(A) lower than those of comparable traditional cars. However, the absence of the masking effect from the engine renders ancillary noise sources—such as the transmission [3], vacuum pumps, and compressors—more prominent, particularly at low speeds. With the elimination of background noise factors like engine idling, along with reduced tire and wind noise in low-speed segments, occupants become hyper-sensitive to acoustic anomalies. As a result, higher standards for the sound quality of electric vehicles have been prioritized [4]. Intrusive interior noise can significantly impact the driving experience, as it is known to induce anxiety [5,6,7] or stress [8] in occupants.
In the realm of NVH research on electric vehicles, analysis and optimization methodologies for reducer vibration and noise have matured significantly, spanning from multi-body dynamics simulations to comprehensive reviews on micro-geometry optimization [9,10,11,12]. Extensive research has been conducted on the evaluation [13,14,15] and identification [16,17,18,19] of noise generation mechanisms and sound quality in EVs. Techniques such as tooth surface modification and transmission path optimization have proven highly effective in mitigating high-speed reducer noise [20,21,22,23]. Recent studies have systematically investigated the NVH characteristics of electric vehicle powertrains, summarizing dominant noise sources—including electromagnetic noise, gear whine, and inverter switching (PWM) noise—along with corresponding mitigation strategies [24].
From the standpoint of electromagnetic design, researchers have analyzed vibration characteristics and proposed various noise reduction methods for permanent magnet synchronous motors (PMSMs) [25,26,27]. In the field of vibration engineering, Wang et al. [28] utilized an improved genetic algorithm to optimize the suspension parameters of underframe equipment, demonstrating the effectiveness of multi-parameter optimization. Additionally, regarding dynamic modeling, Yang et al. [29] investigated phase deviation in semi-active suspension control and its compensation, providing valuable insights for vibration suppression.
Yuan et al. [30] analyzed noise characteristics and identified primary noise sources under different speeds and working conditions using partial coherence analysis. Ma et al. [31,32] and Lin et al. [33] systematically investigated the order characteristics of electromagnetic noise in PMSMs and subsequently derived a general analytical expression for it. From the motor-control perspective, Tang et al. [34] proposed effective noise-mitigation strategies, with a particular emphasis on suppressing high-frequency audible components near the controller’s switching frequency. Nevertheless, NVH studies on battery electric vehicles (BEVs) remain relatively limited. Most existing investigations primarily focus on high-speed operating conditions and high-frequency phenomena, whereas low-speed, low-frequency coupled issues—especially those occurring during vehicle launch—have received comparatively less attention.
In recent years, continuous advancements in electric drive technology have driven trends toward miniaturization, integration, and lightweight design [35]. Such trends often result in higher magnetic loading in the powertrain, more pronounced low-order harmonics associated with concentrated windings, and altered structural modal characteristics (e.g., shifts in natural frequencies). Consequently, various low-speed, low-frequency coupled noise problems have emerged. In a specific domestic compact BEV, a distinct low-frequency noise is intermittently observed during launch as the motor speed ranges from 130 rpm to 200 rpm. This is accompanied by noticeable vibrations in the steering wheel and accelerator pedal [36,37], severely deteriorating in-cabin sound quality.
However, despite these advances, a clear research gap remains. While previous studies provide valuable insights into specific aspects (e.g., source analysis or path optimization), they often lack a systematic, integrated approach, especially for this challenging low-speed starting noise problem. There is a pressing need for a cost-effective methodology that combines precise experimental source localization with a multi-domain optimization strategy.
To bridge this gap and address this specific noise issue, this paper proposes a systematic investigation and an integrated optimization methodology. The main contributions of this work are twofold:
- A systematic experimental methodology for noise source localization and mechanism analysis is presented. This method successfully identifies the coupling between the 24th-order electromagnetic force and a 74 Hz powertrain structural mode as the root cause of the starting noise.
- A low-cost, multi-domain optimization scheme is proposed and experimentally validated. This scheme integrates powertrain mount stiffness optimization, control strategy refinement, and creep-map calibration to effectively resolve the NVH issue without requiring hardware modifications to the motor.
2. Vehicle Noise Test and Noise Source Analysis
2.1. Propagation Paths of Vibration and Noise During Startup
To provide context for the experimental analysis, the key specifications of the electric vehicle (EV) used in this study are listed in Table 1.

Table 1.
Basic parameters of the test vehicle.
As illustrated in Figure 1, the propagation paths of the initial vibro-acoustic response can be broadly categorized into two types [38]. In the first type, vibrations originating from the drive motor housing and end cover are transmitted to the vehicle body via the mounting system. In the second type, excitations are transmitted through the motor rotor shaft, propagating via the driveline (e.g., drive shafts) and suspension system to the vehicle body, where they ultimately contribute to in-cabin noise.
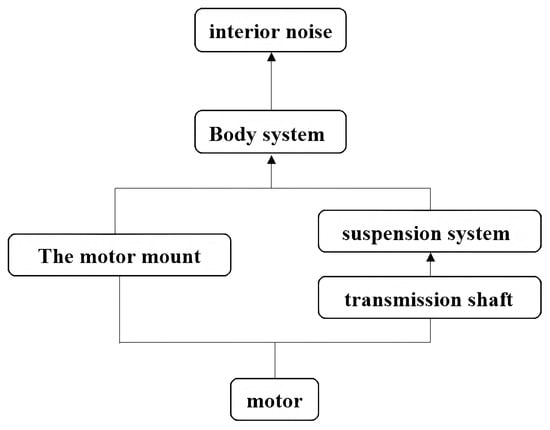
Figure 1.
Vibration and noise transmission paths of the drive motor.
To investigate the root causes of this noise issue and acquire reliable data, objective vehicle NVH tests were conducted using an LMS data acquisition system. The testing campaign included (i) correlation analysis between in-cabin noise and the vibration responses of the electric drive system; (ii) identification of vibration transfer paths from the motor to the vehicle body; and (iii) modal testing and frequency response function (FRF) measurements of the powertrain.
2.1.1. Correlation Analysis of Driver-Side Noise and Motor Vibration
The experimental setup is illustrated in Figure 2. The upper panel depicts the test vehicle, while the lower panel details the sensor placement on the powertrain. Specifically, microphones were positioned at the driver’s ear location within the cabin and in the near-field of the drive motor. Additionally, a triaxial accelerometer was mounted on the motor housing. To ensure consistency in directionality, the coordinate system is defined as follows: the X-axis aligns with the vehicle’s driving direction, the Y-axis is parallel to the motor shaft, and the Z-axis is perpendicular to the ground. Motor speed and vehicle speed data were acquired via the vehicle’s CAN bus.
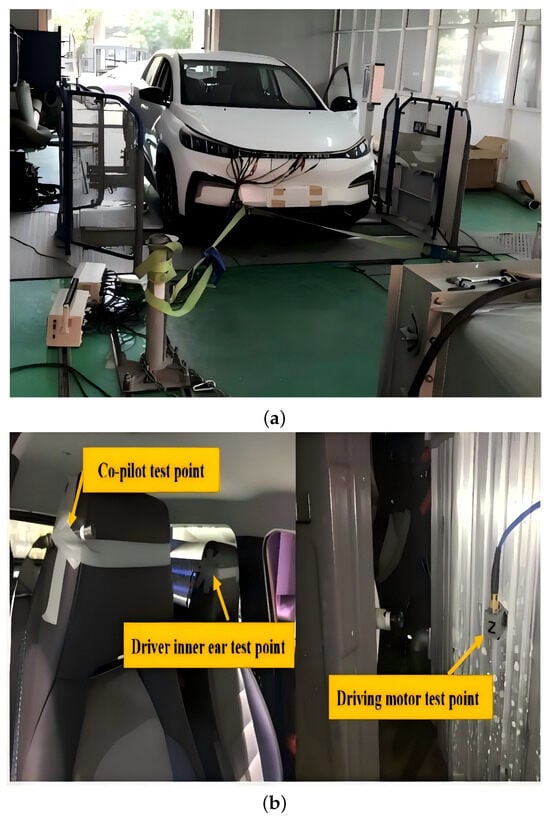
Figure 2.
Overview of the test setup: (a) The test vehicle; (b) Sensor placement.
Figure 3 presents the waterfall diagrams of the motor vibration and in-cabin noise recorded during accelerated startup. It should be noted that the upper plot represents the interior sound pressure level (SPL) with a range of 10–50 dB(A), capturing the acoustic response. The lower plot displays the motor vibration acceleration level ranging from −80 dB to −25 dB, where −25 dB corresponds to a significant vibration amplitude of approximately , and −80 dB represents weak background noise.
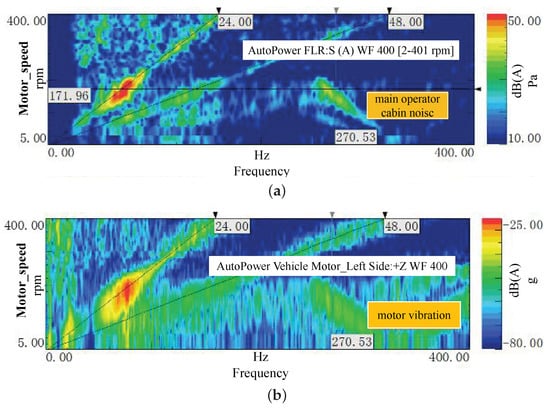
Figure 3.
Waterfall diagrams showing: (a) Noise on the driver’s side and (b) Vibration on the motor side.
The data reveals that within the motor speed range of 130 rpm to 200 rpm, a distinct peak appears near 74 Hz in the motor’s Z-direction vibration spectrum. This spectral feature coincides with a low-frequency droning noise in the cabin, accompanied by perceptible vibrations in the accelerator pedal and steering wheel. The strong temporal and spectral correlation between the motor vibration and the interior noise confirms that the startup noise originates from the electric drive system.
Further analysis of Figure 3 indicates that the peak near 74 Hz is strongly associated with the 24th-order electromagnetic excitation of the motor. This can be verified by converting the motor’s rotational speed at the peak location (approx. 170 rpm) to its fundamental mechanical frequency and then multiplying by the order number: . The proximity of this calculated excitation frequency to the observed 74 Hz peak suggests a resonance phenomenon between the 24th-order excitation and a structural mode of the electric drive system.
2.1.2. Investigation of Vibration Transmission Paths
To further analyze the transmission characteristics, vibration measurements were conducted at key locations along potential transfer paths. Figure 4 and Figure 5 illustrate the Z-direction vibration responses at these specific points.
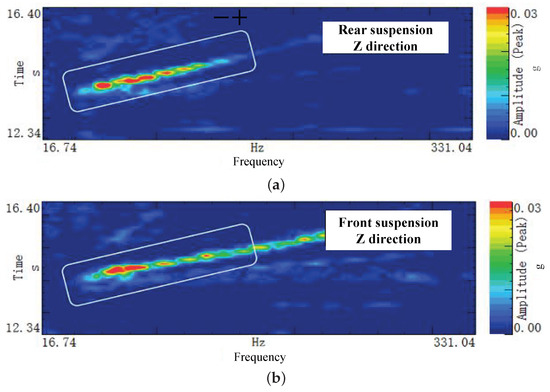
Figure 4.
Z-direction vibration characteristics on the passive side of: (a) the front mount and (b) the rear mount.
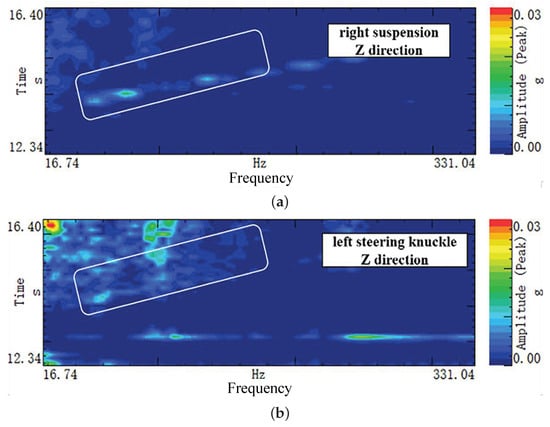
Figure 5.
Z-direction vibration characteristics on: (a) the passive side of the right mount and (b) the steering knuckle.
Specifically, Figure 4 presents the vibration levels measured on the passive side (body side) of the powertrain mounts. Both the front mount (Figure 4a) and the rear mount (Figure 4b) exhibit significant vibration peaks in the 60–80 Hz frequency range. This finding indicates that motor-induced vibrations are effectively transmitted to the vehicle body through the front and rear mounting systems.
Conversely, as depicted in Figure 5, no dominant vibration features are observed in either the Z-direction of the right mount’s passive side (Figure 5a) or at the left steering knuckle (Figure 5b). These results suggest that neither the right mount nor the driveshaft assembly constitutes the primary transmission path. Consequently, the interior noise is unlikely to be driven by motor torque ripple propagating through the driveline.
2.1.3. Bench Testing and Analysis of the Motor
To verify whether the motor itself generates noise at the frequency of interest, the motor system was isolated and tested on a bench.
The experimental results are presented in Figure 6. The spectrogram reveals that the motor exhibits a slight vibration peak at approximately 112 Hz, which corresponds to the motor’s 24th and 48th orders. These peaks occur at speeds of 282 rpm and 137 rpm, respectively. However, these frequencies differ significantly from the 74 Hz noise observed during the vehicle-level analysis. Preliminary analysis suggests that the motor itself does not constitute the source of the 74 Hz vibration noise. While the amplitudes of the 24th and 48th orders are slightly elevated, they remain within acceptable engineering limits.
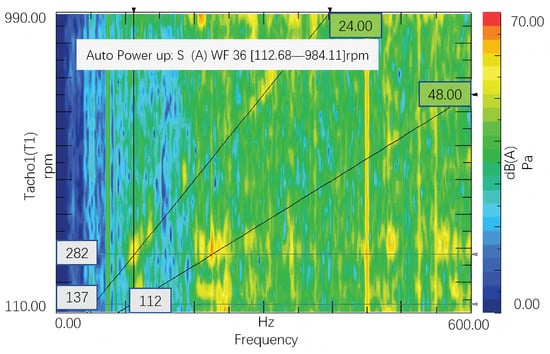
Figure 6.
Waterfall diagram of the motor bench test.
2.1.4. Modal Analysis and Frequency Response Testing of the Electric Drive Assembly
To determine the rigid-body modes and frequency response characteristics of the powertrain system, an impact hammer test was conducted on the prototype vehicle. Due to the limited number of available sensors, a multi-point measurement strategy (grouped multiple tests) was employed to collect data from a total of 16 points.
Figure 7 illustrates the modal characteristics of the powertrain mounting system derived from the test data. Regarding the mode distribution, the natural frequencies of the powertrain system fall within the range of 20–80 Hz. This is significantly higher than the typical natural frequency range of internal combustion engine powertrains (10–30 Hz). Crucially, the powertrain mounting system exhibits a natural frequency at approximately 76 Hz, which falls precisely within the frequency interval where the noise generation occurs (60–80 Hz).
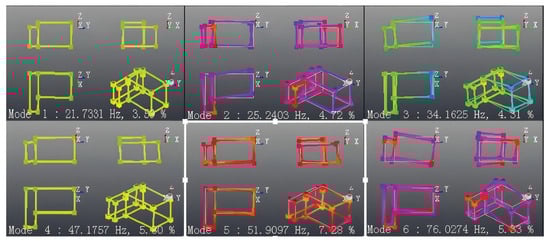
Figure 7.
Modal characteristics of the powertrain mounting system.
Furthermore, Figure 8 displays the frequency response function (FRF) measured at the active side (motor side) of the front mount, obtained by applying an impact excitation to the front end of the reducer. The plot reveals a distinct resonance peak at approximately 74 Hz. This finding confirms the correlation with the resonance of the powertrain mounting system, with corresponding low-frequency resonance characteristics clearly visible.
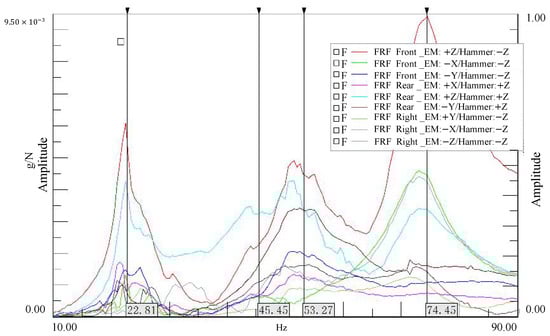
Figure 8.
Frequency response at the front end of the reducer under excitation.
Based on these tests and analyses, a strong correlation is established between the interior vehicle noise and the structure-borne noise of the electric drive system. The motor bench tests confirm that the motor body itself does not possess resonance frequencies matching the vehicle-level noise. However, the powertrain assembly—comprising the motor stator, housing, and reducer housing—exhibits a natural frequency characteristic at approximately 74 Hz. Consequently, it is concluded that the primary transmission path for the motor noise is the vehicle’s three-point mounting system.
2.2. Root Cause Analysis of the Electric Drive System NVH
2.2.1. Order Analysis of Motor Noise
Based on the preceding experimental analysis, the powertrain’s driveshaft does not exhibit frequency characteristics matching the interior noise observed during vehicle testing. This indicates that the vehicle’s NVH issue is not driven by torque fluctuations transmitted through the mechanical driveline. Consequently, the investigation shifts to analyzing the electromagnetic noise characteristics inherent to the motor’s structural design.
To theoretically elucidate the origins of the motor noise, it is essential to analyze the interaction between the spatial harmonics of the magnetic field. The radial electromagnetic force wave, which constitutes the primary source of vibration and noise in permanent magnet synchronous motors (PMSMs), arises from the interaction between the stator harmonic magnetic field and the rotor harmonic magnetic field [39,40,41]. The key specifications of the motor employed in this study are detailed in Table 2.
Table 2.
Basic motor parameters.
For an integer-slot PMSM, the harmonic orders of the stator magnetomotive force (MMF) and the rotor MMF can be expressed as follows:
where v represents the spatial harmonic order of the stator MMF, represents the spatial harmonic order of the rotor MMF, p is the number of pole pairs (which is 4 in this study), and k and r are integer constants determining the harmonic series.
The interaction between these two magnetic fields produces a radial electromagnetic force wave. The spatial order (n) and the frequency (f) of this force wave are governed by the following relationships:
where n is the spatial order of the force wave, f is the frequency of the force wave, and is the mechanical rotational frequency of the rotor. Note that in Equation (4), the term relates to the electrical order.
Based on these equations, the specific force wave characteristics for the 8-pole 48-slot motor used in this study were calculated and are summarized in Figure 9.
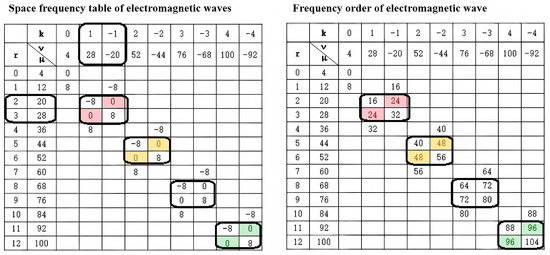
Figure 9.
Summary of electromagnetic force wave characteristics for the drive motor.
Figure 9 presents the calculated characteristics of the electromagnetic force waves. The rows and columns correspond to different combinations of stator harmonic coefficients (k) and rotor harmonic coefficients (r). The analysis reveals that:
- The dominant electromagnetic noise orders are multiples of (e.g., 8th, 16th, 24th, 48th orders).
- Force waves with a zero spatial order () are particularly critical, as they induce uniform radial deformation (breathing mode) of the stator, leading to significant vibration.
- The most significant components correspond to the 24th, 48th, and 96th orders. Specifically, the 24th-order force wave is generated by the interaction between the 5th and 7th harmonics of the rotor and stator (e.g., when and , or vice versa).
This theoretical analysis aligns perfectly with the experimental observation of the 24th-order noise peak, confirming that the starting noise is driven by these specific harmonic interactions.
2.2.2. Simulation Analysis of Powertrain Mounting Modes and Decoupling
While torque and energy decoupling strategies are well-established for internal combustion engine (ICE) mounting systems, the distinct characteristics of electric powertrains necessitate a specialized analytical approach. Unlike ICEs, electric motors can deliver maximum torque at zero speed with rapid transient response, significantly amplifying electromagnetic noise in the low-speed range. Furthermore, compared to traditional engine-transmission assemblies, electric powertrains (comprising the motor and reducer) have significantly lower mass and exhibit markedly different natural frequency characteristics.
Therefore, an analysis tailored to the unique attributes of the electric drive assembly is essential. The powertrain investigated in this study comprises a permanent magnet synchronous motor (PMSM), a reducer, and a differential integrated within the reducer housing. The system employs a three-point mounting configuration. The specific layout and its simplified physical model are illustrated in Figure 10. Given that the natural frequencies of the mounting system typically range from 5 to 80 Hz—far below the first-order elastic mode of the powertrain structure itself—the powertrain is modeled as a six-degree-of-freedom (6-DOF) rigid body for vibration isolation analysis. The rubber mounts are simplified as spring-damper elements with stiffness and damping properties in three orthogonal directions.
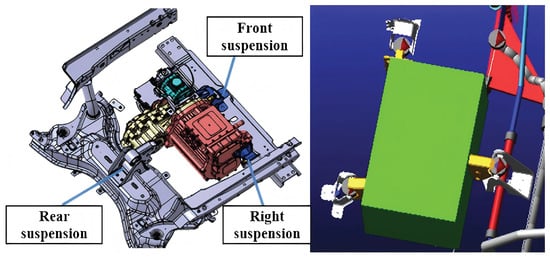
Figure 10.
Powertrain layout structure and its simplified 6-DOF model.
The origin of the coordinate system is defined at the center of gravity (CG) of the powertrain. The X-axis is horizontal and points towards the vehicle’s rear, the Y-axis is parallel to the motor shaft, and the Z-axis is vertical. The motion of the powertrain is defined by translations x, y, z along the X, Y, and Z axes, and rotations , , about these axes, respectively. Consequently, the generalized coordinate vector of the powertrain, , is expressed as:
The differential equation of motion for the mounting system is established based on vibration theory:
where is the mass matrix, is the damping matrix, is the stiffness matrix, is the generalized coordinate vector, and is the generalized force vector.
To determine the natural frequencies of the mounting system, the influence of damping is neglected, simplifying the equation to an undamped free vibration problem:
The natural frequencies are then obtained by solving the characteristic equation derived from Equation (7):
The relevant simulation parameters for the powertrain mounting system used in this study are listed in Table 3.
Table 3.
Simulation parameters of the mounting system.
The ADAMS/Vibration module was employed to calculate the natural frequencies and mode energy decoupling rates of the powertrain mounting system. The simulation results are presented in Table 4.
Table 4.
Natural frequencies and decoupling rates of the powertrain mounting system.
The results indicate that the natural frequencies of the powertrain system are distributed between 20 Hz and 75 Hz, which aligns well with the experimental data. Notably, the sixth natural frequency, corresponding to rotation about the Y-axis (Pitch), is located at **73.4 Hz**. This frequency is critically high and poses a significant risk of resonance with the 24th-order motor excitation during startup. Furthermore, the decoupling rates for the Z-direction (Bounce) and Y-axis rotation (Pitch) are suboptimal, failing to meet the design targets (highlighted by values lower than the target). This insufficient decoupling facilitates the transmission of vibrations, necessitating optimization of the mounting system.
3. Optimization Strategy and Experimental Verification
Based on the preceding experimental validation and theoretical analysis, it is established that the vehicle startup noise arises from a resonance between the natural frequency of the electric powertrain’s mounting system and the 24th-order electromagnetic excitation of the motor. This structure-borne noise propagates to the vehicle body through the mounting system, manifesting as low-frequency vibration and objectionable audible noise during launch. To effectively mitigate this issue, a comprehensive diagnosis typically examines the “source-path-response” chain. Balancing efficacy with development costs and project timelines, this study proposes an integrated optimization strategy focusing on two key domains: the excitation source and the transmission path.
To ensure the transparency and reproducibility of the optimization process, the optimization framework adopted in this study is formally defined as follows:
Objective Function: The primary objective is to minimize the interior sound pressure level () at the driver’s ear position during the low-speed starting phase (130–200 rpm), specifically targeting the 24th-order harmonic component ().
Decision Variables: The optimization involves a multi-domain variable set , where is the torque limit threshold in the creep map, is the dead-time compensation voltage vector, and represents the static stiffness of the powertrain mounts in three orthogonal directions.
Constraints: The optimization is subject to the following engineering constraints: (1) Vehicle acceleration performance (0–50 km/h time) must not deteriorate; (2) The decoupling rate of the mount system’s energy distribution must exceed 80%; (3) No hardware modifications to the motor internal structure are permitted (to strictly control costs).
Solution Procedure: A staged iterative approach is employed. First, the source excitation is suppressed by refining the control variables (). Subsequently, the transmission path is optimized by adjusting the stiffness variables () using the ADAMS/Insight response surface method. This aims to shift the structural natural frequency away from the excitation frequency () to avoid resonance.
3.1. Optimization of Motor Control Strategy
The electromagnetic noise of a permanent magnet synchronous motor (PMSM) is not only determined by structural factors such as rotor skew type, skew angle, and stator winding configuration but is also strongly correlated with the inverter-induced harmonics and stator magnetic field intensity. This is particularly pronounced under low-speed, high-torque conditions. At such operating points, high phase currents significantly increase the amplitude of the electromagnetic force acting on the motor, thereby amplifying electromagnetic vibration and noise.
To theoretically clarify the noise generation mechanism, the radial electromagnetic force density wave of the motor, , can be expressed as:
where is the vacuum permeability and is the radial magnetic flux density.
Furthermore, to analyze the harmonic contribution, the stator -th harmonic magnetomotive force (MMF), , induced by the l-th harmonic current is described as follows:
In this formula, represents the amplitude of the -th harmonic MMF of the stator winding, p is the number of pole pairs, and is the fundamental angular frequency of the magnetic potential.
Consequently, reducing the amplitude of the excitation current or attenuating specific harmonic components is a critical method for mitigating electromagnetic noise. Based on this theoretical framework, two strategies were adopted in this study. The first strategy involves calibrating the starting output torque to reduce the radial force waves of the motor in the frequency band near the powertrain’s natural frequency. The second strategy focuses on reducing stator current harmonics—especially low-frequency components generated by the inverter—through dead-time compensation technology, thereby suppressing the amplitude of force wave components at specific frequency points.
3.1.1. Calibration Optimization of Launch Strategy
Experimental findings indicate that the starting noise is not solely dependent on rotational speed but also exhibits a strong correlation with the motor’s output torque. Specifically, when the motor’s output torque is restricted to below 55 N·m within the critical speed range of 130–200 rpm, the generated noise is significantly attenuated. Therefore, while maintaining the vehicle’s drivability, the control strategy aims to minimize the excitation energy near the resonant speed.
(1) Optimization of the Creep Strategy
The torque slew rate (rate of change) and the absolute torque magnitude during the creep phase were recalibrated. The optimized motor torque output is illustrated in Figure 11. As shown, the maximum torque in the 0–300 rpm range has been reduced from 65 N·m to below 55 N·m. It should be noted that this torque reduction is a transient adjustment specifically applied during the resonance speed range (approx. 130–200 rpm). Once the motor speed exceeds this critical band, the torque capability is fully restored, ensuring that the overall vehicle acceleration performance (e.g., 0–50 km/h time) remains unaffected. Concurrently, the torque slew rate was reduced to smooth the transition. To compensate for the reduced peak torque, the initial preset torque at the onset of launch was increased by approximately 10 N·m. Real-world testing confirms that, due to this increased initial response, the vehicle’s creep startup speed is maintained despite the reduction in peak torque within the resonant band.
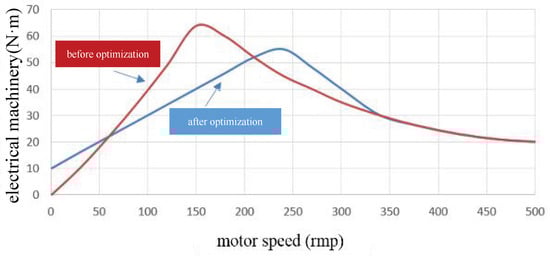
Figure 11.
Comparison of motor torque output curves during creep startup.
(2) Optimization of the Acceleration Strategy
Given the strong coupling between noise, speed, and torque during launch, the torque request map (pedal map) was recalibrated. A “concave” pedal mapping strategy was adopted for the low-speed range (0–400 rpm). This ensures that when the accelerator pedal position is below 40%, the maximum motor torque is capped at 55 N·m. This constraint forces the motor to bypass the powertrain mount resonance point with lower excitation force, thereby mitigating acceleration noise. Conversely, when the pedal position exceeds 40%, the torque limit is lifted to allow outputs greater than 55 N·m, satisfying the driver’s demand for rapid acceleration. For other speed ranges, a “convex” mapping is employed to optimize responsiveness. The optimized torque strategy across different speeds and pedal positions is depicted in Figure 12. Test results demonstrate that this tailored torque curve effectively reduces starting noise while preserving the vehicle’s acceleration performance.
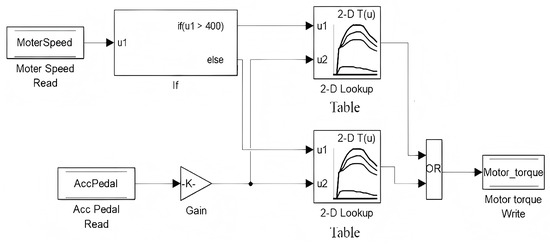
Figure 12.
Optimized motor torque output strategy during acceleration.
3.1.2. Controller Dead Zone Compensation Optimization
The electric vehicle drive system employs a three-phase voltage source inverter. To prevent a short circuit caused by the simultaneous conduction of the upper and lower switches in the same leg, a “dead time” must be inserted into the PWM control signals. However, this dead time introduces nonlinearities that distort the output voltage and current, thereby increasing the harmonic content. This effect is particularly detrimental to low-frequency currents, primarily introducing 5th and 7th harmonic distortions. These low-order current harmonics interact with the fundamental magnetic field to generate radial electromagnetic force waves at orders of (e.g., the critical 24th order), which directly contribute to the low-frequency noise issue.
To ameliorate the stator current waveform and suppress these noise-inducing harmonics, an optimized dead-time compensation strategy was implemented. The specific methodology is as follows:
First, the polarity of the three-phase currents is detected to determine the direction of the required compensation. Subsequently, the dead-time voltage error vector is calculated using the following equation:
where represents the forward voltage drop of the freewheeling diode, is the on-state voltage drop of the IGBT, is the PWM carrier period, is the sign function of the corresponding phase current, and is the dead time duration.
This calculated error voltage vector is then superimposed onto the reference voltage vector generated by the Space Vector Pulse Width Modulation (SVPWM) module to produce a compensated output. Figure 13 illustrates the block diagram of the PMSM vector control system incorporating this compensation logic.
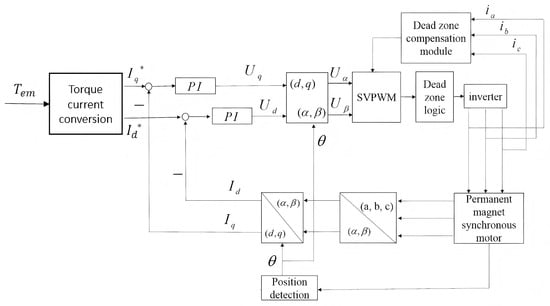
Figure 13.
Block diagram of the PMSM vector control system with dead-time compensation.
Figure 14 presents a comparative analysis of the stator current waveforms before and after the implementation of the dead-time compensation strategy. As evident in Figure 14a, the current waveform under the traditional fixed dead-time strategy exhibits noticeable distortion near the zero-crossing points. In contrast, the waveform after optimization, shown in Figure 14b, is significantly smoother and approaches a pure sinusoid. This visual evidence confirms a substantial reduction in the harmonic components of the stator current. This reduction in current harmonics directly leads to the effective suppression of the 24th-order electromagnetic force wave, a finding that is consistent with the theoretical predictions.
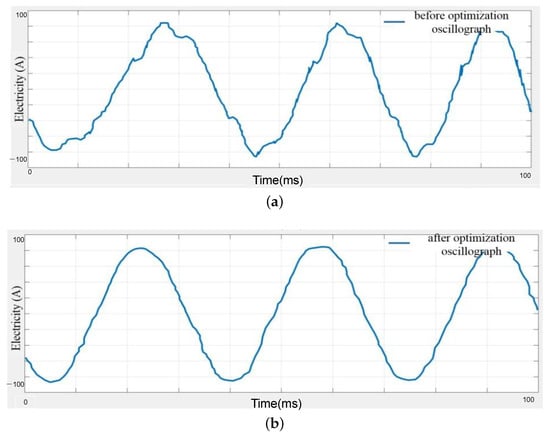
Figure 14.
Comparison of stator current waveforms: (a) before optimization (fixed dead-zone) and (b) after optimization (with compensation).
3.2. Optimization of the Powertrain Mounting System
The dynamic characteristics of the powertrain mounting system are governed by factors such as damping, stiffness, and the geometric layout of the mounts. In practical engineering scenarios, especially for a vehicle model approaching mass production, the system’s intrinsic parameters (mass, center of gravity, moments of inertia) and the mount locations are typically fixed constraints. Consequently, the optimization is restricted to the physical properties of the mount components themselves. In this study, the static stiffness of the mounts was selected as the optimization variable. The ADAMS/Insight module, utilizing a third-order Response Surface Methodology (RSM) design of experiments, was employed to optimize the electric vehicle’s powertrain mounting system.
To formalize this optimization process, the problem was structured as follows:
Objective Function: The primary objective was to maximize the energy decoupling rate of the powertrain mounting system in the vertical (Z) direction, while ensuring that the static displacement of the mounts remained below 1 mm under nominal load.
Decision Variables: The decision variables were the static stiffness values () for the three mounts (Right, Front, and Rear).
Constraints: The optimization was subject to several constraints: (1) The six rigid-body natural frequencies of the powertrain must avoid the main excitation frequency bands (specifically the 24th and 48th motor orders); (2) The dynamic displacement of the powertrain’s center of gravity must be limited to ≤1.5 mm; (3) The final decoupling rate in the Z-direction must be ≥88%.
Table 5 presents a comparison of the mount stiffness parameters before and after optimization.
Table 5.
Optimized mounting stiffness parameters (Original/Optimized).
As detailed in Table 5, the static stiffness values in the X, Y, and Z directions have been adjusted to achieve superior decoupling. Notably, the Z-direction stiffness for all mounts was reduced compared to the initial values. For instance, the stiffness of the right mount was decreased from 300 N/mm to 210 N/mm in the X-direction (or relevant direction based on table data), with corresponding reductions for the front and rear mounts. These parameter adjustments are designed to lower the natural frequencies of the powertrain mounting system, thereby avoiding resonance with the motor excitation during the critical starting phase.
Table 6 summarizes the system’s modal characteristics following optimization. The data indicates that the highest natural frequency of the powertrain mount system has been reduced from 73.4 Hz to 62.7 Hz. This reduction is advantageous as it allows the powertrain to pass through the resonance frequency range more quickly during startup, thereby minimizing the duration of resonance. Furthermore, the decoupling rate in the critical Z-direction increased from 75.99% to 96.19%, and the Y-direction decoupling rate improved to 93.02%. These results fully satisfy the design requirements.
Table 6.
Natural frequencies and decoupling rates of the powertrain after optimization.
Figure 15 illustrates the comparative effect on the vibration isolation rate before and after optimization, serving as the experimental validation of the proposed stiffness refinement. The optimization was performed using the ADAMS/Insight module with a third-order response surface design.
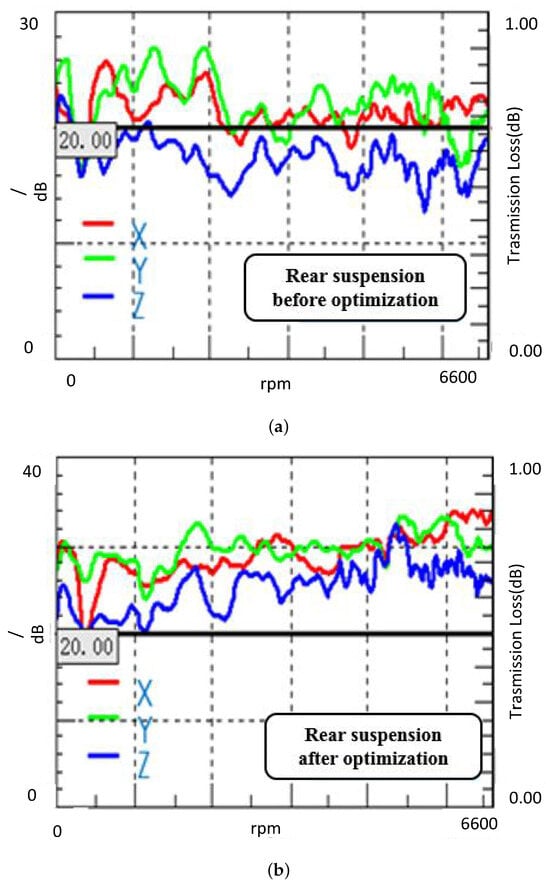
Figure 15.
Comparison of the isolation rate of the rear mount: (a) Before optimization; (b) After optimization.
As shown in the comparison, the isolation rate of the rear mount has been significantly improved. The baseline performance is displayed in Figure 15a, while the optimized result is presented in Figure 15b. In the optimized state, the isolation rate consistently exceeds 20 dB within the target frequency range. This demonstrates that the optimized stiffness parameters effectively decouple the powertrain vibration from the vehicle body, particularly in the Z-direction.
3.3. Verification of Comprehensive Optimization Effects
To empirically validate the efficacy of the proposed optimization strategy, comprehensive vehicle road tests were conducted following the implementation of the control strategy refinements and mounting system adjustments.
The effectiveness of the optimization is demonstrated by comparing the in-cabin noise spectrograms (waterfall plots) recorded before and after the implementation.
Figure 16 presents the noise comparison during a creep start. A visual inspection of the baseline noise map (Figure 16a) reveals a distinct low-frequency droning noise. In contrast, the optimized result (Figure 16b) clearly shows that this prominent “um” sound (low-frequency resonance) has been effectively eliminated.
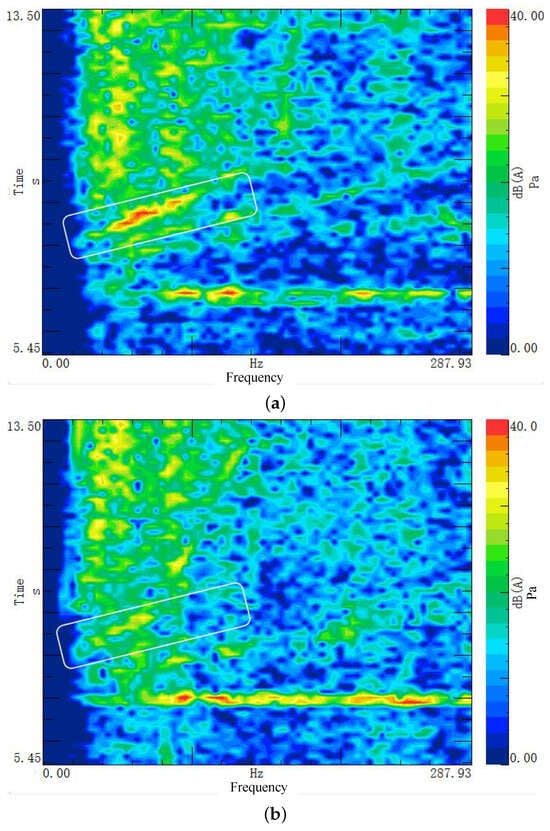
Figure 16.
Comparison of in-cabin noise during creep start: (a) Before optimization; (b) After optimization.
Similarly, Figure 17 illustrates the comparison for an accelerated start scenario. The overall noise floor is significantly suppressed, as evidenced by comparing the pre-optimization spectrogram (Figure 17a) with the post-optimization result (Figure 17b). Quantitative analysis indicates that the total sound pressure level (SPL) is reduced by 4–6 dB(A). Post-optimization, the maximum SPL in the cabin is maintained within the range of 35–40 dB(A), which corresponds to an excellent level of acoustic comfort according to general automotive NVH standards [42].
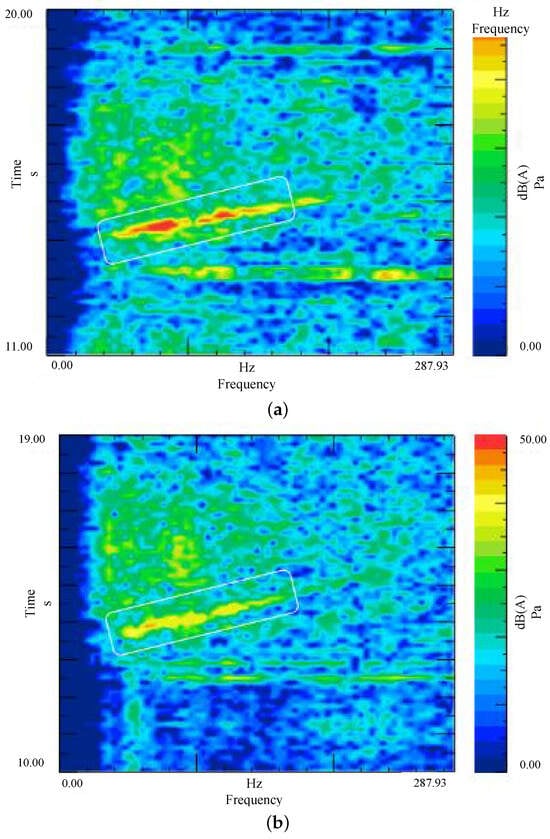
Figure 17.
Comparison of in-cabin noise during accelerated start: (a) Before optimization; (b) After optimization.
It is worth noting that although this study validates the optimization scheme on a specific small electric vehicle equipped with an 8-pole 48-slot motor, the proposed integrated methodology possesses strong engineering generality. The core principle—identifying the coupling mechanism between motor harmonic orders and powertrain structural modes, followed by the application of a combined “Source-Path-Response” control strategy—is applicable to other vehicle models and motor configurations. For instance, for motors with different pole-slot combinations (e.g., 8-pole 12-slot), while the specific resonance frequencies will differ, the proposed methodology of refining the torque control strategy to bypass resonance bands and optimizing mount stiffness to improve decoupling rates remains fundamentally effective. Furthermore, since the optimization significantly enhances the vibration isolation performance of the mounting system, the NVH performance under other operating conditions (such as constant-speed cruising) is inherently improved, demonstrating the broad potential for engineering applications.
4. Conclusions
This study systematically investigated the mechanism of objectionable noise during the low-speed starting phase of an electric vehicle and proposed an integrated optimization solution. The mechanism analysis revealed that the low-frequency noise was primarily caused by the structural resonance of the powertrain system at approximately 74 Hz, which coincided with the 24th-order electromagnetic excitation force of the drive motor. This resonance was transmitted to the vehicle body through the powertrain mounting system, resulting in significant interior noise and vibration.
To address this issue without altering the electromagnetic design of the motor (hardware), a low-cost, comprehensive optimization scheme was developed. This scheme integrated the optimization of the power source control strategy with the refinement of the transmission path. Specifically, motor controller dead-time compensation was adjusted to suppress the excitation source. Simultaneously, the static stiffness of the powertrain mounts was optimized to enhance vibration isolation performance. Simulation and experimental results demonstrated that the decoupling rate of the mounting system in the vertical (Z) direction increased significantly from 75.99% to 96.19%, effectively shifting the system’s natural frequency away from the resonance band.
Road test validation confirmed the effectiveness of the proposed measures. The distinct “um” droning sound during the creep start phase was eliminated, and the sound pressure level at the driver’s ear was reduced by 4–6 dB(A). Consequently, the in-cabin sound quality was markedly improved. This research provides a validated, cost-effective engineering methodology for diagnosing and resolving low-frequency NVH problems in electric vehicles.
However, this study has certain limitations. First, the research primarily focused on low-speed starting conditions; the detailed coupling mechanisms under high-speed and high-load conditions warrant further investigation. Second, although the sound pressure level was significantly reduced, a comprehensive subjective evaluation using psychoacoustic metrics (such as loudness and sharpness) was not fully conducted. Future work will focus on establishing a multi-physics coupling model for the electric drive system across the full speed range and integrating psychoacoustic evaluations to further enhance the sound quality of electric vehicles.
Author Contributions
Conceptualization, X.X., W.H. and Y.Y.; Methodology, W.H. and X.X.; Validation, Q.X. and K.L.; Formal Analysis, W.H. and X.X.; Investigation, K.L.; Resources, X.X.; Data Curation, Q.X. and X.X.; Writing—Original Draft Preparation, Y.Y.; Writing—Review and Editing, W.H. and X.X.; Visualization, W.H.; Supervision, W.H.; Project Administration, W.H. and Q.X.; Funding Acquisition, W.H. and X.X. All authors have read and agreed to the published version of the manuscript.
Funding
This work was supported in part by the Natural Science Outstanding Youth Foundation of Hunan Province, China, under Grant 2019JJ20017; in part by the National Natural Science Foundation of China, under Grant 51875049; and in part by the Hunan Provincial Key Research and Development Program, China, under Grant 2020SK2099.
Data Availability Statement
All data included in this study are available from the corresponding author upon request.
Conflicts of Interest
Author Keying Luo was employed by the company Kaili Power Supply Bureau of Guizhou Power Grid Co., Ltd. The remaining authors declare that the research was conducted in the absence of any commercial or financial relationships that could be construed as a potential conflict of interest.
References
- Sanguesa, J.A.; Torres-Sanz, V.; Garrido, P.; Martinez, F.J.; Marquez-Barja, J.M. A review on electric vehicles: Technologies and challenges. Smart Cities 2021, 4, 372–404. [Google Scholar] [CrossRef]
- Chen, Q.; Xie, Y.; Guo, S.; Bai, J.; Shu, Q. Sensing System of Environmental Perception Technologies for Driverless Vehicle: A Review of State of the Art and Challenges. Sens. Actuators Phys. 2021, 319, 112566. [Google Scholar] [CrossRef]
- Yu, X.; Li, B.; Zhang, T.; Tan, C.; Yan, H. Variable weight coefficient optimization of gearshift actuator with direct-driving automated transmission. IEEE Access 2020, 8, 4860–4869. [Google Scholar] [CrossRef]
- Hua, X.; Thomas, A.; Shultis, K. Recent progress in battery electric vehicle noise, vibration, and harshness. Sci. Prog. 2021, 104, 00368504211005224. [Google Scholar] [CrossRef]
- Huang, J.; Chen, Y.; Peng, X.; Hu, L.; Cao, D. Study on the driving style adaptive vehicle longitudinal control strategy. IEEE/CAA J. Autom. Sin. 2020, 7, 1107–1115. [Google Scholar] [CrossRef]
- Hu, L.; Bao, X.-Q.; Lin, M.; Yu, C.; Wang, F. Research on risky driving behavior evaluation model based on CIDAS real data. Proc. Inst. Mech. Eng. Part J. Automob. Eng. 2021, 235, 2176–2187. [Google Scholar] [CrossRef]
- Hu, L.; Hu, X.-T.; Wan, J.; Lin, M.; Huang, J. The injury epidemiology of adult riders in vehicle-two-wheeler crashes in China, Ningbo. J. Saf. Res. 2019, 72, 21–28. [Google Scholar] [CrossRef] [PubMed]
- Hao, W.; Liu, L.; Yang, X.; Li, Y.; Byon, Y.-J. Reducing cacc platoon disturbances caused by state jitters by combining two stages driving state recognition with multiple platoons’ strategies and risk prediction. IEEE Trans. Intell. Transp. Syst. 2020, 23, 2144–2154. [Google Scholar] [CrossRef]
- Xu, P.; Li, H.; Hu, D.; Cao, C. Research on vibration response of a reducer of electric vehicle. Vibroeng. Procedia 2020, 33, 60–65. [Google Scholar] [CrossRef]
- Horvath, K.; Feszty, D. Surface Waviness of EV Gears and NVH Effects—A Comprehensive Review. World Electr. Veh. J. 2025, 16, 540. [Google Scholar] [CrossRef]
- Im, D.; Lee, Y.; Yim, H.-H.; Cho, H.; Chung, W.-J.; Park, Y.-J. High-Fidelity Methodology for Vibration Prediction of Electric Vehicle Gearbox Using Multibody Dynamics Simulation; SAE Technical Paper; SAE International: Warrendale, PA, USA, 2022. [Google Scholar]
- Zhou, W.; Zuo, Y.; Zheng, M. Analysis and optimization of the vibration and noise of a double planetary gear power coupling mechanism. Shock Vib. 2018, 11, 9–21. [Google Scholar] [CrossRef]
- Qian, K.; Hou, Z. Intelligent evaluation of the interior sound quality of electric vehicles. Appl. Acoust. 2021, 173, 107684. [Google Scholar] [CrossRef]
- Steinbach, L.; Altinsoy, M.E. Prediction of annoyance evaluations of electric vehicle noise by using artificial neural networks. Appl. Acoust. 2019, 145, 149–158. [Google Scholar] [CrossRef]
- Wang, Z.; Li, P.; Liu, H.; Yang, J.; Liu, S.; Xue, L. Objective sound quality evaluation for the vehicle interior noise based on responses of the basilar membrane in the human ear. Appl. Acoust. 2021, 172, 107619. [Google Scholar] [CrossRef]
- Huang, H.; Wu, J.; Huang, X.; Yang, M.; Ding, W. A generalized inverse cascade method to identify and optimize vehicle interior noise sources. J. Sound Vib. 2019, 467, 115062. [Google Scholar] [CrossRef]
- Huang, H.; Wu, J.; Lim, T.C.; Yang, M.; Ding, W. Pure electric vehicle nonstationary interior sound quality prediction based on deep CNNs with an adaptable learning rate tree. Mech. Syst. Signal Process. 2020, 148, 107170. [Google Scholar] [CrossRef]
- Licitra, G.; Bernardini, M.; Moreno, R.; Bianco, F.; Fredianelli, L. CNOSSOS-EU coefficients for electric vehicle noise emission. Appl. Acoust. 2023, 211, 109511. [Google Scholar] [CrossRef]
- Huang, H.; Wu, J.; Huang, X.; Ding, W.P.; Yang, M.L. A novel interval analysis method to identify and reduce pure electric vehicle structure-borne noise. J. Sound Vib. 2020, 475, 115258. [Google Scholar] [CrossRef]
- Wang, R.; Yang, C.; Li, J.; Gong, Y.; Liu, H.; Zhang, J. Research of vibration and noise analysis method of high-speed gear for electric vehicle. J. Mech. Transm. 2019, 43, 32–36. [Google Scholar]
- Du, J.; Hu, L.; Mao, J.; Zhang, Y. Optimal vibration suppression modification method for high-speed helical gear transmission of battery electric vehicles under full working conditions. Machines 2021, 9, 226. [Google Scholar] [CrossRef]
- Qin, Y.; Tang, X.; Jia, T.; Duan, Z.; Zhang, J.; Li, Y.; Zheng, L. Noise and vibration suppression in hybrid electric vehicles: State of the art and challenges. Renew. Sustain. Energy Rev. 2020, 124, 109782. [Google Scholar] [CrossRef]
- Zou, Y.; Pang, F.; Fan, Z. Coupling research on dynamical behavior and elastohydrodynamic lubrication property of helical gear. J. Mech. Eng. 2019, 55, 109–119. [Google Scholar] [CrossRef]
- Horváth, K.; Zelei, A. Simulating noise, vibration, and harshness advances in electric vehicle powertrains: Strategies and challenges. World Electr. Veh. J. 2024, 15, 367. [Google Scholar] [CrossRef]
- Kang, Q.; Gu, P.; Li, J.; Zuo, S. A research on the evaluation method of high-frequency whining noise in electric drivetrain. Automot. Eng. 2019, 41, 682–687. [Google Scholar]
- Wang, Y.S.; Guo, H.; Yuan, T.; Ma, L.; Wang, C. Electromagnetic noise analysis and optimization for permanent magnet synchronous motor used on electric vehicles. Eng. Comput. 2021, 38, 699–719. [Google Scholar] [CrossRef]
- Hu, K.; Zhang, G.; Zhang, W. Analysis and design of electromagnetic vibration and noise reduction method of permanent magnet motor. J. Low Freq. Noise Vib. Act. Control 2022, 41, 359–373. [Google Scholar] [CrossRef]
- Wang, Q.S.; Zeng, J.; Mao, R.C.; Jiang, X.S. Parameters optimum of multiple underframe suspended equipment on high-speed railway vehicle carbody vibration control by using an improved genetic algorithm. J. Vib. Control 2023, 30, 5578–5588. [Google Scholar] [CrossRef]
- Yang, Y.; Liu, C.N.; Chen, L.; Zhang, X.L. Phase deviation of semi-active suspension control and its compensation with inertial suspension. Acta Mech. Sin. 2024, 40, 523367. [Google Scholar] [CrossRef]
- Ghosh, A.; Chatterjee, S. An overview on various sources of vibration in electric vehicle and their identification techniques. J. Braz. Soc. Mech. Sci. Eng. 2023, 45, 401. [Google Scholar] [CrossRef]
- Su, H.; Zhang, L.; Meng, D.; Xu, J. NVH Comparative Analysis of 3in1 and 2in1 Electric Drive System Based on Experimental Research; SAE Technical Paper; SAE International: Warrendale, PA, USA, 2022. [Google Scholar]
- Sun, C.; Li, Q.; Fan, T.; Wen, X.; Li, Y. Low electromagnetic vibration design of double-layer interior permanent magnet machines for electric vehicle. Energy Rep. 2021, 7, 147–156. [Google Scholar] [CrossRef]
- Wang, R.; Liu, T.; Zhang, C.; Yu, L.; Li, J. Noise source localization in permanent magnet synchronous motors under time-varying speed working conditions. Appl. Acoust. 2022, 192, 108724. [Google Scholar] [CrossRef]
- Xu, Y.; Zhang, W.; Huang, Y.; Zou, J. Reduction method of high-frequency audible PWM noise for three-phase permanent magnet synchronous motors. Energy Rep. 2020, 6, 1123–1129. [Google Scholar] [CrossRef]
- Hu, L.; Hu, X.; Che, Y.; Feng, F.; Lin, X.; Zhang, Z. Reliable state of charge estimation of battery packs using fuzzy adaptive federated filtering. Appl. Energy 2020, 262, 114569. [Google Scholar] [CrossRef]
- Hu, L.; Wu, X.-H.; Huang, J.; Peng, Y.; Liu, W. Investigation of clusters and injuries in pedestrian crashes using GIS in Changsha, China. Saf. Sci. 2020, 127, 104710. [Google Scholar] [CrossRef]
- Hu, L.; Ou, J.; Huang, J.; Chen, Y.; Cao, D. A review of research on traffic conflicts based on intelligent vehicles. IEEE Access 2020, 8, 24471–24483. [Google Scholar] [CrossRef]
- Li, S.-H.; Chen, K. Analysis of Influence of Electric Drive Assembly on Vehicle Interior Noise Based on Order and Transfer Path Analysis. Noise Vib. Control 2023, 43, 203. [Google Scholar]
- Li, Q.; Liu, S. Source identification of vibration noise from an in-built permanent magnet synchronous motor of electric vehicle under operating conditions. Noise Vib. Control 2022, 42, 194. [Google Scholar]
- Lin, J.; Wu, M. Research on the noise of permanent magnet synchronous motor based on modal analysis. Mech. Des. 2020, 37, 33–38. [Google Scholar]
- Xie, Y.; Xin, W.; Cai, W.; Fan, Y. Electromagnetic performance and vibration noise analysis of different rotor topologies of the in-built permanent magnet synchronous motor. Electr. Mach. Control/Dianji Yu Kongzhi Xuebao 2023, 27, 110–119. [Google Scholar]
- GB/T 18697-2002; Acoustics—Measurement of Noise Inside Motor Vehicles. General Administration of Quality Supervision, Inspection and Quarantine of the People’s Republic of China: Beijing, China, 2002.


Disclaimer/Publisher’s Note: The statements, opinions and data contained in all publications are solely those of the individual author(s) and contributor(s) and not of MDPI and/or the editor(s). MDPI and/or the editor(s) disclaim responsibility for any injury to people or property resulting from any ideas, methods, instructions or products referred to in the content. |
© 2026 by the authors. Published by MDPI on behalf of the World Electric Vehicle Association. Licensee MDPI, Basel, Switzerland. This article is an open access article distributed under the terms and conditions of the Creative Commons Attribution (CC BY) license.