Abstract
The integration of electric buses into urban transportation networks is a priority for policymakers aiming to promote sustainable public mobility. Among available technologies, electric Bus Rapid Transit (eBRT) systems offer an environmentally friendly and operationally effective alternative to conventional modes. This study introduces a Machine Learning Decision Support Framework designed to assess the feasibility of deploying eBRT systems in urban environments. Using a dataset of 28 routes in the Athens Metropolitan Area, the framework integrates diverse variables such as land use, population coverage, proximity to public transport, points of interest, road characteristics, and safety indicators. The XGBoost model demonstrated strong predictive performance, outperforming traditional approaches and highlighting the significance of points of interest, land use diversity, green spaces, and roadway infrastructure in forecasting travel times. Overall, the proposed framework provides urban planners and policymakers with a robust, data-driven tool for evaluating the practical and environmental viability of eBRT systems.
1. Introduction
Bus Rapid Transit (BRT) systems have been popular worldwide, as they deliver fast, efficient, and reliable public transport services by combining the flexibility of buses with the efficiency of rail systems. Indeed, their operation along dedicated lanes, along with features such as frequent service, off-board fare collection and priority at signalized intersections, allows them to avoid congestion and improve travel times [1,2,3]. Most importantly though, the deployment of BRT systems can be implemented incrementally and adapted to existing urban infrastructures, at lower costs compared to rail systems [4,5]. Overall, BRTs enhance the user experience and increase the overall capacity and reliability of transit systems [1,2,3]. Furthermore, BRT systems do encourage transit-oriented development and urban regeneration around corridors, support shifting from private vehicles and pollution reduction, thereby contributing to the creation of cleaner and healthier urban environments [6,7]. In recent years, electrification has been introduced in BRT systems worldwide (e-BRT), to improve their carbon footprint, reduce air and noise pollution associated with their operation, and enhance their public perception as modern transit systems [8,9,10]. Beyond the core benefits of a standard BRT line, e-BRTs can deliver improved air quality, social equity, and act as catalysts for sustainable urban development, through optimized planning and design [11,12,13]. Notable e-BRT efforts include the Los Angeles Metro G Line, the Transmilenio system in Bogotá, Colombia, and the TransJakarta system in Jakarta, Indonesia [8,9,10,14].
The deployment of a BRT line along a corridor entails a comprehensive decision-making process and appropriate supporting tools to guarantee its efficacy. Several factors are usually assessed for deciding upon introducing a BRT line: demand and mobility patterns, corridor attributes, environmental and social considerations, the urban context, operational constraints and so on [15,16]. Also, different methods have been utilized to assess the potential and success of possible BRT deployments, including multicriteria decision analyses (MCDA), cost–benefit analyses (CBA), performance metrics and machine learning [2,5,16,17,18,19,20,21]. Given the above this paper proposes a quick response, practical tool for assessing the potential of establishing e-BRT corridors, utilizing machine learning methods. In particular, a machine learning algorithm (XGBoost–eXtreme Gradient Boosting) is developed for identifying most prominent corridors for establishing e-BRT services, according to different traffic, urban space and environmental factors [22]. The algorithm is calibrated using data from Athens, Greece, and used for evaluating different options of establishing e-BRT corridor in the city. The remainder of this paper is structured as follows; the following section outlines the methodology employed in this study, together with a description of the case study area. The subsequent section presents the results and discussion, with particular attention paid to road axes where the deployment of an eBRT system would be more suitable. The paper concludes with a summary of the main findings of the study.
The workflow of the model development comprises four key stages: (i) identification and preprocessing of variables affecting eBRT suitability along a corridor—including land use, population coverage, road characteristics, safety indicators, and public transport access; (ii) model development and training using travel time ratio data; (iii) prediction and validation of corridor performance under eBRT scenarios, including road reallocation; and (iv) estimation of environmental gains based on macroscopic traffic flow approximations and emission factors. This holistic approach offers a quick response, practical, data-driven means of supporting investment decisions in sustainable public transit infrastructure.
2. Materials and Methods
2.1. Overview and Study Area
The framework of this study aims to assist urban and transportation planners in related decision-making, by integrating spatial, infrastructural, and socio-environmental parameters into a predictive modeling process. The methodology uses an XGBoost algorithm to evaluate and rank road corridors according to their suitability for eBRT deployment. The algorithm employs travel time ratios (actual to free-flow travel time) as a proxy for describing e-BRT corridor performance, congestion and environmental conditions; this is used as the criterion for evaluating the potential of establishing an eBRT line along a corridor. The Athens Metropolitan Area (AMA) in Greece serves as the study area for evaluating the deployment of eBRT lines. Candidate corridors for e-BRT deployment are identified for that purpose; these are characterized by high-volume traffic, multiple lanes, and relatively long lengths. To provide a benchmark for deploying an eBRT system, several variables are considered and related target variables are selected for assessment.
2.2. Overview of XGBoost ML Algorithm
Extreme Gradient Boosting (XGBoost) is a robust machine learning algorithm that significantly improves the performance of the traditional Gradient Boosting Decision Tree (GBDT) method. XGBoost was developed to address the limitations of existing predictive models, and it provides a robust solution for various applications, including transportation systems. The algorithm converts a large number of weak classifiers into a strong classifier through iterative improvements, which results in high accuracy and efficiency in predictive tasks [23]. XGBoost is based on the concept of gradient boosting, where the model adds new trees in an iterative manner to reduce the residuals (errors) from previous iterations. This method enhances the model’s ability to capture complex patterns and interactions within the data. The core objective of XGBoost is to optimize a differentiable loss function, using a gradient descent-like procedure. The loss function typically used is a combination of a convex loss term that measures the difference between the predicted and actual values and a regularization term that penalizes model complexity to prevent overfitting [24]. Mathematically, the objective function to be minimized in XGBoost is expressed as
where
l is the loss function,
is the regularization term,
are the predicted values,
are the actual values,
are the number of leaves (terminal nodes) in tree ,
is the complexity penalty per leaf. A larger discourages adding new leaves, so the model prefers shallower/simpler trees,
is the vector of leaf scores (one value per leaf, with the prediction made by that leaf),
is the L2 regularization coefficient on these leaf scores,
so that shrinks the leaf scores toward zero, preventing extremely large weights and helping avoid overfitting. Generally, measures how complex a tree is, as more leaves and larger leaf weights lead to larger .
XGBoost is a highly efficient and flexible implementation of the gradient boosting algorithm, which is widely utilized for supervised learning tasks, including classification and regression [22]. The fundamental concept underlying gradient boosting is the combination of multiple weak models to form a robust predictive model. Each newly trained weak model is sequentially added to the ensemble, thereby enhancing the overall predictive power by addressing the errors of the previous models. Upon training the model, feature importance is evaluated, which can subsequently be leveraged for predictive purposes. For tuning the hyperparameters of the model, a grid search approach with cross-validation is employed. This method allows for automatic calibration of the model by selecting the optimal combination of hyperparameters.
XGBoost has been increasingly applied to various transportation related problems, because of its capacity to handle large datasets and its resilience against overfitting. For example, in traffic volume prediction, XGBoost has exhibited superior performance by accurately forecasting hourly traffic volumes under diverse conditions, including extreme weather and holidays [23]. In the context of bus transit systems, XGBoost has been employed for the purpose of predicting travel times between bus stations. This process entails the exploitation of historical travel time data and a multitude of influencing factors, including weather conditions, traffic congestion, and bus schedules. The capacity of XGBoost to discern nonlinear relationships and interactions among these factors renders it especially well-suited for this application. For instance, Zhu et al. [25] employed XGBoost to predict travel times with remarkable precision, incorporating real-time traffic data and environmental conditions. The travel time ratio serves as a robust composite indicator for congestion and operational feasibility, as empirical fluctuations in bus running times are intrinsically linked to dynamic traffic states, signal control delays, and the presence or absence of dedicated lane infrastructure. Furthermore, accurate assessment of travel time reliability is established in the literature as a primary prerequisite for scheduling and bus priority decision-making, directly reflecting the capacity of the network to support efficient transit operations. To effectively capture these complex, non-linear spatiotemporal dependencies, XGBoost has been extensively employed for the purpose of predicting travel times between bus stations, demonstrating superior accuracy and stability compared to traditional models such as KNN and BP neural networks [25,26].
To assess the deployment of eBRT corridors in the Athens Metropolitan Area (AMA), XGBoost is employed to model and predict travel times and traffic volumes on candidate eBRT corridors. This process involves the following steps:
- Data Collection in corridors and variable selection, which include travel time ratios (actual to free-flow travel times), potential affected population, land-use-related variables (residential areas, commercial areas, road connectivity, leisure areas, green areas, and other land uses), speed limits, the number of road lanes, crime-related indices, various points of interest, bus stops on road axes, and proximity to metro stations.
- Data Preprocessing: Data cleaning and processing to handle missing values, outliers, and feature engineering.
- Model Training: Training of the XGBoost model using the preprocessed data to tune hyperparameters to optimize performance.
- Prediction and Evaluation: Application of the trained model to predict travel time ratios and evaluate the model’s accuracy using relative metrics.
The implementation of XGBoost in this manner allows for effectively analyze the potential impact and efficiency of eBRT corridors, thereby providing valuable insights for decision-makers engaged in the transportation planning process. An example of the gradient boosting process, with 2 XGBoost estimators as decision trees, is shown in Figure 1.
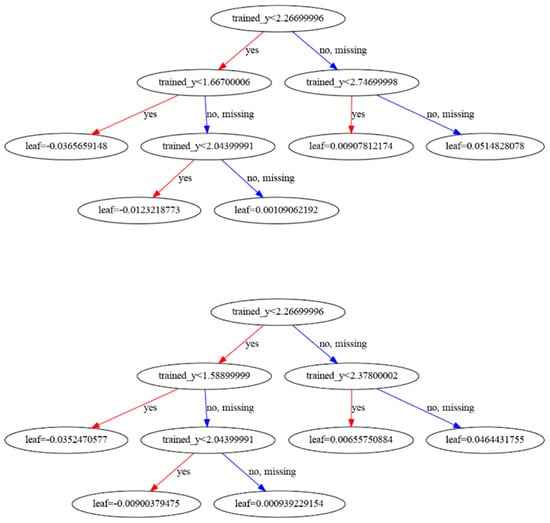
Figure 1.
Example of 2 XGBoost Estimators (Decision Trees).
In order to select features for training the model, Recursive Feature Elimination with Cross-Validation (RFECV) is used [27]. RFECV is an advanced feature selection method that recursively removes the least important features, thereby refining the model iteratively [28]. By integrating this process with cross-validation, RFECV ensures that the selected features generalize effectively to unseen data, thereby enhancing model performance and mitigating overfitting. Consequently, this procedure identified and retained the seven most significant features of the dataset for the final model. This approach not only optimizes the model’s predictive power but also simplifies the model by eliminating redundant features.
Following feature selection, the main hyperparameters of the XGBoost model are tuned by means of a grid search procedure with cross-validation (GridSearchCV). In this procedure, the parameters of the estimator are optimized through an exhaustive search over a predefined parameter grid combined with cross-validated evaluation. After preliminary experiments, the final parameter grid spanned combinations of the number of trees, learning rate, tree depth, child weight, subsampling ratios, column subsampling ratios, and the regularization parameter γ. For our case, the best-performing configuration identified by GridSearchCV was: colsample_bytree = 0.8, gamma = 0.2, learning_rate = 0.01, max_depth = 3, min_child_weight = 1, n_estimators = 200, and subsample = 0.6.
Due to the restricted number of observations, the model is not partitioned into training and testing samples. In lieu of a partitioning of the observations into training and testing sets, the entire set of observations is utilized for training the model. For the purposes of evaluation, the leave-one-out (LOO) technique is also employed [29]. This method entails dividing the dataset into two subsets, with one subset comprising N−1 observations for training and the remaining observation designated for testing. The evaluation metrics for the full dataset are then calculated by averaging the metrics obtained from each of the leave-one-out sets. Finally, an Ordinary Least Squares (OLS) Regression model is trained using the same dataset to further evaluate the efficiency of the XGBoost algorithm. This comparison allows for the assessment of the relative performance and accuracy of the XGBoost algorithm in comparison to a standard regression model.
All feature selection, hyperparameter tuning, and model estimation steps are implemented using the open-source scikit-learn (sklearn) library, which provides standardized and well-documented implementations of RFECV, GridSearchCV, and regression models. The use of this widely adopted framework enhances transparency, allows for straightforward replication of the workflow, and facilitates reuse or extension of the proposed methodology in other contexts. To further clarify the procedure, we have also included an additional flowchart (Figure 2) that summarizes all steps of the proposed framework, from data preparation and feature selection to hyperparameter tuning, model training, and model evaluation.
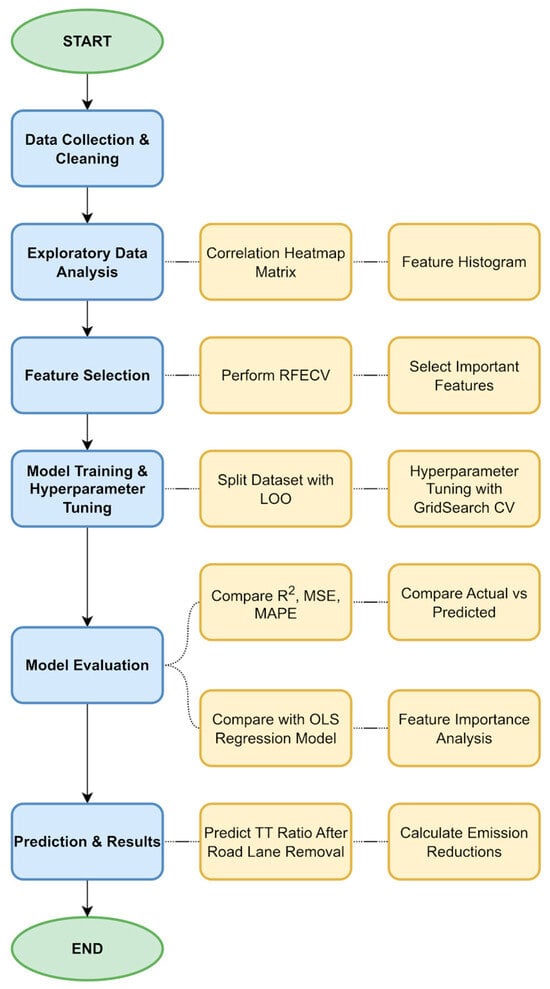
Figure 2.
Workflow of the proposed methodological framework.
Given sample size constraints, a random train/test split would yield a very small test set and unstable estimates. We therefore used leave-one-out cross-validation (LOOCV), training on N − 1 corridors and predicting the held-out corridor in each iteration. To avoid selection-induced bias, all feature selection and hyperparameter tuning were performed within the training data only (nested LOOCV); the held-out corridor was used exclusively for evaluation. Model complexity was constrained a priori (e.g., shallow trees, learning-rate shrinkage, L1/L2 regularization) to reduce overfitting.
2.3. Estimation of Traffic Flow and Environmental Benefits
To estimate traffic flow on selected road segments in the absence of direct vehicle counts, a macroscopic approach based on the fundamental diagram of traffic flow was adopted. This method utilizes observed travel times, free-flow travel times, road geometry, and established relationships between speed, density, and flow [20]. For each segment, the actual average speed (space-mean speed) v was calculated as
where L is the segment length (in km), and is the observed average travel time (in hours) during the period under analysis.
The free-flow speed was similarly derived from the free-flow travel time , as follows:
To approximate traffic density k (vehicles/km per lane), Greenshields’ linear speed–density model was adopted [20,21], given by
where is the jam density, assumed at 150 vehicles/km per lane for the purposes of this study, representing the maximum possible vehicle concentration under congested conditions.
Using the computed density, the flow per lane is calculated as
The total segment flow Q (vehicles/hour) is then calculated by scaling by the number of lanes n:
This method allows for reasonable approximation of traffic volumes based solely on spatiotemporal travel time data, segment geometry, and an assumed jam density. It is particularly suited to applications in which direct measurements (e.g., loop detectors or probe vehicle trajectories) are unavailable but travel time observations are available through GPS-based or map service APIs [30,31].
In addition to mobility and operational benefits, reductions in estimated traffic flow (Q) are also indicative of potential environmental gains. Under the assumption that lower flow values correspond to fewer vehicle-kilometers traveled (VKT) over the segment, a proportional reduction in daily traffic volumes implies a corresponding decrease in tailpipe emissions [32]. Specifically, a decrease in vehicles per hour translates directly into a lower cumulative number of vehicle trips per day, assuming comparable temporal distribution. This relationship enables a simplified estimation of CO2 emission savings, based on average per-vehicle emission rates. For light-duty vehicles, a commonly referenced emission factor is approximately 120–180 g CO2/km, depending on fleet composition and prevailing speeds [32,33,34]. Thus, a daily reduction ΔQ in total vehicle flow across the segment, over a typical operating day duration, may be converted to emission savings as follows:
where is the change in average hourly flow (vehicles/hour), is the segment length (km), is the average CO2 emission factor, equal to 100 g CO2/km/vehicle for the purposes of this study, is the duration of the day with active traffic (hours/day), equal to 8 active traffic hours for the purposes of this study.
This approach, while approximate, provides a planning-level quantification of environmental benefits associated with traffic-reducing measures, such as demand management, improved transit options, or traffic regulation interventions. More refined estimations may incorporate speed-dependent emission models or fleet-specific data if available.
3. Results and Discussion
The model is used for analyzing 28 routes within the Athens Metropolitan Area and includes several variables of interest. As previously stated, these variables include land use, population, distances from public transport lines, points of interest, technical characteristics of the roads, and safety-related indicators. In total, the dataset includes 13 distinct variables. The target variable is the ratio of travel time, defined as the actual travel time divided by the respective time under free-flow. Table 1 shows all variables investigated and the final dataset of selected ones for the XGBoost model, Figure 3 shows the correlation matrix for all variables under study, while Figure 4 shows related histograms for the selected variables.

Table 1.
Collected data and selected variables for the application of XGBoost model.
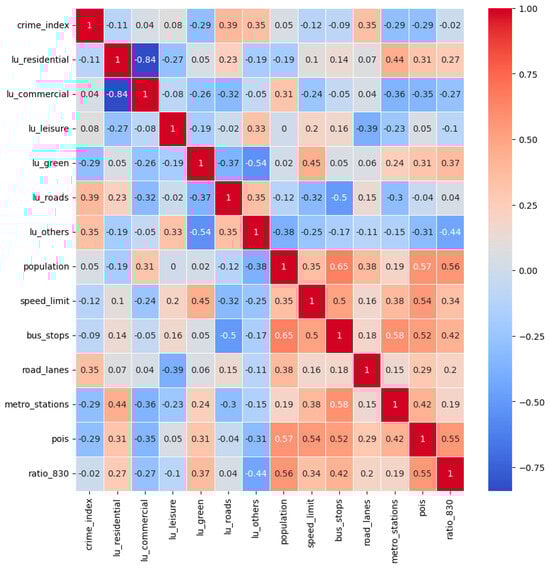
Figure 3.
Correlation matrix for all variables.
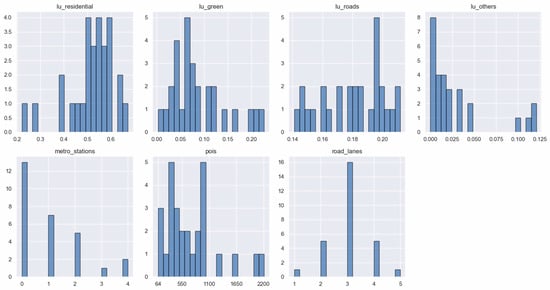
Figure 4.
Histograms for selected variables.
Considering the significance of the various feature variables in the model, the number of points of interest is of particular importance, indicating that it has the highest impact on the model’s predictions. Other salient features include “other” land uses (which likely pertain to land use categories not otherwise specified), green areas (that is, green spaces), and road infrastructures. Based on urban transportation theory, high POI density and diverse land-use mix enhance local accessibility and reduce first-mile barriers, though empirical evidence indicates that the influence of these built environment characteristics varies significantly by transit mode and geographical coverage, with buses often showing weaker associations with land-use mix compared to rail-based modes. Furthermore, unlike traditional planning studies that often assume linear associations, recent research demonstrates that built environment variables exhibit salient threshold effects, where the impact on ridership changes drastically only after specific density or distance values are exceeded [35,36].
Features such as the number of lanes, the number of metro stations, and residential land use also contribute, albeit to a lesser extent. This ranking, illustrated in Figure 5, facilitates an understanding of which variables exert the greatest influence on the model performance and provides guidance for subsequent feature selection or refinement.
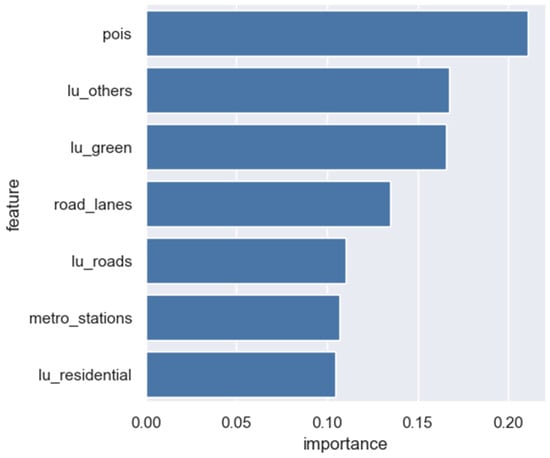
Figure 5.
Feature variables’ importance in developed XGBoost model.
Figure 6 illustrates a comparison between the actual and predicted values generated by the XGBoost model. The points are in close alignment with the red diagonal line, indicating a strong correlation between the actual and predicted values. This alignment suggests that the XGBoost model has performed well in capturing the underlying patterns in the data, resulting in accurate predictions. Furthermore, the R-squared results of the LOO-test and the OLS model were found to be equal to 0.49 and 0.43, respectively, while the XGBoost model R-squared was equal to 0.54. This demonstrates that the model performs significantly better than those utilized for evaluation purposes. The minor deviations from the line represent the model’s prediction errors, which appear to be relatively minor, with a mean absolute percentage error (MAPE) of 26.24%. Overall, the XGBoost model demonstrates good predictive performance, as evidenced by this plot.
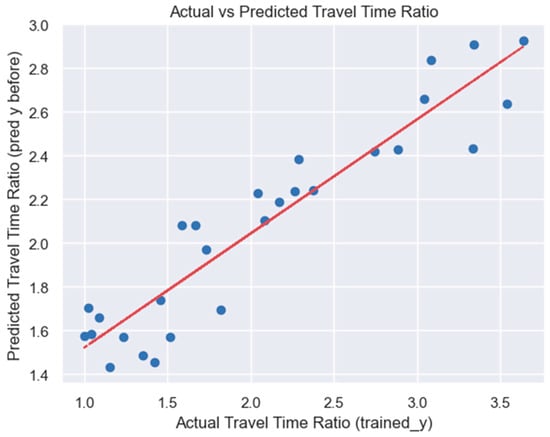
Figure 6.
Actual vs. predicted travel time ratio scatterplot of the XGBoost model.
As the model demonstrates substantial efficacy in generating accurate predictions, the subsequent phase of the study entails further implementation within a realistic context, namely that of an eBRT deployment. Specifically, the model is reapplied to all the corridors, but in this case, a lane is removed from each of them. The objective of this evaluation is to examine, at the corridor level, how the predicted travel time ratio changes when one general-purpose lane is reserved for exclusive eBRT use, in comparison with the baseline configuration without lane reallocation. This scenario analysis provides a preliminary assessment of the potential impacts of lane reallocation on corridor performance within the adopted macroscopic modeling framework, without explicitly representing network-wide traffic dynamics, turning movements, or signal control. Table 2 illustrates the most significant outcomes for specific corridors, considering the actual travel time ratio (trained_y), the predicted travel time ratio in the absence of the removal of a traffic lane (pred_y before), and, finally, the predicted travel time ratio with the removal of a trafficlane for the exclusive use of the eBRT (pred_y after). It is worth noting that, while additional corridors were used for model training and application, Table 2 shows those corridors with a length of more than 1 km, as this is considered the minimum reasonable length for eBRT deployment, for the purposes of the case study in the AMA.
Table 2.
Outputs of the XGBoost model without and with the removal of a road lane for eBRT use.
Across these corridors, the differences between the baseline and lane-reallocation scenarios in predicted travel time ratios remain limited within the modeling framework used, indicating that reserving one lane for eBRT could be feasible at the corridor level. Nevertheless, the interpretation of these findings should consider that the analysis does not explicitly represent broader network interactions or intersection-level effects. After evaluating the traffic flow reductions and the corresponding environmental benefits of implementing an eBRT system, it has been determined that Syggrou Avenue is the optimal corridor for deployment when considering environmental impact per unit length, as shown in Table 3.
Table 3.
Traffic Flow and Environmental Gains after the eBRT deployment.
While Syggrou Avenue does not demonstrate the highest total reduction in CO2 emissions, with a recorded reduction of 11.44 tonnes, it achieves the most substantial emission savings per kilometer of roadway, with 2.5536 tonnes CO2/km. This metric is particularly relevant for assessing the effectiveness of corridor-level interventions in urban settings, where spatial efficiency and targeted environmental performance are critical. In comparison, other high-performing candidates such as Kifisos Avenue and Kifisias Avenue (Marousi–Katechaki) report largest absolute CO2 reductions (13.19 and 14.75 tonnes, respectively), but their corresponding emission reductions per kilometer (2.376 and 2.2832 tonnes/km) remain slightly lower than that of Syggrou Avenue.
It is worth mentioning, at this point, that the environmental impact estimation in this study is based on planning-level assumptions that link changes in macroscopic traffic flow to corresponding variations in CO2 emissions. This approach uses an average emission factor and an 8-h representative traffic window, which are suitable for providing a consistent and comparable basis for corridor-level assessment. However, certain real-world factors, such as speed-dependent emission behavior, detailed fleet composition, potential traffic redistribution across adjacent corridors, and the operational characteristics of a deployed eBRT service (e.g., acceleration profiles, and modal shifts), are not explicitly modeled. Incorporating these elements could further enhance the precision of the environmental estimates and offer a more granular understanding of corridor-level impacts. Future research may benefit from integrating dynamic emission models, high-resolution fleet data, and microsimulation tools to complement the planning-level framework presented here. In addition to the environmental modeling assumptions, the analysis of lane reallocation is also conducted at a corridor level and does not include a full network simulation.
Nevertheless, from a policy and implementation perspective, prioritizing corridors with the highest per-kilometer environmental gains aligns with urban sustainability goals, particularly when considering constrained funding, space, or implementation timeframes. In this regard, L. Syggrou offers a strategic opportunity to maximize the environmental return on investment and exemplify the effectiveness of electrified mass transit infrastructure within the city’s broader sustainable mobility framework.
4. Conclusions
This study introduced a machine learning-based decision support framework to evaluate the potential deployment of electric Bus Rapid Transit (eBRT) systems in urban environments. The framework was applied to 28 key corridors within the Athens Metropolitan Area. The analysis incorporated a diverse set of variables, including land use, population density, road infrastructure, accessibility to public transportation, and points of interest. The XGBoost algorithm demonstrated strong predictive accuracy, outperforming conventional regression models and identifying the most influential features in explaining variations in travel time ratios across candidate corridors. The findings underscore the importance of spatial and functional characteristics, particularly the density of points of interest, green spaces, mixed land uses, and road geometry, in determining the suitability of corridors for eBRT implementation. These insights provide a solid foundation of evidence to inform corridor prioritization and investment planning. This allows stakeholders to focus on areas with the greatest potential for improving mobility and providing environmental benefits. The study also indicates that, under the modeling assumptions adopted, reallocating road space for eBRT lanes does not lead to substantial increases in predicted corridor-level travel time ratios, while it can reduce traffic volumes and associated CO2 emissions. A more detailed assessment of operational impacts would, however, require network-level simulation that explicitly captures turning movements, signal control and priority strategies, and potential traffic diversion. In addition, future research should explore how the model generalizes across different urban contexts. These results highlight the practical and scalable role of eBRT as a solution for sustainable urban transportation, especially in settings where infrastructure expansion is limited. Future research should explore how the model generalizes across different urban contexts and incorporate additional variables, such as temporal demand patterns, transit ridership forecasts, and network-level interactions. Furthermore, dynamic monitoring during implementation can improve model calibration and support adaptive planning processes. In conclusion, the proposed framework is a flexible, data-driven tool that supports urban mobility planning and eBRT deployment. It aligns with the broader goals of accessibility, environmental sustainability, and transport system resilience.
Author Contributions
Conceptualization, O.K., K.K. (Konstantia Kontodimou) and K.K. (Konstantinos Kepaptsoglou); methodology, P.D., C.I. and K.K. (Konstantinos Kepaptsoglou); software, P.D. and O.K.; validation, C.I. and K.K. (Konstantinos Kepaptsoglou); formal analysis, P.D., O.K. and K.K. (Konstantia Kontodimou); data curation, P.D. and O.K.; writing – original draft, O.K., K.K. (Konstantia Kontodimou) and K.K. (Konstantinos Kepaptsoglou); supervision, C.I. and K.K. (Konstantinos Kepaptsoglou). All authors reviewed the results and approved the final version of the manuscript.
Funding
This research was funded by the EU Horizon Europe Research and Innovation Programme, Grant Agreement No. 101095882 Electric Bus Rapid Transit for 2030 (eBRT2030).
Data Availability Statement
The original contributions presented in this study are included in the article. Further inquiries can be directed to the corresponding author.
Conflicts of Interest
The authors declare no conflicts of interest.
References
- Nadeem, M.; Azam, M.; Asim, M.; Al-Rashid, M.A.; Puan, O.C.; Campisi, T. Does Bus Rapid Transit System (BRTS) Meet the Citizens’ Mobility Needs? Evaluating Performance for the Case of Multan, Pakistan. Sustainability 2021, 13, 7314. [Google Scholar] [CrossRef]
- Currie, G.; Delbosc, A. Assessing Bus Rapid Transit system performance in Australasia. Res. Transp. Econ. 2014, 48, 142–151. [Google Scholar] [CrossRef]
- Shah, S.A.R.; Shahzad, M.; Ahmad, N.; Zamad, A.; Hussan, S.; Aslam, M.A.; Khan, A.R.; Asif, M.A.; Shahzadi, G.; Waseem, M. Performance Evaluation of Bus Rapid Transit System: A Comparative Analysis of Alternative Approaches for Energy Efficient Eco-Friendly Public Transport System. Energies 2020, 13, 1377. [Google Scholar] [CrossRef]
- Racehorse, V.J.; Zhang, G.; Sussman, A.; Jian, A.; Parker, T. Bus rapid transit system deployment for high quality and cost-effective transit service: A comprehensive review and comparative analysis. IET Intell. Transp. Syst. 2015, 9, 175–183. [Google Scholar] [CrossRef]
- Hoogervorst, R.; van der Hurk, E.; Schiewe, P.; Schöbel, A.; Urban, R. The Bus Rapid Transit investment problem. Comput. Oper. Res. 2024, 167, 106640. [Google Scholar] [CrossRef]
- Kim, J.; Ewing, R. Impact of “light” bus rapid transit (BRT-light) on traffic and emissions in a travel corridor. Transp. Policy 2023, 146, 215–226. [Google Scholar] [CrossRef]
- Mavi, R.K.; Zarbakhshnia, N.; Khazraei, A. Bus rapid transit (BRT): A simulation and multi criteria decision making (MCDM) approach. Transp. Policy 2018, 72, 187–197. [Google Scholar] [CrossRef]
- Rodrigues, G.S.; dos Reis, J.G.M.; Orynycz, O.; Tucki, K.; Machado, S.T.; Raymundo, H. A Study on the Viability of Adopting Battery Electric Vehicles in Bus Rapid Transit in Brazil Using the AHP Method. Energies 2023, 16, 4858. [Google Scholar] [CrossRef]
- Pérez, J.J.; Correa, L.H.; Østergaard, P.A.; Cabrera, P. Assessment of energy consumption, environmental effects and fuel costs of the bus rapid transit system in Bogotá (Colombia). Clean Energy 2024, 8, 34–47. [Google Scholar] [CrossRef]
- Kang, G.; Choi, M.; Jo, J.; Kwak, J.; Jang, Y.; Lee, S. Environmental benefit comparison between super bus rapid transit and tram systems. Clean. Eng. Technol. 2023, 15, 100655. [Google Scholar] [CrossRef]
- Iliopoulou, C.; Tassopoulos, I.X.; Kepaptsoglou, K. Multi-objective planning of electric bus systems in cities with trolleybus infrastructure networks. Sustain. Cities Soc. 2024, 103, 105227. [Google Scholar] [CrossRef]
- Mpousdra, A.; Iliopoulou, C.; Kepaptsoglou, K.; Vlahogianni, E.; Tyrinopoulos, Y. Rapid transit network design for on-line electric vehicles. Adv. Transp. Stud. 2018, 46, 19–30. [Google Scholar]
- Stavropoulou, E.; Iliopoulou, C.; Kepaptsoglou, K. Battery-Assisted Trolleybus Network Design: Model and Application. J. Transp. Eng. Part A Syst. 2022, 148, 04022063. [Google Scholar] [CrossRef]
- Triatmojo, A.; Posada, F.; Jin, L.; Bueno, C.; Safrudin, A. Planning the Adoption of Battery Electric Buses in Transjakarta: Route-Level Energy Consumption, Driving Range, and Total Cost of Ownership. 2024. Available online: https://theicct.org/publication/analysis-of-zero-emission-bus-in-transjakarta-fleet-feb24/ (accessed on 20 September 2025).
- Dantas, R.; Dantas, J.; Melo, C.; Maciel, P. Performance evaluation in BRT systems: An analysis to predict the BRT systems planning. Case Stud. Transp. Policy 2021, 9, 1141–1150. [Google Scholar] [CrossRef]
- Schlickmann, M.P.; Martínez, L.M.; de Sousa, J.P. A tool for supporting the design of BRT and LRT services. Transp. Res. Procedia 2017, 27, 1171–1178. [Google Scholar] [CrossRef]
- Sarkar, D.; Sheth, A.; Ranganath, N. Social Benefit-Cost Analysis for Electric BRTS in Ahmedabad. Int. J. Technol. 2023, 14, 54–64. [Google Scholar] [CrossRef]
- Manzolli, J.A.; Trovão, J.P.; Antunes, C.H. Scenario-Based Multi-criteria decision analysis for rapid transit systems implementation in an urban context. eTransportation 2021, 7. [Google Scholar] [CrossRef]
- Li, Z.; Tian, Y.; Sun, J.; Lu, X.; Kan, Y. Simulation-based optimization of large-scale dedicated bus lanes allocation: Using efficient machine learning models as surrogates. Transp. Res. Part C Emerg. Technol. 2022, 143, 103827. [Google Scholar] [CrossRef]
- Yu, C.; Zhang, J.; Yao, D.; Zhang, R.; Jin, H. Speed-Density Model of Interrupted Traffic Flow Based on Coil Data. Mob. Inf. Syst. 2016, 2016, 1–12. [Google Scholar] [CrossRef]
- Traffic Stream Models. Available online: https://www.civil.iitb.ac.in/tvm/nptel/513_TrStream/web/web.html (accessed on 21 July 2025).
- Chen, T.; Guestrin, C. XGBoost: A Scalable Tree Boosting System. In Proceedings of the 22nd ACM SIGKDD International Conference on Knowledge Discovery and Data Mining, San Francisco, CA, USA, 13–17 August 2016; pp. 785–794. [Google Scholar] [CrossRef]
- Lartey, B.; Homaifar, A.; Girma, A.; Karimoddini, A.; Opoku, D. XGBoost: A tree-based approach for traffic volume prediction. In Proceedings of the 2021 IEEE International Conference on Systems, Man, and Cybernetics (SMC), Melbourne, Australia, 17–20 October 2021; pp. 1280–1286. [Google Scholar] [CrossRef]
- Chen, Z.; Fan, W. A Freeway Travel Time Prediction Method Based on an XGBoost Model. Sustainability 2021, 13, 8577. [Google Scholar] [CrossRef]
- Zhu, L.; Shu, S.; Zou, L. XGBoost-Based Travel Time Prediction between Bus Stations and Analysis of Influencing Factors. Wirel. Commun. Mob. Comput. 2022, 2022, 3504704. [Google Scholar] [CrossRef]
- Huang, H.; Huang, L.; Song, R.; Jiao, F.; Ai, T. Bus Single-Trip Time Prediction Based on Ensemble Learning. Comput. Intell. Neurosci. 2022, 2022, 1–24. [Google Scholar] [CrossRef] [PubMed]
- Pedregosa, F.; Varoquaux, G.; Gramfort, A.; Michel, V.; Thirion, B.; Grisel, O.; Blondel, M.; Prettenhofer, P.; Weiss, R.; Dubourg, V.; et al. Scikit-learn: Machine Learning in Python. 2011. Available online: http://scikit-learn.sourceforge.net (accessed on 20 September 2025).
- Guyon, I.; Weston, J.; Barnhill, S.; Vapnik, V. Gene Selection for Cancer Classification using Support Vector Machines. Mach. Learn. 2002, 46, 389–422. [Google Scholar] [CrossRef]
- James, G.; Witten, D.; Hastie, T.; Tibshirani, R.; Taylor, J. Springer Texts in Statistics An Introduction to Statistical Learning with Applications in Python; Springer: Cham, Switzerland, 2013. [Google Scholar]
- van Erp, P.B.; Knoop, V.L.; Hoogendoorn, S.P. Macroscopic traffic state estimation using relative flows from stationary and moving observers. Transp. Res. Part B Methodol. 2018, 114, 281–299. [Google Scholar] [CrossRef]
- Wang, Y.; Yu, X.; Guo, J.; Papamichail, I.; Papageorgiou, M.; Zhang, L.; Hu, S.; Li, Y.; Sun, J. Macroscopic traffic flow modelling of large-scale freeway networks with field data verification: State-of-the-art review, benchmarking framework, and case studies using METANET. Transp. Res. Part C Emerg. Technol. 2022, 145. [Google Scholar] [CrossRef]
- Yu, C.; Yang, X.; Mu, J.; Liu, S. A systematic review of urban road traffic CO2 emission models. Carbon Footprints 2025, 4, 17. [Google Scholar] [CrossRef]
- Wang, J.; Dai, H.; Feng, H.; Guo, M.; Zylianov, V.; Feng, Z.; Cui, J. Carbon emission of urban vehicles based on carbon emission factor correlation analysis. Sci. Rep. 2025, 15, 2037. [Google Scholar] [CrossRef]
- Chen, J.; Yu, H.; Xu, H.; Lv, Q.; Zhu, Z.; Chen, H.; Zhao, F.; Yu, W. Investigation on Traffic Carbon Emission Factor Based on Sensitivity and Uncertainty Analysis. Energies 2024, 17, 1774. [Google Scholar] [CrossRef]
- Wang, J.; Cao, X.; Liu, K.; Wang, D. Exploring the nonlinear effects of built environment characteristics on customized bus service. Transp. Res. Part D Transp. Environ. 2022, 114. [Google Scholar] [CrossRef]
- De Gruyter, C.; Saghapour, T.; Ma, L.; Dodson, J. How does the built environment affect transit use by train, tram and bus? J. Transp. Land Use 2020, 13, 625–650. [Google Scholar] [CrossRef]
Disclaimer/Publisher’s Note: The statements, opinions and data contained in all publications are solely those of the individual author(s) and contributor(s) and not of MDPI and/or the editor(s). MDPI and/or the editor(s) disclaim responsibility for any injury to people or property resulting from any ideas, methods, instructions or products referred to in the content. |
© 2025 by the authors. Published by MDPI on behalf of the World Electric Vehicle Association. Licensee MDPI, Basel, Switzerland. This article is an open access article distributed under the terms and conditions of the Creative Commons Attribution (CC BY) license.