Abstract
The accurate prediction of remaining useful life (RUL) is crucial in order to reasonably and efficiently utilize lithium-ion batteries (LiBs). In this paper, a construction method of periodic time series is applied to the degradation data of LiBs to address the issues of insufficient training data and smooth degradation in the RUL interval prediction method based on trend filtering segmentation and fuzzy information granulation. The construction method for periodic time series is used to form a new dataset from the original data, based on which the fusion model, by combining the variational mode decomposition (VMD) and gated recurrent unit (GRU), is used as the RUL interval prediction model of LiBs. Moreover, the effectiveness and advantage of the RUL interval prediction method proposed in this paper was verified and analyzed by utilizing the CALCE battery dataset and NCA battery dataset.
1. Introduction
In recent years, LiBs have dominated the relatively short-term energy storage market by virtue of their important characteristics such as high energy density, long service life, and continuous cost reduction [1,2]. However, LiBs degrade over the course of their use as the number of cycles increases [3,4]. When the degradation of LiBs reaches a certain level (failure threshold), the capacity and power will decrease rapidly if they continue to be used, which may cause more damage and even dangerous situations such as explosions [5,6,7,8]. The evaluation of RUL is regarded as a key indicator for measuring the operational effectiveness of LiBs. It is important to construct a good battery capacity degradation prediction model for the early warning of battery failures, the prevention of dangerous accidents, and reductions in economic losses. In general, when the maximum discharge capacity of an LiB falls to 70% or 80% of its rated capacity, the battery is considered to reach the capacity failure threshold and is no longer suitable for charge/discharge operation and needs to be replaced or discarded [9]. Generally, according to the definition of RUL, predicting the RUL of LiBs is actually predicting the number of charge/discharge cycles that can be performed between the current state and the failure threshold.
RUL prediction methods for LiBs are based on two main categories: model-based methods and data-driven methods [10]. Model-based methods aim to develop a mathematical model to describe the degradation trajectory of the battery dynamics, which simulates the degradation process of LiBs by the means of physical, electrochemical, or equivalent circuit models. Differently from model-based methods, data-driven methods use historical monitoring data to directly predict battery degradation trends [11], such as Gaussian process regression [12,13] and relevance vector machines [14,15]. Meanwhile, many deep learning methods, including long short-term memory [16,17], recurrent neural networks [18,19], convolutional neural networks [20,21,22], and attention mechanisms [23,24,25] are also beginning to make an impact in the field. The superiority of data-driven methods is in direct prediction tasks using historical monitoring data. However, there is the limitation that battery capacity is difficult to measure directly in practice. As a result, an indirect prediction method was created, which extracts an indicator that can reflect the health status of LiBs from degradation process, i.e., a health indicator (HI). In addition, although data-driven methods are currently the most popular and widely used methods, they ignore the inherent physical characteristics [26] of LiBs, which can affect prediction accuracy and lack interpretability. To address this issues, Ma et al. incorporated domain knowledge into deep learning to improve RUL prediction accuracy [27], while Sandrucci et al. integrated experimental design and chemometric data analysis to help capacity prediction for lithium metal batteries [28]. More generally, physics-informed machine learning has been widely used for the health management of LiBs and has become an effective method for predicting battery degradation [29,30,31].
Currently, the focus of most researchers has been on improving single-value RUL prediction accuracy for LiBs. However, relying only on a single value for prediction has significant limitations when the degradation of LiBs is irreversible. In addition, the degradation of LiBs involves very complex physicochemical processes, and it is difficult to accurately control the change process through a numerical prediction model, and the prediction model may also be affected by external environmental factors during the operation. In practice, the working environment of LiBs is not consistent. A good RUL prediction model can not only take into account the working state of LiBs in different operating environments but also accurately describe the degradation trend. RUL interval prediction meets the requirements in this regard. Thus, there is a need for a data processing method that can construct time series intervals with upper and lower limits.
However, for the health state management of LiBs, relatively few studies have been conducted on interval prediction. Pan et al. achieved the interval prediction of the health state of LiBs by constructing a nonlinear regression model by combining fuzzy information granularity and a support vector machine [32]. In order to mitigate the effect of capacity rebound on battery RUL prediction during the degradation of LiBs, Pang et al. introduced linguistic descriptions based on the prediction model in [33]. By predicting the capacity rebound points individually and superimposing their results with the original prediction data, more accurate predictions were achieved and these predictions were presented in the form of intervals. Unlike the above works, which all use fixed-scale segmentation, a strategy for predicting RUL intervals of LiBs using fuzzy information granulation combined with trend-filtered segmentation was proposed in [34]. But when confronted with a small amount of battery degradation data or a smoother degradation curve, the model may have poor prediction results due to insufficient training data. Moreover, since fuzzy information granularity inherently simplifies the complexity of the data, it makes the battery degradation data, which is originally a small amount of data and changes gently, become even more abbreviated after processing, further affecting the prediction accuracy.
On the other hand, the degradation data of LiBs is essentially a time series. The prediction accuracy for a time series can be improved via two ways: one is to improve the prediction model, and the other is to make effective use of the time series. As we all know, periodicity is an important characteristic of time series, and the reasonable use of periodicity can effectively improve prediction accuracy. Based on this, the prediction of periodic time series has been studied widely. For example, Wang et al. proposed a network-based periodic energy consumption prediction method and applied it to a refrigeration system [35]. To address this issue, a method to construct non-periodic time series into periodic time series was proposed and used to predict the SOH of LiBs in our previous work [36]. In this paper, the time series construction method is applied to generate long periodic time series data and form a dataset to address the problems of insufficient training data and smooth degradation in RUL prediction based on fuzzy information granulation. The experiments, based on the CALCE battery dataset and NCA battery dataset, show the effectiveness and advantage of the proposed prediction method. The main contributions of this paper are as follows: (1) A periodic time series dataset is generated by using the construction method of periodic time series. (2) An RUL interval prediction method, by combining periodic time series and trend filtering segmentation-based fuzzy information granulation, is proposed. (3) The proposed RUL interval prediction method is verified and analyzed based on two public battery datasets. It is worth noting that this paper is dedicated to obtaining better accuracy in predicting the RUL of LiBs by combining fuzzy information granulation and the construction method of periodic time series, which are both from our previous work [34,36]. In short, we expect to obtain better prediction performance through a reasonable combination of simple or existing methods, rather than obtaining this by directly improving the predictive model itself. This paper provides a valuable new idea for the works [32,37,38,39] that use the fuzzy information granulation in the field of the health management of LiBs to improve prediction accuracy via the same way or a similar way to that used in this paper.
The rest of this paper is organized as follows. The used battery dataset, periodic time series construction method, fuzzy information granulation, and evaluation indicators are introduce briefly in Section 2. In Section 3, the proposed RUL interval prediction method for LiBs is described in detail. In Section 4, we report how the experiments based on the CALCE battery dataset and NCA battery dataset were performed and analyzed. Finally, we conclude this paper in Section 5.
2. Preliminaries
In this section, the main battery datasets used in this paper, i.e., the CALCE battery dataset and NCA battery dataset, and the core techniques used in the proposed prediction method including the periodic time series construction method and fuzzy information granulation, as well as the used error evaluation indicators, will be described.
2.1. Dataset
2.1.1. CALCE Battery Dataset
In this paper, four batteries from the CALCE battery dataset are selected, i.e., batteries CS2_35, CS2_36, CS2_37, and CS2_38. The charging and discharging of the four batteries were carried out under the same conditions. The variation in battery current and voltage with time during a charge/discharge cycle is shown in Figure 1, from which the batteries went through three main stages during the charging and discharging cycles.
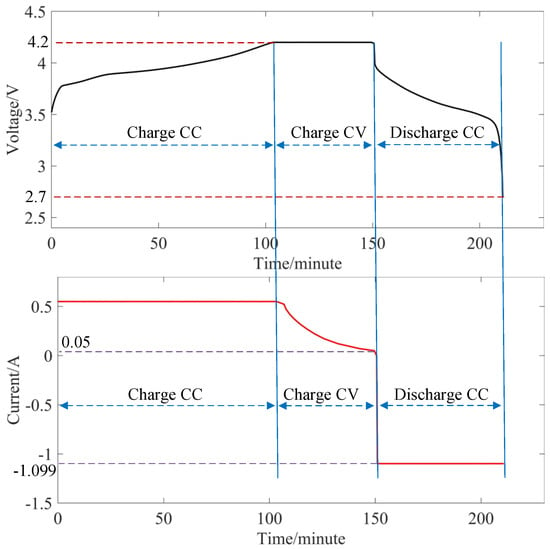
Figure 1.
Schematic diagram of the CALCE dataset charge/discharge test scheme.
Generally, the CC discharge capacity is regarded as the remaining capacity of the battery during cycling. In this paper, we extracted the CC discharge capacity during the charge/discharge cycle of the batteries in CALCE battery dataset and obtained the capacity degradation curves of the four batteries, as shown in Figure 2a, in which there are many abnormal value points with sudden capacity degradation. In the actual processing, the operation process of data cleaning is often required. In this paper, the 2 principle is used in the preliminary elimination of outliers: based on the length of the data used in this paper, the capacity degradation data of each battery are divided into one group for every 40 values, and the mean value and standard deviation of each group of data are calculated, and then it is judged whether all the data are located in the intervals of the corresponding data groups. If the data are not in the intervals, they are regarded as the outliers and are discarded directly, so as to obtain the capacity degradation curve with the preliminary elimination of the abnormal values, as shown in Figure 2b. On this basis, the two-end average method is adopted to remove the remaining outliers, i.e., the average of the left and right ends of the outliers is taken to replace the outliers. The capacity degradation trend of the four batteries is basically the same, and the whole degradation roughly shows the basic trend of being relatively fast in the early stage and gentle in the middle stage, with accelerated degradation in the late stage after passing the failure threshold point. The capacity degradation curve after removing the remaining outliers is shown in Figure 2c. From Figure 2c, it is seen the capacity of the four batteries gradually decreases with time, and the decay intensifies near the capacity 0.77 Ah (a 30% decrease in the standard capacity of the battery), which is called the failure threshold. It can also be observed from Figure 2c that the capacity degradation trends of the four batteries are basically the same, and the whole degradation roughly shows the basic trend of being relatively fast in the early stage and gentle in the middle stage, with accelerated degradation in the late stage after passing the failure threshold point. It is important to note that data quality is critical to prediction results. The potential impact of data quality on prediction accuracy lies in the fact that the presence of too many outliers in a set of data can lead to prediction model training bias, which ultimately affects the data prediction results, and therefore the data preprocessing process is presented in detail in this subsection.

Figure 2.
Capacity degradation curves of four CALCE batteries.
2.1.2. NCA Battery Dataset
In order to verify the generalization ability of the proposed method, five batteries in the NCA battery dataset [40] were selected for this study, i.e., batteries CY45_0.5/1#2, CY45_0.5/1#11, CY45_0.5/1#12, CY45_0.5/1#13, and CY45_0.5/1#14. The variation in battery current and voltage with time in a charge/discharge cycle is shown in Figure 3, in which the whole process goes through five steps.
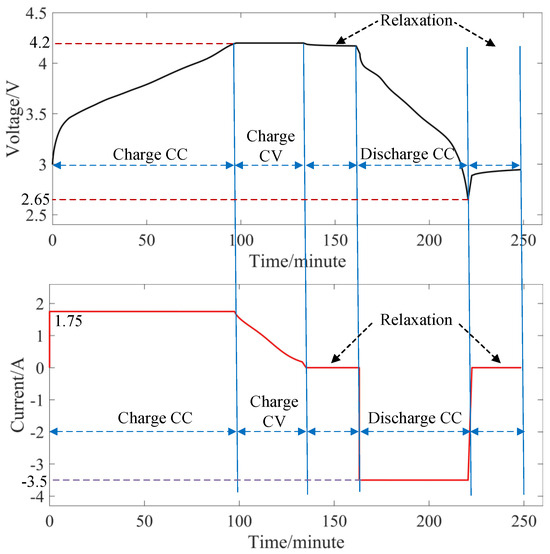
Figure 3.
Schematic diagram of the NCA dataset charge/discharge test scheme.
Based on the capacity degradation data of the NCA batteries, the same method as that used for cleaning the CALCE battery anomaly data was adopted to reject the anomaly data of NCA battery degradation. The capacity degradation curve of the NCA batteries after data cleaning is shown in Figure 4. Although the nominal capacity of the NCA batteries is 3.5 Ah, it is only a little more than 3.34 in the actual measurement, so in the subsequent experiments of this paper, a rated capacity of the NCA batteries of 3.35 Ah was consistently used.
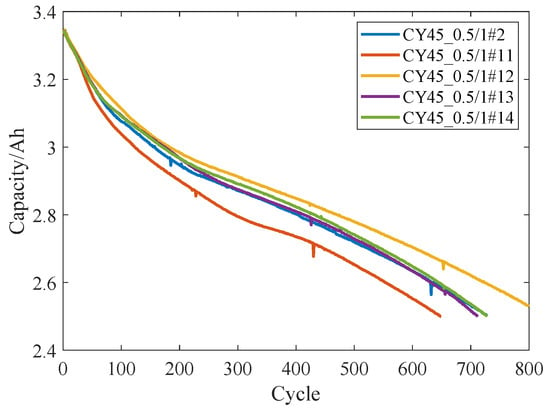
Figure 4.
Capacity degradation curve of NCA battery.
In Figure 4, the capacity degradation of the NCA batteries and that of the CALCE batteries are very different from each other. The capacity degradation of the NCA batteries mainly has two trends, which are the relatively fast degradation speed in the early stage and the relatively gentle degradation trend in the middle and late stages. More obviously, the capacity degradation curve of NCA batteries is very smooth, and there is basically no phenomenon of capacity recovery. Nonetheless, the capacity degradation of different LiBs still has a large gap.
2.2. Construction Method of Periodic Time Series
In our previous work [36], a method to construct non-periodic time series into periodic time series was proposed, whose main idea is shown in Figure 5. The aim of the method is to give periodic qualities to time series that otherwise lack periodicity through rational design and combination, thus potentially enhancing their predictability and controllability. In Figure 5, there are four non-periodic time series, namely, time series 1, 2, 3, and 4, which are all degenerate. The long-term time series can be constructed by directly connecting their starting and ending points, and the constructed time series has obvious periodicity. Despite the simplicity of the construction method, there are two issues to focus on in the application: the selection of original time series and sorting of the selected original time series.
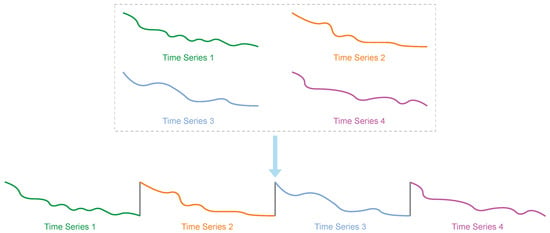
Figure 5.
Schematic diagram of constructing periodic time series.
For the issue of selecting the original time series, based on determining the number of original time series to be selected, a natural way of thinking is the stochastic selection method. Another method of selecting the original time series is based on correlation. Similarly, for the sorting issue, there are two ways to perform this. For a selected number of original time series, one method of ordering is to randomize them and connect the tail of one time series directly to the head of the next time series. Another method of sorting the selected corresponding number of original time series is to sort them according to the correlation with the time series to be studied. Through different combinations of these selection methods and sorting methods, four strategies for constructing periodic time series can be formed: Strategy I, correlation selection + correlation sorting, Strategy II, correlation selection + stochastic sorting, Strategy III, stochastic selection + correlation sorting, and Strategy IV, stochastic selection + stochastic sorting, where ‘+’ represents combination. See [36] for the technical details.
2.3. Fuzzy Information Granulation
Information granulation is used to divide a complete object into different components, i.e., information granules. Under the effect of information granulation, time series data are redistributed and combined into some information particles containing rich information, so it successfully transforms numerical forecasting into granular prediction. This paper uses a fuzzy set-based model to represent information granulation. Fuzzy information granulation consists of two main steps: the division of the time series window and the granulation of the time window data. In the windowing process of fuzzy information granulation, fixed-width segmentation is unable to distinguish various trends within time series data. To solve this problem, the trend filtering segmentation method for time series with multiple trend segments was proposed in [34]. This method is able to dynamically adjust the size of the analysis time window according to the degradation rates of different parts of time series. Specifically, in trend segments with faster rates of data degradation or change, the method uses a smaller time window for segmentation in order to more accurately capture this rapidly changing information. Conversely, in stages where the data is degrading or changing more slowly, a larger time window is used to better summarize the overall trend for that target segment. This division ensures that rapid changes in the data are recognized while also clearly distinguishing the relatively smooth stages of change in the data.
After selecting and finding out the reasonable length of the time window, it is necessary to carry out fuzzy information granulation on the original sequence data of each window to generate the corresponding fuzzy information granules. The information granulation rules are mainly controlled by the affiliation function, and different affiliation functions represent different granulation rules. In this paper, fuzzy information granulation is mainly targeted to deal with the time series data, so that it becomes a subsequence with upper and lower boundaries, that is, to provide a predictable interval; the triangular and trapezoidal affiliation functions meet this condition, while the triangular affiliation function requires fewer parameters, so this paper adopts the triangular affiliation function to granulate the processing of the data of each time window.
2.4. Evaluation Indicators
2.4.1. Common Error Evaluation Indicators
Three common error evaluation indicators, including the root mean square error (RMSE), mean absolute error (MAE), and mean absolute percentage error (MAPE), are used to evaluate the prediction accuracy in this paper, i.e., to evaluate the accuracy of the upper and lower limits of the prediction intervals, which are defined as follows:
where y denotes the true value and denotes the predicted value. For the all indicators, the closer the value is to 0, the higher the prediction accuracy is.
2.4.2. Interval Prediction Error Evaluation Indicators
Error evaluation indicators for numerical prediction do not evaluate interval prediction errors well, so a special class of evaluation indicators needs to be introduced to evaluate the interval prediction results. The width between the upper and lower limits of the fuzzy granular prediction is recorded using V and Q is used to denote the coverage of the prediction interval over the true value. For the ith time window , assuming that the raw data is , where l is the window length, then and are
where ; and are the upper and lower bounds of the interval, respectively. From (2), the smaller V is, the closer the upper and lower limits of the prediction interval are to the true value. The larger Q is, the more real data the prediction interval covers, and the higher the prediction accuracy is. However, it does not occur in this ideal way in the actual experimental process; thus the indicator P, which can balance the interval width V and coverage Q, is necessary and defined as [41]
where n is the predicted number of fuzzy granulated particles in a given time window. From (3), when is larger and is smaller, the corresponding P will be larger, indicating that the prediction accuracy is higher. In this paper, and are the average values of and , describing the interval prediction accuracy of time series.
3. RUL Interval Prediction Method of LiBs
Based on the two public battery datasets and the periodic time series construction method as well as fuzzy information granulation shown in Section 2, an RUL interval prediction method for LiBs will be proposed and described in this section.
The proposed RUL interval prediction method for LiBs, which consists of five steps, is presented in Figure 6. Let be the extracted HI degradation time series of LiBs and be the time window. The details of the proposed method of RUL interval prediction for LiBs are as follows.
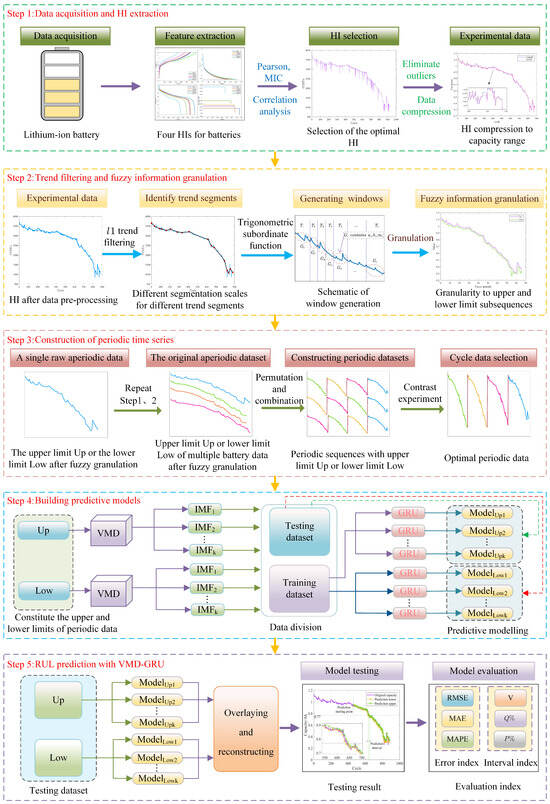
Figure 6.
Schematic diagram of RUL interval prediction method based on periodic time series.
Step 1: Data acquisition and HI extraction. HIs with high correlation with the capacity, which are found by using the Pearson coefficient and MIC, are selected to characterize capacity, and outliers in the HI degradation data are removed.
Step 2: Trend filtering and fuzzy information granulation. Trend filtering is an effective method used to analyze potential linear trends in time series. The original time series are filtered and analyzed using trend filtering [42] to determine the points where the trend changes. Different time window lengths are matched for different ranges of trend segments by the trial-and-error method. Building upon this, fuzzy information granulation is utilized on the time series. After the time series X is divided into , the time window data are transformed into fuzzy particles using fuzzy information granulation. The data in the time window are constructed into a fuzzy granule, , under the triangular affiliation function. The fuzzy granule contains three parts of information, , , and , which are arranged in order to form the time subsequences , , and , which are the lower limit Low, upper limit Up, and median m, respectively.
Step 3: Construction of periodic time series. After completing the trend-filtering segmentation of an HI of LiBs, the HI becomes two subsequences with upper and lower limits. Repeatedly executing Step 1 and Step 2, the upper subsequence Up of the HI of LiBs can be obtained, forming a non-periodic dataset. On this basis, these non-periodic data are converted into a dataset with periodic characteristics by different permutation strategies, and the best periodic time series are determined based on the experimental results as the basic data for subsequent experiments.
Step 4: Building prediction model. The fuzzy granulated Low and Up are used to train the VMD-GRU prediction model. The granulated sequences of Low and Up are first given to VMD to decompose into individual modal components. Then, each component is divided into a training set and test set. Finally, the training set is fed into a GRU to train the prediction model and find the best model. Particularly, in the data division stage, the training set not only contains the original training data of the predicted batteries but also combines other battery degradation data that constitute the periodic time series.
Step 5: RUL prediction with VMD-GRU. The test data of each modal component are provided to the trained VMD-GRU prediction model, and the prediction data of each modal component of the Up and Low are reconstructed to achieve RUL interval prediction for LiBs.
It should be noted that, for the convenience of comparative analysis, the same VMD-GRU prediction model as in [34] is adopted in Step 4 of Figure 6. VMD is an adaptive, fully non-recursive method for modal variational and signal processing. Compared with the classical empirical mode decomposition (EMD), VMD can effectively reduce modal aliasing by presetting the number of modes and bandwidth constraints and can extract all modal components simultaneously, which makes its computational efficiency high, but the number of modes K needs to be preset. Nevertheless, considering the modal aliasing suppression and parallel decomposition ability, VMD is chosen over EMD in this paper. On the other hand, the GRU merges the input gate and forget gate of long short-term memory into a single update gate, which can solve the problems such as the inability of long-term memory and gradient in backpropagation in recurrent neural networks, and its training speed and memory utilization is greatly improved relative to long short-term memory due to the reduction in the number of parameters. Based on the above considerations, the VMD-GRU model is selected as the prediction model in this paper as shown in Step 4 of Figure 6. Of course, using other available data-based prediction models in Step 4 is entirely acceptable, and this will not affect the usability of the proposed prediction method.
4. Experiments and Analyses
In this section, we detail how the effectiveness and advantage of the proposed RUL interval prediction method were verified via several experiments based on the CALCE battery dataset and NCA battery dataset. Before validating the proposed prediction method, in order to enhance the feasibility of the experimental design, a series of focusing on the performance of periodic time series under different sorting strategies was specially designed. Taking battery CS2_35 as an example, the prediction errors under different sorting strategies of multiple constructed periodic time series were analyzed to find out the optimal sorting. This step was crucial for optimizing the prediction accuracy. Finally, by combining the data of the CALCE batteries and NCA batteries, the experiments on RUL interval prediction for LiBs based on periodic time series were designed and implemented as a means of verifying the practical application and superiority of the proposed method.
4.1. HI Extraction
Generally, the capacity degradation of a battery is measured by its capacity and internal resistance. However, LiBs are not completely charged and discharged regularly during the actual charging/discharging process, and the internal resistance is constantly changing, so it is not possible to effectively and accurately obtain the data of LiBs online. At the same time, there are many factors that affect the battery degradation, such as voltage, current, temperature, and humidity. Therefore, voltage and current, which are easy to measure and easy to obtain, were chosen as HIs in this paper. The impedance value of the battery in operation is provided in some public datasets of professional laboratories, so the impedance value of the battery was also used as a kind of HI.
In this paper, the charging/discharging curves of different cycles were selected to be studied, and the charging/discharging characteristics of battery CS2_35 are shown in Figure 7 as an example. Figure 7a,b represent the variation in CC charging voltage and CV charging current with time during charging, and Figure 7c,d represent the variation in voltage and impedance with time during CC discharging, respectively.
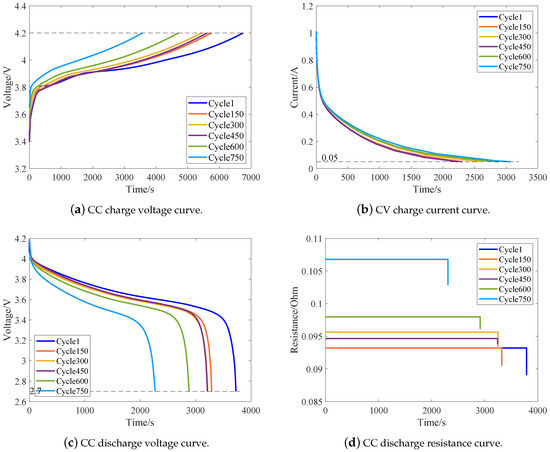
Figure 7.
Charging/discharging characteristic curves for different cycles of battery CS2_35.
In Figure 7a, the CC charging time shrinks considerably during the battery charging/discharging cycle from 1 to 750, which indicates that the battery capacity decreases with its charging/discharging process continuously. Meanwhile, according to the degree of sparsity between the CC charging voltage curves of different cycle cycles, the capacity degradation of this battery is mainly divided into three phases: between cycle cycles 1 and 150, the capacity of the battery decreases at a relatively fast rate; between cycle cycles 150 and 600, the capacity of the battery decreases at a slow rate and may be accompanied by some capacity rebound phenomenon; between cycle cycles 600 and 750, the battery capacity degradation rate is significantly faster compared to that in the other two stages. This pattern is consistent with the capacity degradation diagram of battery CS2_35. Similarly, the CC discharge voltage curve in Figure 7c exhibits a similar phenomenon. In contrast, the CV charge current curve in Figure 7b exhibits that the CV charge current time increases with the increase in the battery charging/discharging cycles and does not show a gap in the CV charge current time between different charging/discharging cycles, which indicates that the correlation between this HI and its capacity degradation curve is lower than the correlation between the CC charge voltage time and CC discharge voltage time and the battery capacity degradation curve. In Figure 7d, the impedance basically does not change with time during the battery cyclic charging/discharging cycles, but the impedance value of each cycle is different in magnitude, and its impedance value increases with the increase in battery charging/discharging cycles, and it also exhibits the gap between different cyclic cycles, so it is also possible to take the average of the impedance value of each cycle as the HI.
In summary, four HIs were extracted, including CC charging time (CCCT), CV charging time (CVCT), CC discharge time (CCDT), and the resistance of the CC discharge process (RVICCDP). The four HIs extracted from battery CS2_35 are shown in Figure 8, from which it can be seen that the CCCT and CCDT basically show a degradation trend consistent with the capacity degradation, while the trends presented by the CVCT and the RVICCDP are quite different from the capacity degradation of battery CS2_35. In order to further analyze the relationship between the proposed HIs and capacity, correlation analysis was performed, as described in Section 4.2.
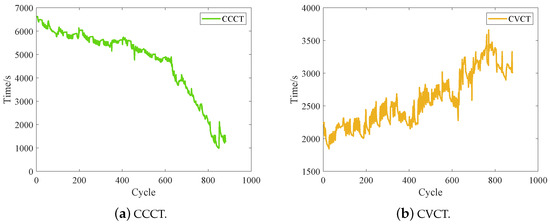
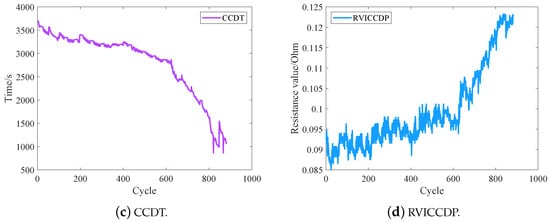
Figure 8.
Four HIs extracted from battery CS2_35.
4.2. Correlation Analysis
Four HIs were extracted by analyzing the information during the operation of LiBs. In order to illustrate the relationship between the extracted HIs and the capacity, the analysis was carried out from two perspectives: quantitative and qualitative. The quantitative analysis was performed using Pearson and maximal information coefficient (MIC) correlation analyses, and the qualitative analysis is illustrated by scatter plots.
4.2.1. Quantitative Analysis
Pearson coefficient: The mathematical expression of the Pearson correlation coefficient is
where X is the capacity and Y is the HIs extracted in this paper. The Pearson correlation coefficient has a value between and 1. If the coefficient is in the interval , the larger the value is, the stronger the positive correlation is. On the contrary, if the coefficient is in the interval , the smaller the value is, the stronger the negative correlation is.
MIC: The main idea of MIC is to discretize the relationship between two variables in two dimensions and represent it using a scatter plot. The probability density of the scatter can then measure the coefficient of mutual information between the two variables, thus capturing linear as well as non-linear associations. Different grid drawings cause the samples to fall into different 2D grids, and the number of scatters in each grid interval is counted and compared to the total number of samples to obtain a joint distribution, , of HIs and capacity. Based on the feature edge distribution and target edge distribution , the mutual information between HIs and capacity can be found, whose mathematical expression is
Based on (5), MIC can be described as
where a and b denote the number of grids divided in the directions x and y, respectively; B is a constant, typically set to the 0.6 power of the data volume.
Taking CALCE battery dataset as an example, the correlation analysis between HIs and capacity is shown in Table 1, from which the correlation coefficient of CCDT is the highest among the four HIs, indicating that CCDT is able to reflect the capacity degradation of LiBs.

Table 1.
HI and capacity correlation analysis of CALCE batteries.
4.2.2. Qualitative Analysis
The scatter plots of capacity versus the four HIs are shown in Figure 9, from which all the four HIs and capacity have some correlation. Both CCCT and CCDT decrease with decreasing capacity, indicating a positive correlation between these two HIs and capacity, and CCDT shows almost a straight line with capacity, which also indicates a stronger positive correlation between CCDT and capacity. Meanwhile RVICCDP increases with decreasing capacity, indicating a negative correlation between this HI and capacity. This is because as the capacity of LiBs decreases with the increase in time, the impedance of the battery also increases, so RVICCDP varies oppositely to the capacity. CVCT is negatively correlated with capacity because as the battery capacity decreases, the internal impedance of the battery increases, so CVCT increases with the decrease in battery capacity.
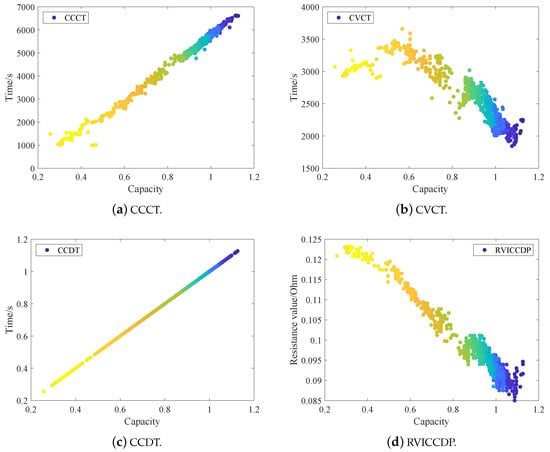
Figure 9.
Scatter plot of HIs versus capacity.
In order to demonstrate that the proposed HIs can effectively reflect the battery degradation, both quantitative and qualitative analyses were employed. Considering cost-effectiveness and operational simplicity, we focused on the charging/discharging processes of LiBs as the basis for evaluating the HIs. This study showed that there is a significant correlation between these indicators and the battery capacity. Based on this result, the CCDT with the highest correlation between these metrics and battery capacity was found. Thus, CCDT was used as the main HI in the subsequent experiments.
In this paper, the prediction method that relies on a single HI (CCDT) was chosen. The main reason is that an RUL prediction method based on a single HI is less computationally demanding compared to multi-HI fusion (e.g., CCDT + CCCT), which is important for the practical implementation and real-time operation of the RUL prediction method. Of course, better prediction accuracy can be obtained if multi-HI fusion is used, but there will be a compromise in the complexity of the prediction model and the amount of computation, which will be an obstacle to the practical implementation and real-time operation of the prediction method.
4.3. Experiments on RUL Interval Prediction for LiBs Based on Periodic Time Series
4.3.1. Verification Experiments and Analysis
Taking battery CS2_35 as an example, after selecting and sorting the fuzzy granular data using the corresponding strategy, the first 37% of the fuzzy data of battery CS2_35 and the data of previous batteries were used as the training set, and the remaining data of battery CS2_35 were used as the test set, and the VMD-GRU model, whose parameters were the same as those in [34] and are shown in Table 2, was applied to RUL prediction for LiBs. The prediction accuracy and interval prediction effect are shown in Table 3 and Table 4, respectively, where ↑ and ↓ represent the correlations from low to high and high to low, respectively. The core code can be found on our personal website (https://github.com/wenjie015/wenjie015.github.io/blob/master/files/RUL%20interval%20prediction%20for%20battery%20CS2_35.ipynb, accessed on 12 May 2025) built on Github.

Table 2.
Parameter settings of the VMD-GRU model.

Table 3.
Prediction results of battery CS2_35 under different strategies.

Table 4.
Interval prediction results for battery CS2_35 with different strategies.
In order to show the superiority of the proposed methods more intuitively, a graphical spider web diagram is used to express the error of each method, as shown in Figure 10. To improve the clarity and readability of the cobweb diagram, more intuitive or simplified aliases are used to express each method. The time series shown in Table 3 are, from top to bottom, SrI, SdI, SII_1, SII_2, SIII_1, SIII_2, SIII_3, SIII_4, SIII_5, SIII_6, SIV_1, SIV_2, SIV_3, and SIV_4. It is important to note that the prediction of one interval of strategy III upper limit Up does not have the same ascending and descending time series alignment as the lower limit Low and is represented here by an alias only. Moreover, the original strategy method that did not construct a periodic time series is denoted by S_raw.
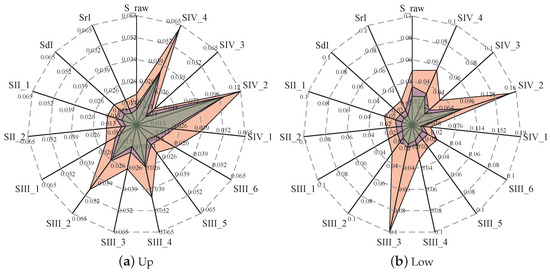
Figure 10.
Distribution of prediction errors for battery CS2_35.
From Table 3 and Figure 10, it is seen that Strategy I based on periodic time series has obvious prediction advantages when the same prediction model is used. Especially in the prediction of Low under fuzzy conditions, Strategy I shows an absolute advantage compared with the original strategy. In Strategy I and Strategy III, the prediction effect of the periodic time series according to the correlation gradually increasing is significantly better than that of the correlation gradually decreasing. Therefore, when constructing periodic time series, it is better to choose the sorting method with gradually increasing correlation. Combined with the results in Table 4, when constructing periodic time series selecting correlation data (Strategy I and Strategy II), both the model prediction accuracy and the comprehensive evaluation indicator of intervals show better results; thus the correlation selection of data in the method based on periodic time series has a greater impact than the correlation sorting. Among Strategies III and IV, Strategy III is more stable on the whole, so the connection order of data is also a non-negligible factor when choosing data connections. In addition, when data from different sets of batteries are mixed together, the poorer results of Strategies III and IV show that the correlation between data should be fully considered when selecting the data to be connected. In conclusion, for the selection of connected data, the selection of data from the same group is preferred to data from dissimilar groups, and the correlation sorting method is superior to stochastic sorting. Hence, Strategy I was used in the subsequent experiments to implement RUL interval prediction for LiBs.
The prediction results for the four batteries in CALCE are shown in Figure 11, and it is obvious that they all effectively achieve RUL interval prediction. Compared with the prediction results in [34] without constructing periodic time series, the prediction curves of upper and lower bound shown in Figure 11 more accurately depict the degradation trend of capacity and its fluctuation characteristics. Therefore, when performing RUL interval prediction, the method of constructing periodic time series can capture the fluctuation characteristics of time series more accurately, thus improving the accuracy of RUL interval prediction.
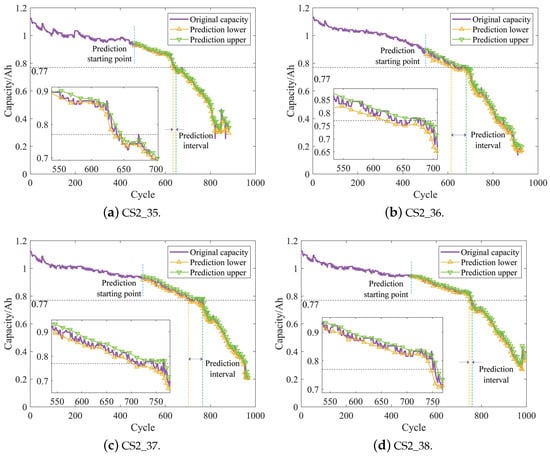
Figure 11.
RUL interval prediction for CALCE batteries with constructed periodic time series.
The experimental results of RUL interval prediction for five NCA batteries are shown in Figure 12. Compared with the original strategy of not taking the construction of periodic time series in [34], the method based on periodic time series has advantages. As shown in Figure 12, when the prediction starting points are all the first 37% of the fuzzy information particles, it exhibits a very different prediction effect from that in [34]. In [34], when the prediction starting point of NCA batteries is 37%, the prediction interval is far from the true value, which is due to the smoothness of the NCA batteries’ degradation and the adoption of a larger time window in the fuzzy granulation, which leads to insufficient data for the training of prediction model, whereas the proposed method avoids this problem.
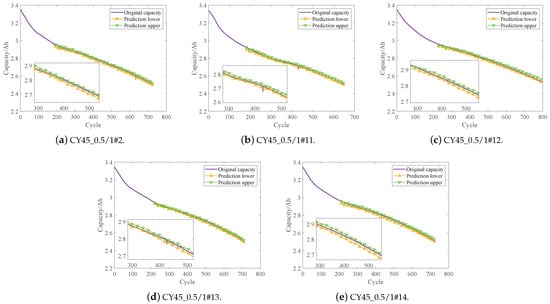
Figure 12.
RUL interval prediction for NCA batteries with constructed periodic time series.
Since this paper mainly improves the prediction accuracy by constructing periodic time series and does not involve fuzzy granularity to divide the window problem, and a fuzzy information granule contains the charging/discharging information of multiple battery degradation cycles, it only improves the fit with the original fuzzy information granule in terms of the prediction accuracy, so the interval prediction at the failure threshold of CALCE batteries is consistent with [34]. Since the NCA battery degradation data is not provided at the failure threshold, the range of interval prediction at the failure threshold for NCA batteries is not given in this subsection. The prediction accuracy of the method of constructing periodic time series proposed in this paper and the evaluation indicators for interval prediction will be described in Section 4.3.2.
4.3.2. Comparison Experiments and Analysis
When the prediction starting point is early, NCA batteries experience poor prediction. Thus, in this subsection, we detail how experiments were designed using NCA battery aging data to validate the feasibility of the interval prediction scheme based on periodic time series as well as its effectiveness in addressing the data loss caused by the granularity of fuzzy information. Meanwhile, to show the superiority of the proposed method in terms of prediction performance and its generalization ability, the experiments were conducted on the CALCE battery dataset to compare and analyze the prediction results of the interval prediction based on periodic time series with the prediction results of the interval prediction model based on the fuzzy information granular and trend filtering segmentation in [34].
For the convenience of analyzing and evaluating the prediction results, the interval prediction model in [34] is denoted as Method I. Further, a new interval prediction model, called Method II, was formed based on Method I by introducing periodic time series. The main difference between Model I and Model II is that Model I uses the original data directly for the training of the prediction model, whereas Model II first joins the original data to make them periodic using the proposed periodic time series construction method and then trains the prediction model with the generated periodic data. Table 5 shows the prediction error evaluation results of these two methods (Method I and Method II) on different battery datasets. As shown in Table 5, in the MAE for the CALCE battery dataset, for example, the prediction error evaluation indicator of Method II is lower than that of Method I in most cases, and there exist only a few cases in which the prediction error evaluation indicator of Method II is higher than that of Method I. Moreover, the error evaluation indicator of Method II is relatively smooth, with not much difference, while the error evaluation indicator of Method I fluctuates more. In the NCA battery dataset, the prediction error evaluation indicators of Method II are all lower than that of Method I, and the prediction error evaluation indicator of Method II is only one-tenth of that of Method I. In summary, the proposed prediction method, by constructing periodic time series, has great advantages in prediction values, which fully shows its effectiveness and superiority.

Table 5.
Results of the error evaluation of the two types of prediction models.
The evaluation results of Method I and Method II for interval prediction for the CALCE battery dataset are shown in Table 6. In particular, the results of using fixed-scale segmentation (segmentation width was 15) instead of trend filtering segmentation, which is denoted as Model Basis, are also presented in Table 6 for a broader comparison. As can be seen from Table 6, the value of for Model I is smaller than that of Model Basis, indicating that the trend filtering segmentation has a higher prediction accuracy. Looking at again, the one under the Model I is the larger for the same battery, further proving the superiority of the trend filtering segmentation in terms of prediction accuracy. Finally, based on the value, it can be concluded that Model I has better overall prediction than Model Basis. On the other hand, the P values of both Model I and Model II are greater than 20% for the CALCE battery dataset, which indicates that both Method I and Method II are capable of interval prediction. Although Method II does not have an advantage in terms of and , the value of Method II is significantly better than that of Method I.

Table 6.
Evaluation results of interval prediction of the two prediction models for the CALCE battery dataset.
The evaluation results of Method I and Method II for interval prediction for the NCA battery dataset are shown in Table 7. In Table 7, for the NCA battery dataset, although most of the interval prediction widths of Method II are larger than those of Method I, the P values of Method II are significantly better than those of Method I. However, Method II has an absolute advantage in the coverage of the predicted intervals over the true values . From the analysis in [34], it can be seen that in the comprehensive evaluation indicator, the influential P value mainly depends on the interval prediction width , and the P values of Method II are all better than those of Method I, which further indicates the great advantage of Method II in the coverage of true values. In conclusion, the prediction performance of Method II is better than that of Method I, which indicates that the proposed method of constructing periodic time series is more feasible and effective in RUL interval prediction.

Table 7.
Evaluation results of interval prediction of different prediction models for NCA battery dataset.
Remark 1.
Fuzzy information granulation has been widely used in the field of the health management of LiBs, such as in [32,37,38,39]. Considering the tendency of fuzzy information granulation to require the length of data, the combination of the periodic time series construction method and fuzzy information granulation used in this paper provides a valuable new idea for related works, i.e., works using fuzzy information granulation can try to develop and improve by combining the construction method of periodic time series via the same way or a similar way to that used in this paper, which is one of the potential benefits of this paper.
Remark 2.
The two battery datasets from CALCE and NCA were both obtained in controlled lab conditions, while real-world datasets may exhibit higher noise and environmental variability, which may result in well-performing prediction models trained using laboratory data to perform poorly when used with real-world data. There are two pathways to address this issue: (1) train prediction models using data generated from real scenarios so that they can take into account the noise and environmental variability in real-world datasets; (2) design prediction models with better generalization capability so that prediction models trained using laboratory data also perform well on real-world datasets. Both of these pathways encounter some challenges in their use: the first pathway needs to address the privacy of real data, while the second pathway places higher demands on the design of prediction models. These challenges are also directions and topics for future attention and research.
5. Conclusions
This paper addresses the issue of insufficient training samples after fuzzy information granulation due to battery degradation data smoothing in interval prediction and proposes constructing periodic time series as a solution. Based on the prediction model in [34], the construction method for periodic time series is used to generate enough training data, and experiments were conducted using the degradation data from the CALCE and NCA battery datasets. The experiment results show that the proposed method is not only effective in alleviating the information loss problem caused by fuzzy information granularity but also significantly solves the challenges caused by insufficient training data. Moreover, the comparison results of the error evaluation indicators show that the prediction method proposed in this paper, by constructing periodic time series, has better prediction accuracy compared to the prediction method based on trend filtering segmentation and fuzzy information granulation in [34].
Further works can be considered as follows: (1) the combination of the periodic time series construction method and the related prediction model of using fuzzy information granulation; (2) studies of the applicability of the prediction method proposed in this paper to the degradation data generated from real operational scenarios; (3) the implementation of the prediction method proposed in this paper, including hardware design and real-time operation.
Author Contributions
Conceptualization, C.C. and J.W.; methodology, C.C. and G.X.; software, G.X. and C.J.; validation, C.C. and G.X.; formal analysis, G.X.; investigation, C.C.; resources, C.J.; data curation, C.J.; writing—original draft preparation, C.C., G.X. and C.J.; writing—review and editing, J.W.; visualization, G.X. and C.J.; supervision, J.W.; project administration, J.W.; funding acquisition, J.W. All authors have read and agreed to the published version of the manuscript.
Funding
This research was funded by Natural Science Foundation of Shanxi Province, grant number 202403021211088. The APC was funded by 202403021211088.
Data Availability Statement
The data used in this paper are from open-source datasets, including the Center for Advanced Life Cycle Engineering (https://calce.umd.edu/battery-data, accessed on 12 May 2025) and NCA battery dataset (https://doi.org/10.5281/zenodo.6379165, accessed on 12 May 2025).
Conflicts of Interest
The authors declare no conflicts of interest.
References
- Hu, X.; Zhang, K.; Liu, K.; Lin, X.; Dey, S.; Onori, S. Advanced fault diagnosis for lithium-ion battery systems: A review of fault mechanisms, fault features, and diagnosis procedures. IEEE Ind. Electron. Mag. 2020, 14, 65–91. [Google Scholar] [CrossRef]
- Wu, J.; Fang, L.; Dong, G.; Lin, M. State of health estimation for lithium-ion batteries in real-world electric vehicles. Sci. China Technol. Sci. 2023, 66, 47–56. [Google Scholar] [CrossRef]
- Broussely, M.; Biensan, P.; Bonhomme, F.; Blanchard, P.; Herreyre, S.; Nechev, K.; Staniewicz, R. Main aging mechanisms in Li ion batteries. J. Power Sources 2005, 146, 90–96. [Google Scholar] [CrossRef]
- Akkaldevi, C.; Chitta, S.D.; Jaidi, J.; Panchal, S.; Fowler, M.; Fraser, R. Coupled electrochemical-thermal simulations and validation of minichannel cold-plate water-cooled prismatic 20 Ah LiFePO4 battery. Electrochem 2021, 2, 643–663. [Google Scholar] [CrossRef]
- Xie, Q.; Liu, R.; Huang, J.; Su, J. Residual life prediction of lithium-ion batteries based on data preprocessing and a priori knowledge-assisted CNN-LSTM. Energy 2023, 281, 128232. [Google Scholar] [CrossRef]
- Wu, J.; Fang, L.; Dong, G.; Lin, M. State of health estimation of lithium-ion battery with improved radial basis function neural network. Energy 2023, 262, 125380. [Google Scholar] [CrossRef]
- Li, L.; Li, Y.; Mao, R.; Li, Y.; Lu, W.; Zhang, J. TPANet: A novel triple parallel attention network approach for remaining useful life prediction of lithium-ion batteries. Energy 2024, 309, 132890. [Google Scholar] [CrossRef]
- Jia, J.; Yuan, S.; Shi, Y.; Wen, J.; Pang, X.; Zeng, J. Improved sparrow search algorithm optimization deep extreme learning machine for lithium-ion battery state-of-health prediction. iScience 2022, 25, 103988. [Google Scholar] [CrossRef]
- Che, Y.; Deng, Z.; Lin, X.; Hu, L.; Hu, X. Predictive battery health management with transfer learning and online model correction. IEEE Trans. Veh. Technol. 2021, 70, 1269–1277. [Google Scholar] [CrossRef]
- Zhang, J.; Huang, H.; Zhang, G.; Dai, Z.; Wen, Y.; Jiang, L. Cycle life studies of lithium-ion power batteries for electric vehicles: A review. J. Energy Storage 2024, 93, 112231. [Google Scholar] [CrossRef]
- Hu, X.; Xu, L.; Lin, X.; Pecht, M. Battery lifetime prognostics. Joule 2020, 4, 310–346. [Google Scholar] [CrossRef]
- Liu, K.; Hu, X.; Wei, Z.; Li, Y.; Jiang, Y. Modified Gaussian process regression models for cyclic capacity prediction of lithium-ion batteries. IEEE Trans. Transp. Electrif. 2019, 5, 1225–1236. [Google Scholar] [CrossRef]
- Liu, K.; Li, Y.; Hu, X.; Lucu, M.; Widanage, W.D. Gaussian process regression with automatic relevance determination kernel for calendar aging prediction of lithium-ion batteries. IEEE Trans. Ind. Inform. 2019, 16, 3767–3777. [Google Scholar] [CrossRef]
- Chen, Z.; Shi, N.; Ji, Y.; Niu, M.; Wang, Y. Lithium-ion batteries remaining useful life prediction based on BLS-RVM. Energy 2021, 234, 121269. [Google Scholar] [CrossRef]
- Mao, L.; Hu, Q.; Zhao, J.; Yu, X. State-of-charge of lithium-ion battery based on equivalent circuit model–Relevance vector machine fusion model considering varying ambient temperatures. Measurement 2023, 221, 113487. [Google Scholar] [CrossRef]
- Wang, Z.; Liu, N.; Chen, C.; Guo, Y. Adaptive self-attention LSTM for RUL prediction of lithium-ion batteries. Inf. Sci. 2023, 635, 398–413. [Google Scholar] [CrossRef]
- Wang, J.; Zhang, F.; Zhang, J.; Liu, W.; Zhou, K. A flexible RUL prediction method based on poly-cell LSTM with applications to lithium battery data. Reliab. Eng. Syst. Saf. 2023, 231, 108976. [Google Scholar] [CrossRef]
- Chen, J.; Zhang, Y.; Wu, J.; Cheng, W.; Zhu, Q. SOC estimation for lithium-ion battery using the LSTM-RNN with extended input and constrained output. Energy 2023, 262, 125375. [Google Scholar] [CrossRef]
- Catelani, M.; Ciani, L.; Fantacci, R.; Patrizi, G.; Picano, B. Remaining useful life estimation for prognostics of lithium-ion batteries based on recurrent neural network. IEEE Trans. Instrum. Meas. 2021, 70, 3524611. [Google Scholar] [CrossRef]
- Ma, Y.; Wang, Z.; Gao, J.; Chen, H. A novel method for remaining useful life of solid-state lithium-ion battery based on improved CNN and health indicators derivation. Mech. Syst. Signal Process. 2024, 220, 111646. [Google Scholar] [CrossRef]
- Hou, J.; Su, T.; Gao, T.; Yang, Y.; Xue, W. Early prediction of battery lifetime for lithium-ion batteries based on a hybrid clustered CNN model. Energy 2025, 319, 134992. [Google Scholar] [CrossRef]
- He, N.; Wang, Q.; Lu, Z.; Chai, Y.; Yang, F. Early prediction of battery lifetime based on graphical features and convolutional neural networks. Appl. Energy 2024, 353, 122048. [Google Scholar] [CrossRef]
- Li, W.; Li, Y.; Garg, A.; Gao, L. Enhancing real-time degradation prediction of lithium-ion battery: A digital twin framework with CNN-LSTM-attention model. Energy 2024, 286, 129681. [Google Scholar] [CrossRef]
- Qian, C.; Xu, B.; Xia, Q.; Ren, Y.; Sun, B.; Wang, Z. SOH prediction for Lithium-Ion batteries by using historical state and future load information with an AM-seq2seq model. Appl. Energy 2023, 336, 120793. [Google Scholar] [CrossRef]
- Xu, X.; Tang, S.; Han, X.; Lu, L.; Wu, Y.; Yu, C.; Sun, X.; Xie, J.; Feng, X.; Ouyang, M. Fast capacity prediction of lithium-ion batteries using aging mechanism-informed bidirectional long short-term memory network. Reliab. Eng. Syst. Saf. 2023, 234, 109185. [Google Scholar] [CrossRef]
- Singh, A.N.; Kim, M.H.; Meena, A.; Wi, T.U.; Lee, H.W.; Kim, K.S. Na/Al Codoped Layered Cathode with Defects as Bifunctional Electrocatalyst for High-Performance Li-Ion Battery and Oxygen Evolution Reaction. Small 2021, 17, 2005605. [Google Scholar] [CrossRef] [PubMed]
- Ma, L.; Tian, J.; Zhang, T.; Guo, Q.; Hu, C. Accurate and efficient remaining useful life prediction of batteries enabled by physics-informed machine learning. J. Energy Chem. 2024, 91, 512–521. [Google Scholar] [CrossRef]
- Sandrucci, E.; Palluzzi, M.; Brutti, S.; Celeste, A.; Matic, A.; Marini, F. Application of an experimental design approach to optimize aging protocols for lithium-metal batteries. Future Batter. 2025, 5, 100041. [Google Scholar] [CrossRef]
- Wang, F.; Zhai, Z.; Zhao, Z.; Di, Y.; Chen, X. Physics-informed neural network for lithium-ion battery degradation stable modeling and prognosis. Nat. Commun. 2024, 15, 4332. [Google Scholar] [CrossRef]
- Navidi, S.; Thelen, A.; Li, T.; Hu, C. Physics-informed machine learning for battery degradation diagnostics: A comparison of state-of-the-art methods. Energy Storage Mater. 2024, 68, 103343. [Google Scholar] [CrossRef]
- Xiong, R.; He, Y.; Sun, Y.; Jia, Y.; Shen, W. Enhanced electrode-level diagnostics for lithium-ion battery degradation using physics-informed neural networks. J. Energy Chem. 2025, 104, 618–627. [Google Scholar] [CrossRef]
- Pan, W.; Chen, Q.; Zhu, M.; Tang, J.; Wang, J. A data-driven fuzzy information granulation approach for battery state of health forecasting. J. Power Sources 2020, 475, 228716. [Google Scholar] [CrossRef]
- Pang, X.; Zhao, Z.; Wen, J.; Jia, J.; Shi, Y.; Zeng, J.; Dong, Y. An interval prediction approach based on fuzzy information granulation and linguistic description for remaining useful life of lithium-ion batteries. J. Power Sources 2022, 542, 231750. [Google Scholar] [CrossRef]
- Xia, G.; Jia, C.; Shi, Y.; Jia, J.; Pang, X.; Wen, J.; Zeng, J. Remaining useful life prediction of lithium-ion batteries by considering trend filtering segmentation under fuzzy information granulation. Energy 2025, 318, 134810. [Google Scholar] [CrossRef]
- Wang, J.Q.; Du, Y.; Wang, J. LSTM based long-term energy consumption prediction with periodicity. Energy 2020, 197, 117197. [Google Scholar] [CrossRef]
- Cui, C.; Xia, G.; Jia, C.; Wen, J. A Novel Construction Method and Prediction Framework of Periodic Time Series: Application to State of Health Prediction of Lithium-Ion Batteries. Energies 2025, 18, 1438. [Google Scholar] [CrossRef]
- Ouyang, T.; Wang, C.; Jin, S.; Su, Y. Fuzzy information granulation for capacity efficient prediction in lithium-ion battery. Renew. Sustain. Energy Rev. 2025, 211, 115241. [Google Scholar] [CrossRef]
- Xu, P.; Liu, B.; Hu, X.; Ouyang, T.; Chen, N. State-of-Charge estimation for lithium-ion batteries based on fuzzy information granulation and asymmetric Gaussian membership function. IEEE Trans. Ind. Electron. 2021, 69, 6635–6644. [Google Scholar] [CrossRef]
- Pang, X.; Zhao, Z.; Wen, J.; Jia, J.; Shi, Y.; Zeng, J.; Zhang, L. Considering the self-adaptive segmentation of time series in interval prediction of remaining useful life for lithium-ion battery. J. Energy Storage 2023, 70, 107862. [Google Scholar] [CrossRef]
- Zhu, J.; Wang, Y.; Huang, Y.; Bhushan Gopaluni, R.; Cao, Y.; Heere, M.; Mühlbauer, M.J.; Mereacre, L.; Dai, H.; Liu, X.; et al. Data-driven capacity estimation of commercial lithium-ion batteries from voltage relaxation. Nat. Commun. 2022, 13, 2261. [Google Scholar] [CrossRef]
- Lu, W.; Pedrycz, W.; Liu, X.; Yang, J.; Li, P. The modeling of time series based on fuzzy information granules. Expert Syst. Appl. 2014, 41, 3799–3808. [Google Scholar] [CrossRef]
- Kim, S.J.; Koh, K.; Boyd, S.; Gorinevsky, D. l1 trend filtering. SIAM Rev. 2009, 51, 339–360. [Google Scholar] [CrossRef]
Disclaimer/Publisher’s Note: The statements, opinions and data contained in all publications are solely those of the individual author(s) and contributor(s) and not of MDPI and/or the editor(s). MDPI and/or the editor(s) disclaim responsibility for any injury to people or property resulting from any ideas, methods, instructions or products referred to in the content. |
© 2025 by the authors. Published by MDPI on behalf of the World Electric Vehicle Association. Licensee MDPI, Basel, Switzerland. This article is an open access article distributed under the terms and conditions of the Creative Commons Attribution (CC BY) license (https://creativecommons.org/licenses/by/4.0/).