1. Introduction
In the modern world, the rapid development of electric transport requires solving the key tasks: the effective accumulation and redistribution of energy in traction systems [
1]. Against the backdrop of the global transition to environmentally friendly modes of transport, including trams, trolleybuses, and electric trains, ensuring sustainable and economical use of energy has become a priority area of research [
2,
3,
4]. A particularly important task is the rational use of regenerative braking energy, which is often lost through dissipation in rheostats under conditions of a saturated contact network and limited consumption opportunities. This problem is especially acute in megacities with intensive traffic of electric transport, where the share of energy losses reaches significant values, and the load on traction substations increases [
5,
6].
One of the ways to solve this problem is the use of on-board energy storage devices placed directly on rolling stock. This approach allows accumulating recuperative energy for subsequent use within the section of traffic without a contact network or at times of high loads. For example, in [
7], based on lithium-ion storage devices for trams, a 20–25% reduction in the energy consumption of traction substations was achieved. Similar results were obtained in [
8], where the use of on-board supercapacitor systems provided an 18% reduction in energy losses. However, the disadvantages of the approach entail complicating the design of rolling stock, increasing its weight, thus increasing energy consumption for transport work, and the high cost of modernizing the existing fleet of equipment [
9,
10].
Another solution is the placement of stationary energy storage devices near traction substations. In particular, the authors [
11,
12] demonstrate the installation of stationary battery systems capable of reducing load peaks at substations by 15–30% and stabilizing the voltage in the network. In the experiments described in [
13], the use of lithium iron phosphate batteries gave a 22% increase in the regenerative energy utilization rate. However, stationary storage requires significant capital investment and additional space near substations, and is associated with difficulties when integrating it into existing infrastructure [
14].
Some authors suggest the use of intelligent control systems for braking and recuperation modes. Predictive control algorithms considered in [
15] make it possible to optimize the moment of switching between regenerative and rheostat braking depending on the state of the network and the location of trains. Such approaches provide an increase in recovery efficiency by 10–15% without significant hardware changes. However, the main limitation is the high sensitivity of algorithms to forecasting errors, as well as the need to equip the entire network with a comprehensive monitoring system [
16].
Another option for solving the problem under consideration is using superconducting energy storage devices (SMES systems). Studies [
17,
18] have shown that SMES can store significant amounts of energy in a very short time with minimal losses, which makes them especially effective in systems subject to sudden load surges. Numerical results indicate that it is possible to reduce recuperative energy losses by 30–35%. However, the disadvantages are an extremely high cost of materials, a need to maintain cryogenic temperatures, and the complexity of the operation [
19].
There are ways to improve the electrical characteristics of the traction contact network, including its division into sections and installation of active filters. The authors of [
20,
21] demonstrate that optimizing the structure of the contact network allows reducing the resistance in wires and energy losses, and increasing the efficiency of receiving recuperative energy by 8–12%. Nevertheless, such modernization measures for the contact network require the reconstruction of a large volume of the contact network infrastructure (replacing the current-consuming wire with a given cross-section and operational characteristics, installing buffer drives at traction substations, etc.). They are associated with high financial costs and delays in the work of the transport network during reconstruction works [
22].
Against the background of these limitations, the direction considered in this work, which is related to the simulation modeling of cycling processes of energy storage devices integrated into the structure of traction networks, is of particular relevance [
23]. The use of simulation models makes it possible to predict the behavior of the system in various operating modes at the design stage and to optimize the parameters of energy storage devices without the need for expensive full-scale experiments. In addition, the modeling method provides flexibility in studying a wide range of factors, such as storage capacity, the distance between rolling stocks, modes of operation, and characteristics of the contact network, and allows for assessing the economic effect of introducing storage devices in advance [
24].
As part of the study, a detailed simulation model was developed in the MATLAB 7.11.0 environment [
25], including functional units of the traction substation, supply lines, a contact network, traction and recuperation rolling stock, as well as energy storage. Using this model, the processes of energy accumulation during the regenerative braking of one and two rolling stocks were studied, and the dependencies of the accumulated energy on the distance to the substation and on the storage capacity were estimated. In addition, the processes of the storage device's discharge when using its energy by traction rolling stock are studied. The results obtained allow concluding that the use of energy storage devices is highly effective in reducing energy consumption by traction substations and improving the overall energy efficiency of transport systems [
26].
In today’s world, the rapid development of electric transport requires solving the key problems: efficient energy storage and redistribution in traction systems. Although the rational use of regenerative braking energy has long been discussed in the literature, most existing models either assume idealized conditions or focus on AC traction systems, leaving a gap in modeling and optimization of DC-based infrastructure, which is still widely used in many countries.
This study addresses this gap by developing a simulation-based mathematical model for DC traction systems, in particular focusing on the integration of on-board or network energy storage systems (ESS). The key novelty lies in the detailed modeling of recuperation cycles, an energy transfer between rolling stocks and ESS over variable distances and configurations, as well as accounting for efficiency losses during charge-discharge cycles.
Unlike many previously published works focusing on overall recovery efficiency, our framework integrates the spatial layout of the trolleybus network and nonlinear resistances of the overhead wires. Through parametric analysis of capacitor sizes, a distance to substations, and energy recovery rates, the study offers a practical approach to implementing ESS without a complete infrastructure upgrade.
In addition, the proposed model takes into account the following characteristics: an energy storage unit, charge-discharge efficiency losses, and a unit-level introduction in the updated simulations. It involves capacitor size variations from −20 to +20% with respect to cost efficiency, showing diminishing returns of over 10%. There is also technical feasibility and space limitations for upgrading older DC traction vehicles with modern supercapacitor banks, and analysis of the braking frequency sensitivity to the storage unit cycling performance.
The improved methodology and results can assist urban transport operators in designing cost-effective, energy-efficient systems using existing infrastructure, which is particularly valuable in regions where full AC retrofit opportunities are not available.
The purpose of this work is to study the processes of cycling the energy storage device in the traction network of the railway to assess the effectiveness of the storage of recuperative energy. It includes determining the optimal parameters of the drives depending on the working modes of the movement of electric transport and the characteristics of the contact network.
The scientific novelty of the work is the development of a comprehensive simulation model in the MATLAB 7.11.0 environment, which takes into account not only the processes of cycling the energy storage device, but also the dynamics of the interaction of rolling stock with the contact network, which makes it possible to more accurately predict the energy indicators of the system. The effect of the distance between rolling stocks and the substation on the efficiency of recuperative energy storage was studied in detail, which allowed identifying the optimal parameters for the placement of storage devices. New data on the dependence of the stored energy on the storage capacity were obtained, which showed that a capacity change within ±10% does not significantly influence energy efficiency, which is important for the economic justification of projects. A method for integrating energy storage into the existing infrastructure without its large-scale reconstruction is proposed, which reduces implementation costs.
The main contributions of this paper are summarized below.
A mathematical model was developed for the analysis of energy storage processes in an electric vehicle using a DC drive, taking into account real traction cycles and supercapacitor behavior.
The model incorporates energy recuperation and allows the estimation of energy flows under variable external loads.
A simulation framework was implemented to evaluate the efficiency of energy storage under realistic duty cycles of urban electric vehicles.
The proposed approach was verified through a comparative analysis of energy consumption with and without an energy storage device.
2. Methods and Materials
The study aimed to examine the processes of energy storage cycling in the electric transport system using simulation modeling methods. The general plan of the experimental work included the development of a simulation model of the traction network. It also involved the creation of mathematical models of all the main elements of the system, the adjustment of their parameters based on the real characteristics of the equipment, and a series of computational experiments aimed at identifying the regularities of the accumulation and use of recuperative energy [
27]. In the work, the modes of charging the energy storage device from one and two recuperating rolling stocks, as well as the efficiency of using the storage device when powering traction trains in various operating conditions, were studied. The experimental work covered the analysis of the dependence of the energy and voltage accumulated on the storage device on the distance between rolling stocks and the substation. It involved studying the effect of changing the storage capacity on its energy performance and the assessment of the energy consumption of traction substations under various scenarios of the system operation [
28].
The main tool for the research was MATLAB 7.11.0 software environment version 8.11.0 (R2019b) using the built-in functionality for modeling systems of dynamics and electrical Simulink circuits [
29]. To build the model, the standard blocks of the Simscape Power Systems library were used, supplemented by the developed specialized blocks for the regenerative braking, a traction mode of rolling stock operation, and the functioning of the energy storage device. The MATLAB 7.11.0 software package was chosen due to its wide capabilities for the simulation modeling of nonlinear dynamic processes in electromechanical systems, a high degree of flexibility in setting up models, and the ability to conduct a series of calculations with variable parameters [
30].
The simulation model included six main functional elements, each of which was implemented using the appropriate blocks and configured in accordance with the technical characteristics of the real equipment. The model of the traction substation was a DC voltage source [
31] that maintained the power level of the contact system in the range from 550 to 715 V according to the requirements of IEC 60038:1983 (6th ed.) [
32] in terms of rated voltages. As a contact network, a 1.5 km long section was modeled. It was made using the characteristics of the MF-100 contact wire, which has a resistivity of 0.177 Ohm/km at an ambient temperature of 20 °C. In the model, this resistance was taken into account by dividing the network section into ten equal sections with a resistance rating of 0.0226 ohms each.
The model of traction rolling stock was built on the basis of the built-in “DC Machine” unit in Simulink, which simulates the operation of a DC traction motor with series excitation [
33]. The thrust modes were controlled by simulating the operation of a pulse voltage regulator implemented through the “Controlled pulse width modulated (PWM) Voltage Source” unit, which supplied the motor with intermittent power. The starting currents of the engine were limited by means of a relay element that regulated the range of amplitude current values during the acceleration of rolling stock [
34]. The modes of operation of the model covered the full cycle from the start of the train to the exit mode, with the simulation stopping when the specified run-down speed [
35] was reached, determined by the calculated data.
Particular attention was paid to modeling the mode of the electric braking of rolling stock with energy recovery in the contact network [
36]. For this purpose, a tracking regenerative-rheostat braking (SRRT) scheme was built, implemented through the “Recup_PS” unit, which takes into account the switching between the recuperation and rheostat braking modes depending on the voltage level on the capacitor of the smoothing filter. When the voltage exceeded the specified maximum value of 715 V, the system automatically switched to the rheostat braking mode with energy dissipation on the brake resistor with a rating that met the technical requirements for traction systems of electric vehicles. When the voltage dropped below 690 V, the system again switched to the regenerative braking mode, ensuring the maximum use of braking energy to recharge the storage device [
37].
The energy storage device was modeled using a specially designed “ES” unit, which included charge storage elements in the form of a capacitor, pulse cycling regulators, as well as control elements that control the direction of the current depending on the operating modes [
38]. The charge and discharge of the storage device were controlled by giving control signals “Charge” and “Discharge”, activating the corresponding pulse regulators. Stabilization of charging processes and prevention of reverse currents were provided by built-in diode cells. The operating voltage range of the energy storage device was set at a minimum value of 550 V up to a maximum value of 715 V, which met the operational requirements for the supply systems of urban electric transport [
39].
The experimental work included several stages. At the first stage, charging the energy storage device was simulated when braking one and two rolling stocks located at different distances from the traction substation. During the simulation, the values of the accumulated energy and the achieved voltage level on the storage device were recorded depending on the coordinates of rolling stock in the contact network. Further, the dependence of the accumulated energy on the value of the storage capacity was studied, for which the experiments were conducted with the nominal capacity, as well as with its decrease and increase by 10%. All modes of operation of the models corresponded to the real operating conditions of transport systems: the resistance of the contact network, the implementation of real characteristics of regenerative and rheostat braking, and the dynamics of changes in current and voltage in the elements of the model [
40].
At the next stage, discharging the energy storage device into the traction network to power rolling stock was investigated. For this purpose, the model provided scenarios with a different number of rolling stock (one or two) and with different initial charge levels of the storage device [
41]. The initial charge level was established based on the data obtained at the stage of modeling charging processes. The experiments included simulating the movement of trains at different distances from the substation and measuring the amount of energy consumed by the traction substation depending on the presence or absence of energy storage in the system. During the research, the parameters of the storage device, such as capacitance, maximum voltage, current ripples, and energy losses in diodes and regulators, were carefully monitored and recorded for subsequent analysis.
To ensure the accuracy of the results, all calculations were performed using a fixed simulation time step, which provides a stable numerical approximation of the cycling processes. When analyzing the results, special attention was paid to comparing the data obtained with the calculated values of the traction characteristics of rolling stock [
42], which made it possible to verify the model and assess the accuracy of reproducing real processes.
Therefore, a comprehensive simulation environment was created in the work, which allows studying the effect of energy storage parameters and traction system characteristics on the efficiency of recuperative energy use. The choice of the MATLAB 8.12.0 (R2019b) software environment and the use of built-in models of electrical machines and power components ensured high reliability of modeling, and careful adjustment of model parameters in accordance with the real characteristics of the equipment helped to obtain data close to the real operation of electric vehicles [
43].
To improve the accuracy of the model, real parameters of energy losses while storing in charging and discharging processes were used. In particular, when modeling the storage energy flow, the efficiency of ηcharge ≈ 0.95 and ηdischarge ≈ 0.92 was applied, taking into account the losses of the regulator and the diode. This increased the accuracy of the modeled recuperation processes.
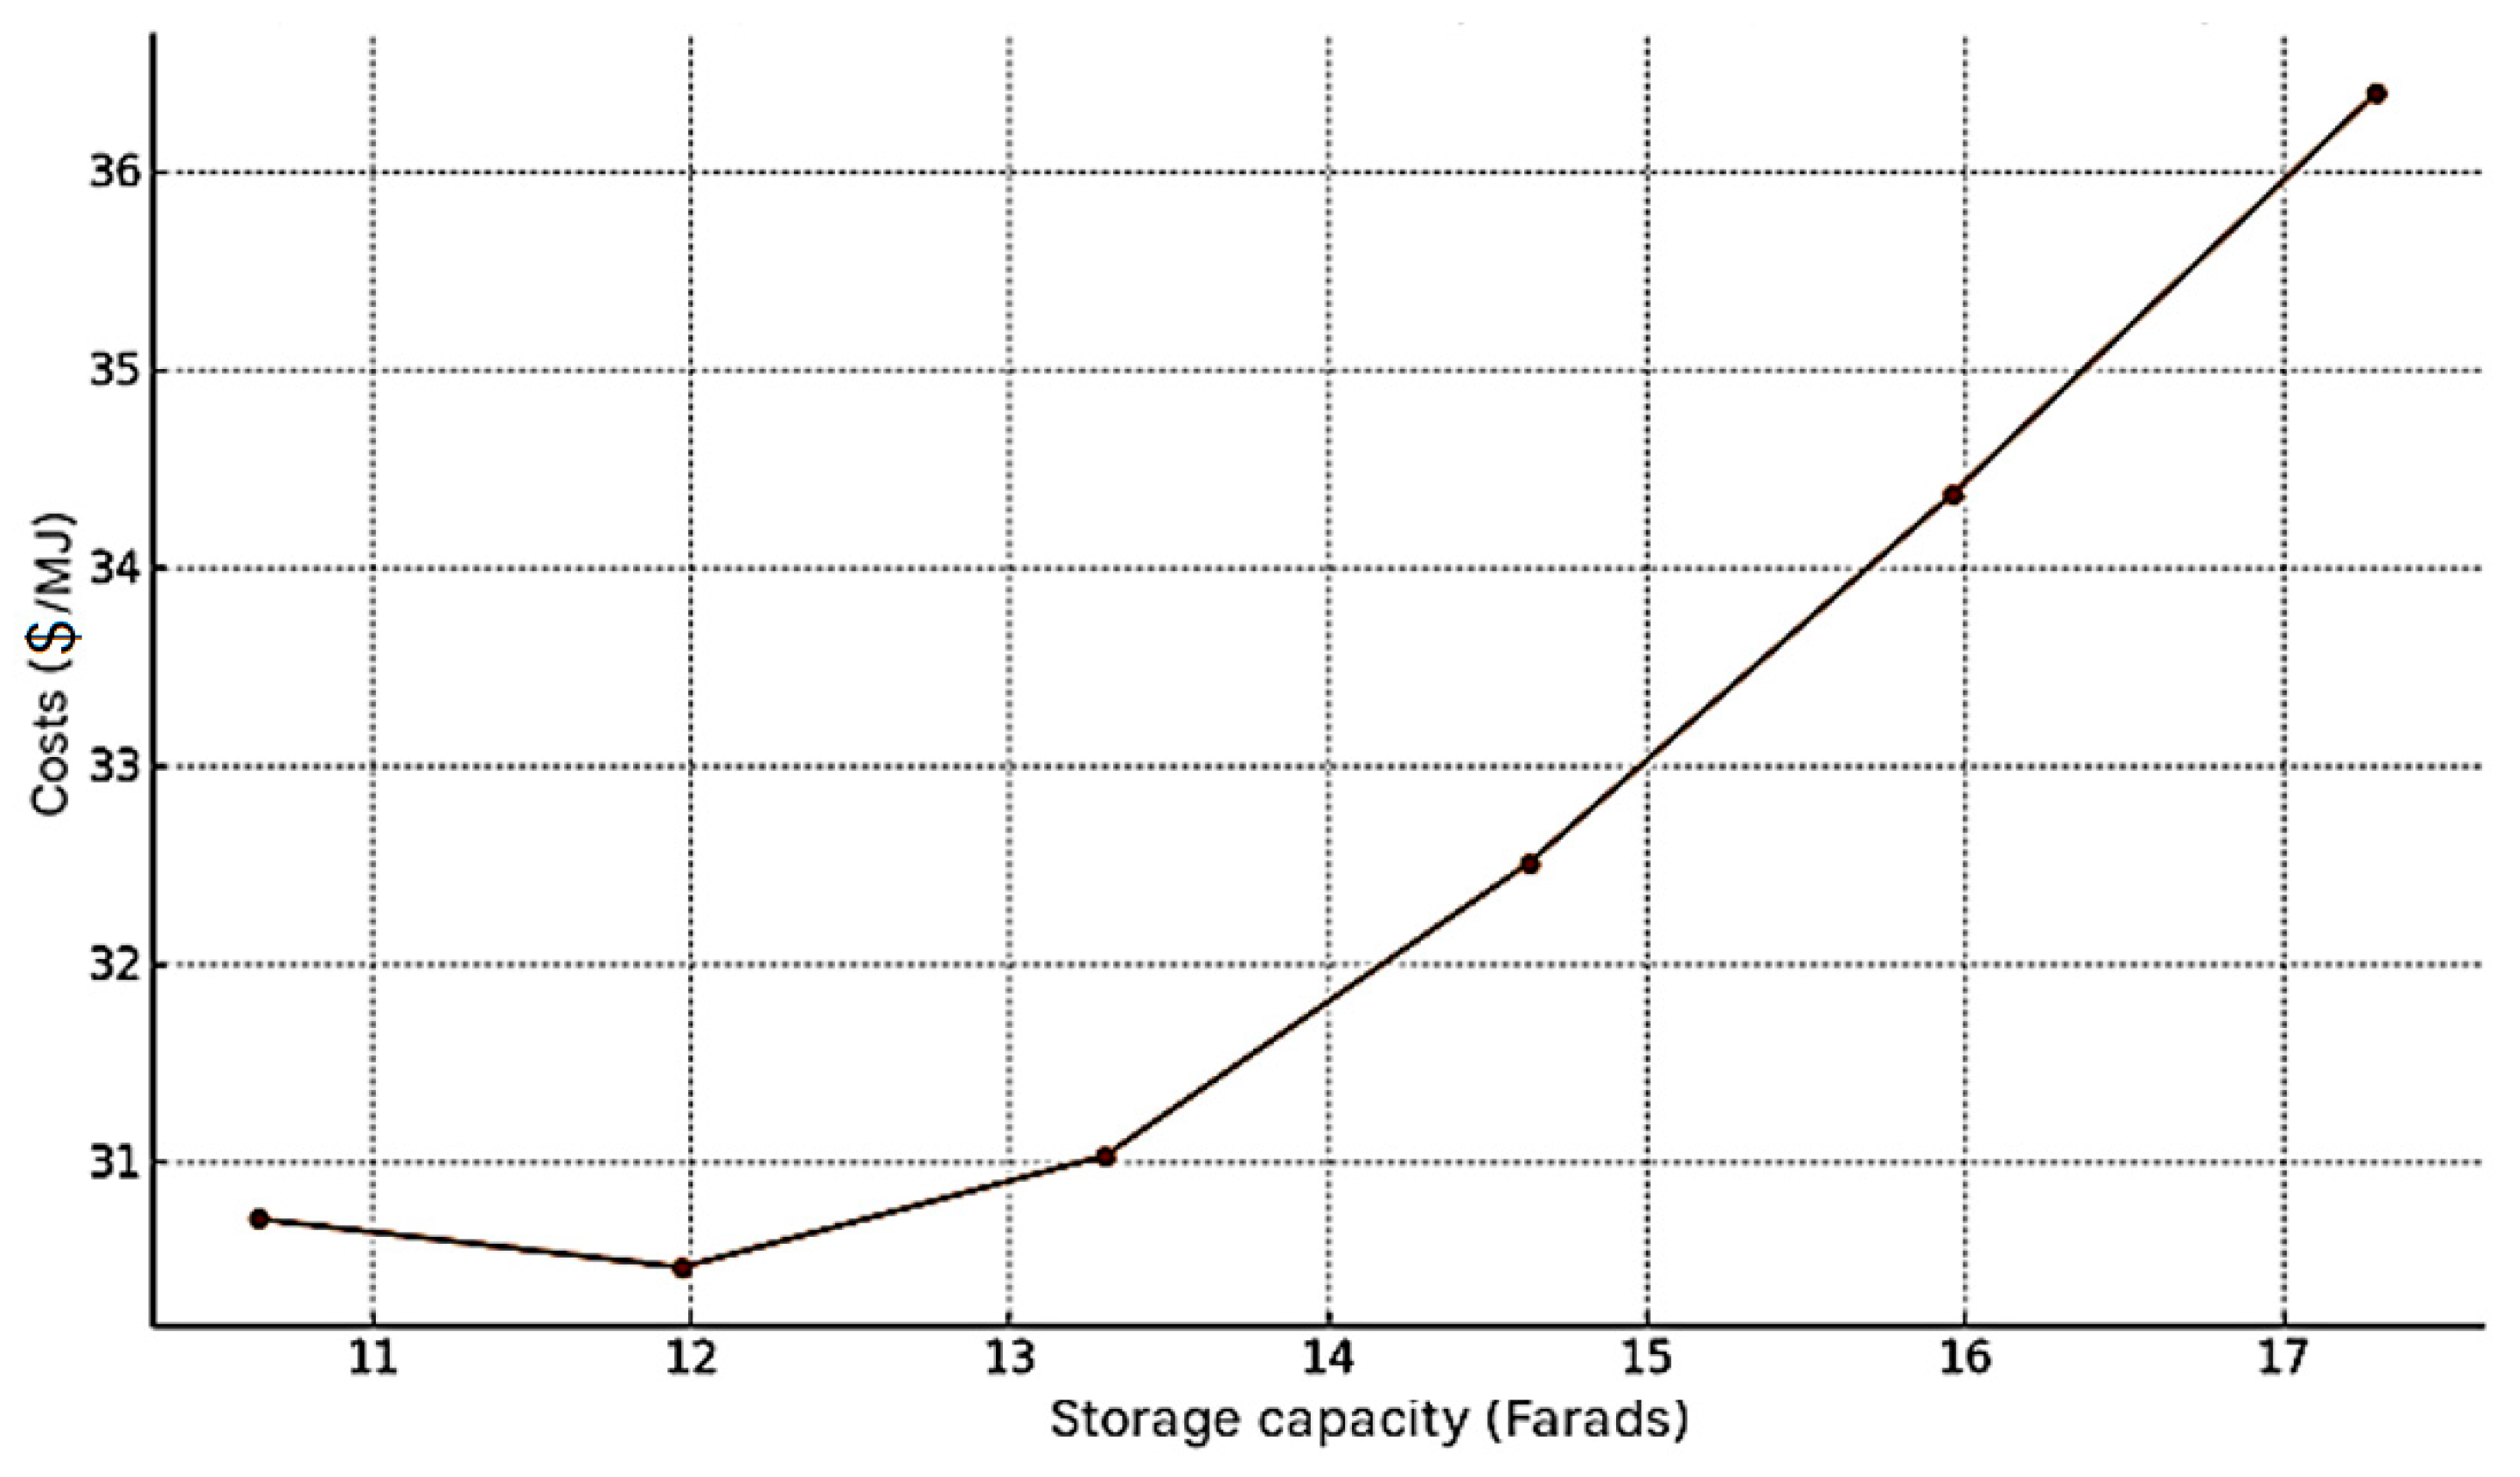
A new set of simulations was performed with storage capacity varying from −20 to +20% relative to the base value of 13.3 F. The results were then compared with investment costs based on the market value of supercapacitors (approximately USD 250–300). We introduced a cost metric per saved MJ and visualized the Pareto frontier for choosing the optimal capacity.
A new sub-model reflecting the energy cycling at variable braking intervals (5, 10, and 20 min) was developed to assess the sensitivity of ESS performance under different traffic patterns. This is critical for planning in dense urban environments as compared to suburban transport.
3. Description of the Simulation Model of a Trolleybus with an Energy Storage Device
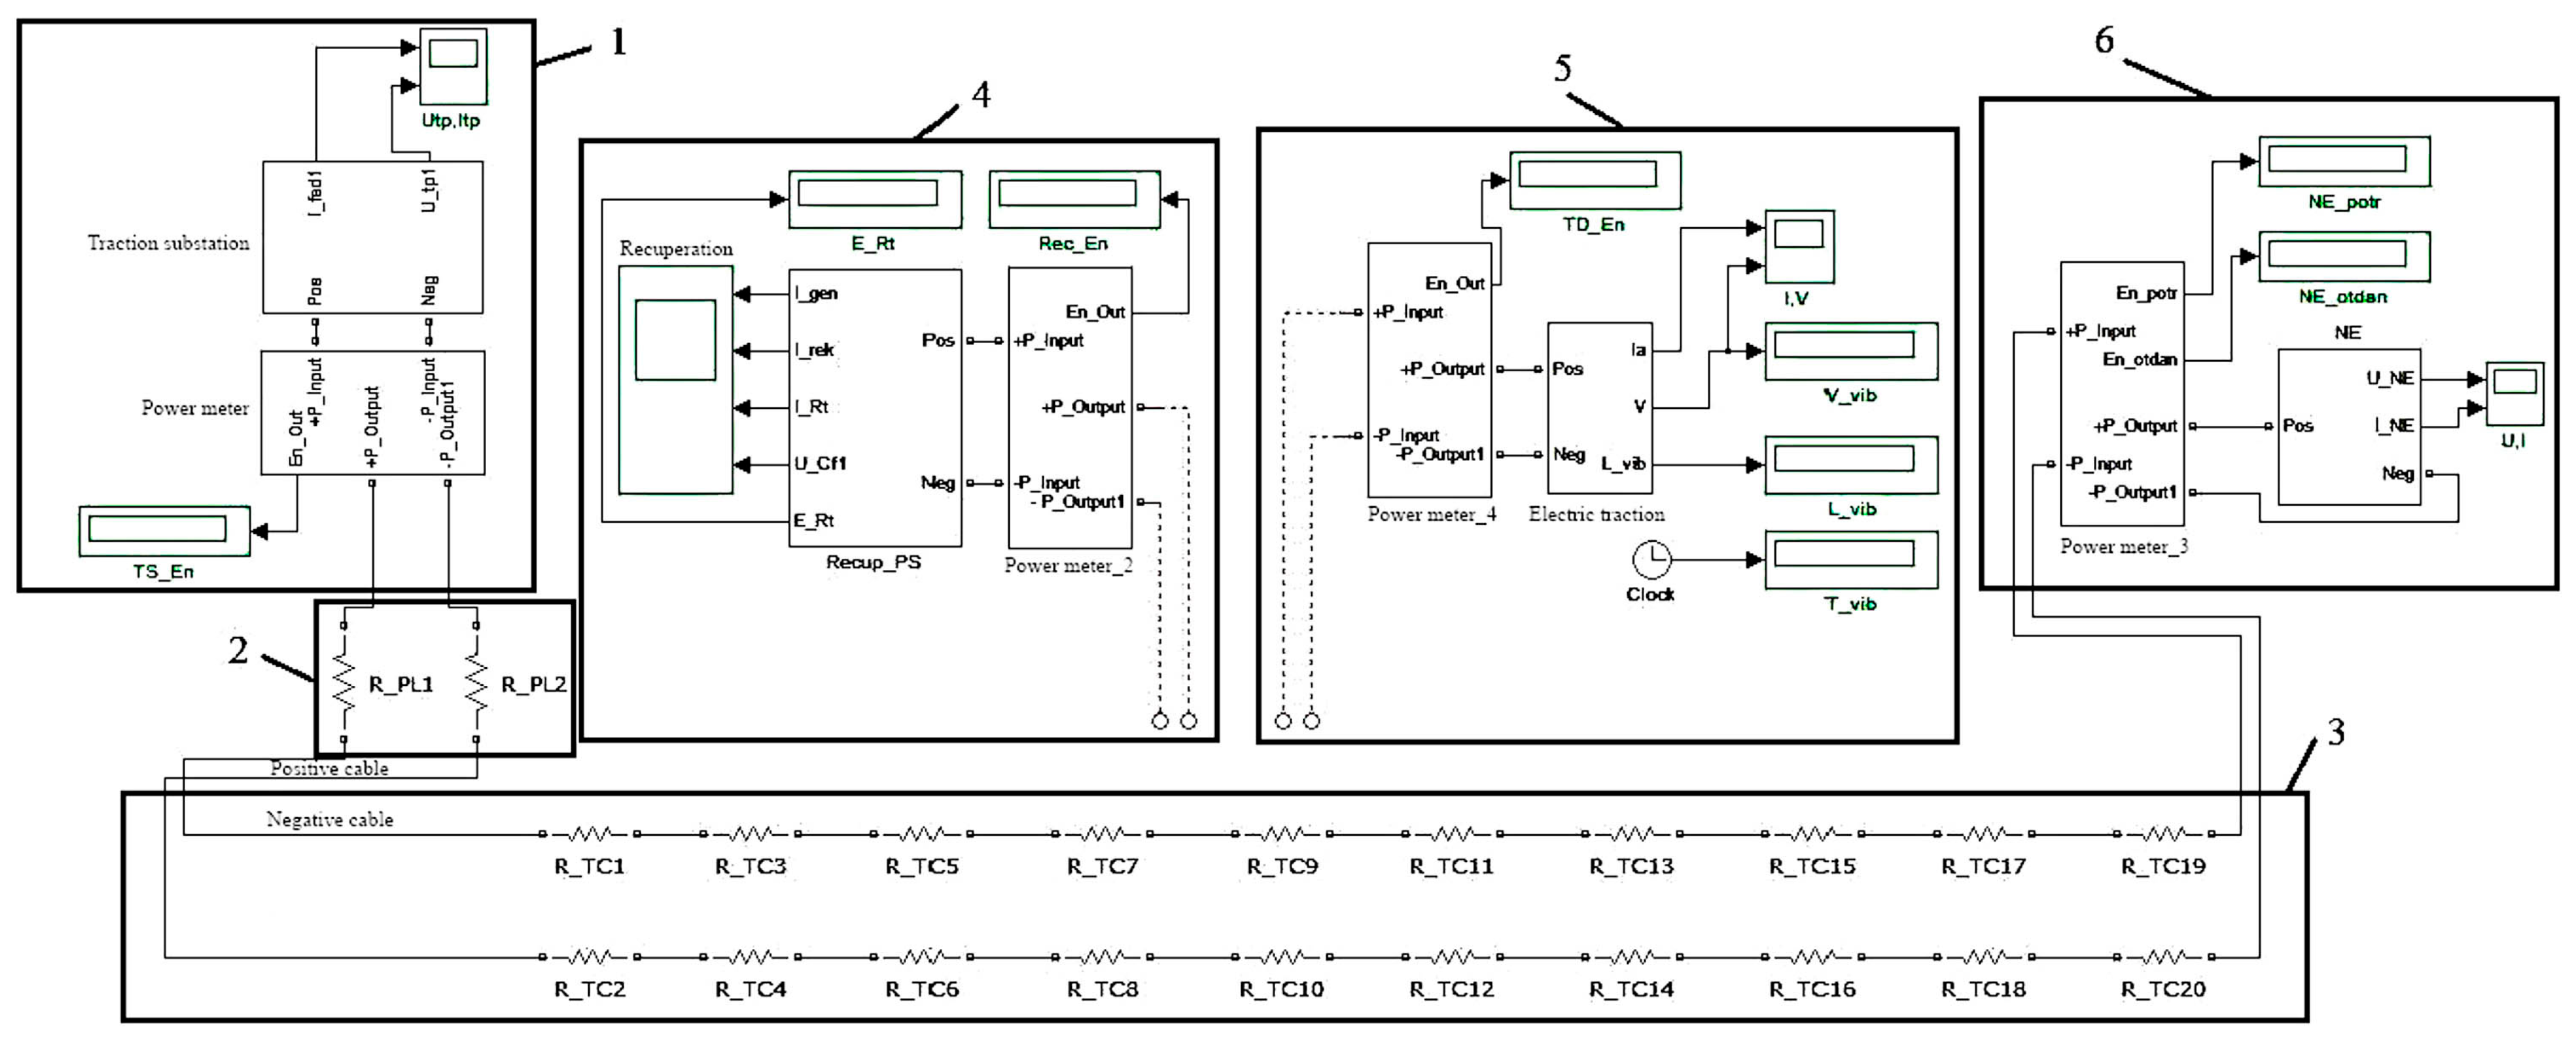
The studied energy storage cycling processes were modeled using the application program “MATLAB 8.12.0 (R2019b)”. A general view of the model is shown in
Figure 1.
The model has six main functional blocks: a traction substation (1); supply lines (2); a contact network (3); a train in a braking mode (4); a traction train (5); and energy storage (6). To study the traction and braking processes of the substation at different points of the contact network, the total resistance of each contact wire (equal to 0.305 Ohm) is divided into ten separate resistances with a nominal value of 0.0305 Ohm. The consumed and generated energy by each element of the model, measured in joules, is considered using “Power meter” blocks. Below is a detailed description of the most complex blocks of the simulation model for two options: when the trolleybus is in the braking mode and when the trolleybus is in the traction mode.
3.1. Description of the Trolleybus Simulation Model in the Braking Mode
At present, the principle of tracking regenerative-rheostat braking (SRRT) is widely used in pulse control systems when regulating the speed of vehicles. This principle consists of the continuous monitoring of the voltage of the traction network when braking the train.
If the voltage on the traction motor operating in the generator mode is higher than the voltage of the KC and the traction network is ready to receive the electricity generated by the trolleybus, the system provides a recuperation mode that continues until the traction network voltage reaches the limit value (715 V).
3.1.1. Explanation of the ESS Architecture and Rationale for Using a Supercapacitor
In this model, the energy storage device (ESS) is implemented as a supercapacitor connected in parallel to the overhead line via a controlled DC-DC converter. This solution is due to the requirements for high power and short response times when operating in the regenerative mode, as well as the need for multiple charge and discharge cycles without a significant reduction in service life.
Unlike batteries, supercapacitors are able to quickly receive pulses of regenerative energy generated during rolling stock braking and quickly release it during subsequent acceleration. This is especially important when moving along routes with frequent stops and short intervals between braking and starting phases.
In the power grid diagram (
Figure 2), the supercapacitor (Capacitor ESS) is placed in close proximity to the overhead line connection point, between the traction substation and rolling stock. This arrangement allows
Minimizing transmission losses;
Ensuring voltage stabilization in critical modes;
Relieving the traction substation at peak moments.
The supercapacitor and the main energy storage device, which can be a battery (Battery ESS), are connected through the energy distribution control controller. In this model, the battery is assumed to be located on-board rolling stock and does not participate in the operation of the network directly. In a more complex implementation, a cascade connection is possible: the supercapacitor receives peak energy, and then, if there is a reserve of time, transfers it to a slow but energy-intensive battery for storage.
It is necessary to highlight the energy flows in different operating modes:
Driving mode (traction). Energy comes from the contact network, partially compensated by the storage device (if the voltage in the network is below the threshold), while the supercapacitor can operate as a current source for a short time.
Regenerative braking. The electric motor operates in the generator mode; the energy is returned to the network. When the permissible mains voltage is exceeded, the supercapacitor charging switch is activated and the energy is sent to the ESS.
Idle (standstill). All channels are switched off; the ESS goes into storage mode. If a battery is available, some energy can be transferred to it.
Mains fluctuations/surges. The supercapacitor compensates for momentary voltage dips or peaks, increasing system stability and reducing the load on the converter.
This distribution of functions between the supercapacitor and the battery allows for an optimal balance between energy efficiency, speed, and component life.
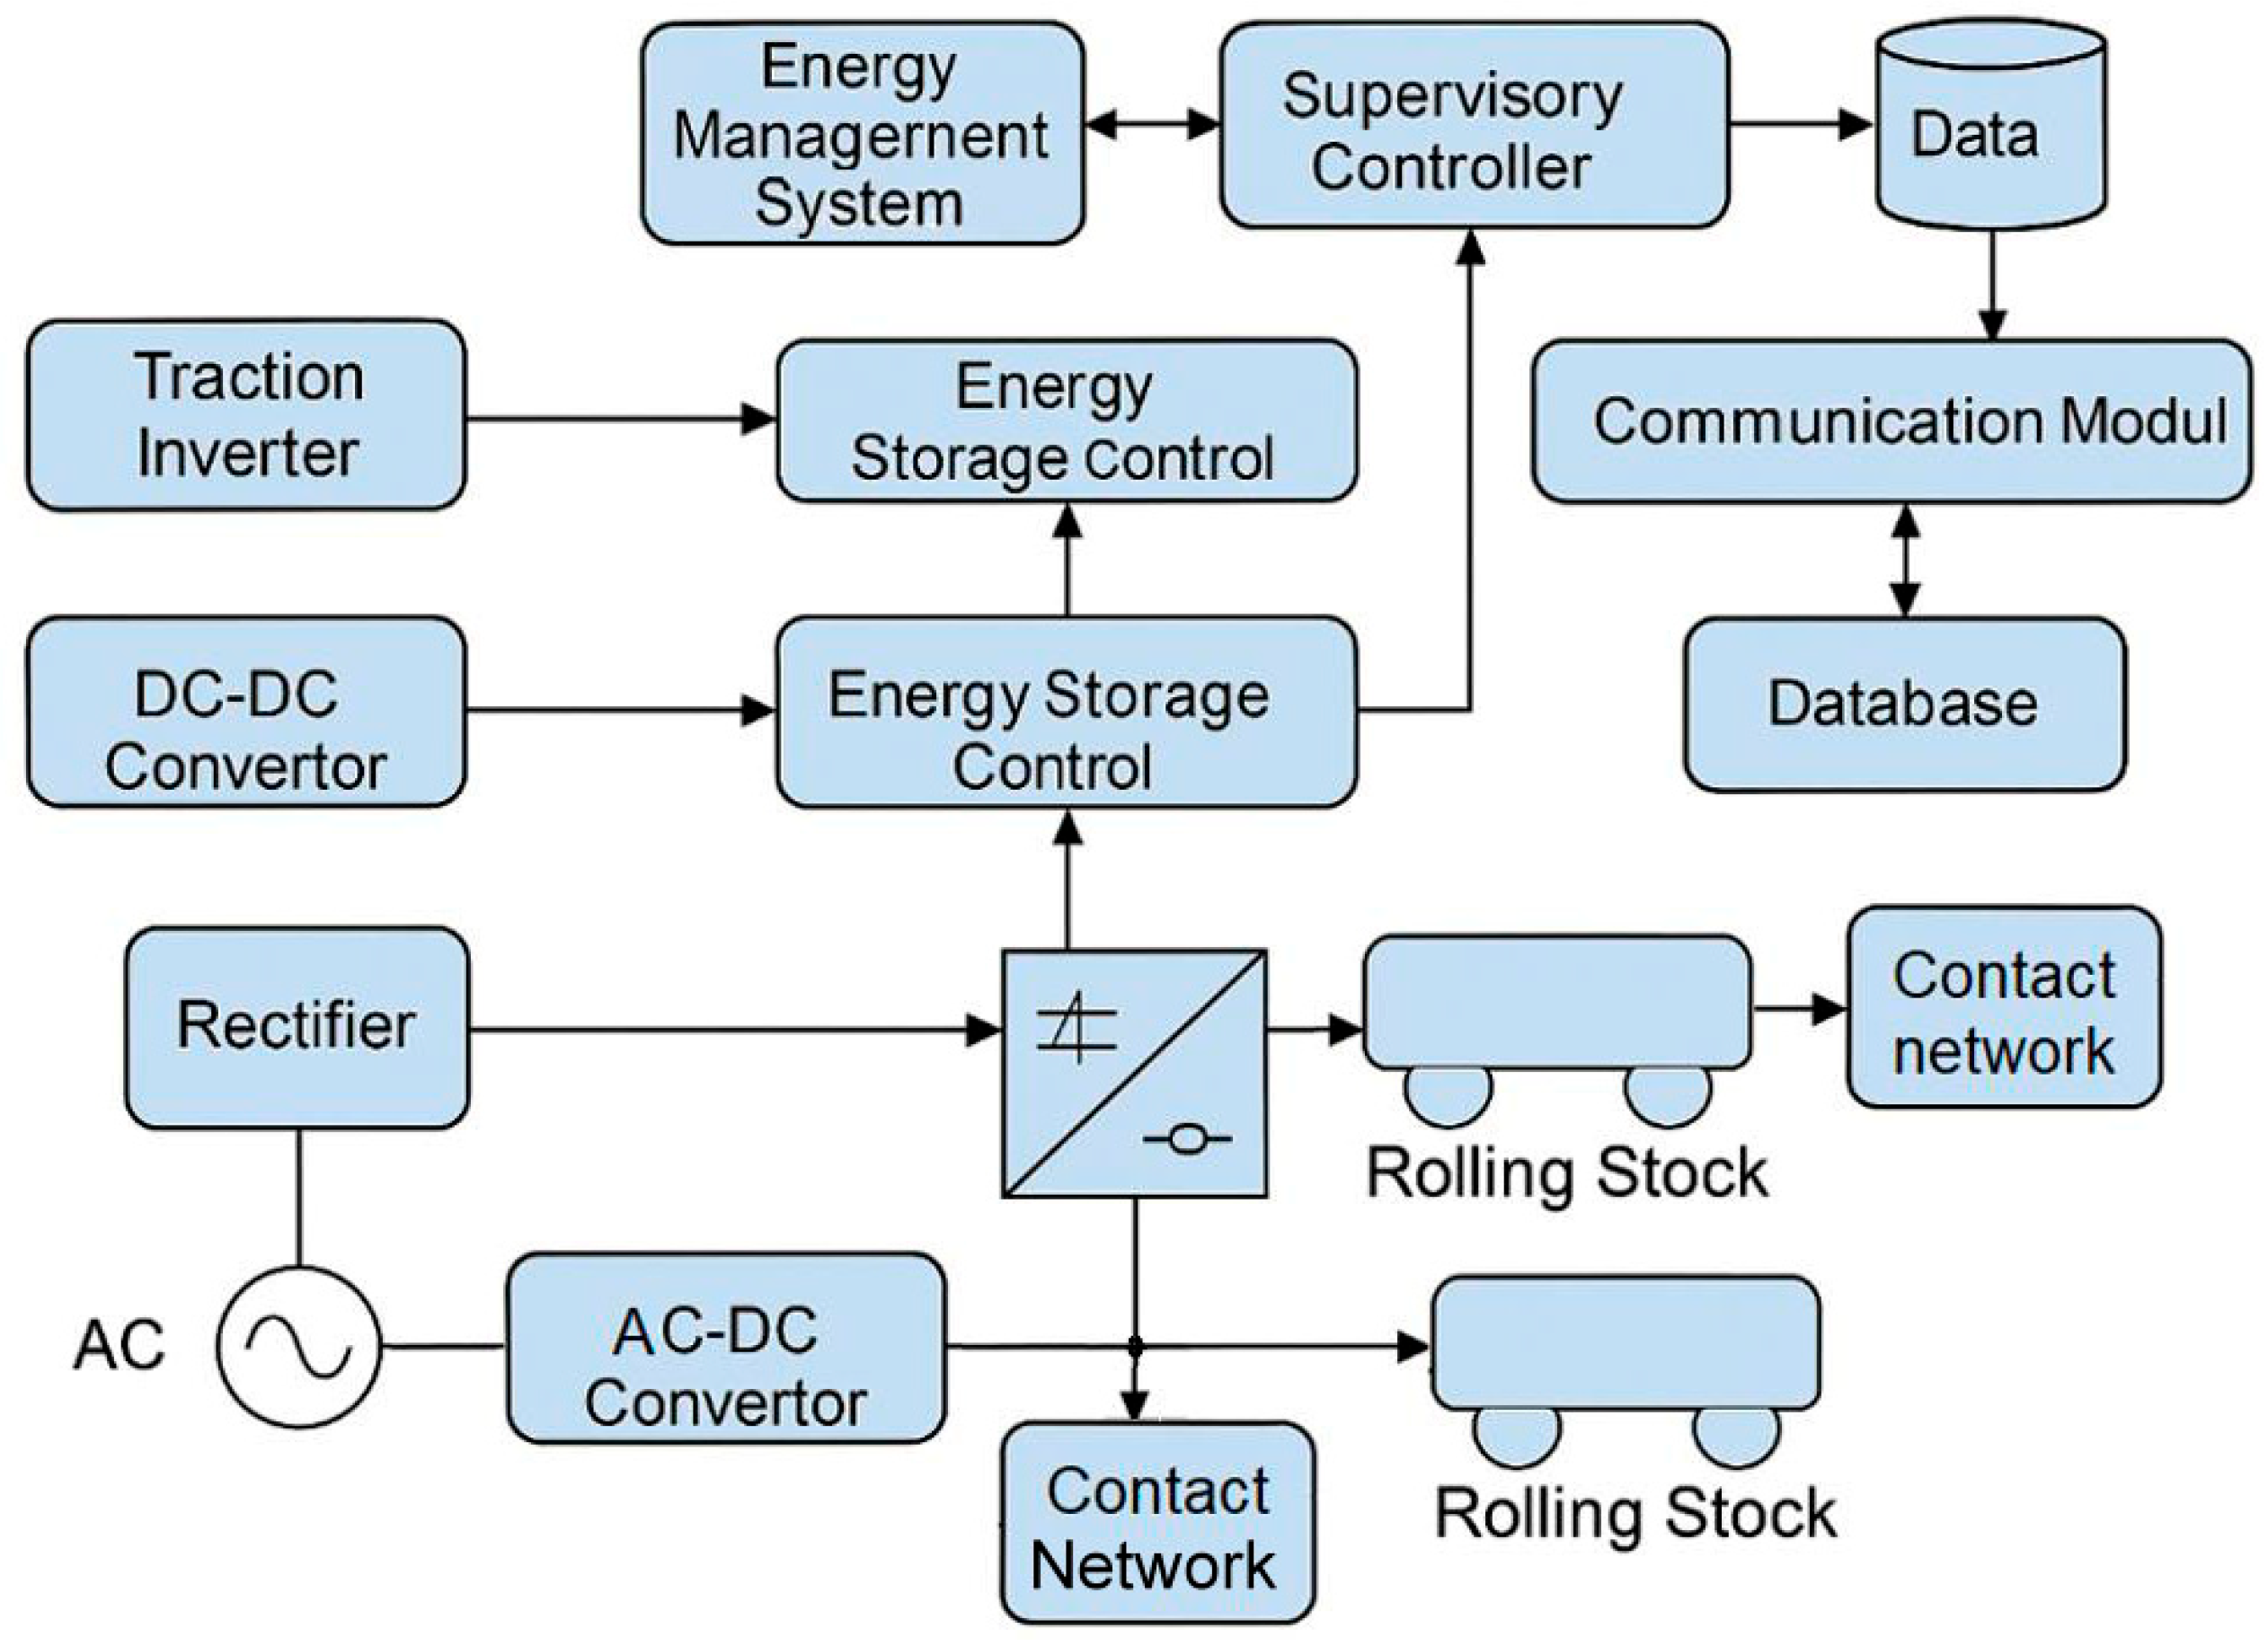
3.1.2. General Block Diagram of the Energy Control and Management System Used in the Modeling Framework
The general block diagram of the energy control and management system used in the modeling framework is shown in
Figure 3. It integrates the physical energy flow architecture with supervisory control systems, energy storage coordination, and communication infrastructure.
The architecture of the developed energy management system for urban electric transport is based on an integrated interaction of electrical conversion, energy storage, power distribution, and supervisory control components. The general structure of this network is illustrated in
Figure 3, which provides a complete representation of the physical and logical elements governing energy flow, storage, and control operations in the system.
The entire process begins with the input of alternating current (AC) from the external power supply network, typically delivered to the traction substation. The AC input is converted to direct current (DC) through a rectifier unit. This rectified voltage is further processed by a DC–DC converter, which adjusts the voltage level to match the requirements of the contact network and rolling stock.
The contact network acts as the primary medium for energy transmission to electric vehicles (rolling stock) and serves as a two-way interface between the energy storage unit and the traction power infrastructure. Energy is transmitted from the DC–DC converter into the contact network, where it can be consumed by moving electric vehicles or stored in the supercapacitor-based energy storage system (ESS).
The ESS is controlled by a dedicated energy storage control module, which is responsible for managing the charging and discharging cycles of the storage unit. This module receives signals from sensors monitoring voltage levels, regenerative braking status, and vehicle proximity, allowing dynamic control of the bidirectional current flow. When regenerative braking occurs, the energy from the rolling stock’s traction motors is sent back to the contact network and, depending on voltage thresholds, either dissipated in braking resistors or routed to the ESS.
For real-time optimization of the energy flow, the system includes a traction inverter and a second-stage DC–DC converter, which regulates the energy exchange between the ESS and the contact network. The inverter allows adaptive current modulation based on the load profile, braking events, or energy demand from rolling stock.
A supervisory controller operates at a higher hierarchical level. It continuously monitors all subsystems, collecting data from energy flow meters, voltage sensors, and capacitive state indicators. The controller adjusts control setpoints and issues commands for storage regulators and traction converters to maximize energy recovery and to minimize losses. This is coordinated through an energy management system (EMS), which hosts the operational logic, recovery strategies, and optimization algorithms.
The EMS is linked with a communication module and a central database. The communication module ensures data exchange between the supervisory system and distributed controllers or external diagnostic systems. The database stores historical energy usage patterns, charge-discharge profiles, and operational efficiency metrics. This infrastructure supports not only online decision-making, but also predictive maintenance, fault detection, and strategic planning for future expansion of energy storage capacity.
In summary, the proposed control architecture provides a comprehensive, scalable, and modular framework for the intelligent energy redistribution in electrified transport systems. It ensures optimal usage of regenerative braking energy, reduces peak load on traction substations, and enhances the overall energy efficiency and sustainability of the transport infrastructure. The inclusion of bidirectional control, supervisory management, and communication layers enables an adaptive response to real-time network conditions, thereby making the system robust and adaptable to a wide range of operating scenarios.
When the threshold value in the network is reached, the train’s braking system will automatically replace the recuperation mode with a rheostat braking mode, which, in turn, will continue until the voltage in the contact system drops below the limit level again, after which the train braking system will automatically return to the recuperation mode.
The schematic diagram of the SRRT is shown in
Figure 4.
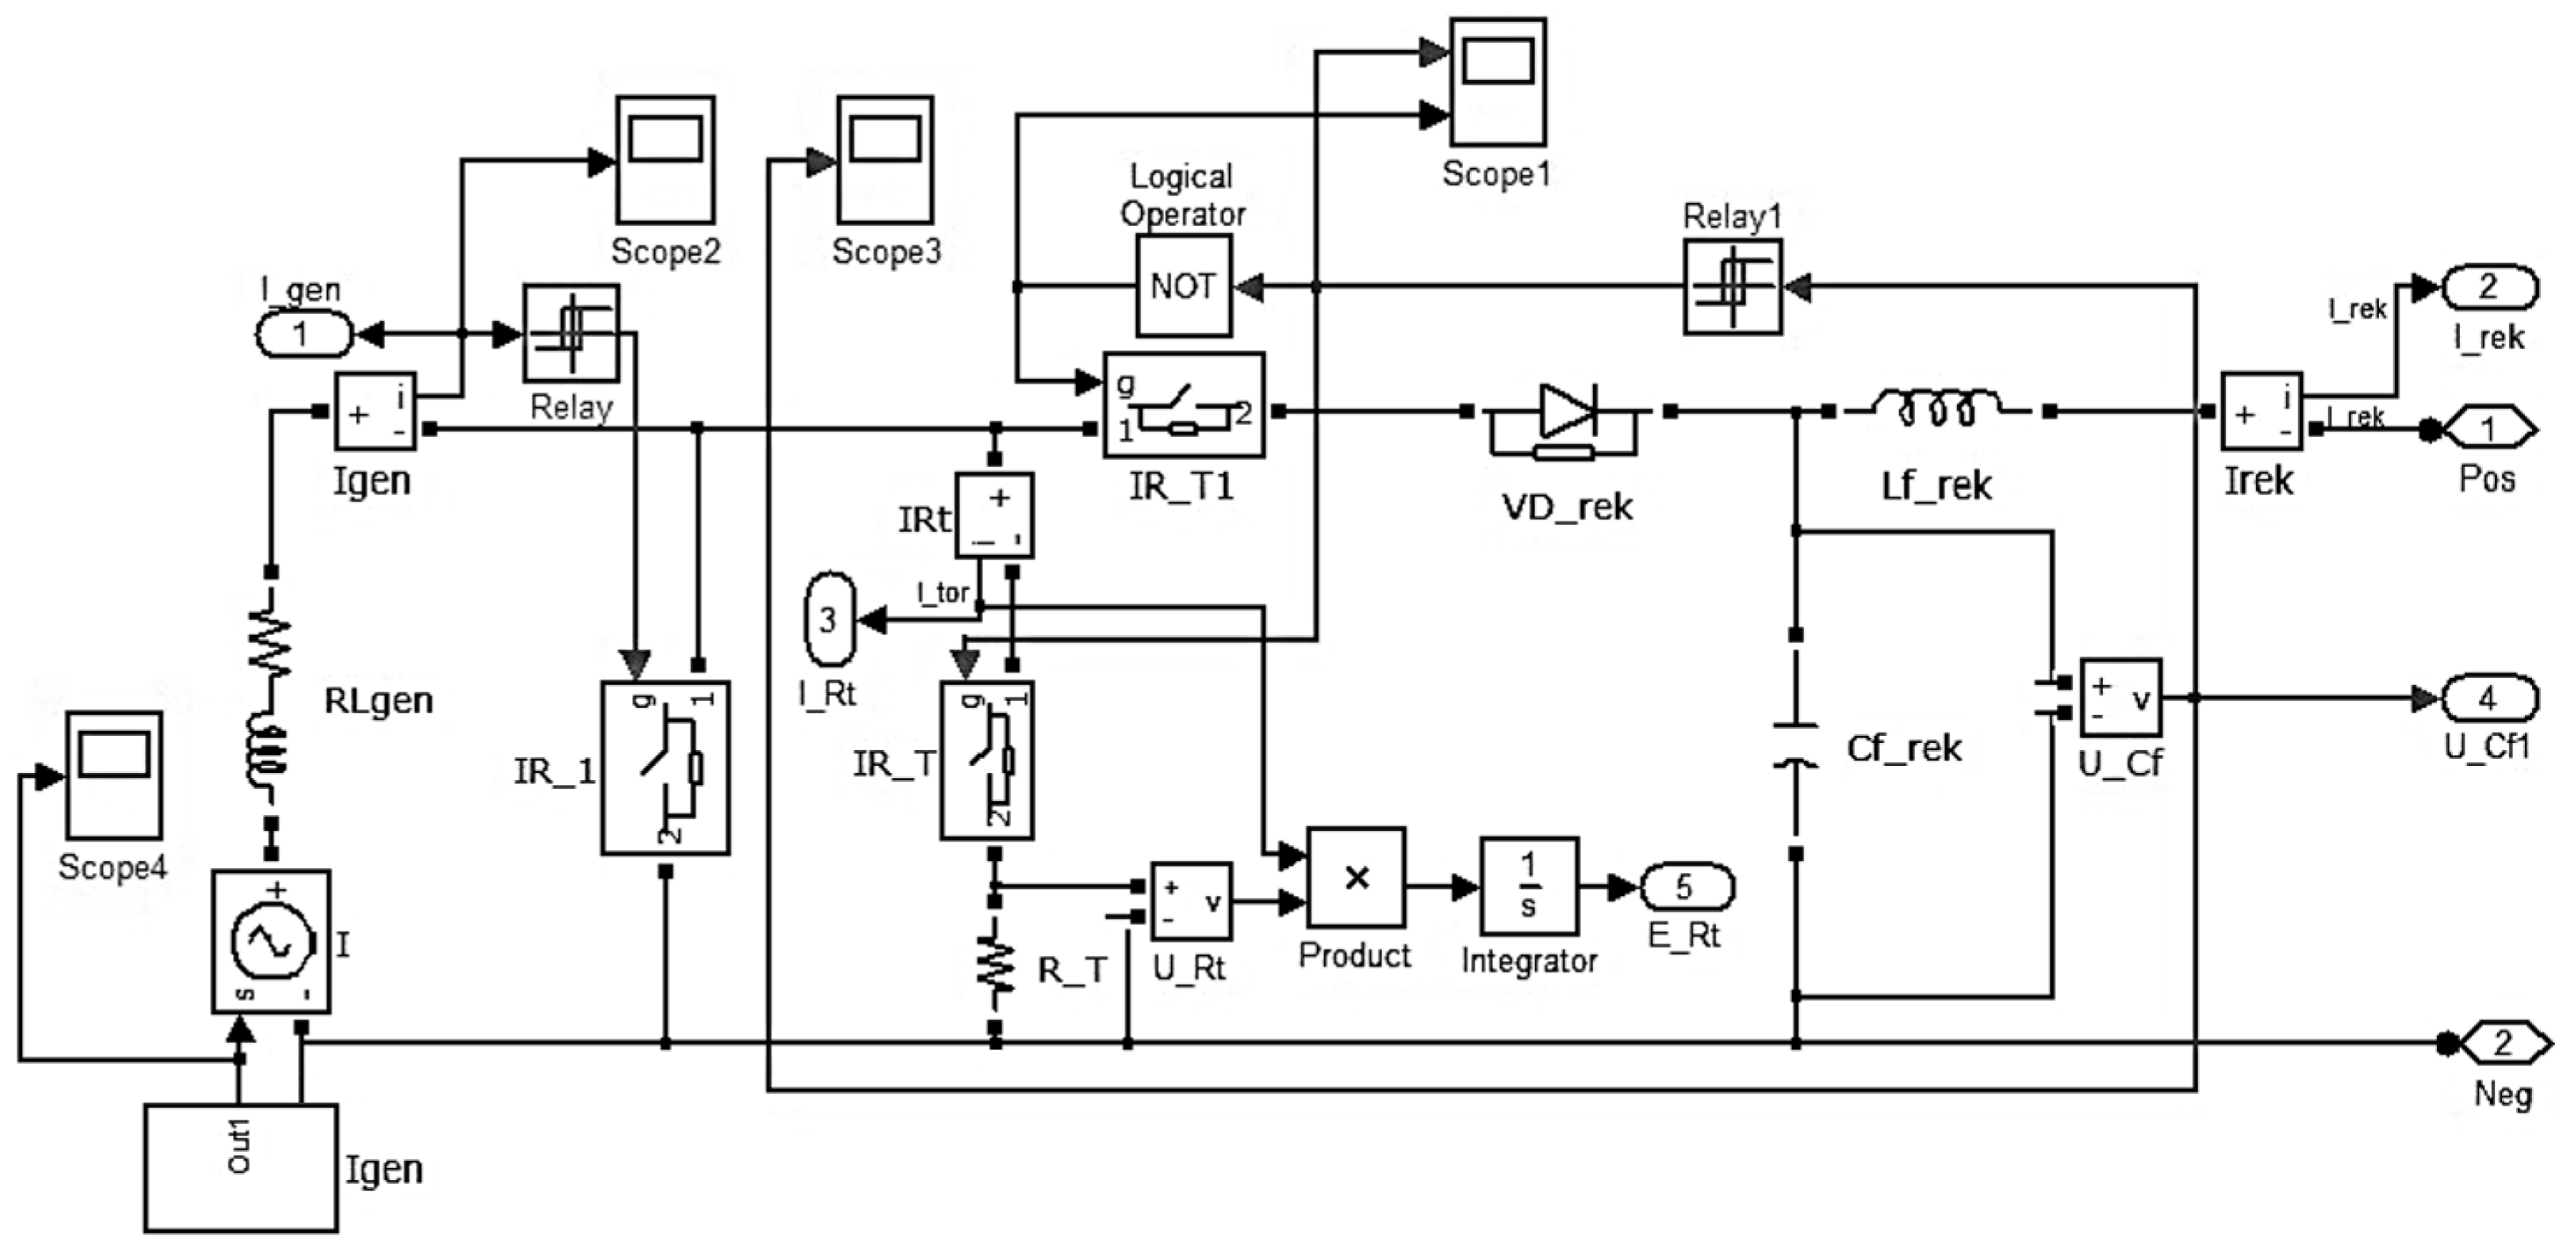
The electrical diagram of the SRRT, which is the basis of the Recup_PS unit, is shown in
Figure 5.
The braking current value is maintained by the IR_1 regulator, which operates in the key mode, based on signals coming from the relay element “Relay”, which in turn determines the boundaries of the brake current ripple. The voltage on the capacitor of the Cf_rek filter is regulated using the relay element “Relay1”.
The scheme works as follows. If the voltage on the capacitor of the smoothing filter “Cf_rek” becomes greater than or equal to the maximum permissible value (715 V), then the “IR_T1” regulator closes and the brake resistance regulator “IR_T” opens at the same time, thereby the electric braking energy begins to dissipate on the brake resistance “R_T”. If a consumer appears in the network, the voltage on the filter capacitor “Cf_rek” decreases below the minimum set (690 V), the relay element “Relay1” gives a signal to open the regulator “IR_T1” and close the “IR_T”, which allows for the continuation of the process of regenerative braking.
3.2. Description of the Mathematical Model of the Traction Drive with an Energy Storage Device
With the pulse method of regulation, the supply voltage is fed to the traction electric drive, including the motor (TED), not constantly, but in separate pulses. In order to implement the intermittent mode of the voltage supplied to the motor, it is necessary to turn on a breaker between the motor and the mains, which is an electronic key.
Mathematical Formulation:
The following equations define the mathematical model of the system:
where
J is the moment of inertia,
ωm is the motor speed,
Tm is the motor torque,
Tload is the resistive load torque,
Ua is the armature voltage,
Ia is the armature current,
Ra is armature resistance,
Ea is the back-EMF,
ke,
kt are motor constants,
C is the supercapacitor capacitance,
Ues is voltage on the capacitor,
Ies is the capacitor current,
ωt is the instantaneous angular velocity of the traction motor, and
Ees is the energy of the capacitor.
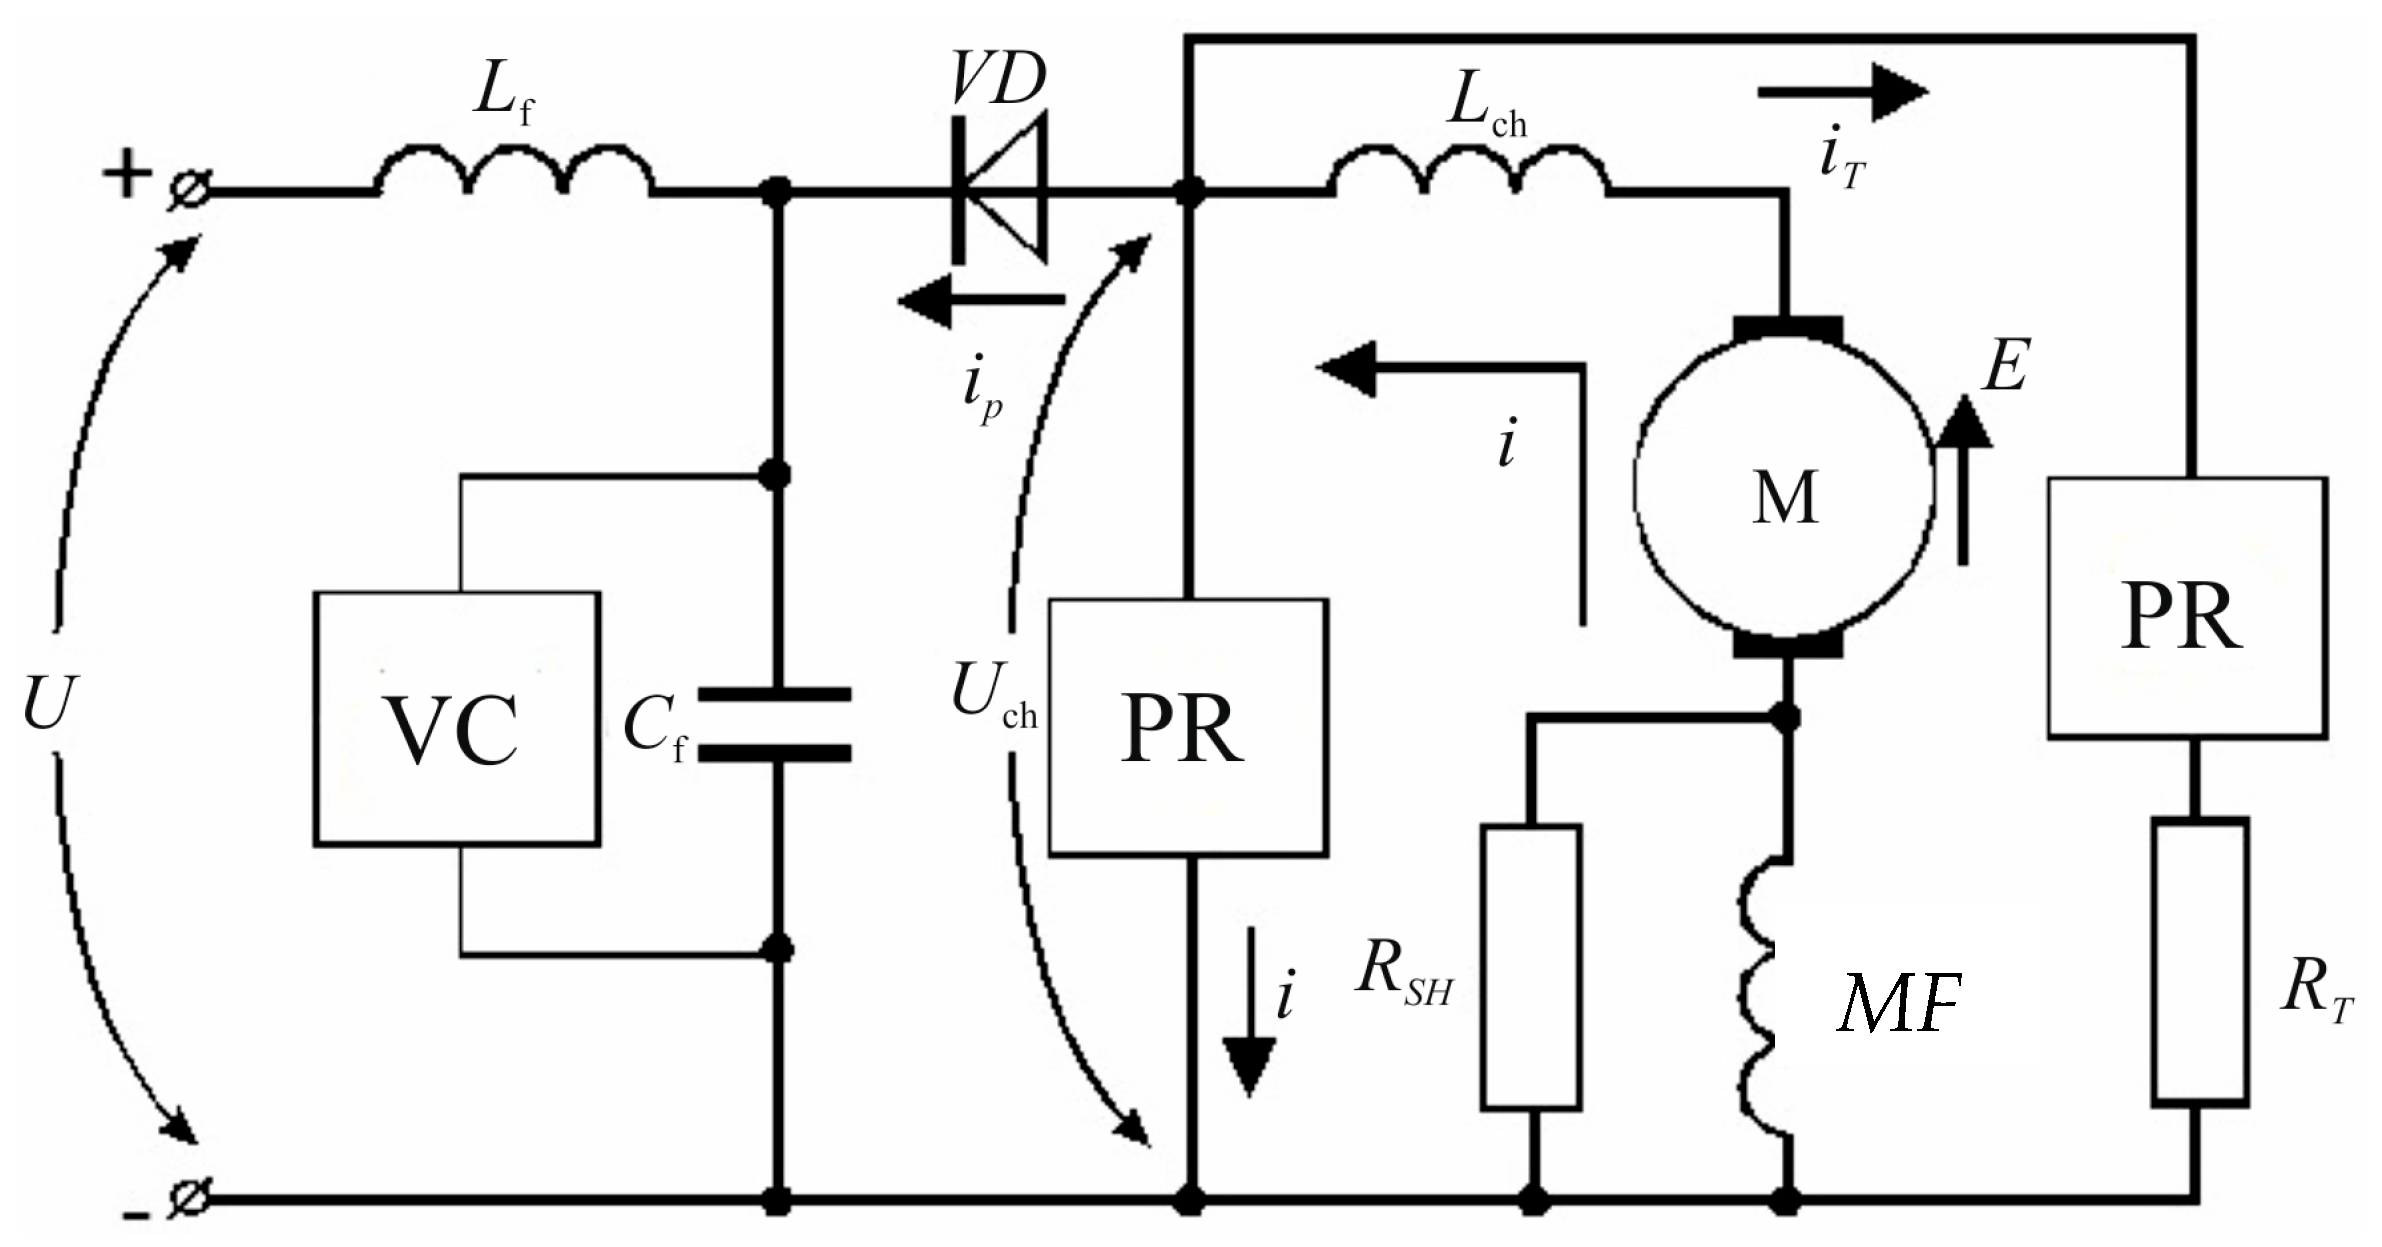
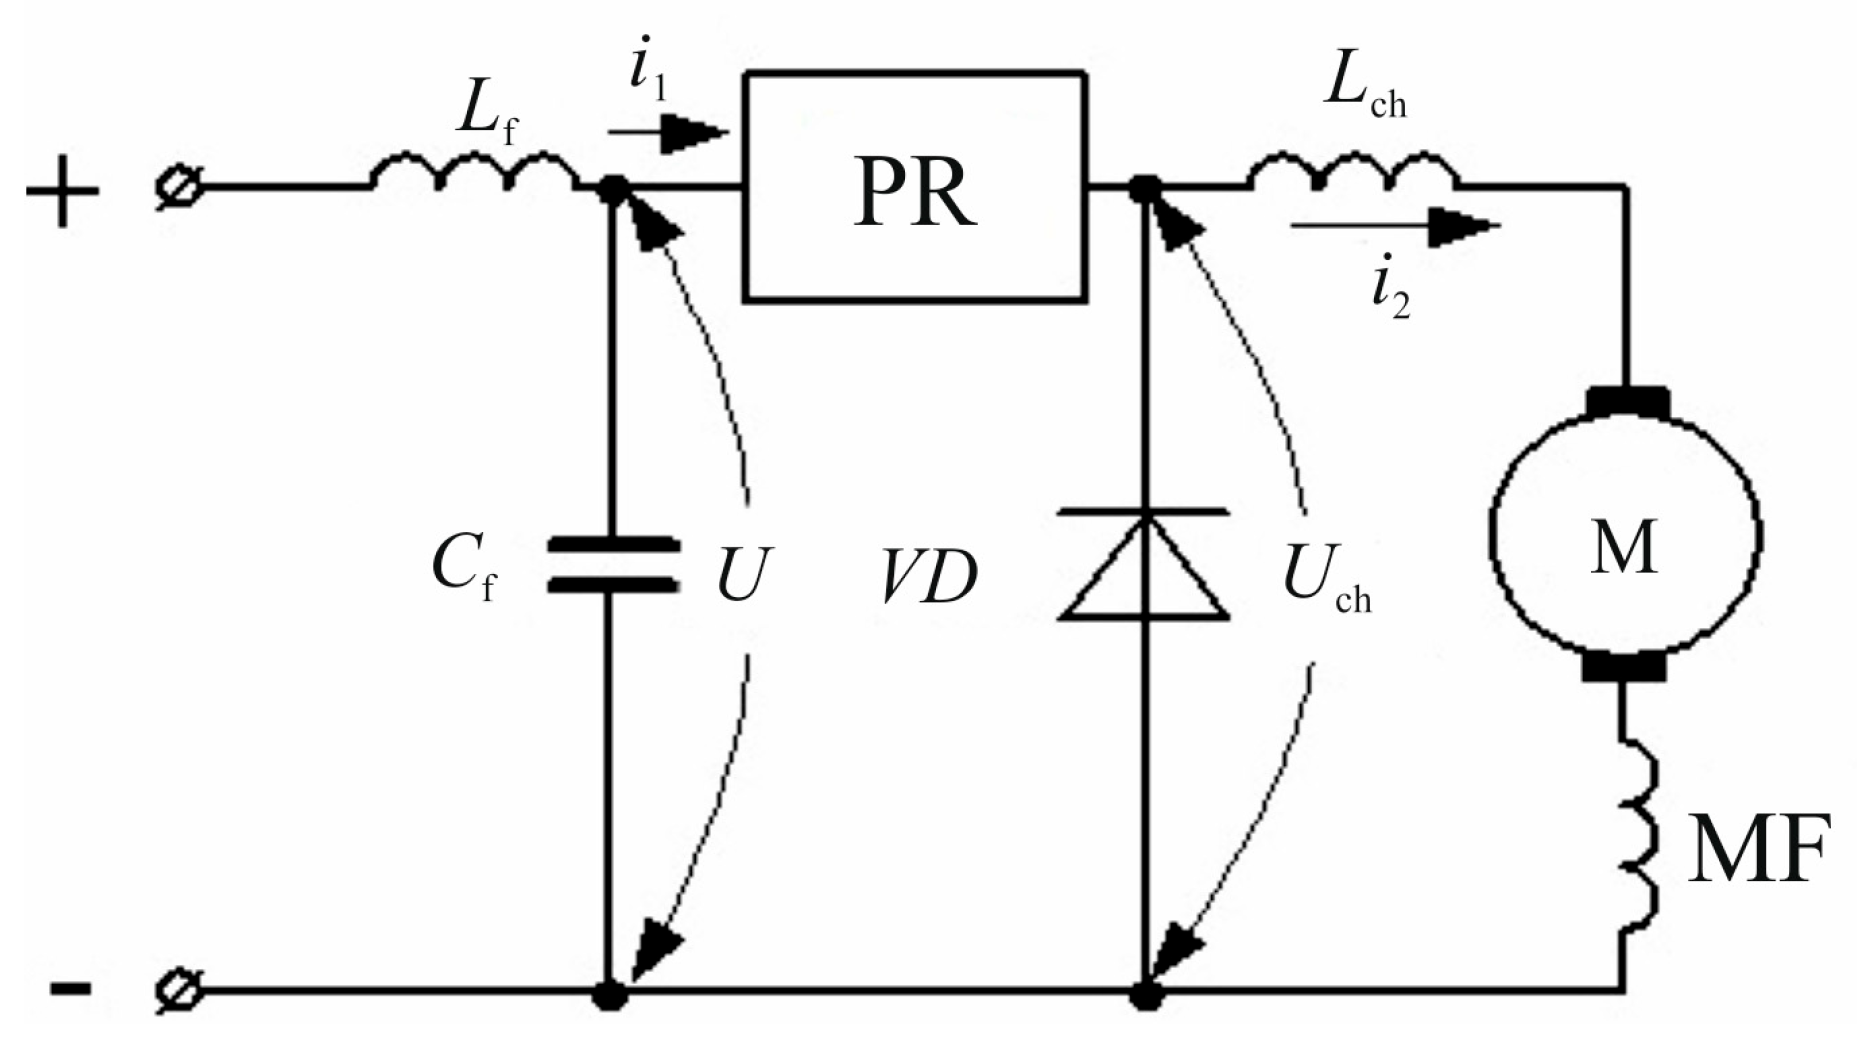
Figure 6 shows a simplified circuit diagram of impulse control. The circuit includes
LF,
SF (an input L-shaped inductive-capacitive filter, which serves to smooth out current and voltage ripples in the supply network). PR is the pulse voltage interrupter;
Lch is an inductive choke designed to smooth out the current in the TED circuit.
VD is a check valve that closes the TED circuit when the circuit is switched off (the electromagnetic energy accumulated in the inductors of the TED
MF and the throttle
Lch during the conductive state of the breaker is closed in this circuit).
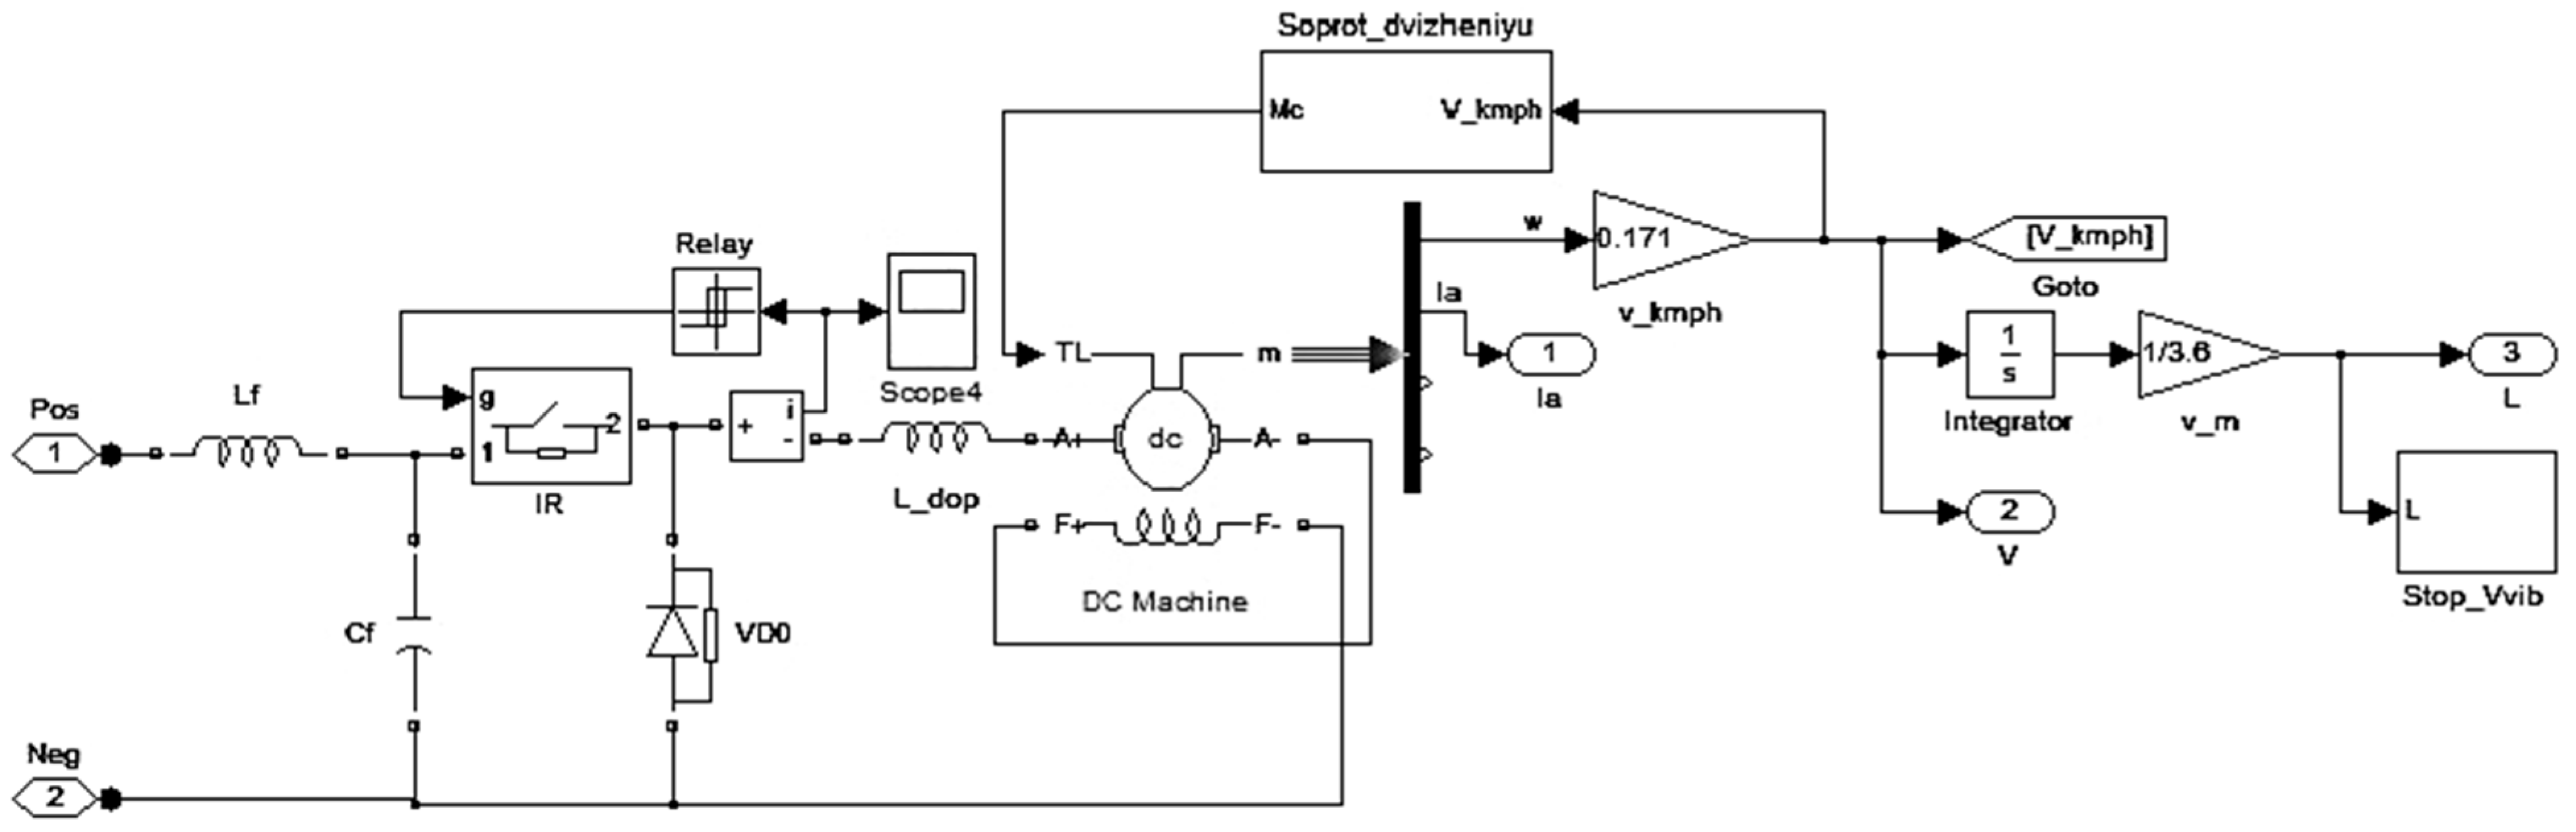
The pulse control system is the basis of the simulation model of traction rolling stock. As a model of the traction motor, the DC Machine unit built into MATLAB 8.12.0 (R2019b) is used. The model of the traction substation is shown in
Figure 7.
The DC machine with sequential winding [
44] is powered by the “IR” pulse regulator. The range of inrush current ripples is maintained using the “Relay1” relay unit. The resistivity to the movement of rolling stock driven to the engine shaft is calculated using the “Soprot_dvizheniyu” unit. The traction mode is calculated until the rolling stock reaches the run-down speed. The calculation is stopped using the “Stop_Vvib” block.
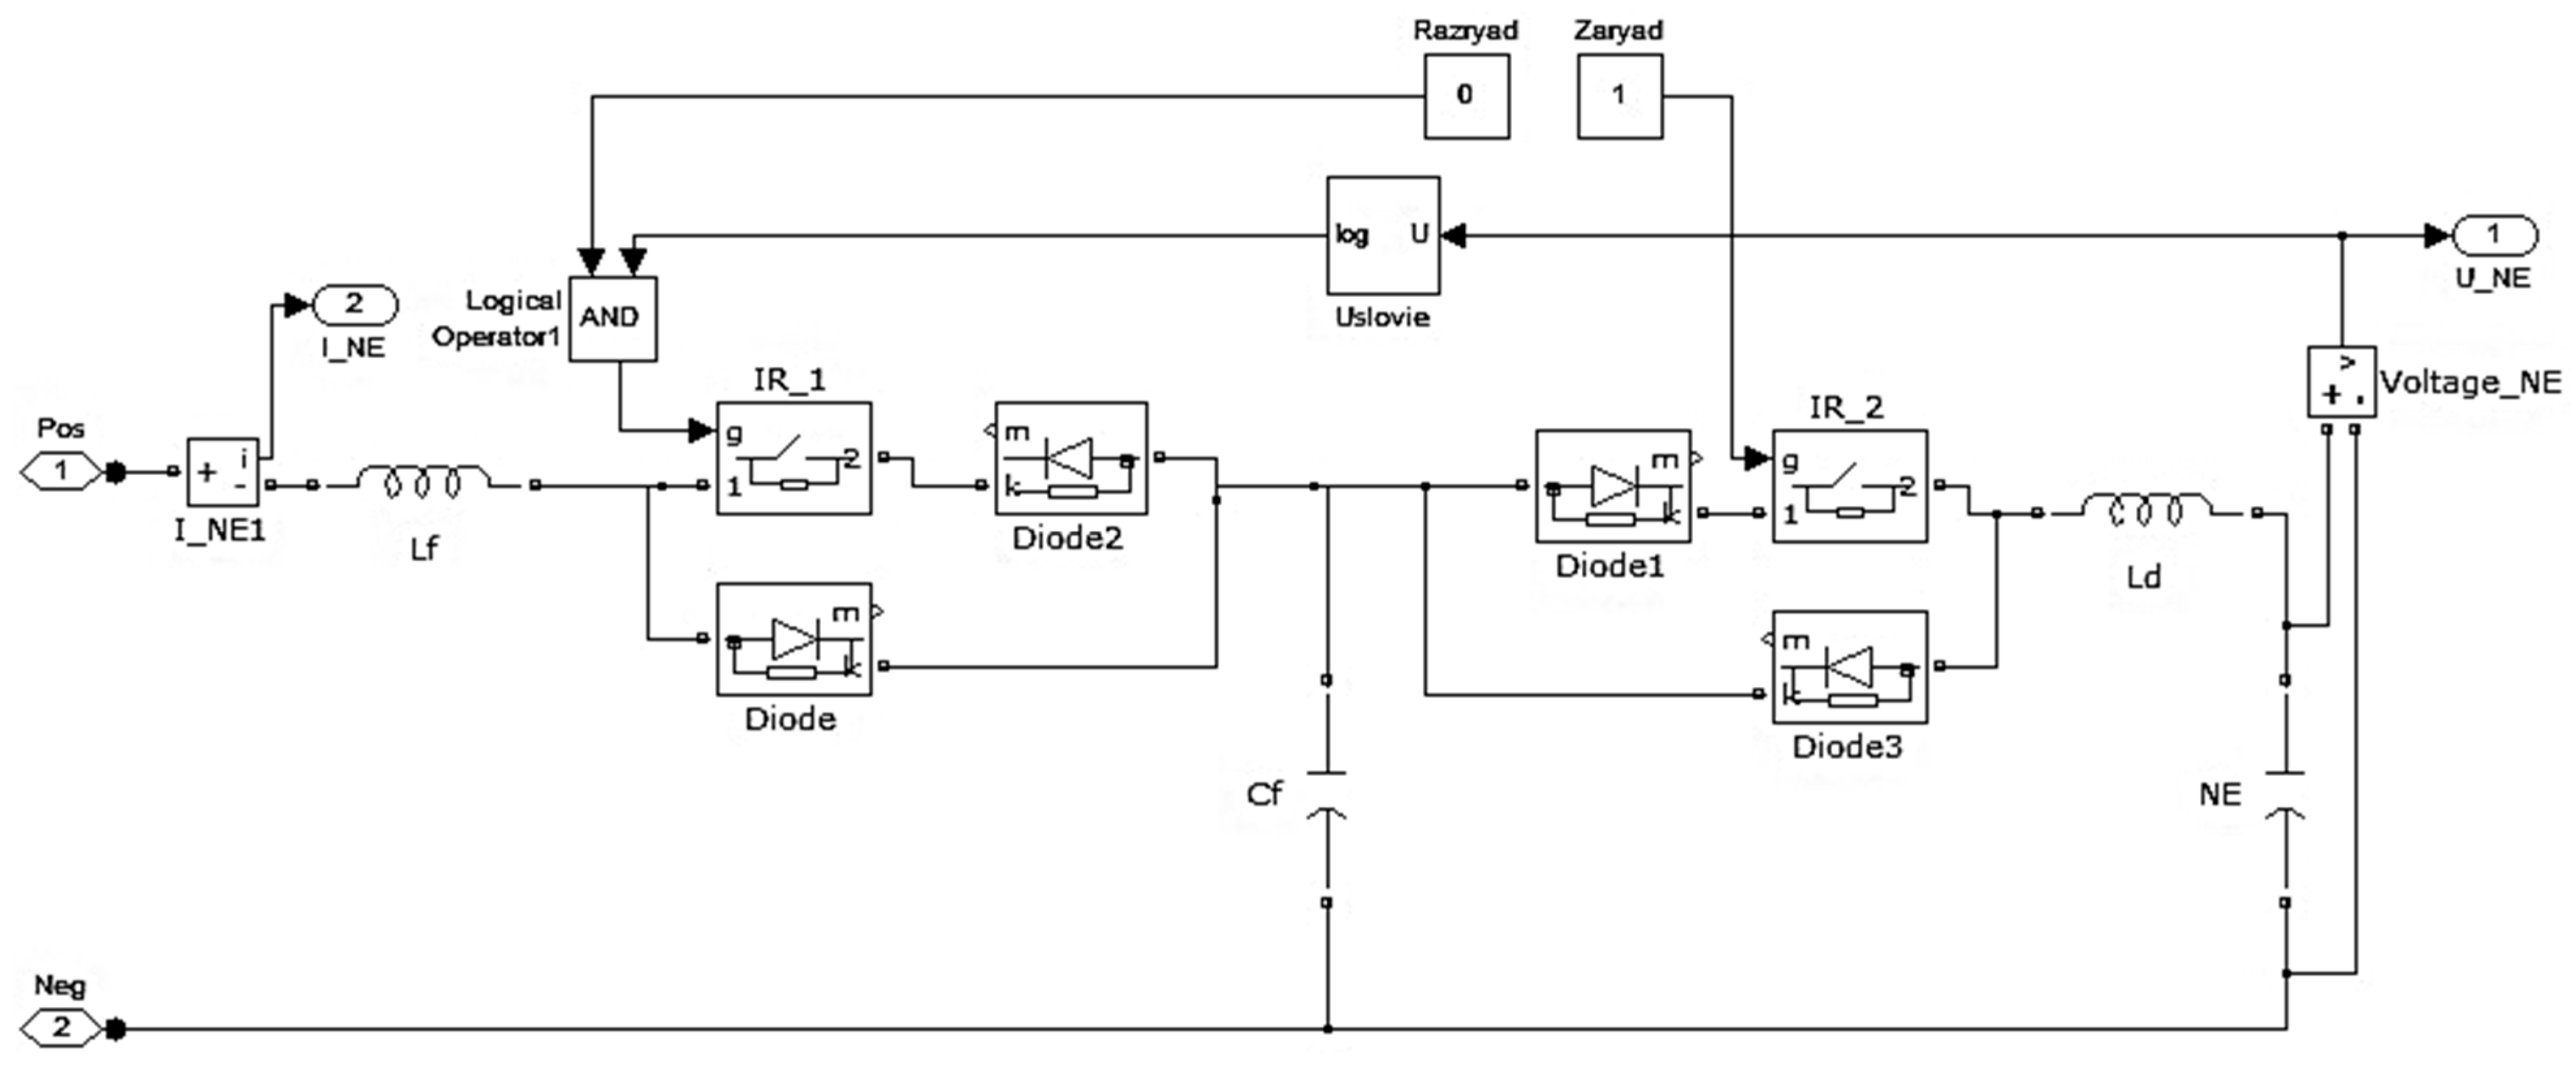
3.3. Energy Storage Model
The energy storage control scheme is shown in
Figure 8. The mode of operation of the energy storage device (discharge or charge of “ES” capacitance) is selected by sending control signals (“Charge” and “Discharge”) to the “IR_1” and “IR_2” pulse regulators, respectively. The reverse diode “Diode3” prevents current from flowing from the capacitor of the filter “Cf” to the “ES” storage until the “Charge” control constant is set to “1”. Similarly, the reverse diode “Diode” prevents current from flowing from the energy storage device to the traction network [
45]. The model was extended to consider energy efficiency losses in power electronics and internal resistance, with
ηcharge = 0.95 and
ηdischarge = 0.92 applied to all charge/discharge cycles.
The Effect of Transient Processes on the Efficiency of Energy Recovery
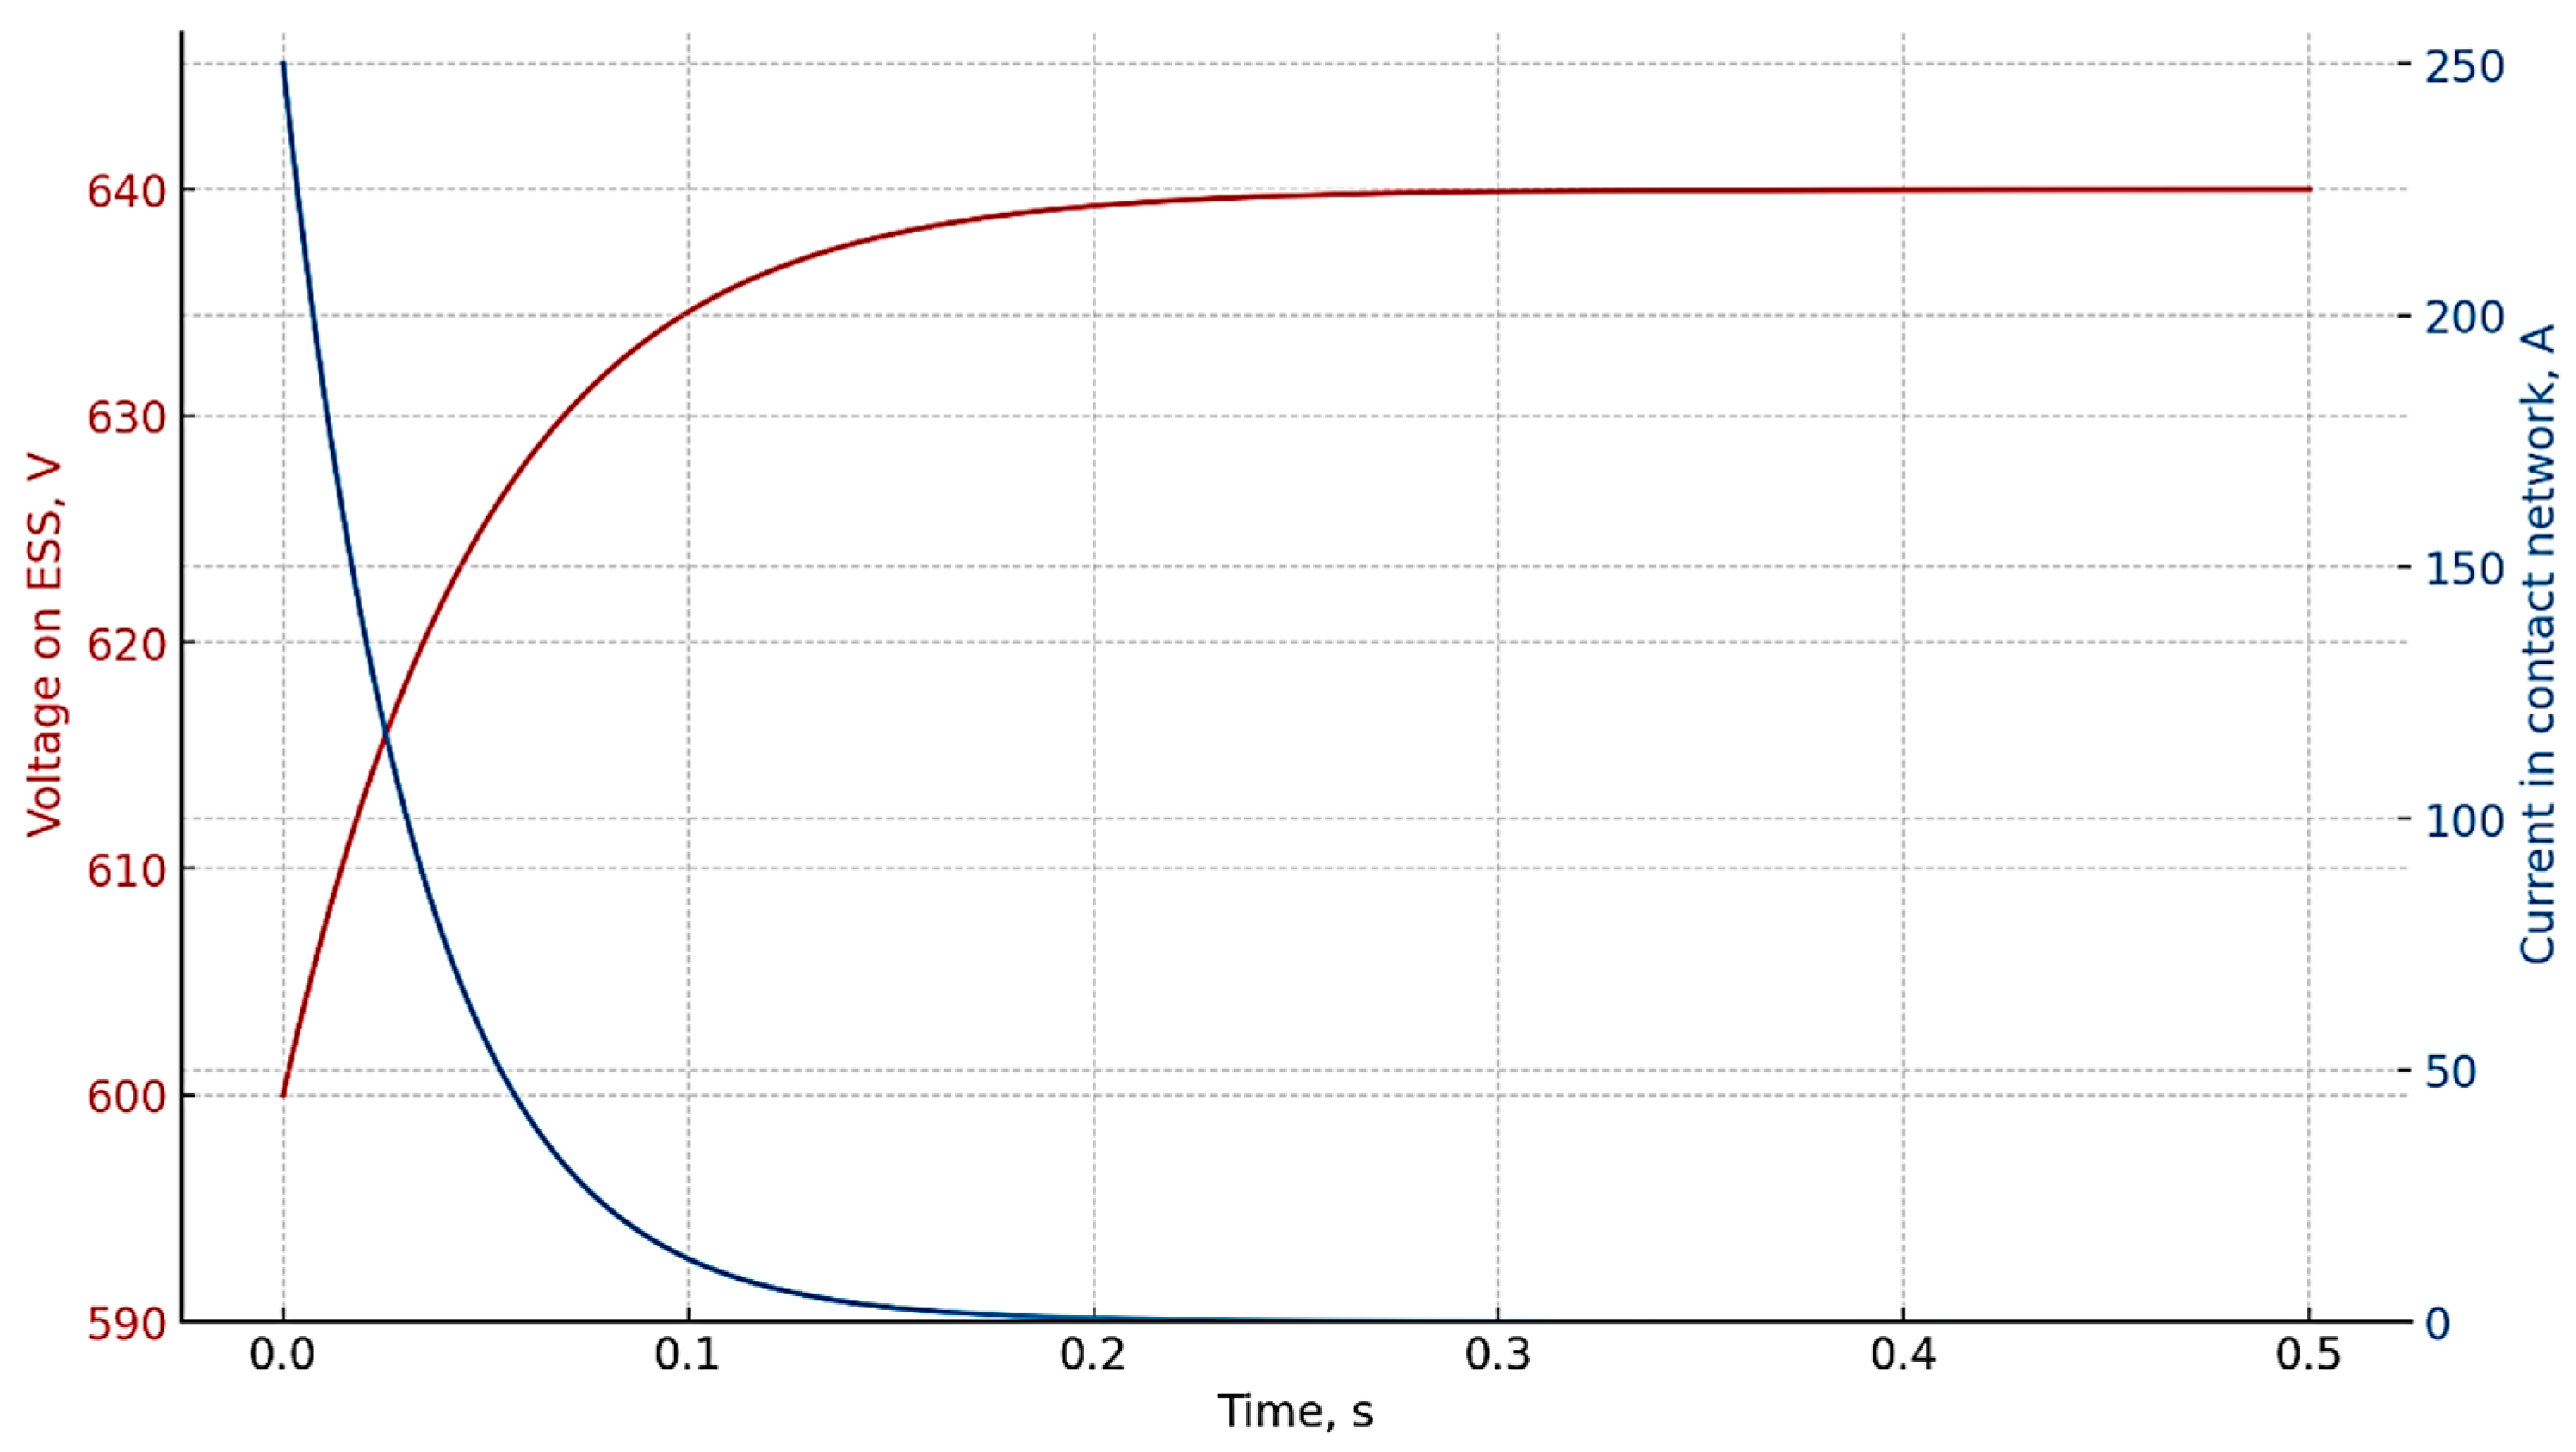
The critical factors affecting the efficiency of recovery systems are transient processes that occur at the start and end of braking. Transient processes include a sharp change in the voltage on the storage device, current surges in the contact network, changes in the resistance of power circuits, as well as delays in switching power keys in the converters.
The modeling process took into account the inertia of the storage device and the presence of internal limitations on the rate of increase in voltage and current. In particular, when braking rolling stock with an initial speed of 40 km/h, at the moment the recovery mode is switched on, a short-term excess of the voltage threshold in the contact network (up to 640–645 V) is observed, which is modeled by the activation of the key for charging the storage device. This process is accompanied by a peak charging current, which is limited in the model by the parameters of the DC–DC converter (the maximum charging current is 250 A).
The time characteristics of the response of the storage device and the contact network are shown in
Figure 9. It shows that the duration of the transient process is about 0.2–0.4 s, after which the stable charging mode occurs. Despite this, up to 8–10% of the recovered energy can be lost due to the mismatch of the switching phases and the time “window” between braking and the start of effective charging of the storage device. This effect is especially noticeable during short-term braking along small sections of the track, where a full charge is impossible. In view of this, transient processes significantly affect the efficiency of using regenerative energy, and their correct modeling allows taking into account real losses and designing storage device control algorithms more accurately.
3.4. Calculating the Parameters of Additional Model Elements
Below is the calculation of the storage capacity
Areg. The operating voltage of the storage device is in the range from
Umin = 550 V, which is the calculated voltage value on the current collectors of the electric power supply system, to
Umax = 715 V, which is the maximum voltage in the traction network of a tram and trolleybus according to IEC 60038:1983 (6th ed.) [
32,
46]. Taking into account that the amount of energy received in the electric braking mode is equal to the energy difference of the charged capacitor and to the level of the maximum and minimum voltages [
47], the following equality is just:
where
Wmax is the energy of the storage device at maximum voltage (in the model: 715 V),
Wmin is the energy of the storage device at minimum voltage (in the model: 550 V). If the amount of energy obtained as a result of the simultaneous electric braking of two substations [
48] is equal to
Areg = 1.437·10
6 J, then the storage capacity is
Then, we determine the resistance of the contact network and supply lines [
49]. The design model adopts a contact network with a section length of 1.5 km, made with MF-100 contact wire. According to the technical characteristics of the MF-100 contact wire [
50], its linear electrical resistance
rc to direct current at an ambient temperature of 20 °C is no more than 0.177 Ohm/km.
The resistance of the supply lines is assumed to be 0.1 Ohm according to
Table 1.
After setting up the model, the discrepancy between the calculated and the obtained ones during the simulation indicators of movement (traction and braking) was analyzed. The results of the calculations are presented in
Table 1.
3.5. Extended Verification of the Model
To increase the reliability of the results and confirm the adequacy of the model, the simulation results were compared with analytical calculations based on classical formulas of electromechanical processes. In particular, to assess the accuracy of the simulation of the process of charging the storage device, the following expression was used:
where
is the energy accumulated on the storage device, J;
is the storage capacity, F;
is initial voltage on the storage device, V;
is end-point voltage on the storage device.
Calculations were performed for each value of the distance from the substation to braking rolling stock, and the calculated values were compared with the simulation data. The results are given in
Table 2, where
Esim is the value of the energy accumulated in the storage device obtained as a result of the simulation;
Ecalc is the calculated value of the energy accumulated in the storage device.
The energy values calculated analytically showed good agreement with the simulation results: the average relative error was less than 0.5%. This confirms the correctness of the model in terms of assessing the processes of charging the accumulator.
The discharge processes were checked in a similar manner: the energy received by rolling stock from the accumulator was compared with the expected values determined by the energy balance formulas. Energy losses due to braking resistance were also analyzed. All deviations did not exceed 5%, which confirms the high accuracy of the model.
5. Discussion of the Results
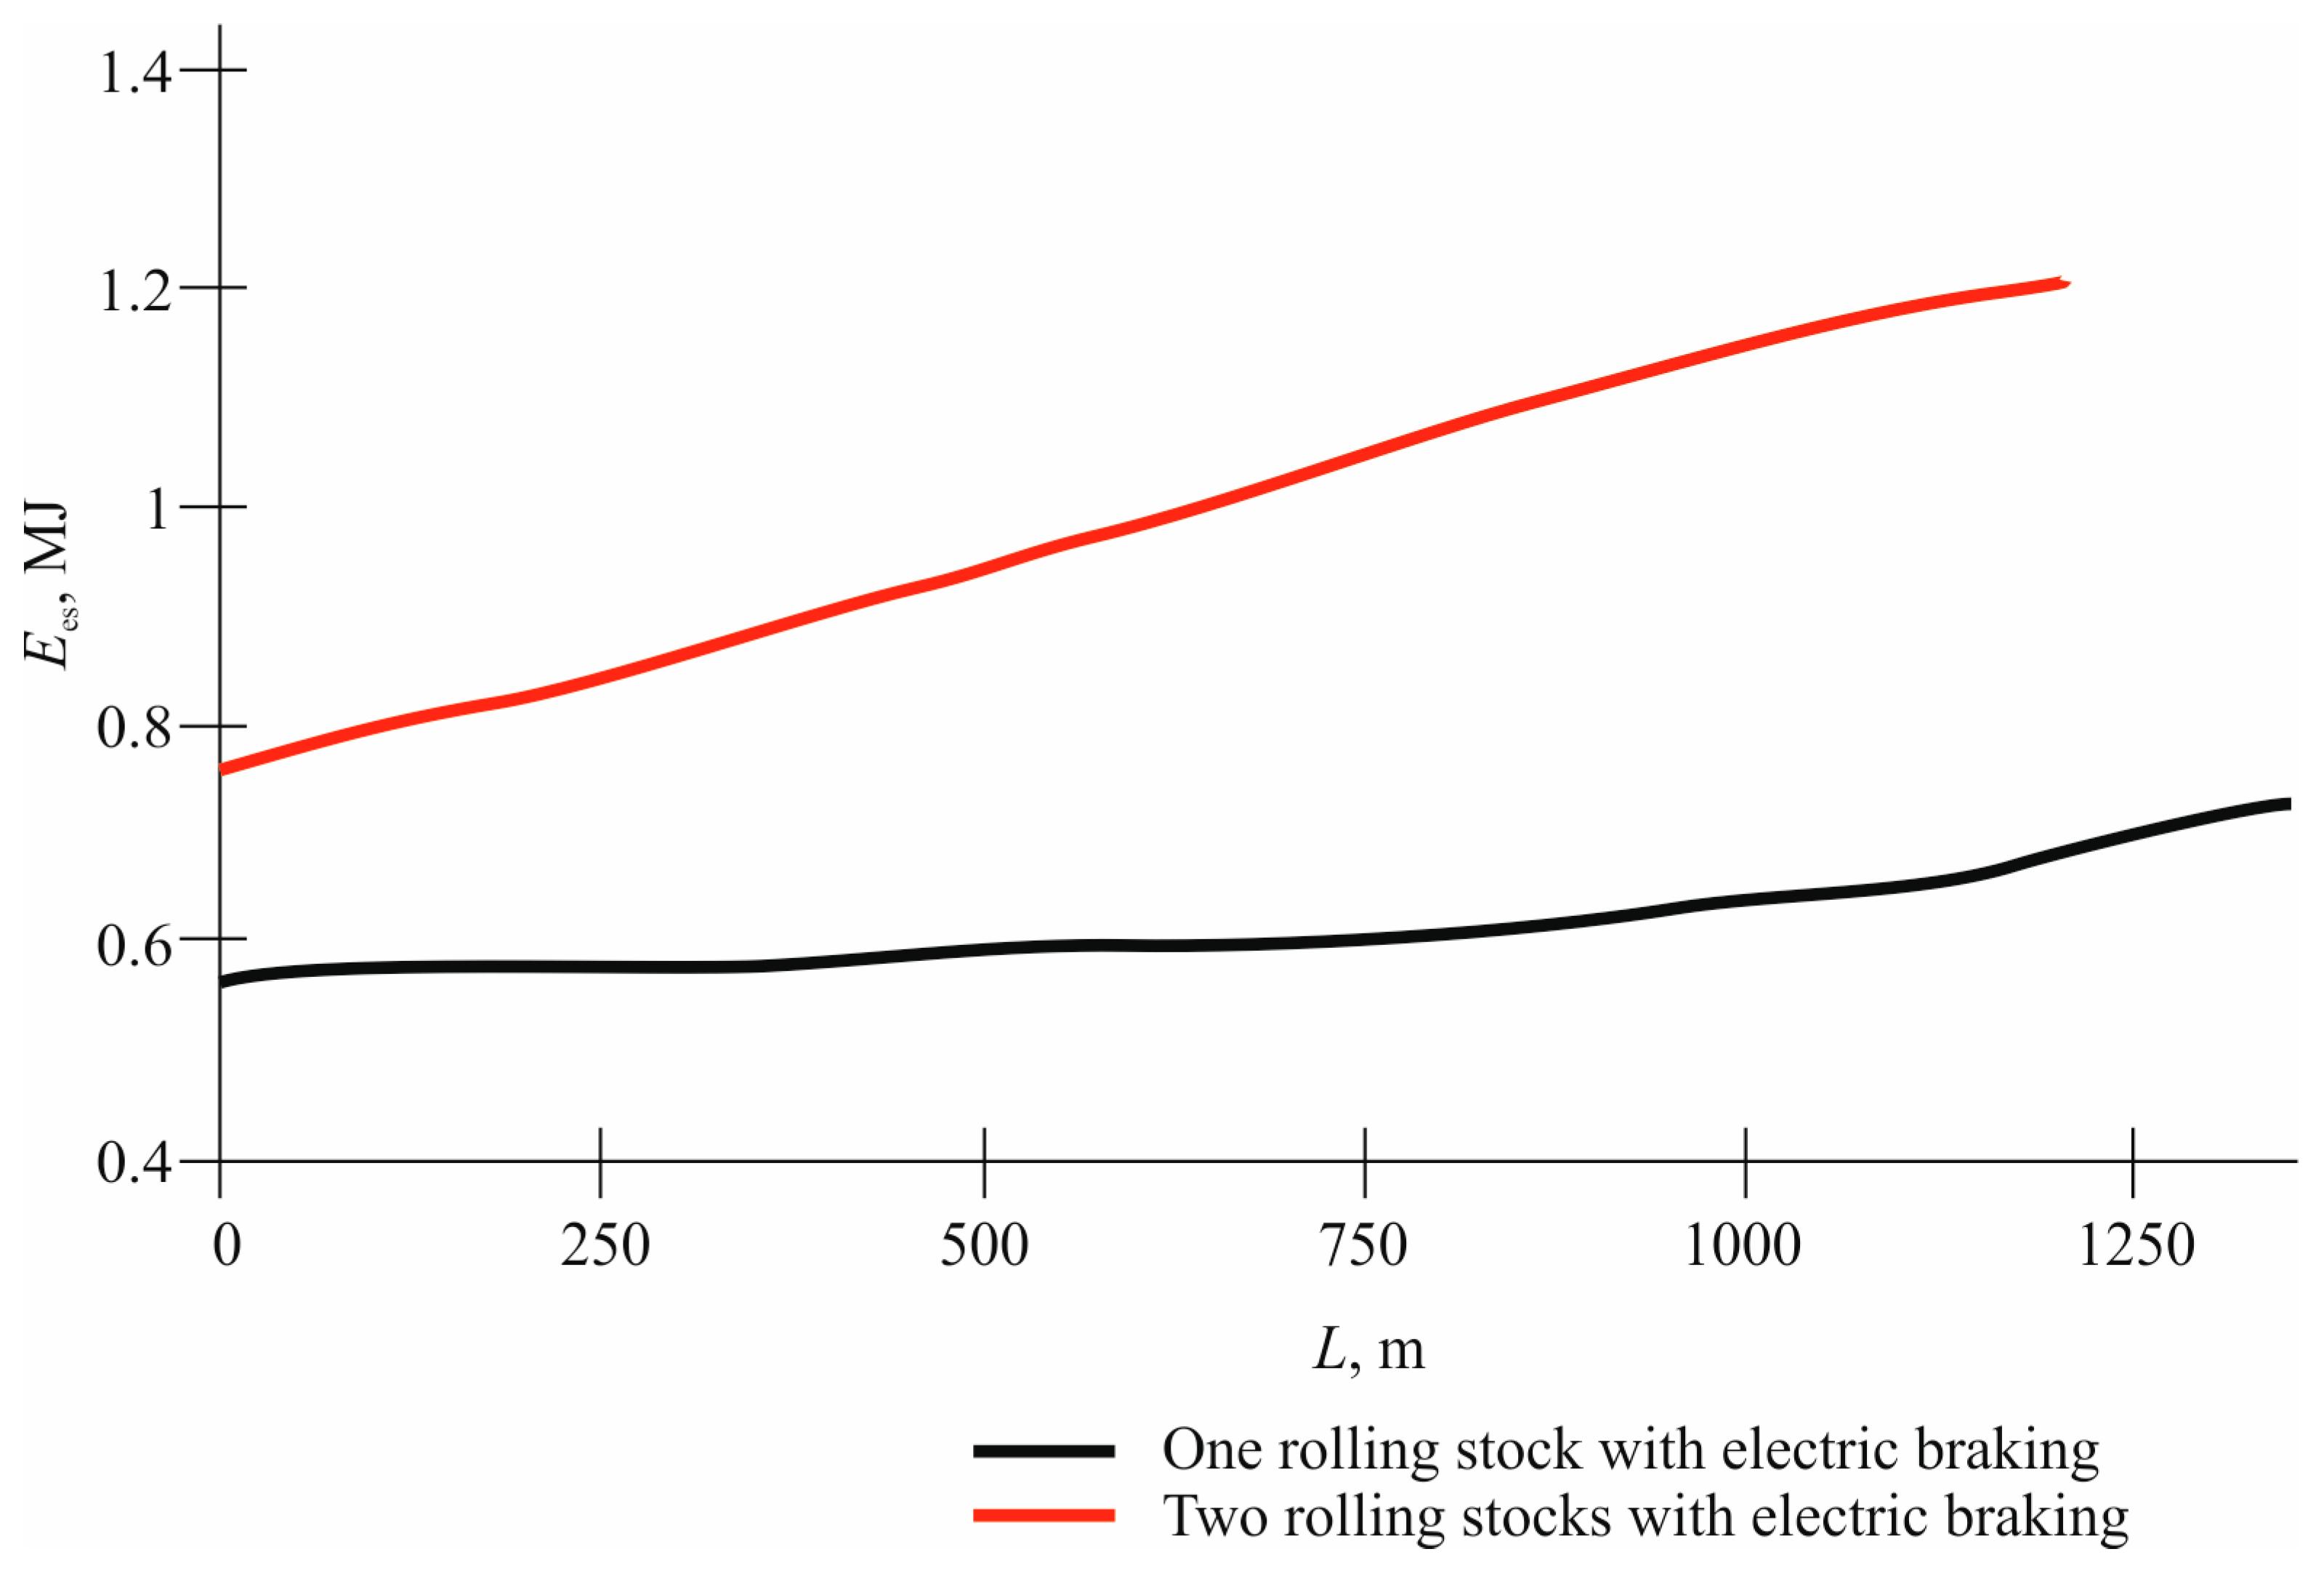
When studying energy storage cycling, comparative graphs were obtained. They show that when the recuperating substation approaches the ES, the volume of accumulated energy increases [
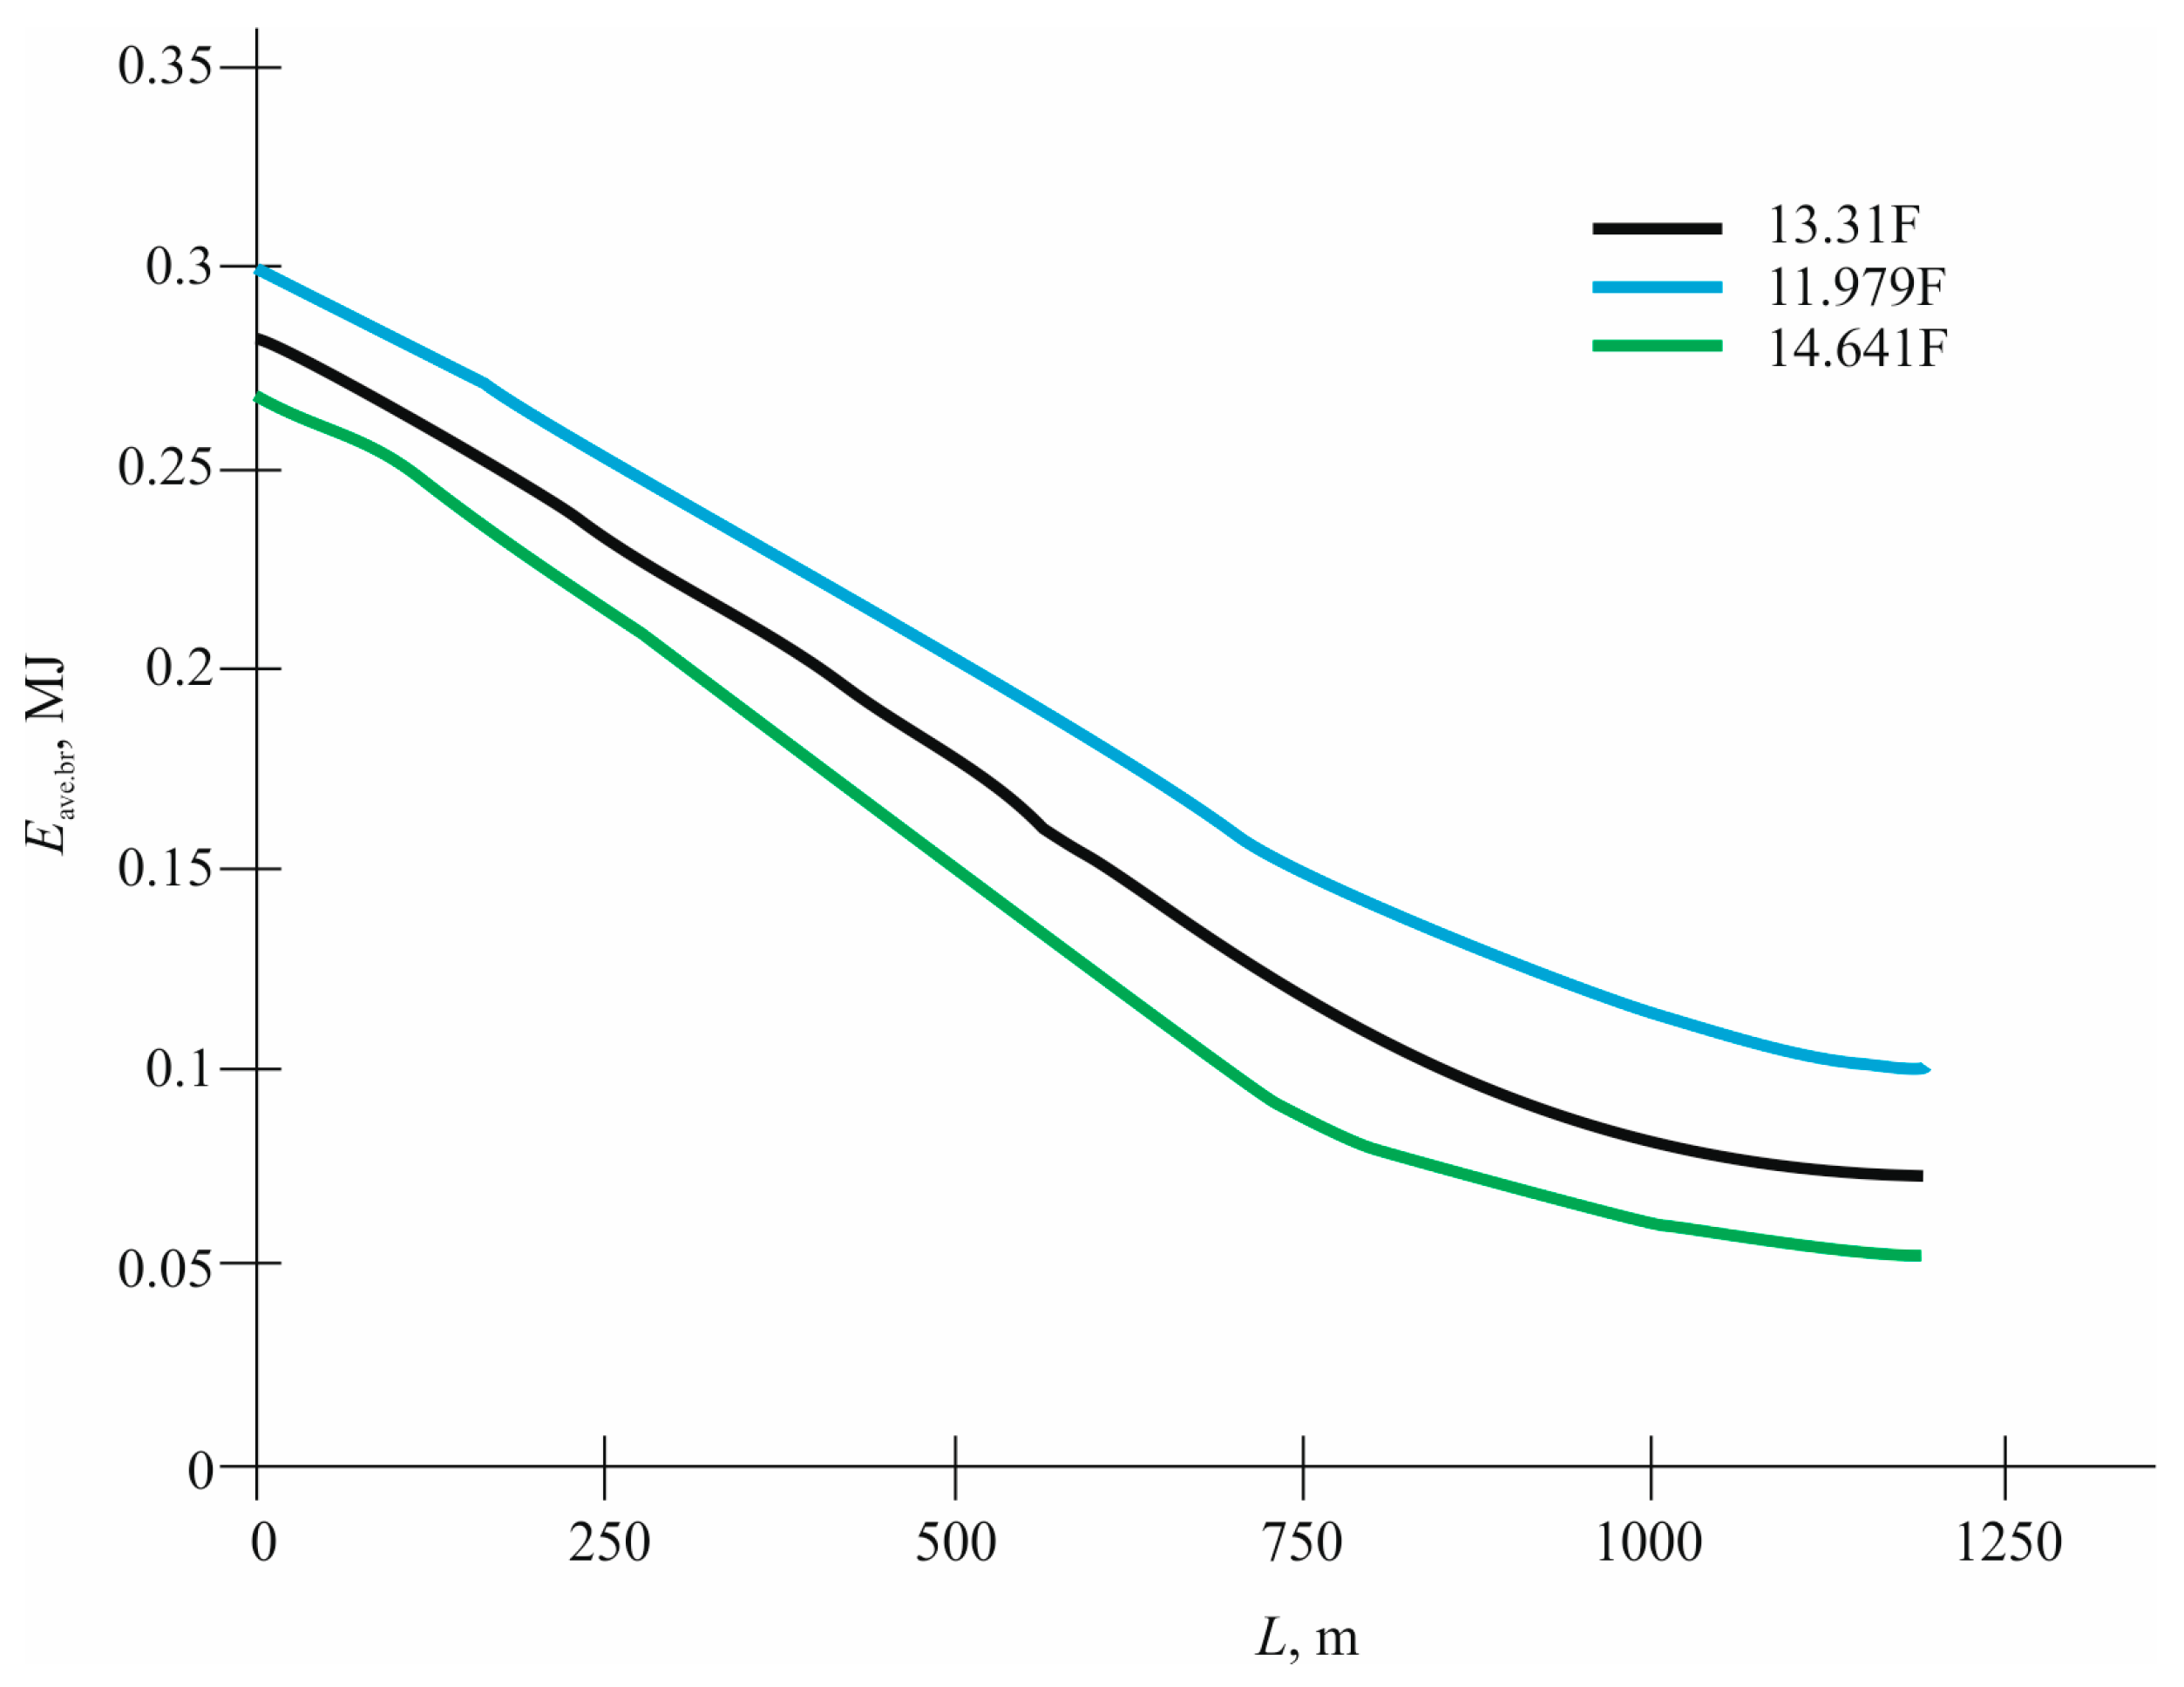
58]. When the ES capacitance is increased by 10%, the volume of maximum stored energy increases by 2.4%. The maximum voltage level decreases by 1.31%. When the capacitance decreases by 10%, the stored energy decreases by 3.49% and the voltage increases by 1.32%. The decreased storage capacity increases the average amount of
Eave.br energy dissipated in the braking resistances. As the traction train approaches the ES, the energy consumption at the traction substation decreases. Considering the total cost of supercapacitor banks, the model reveals a plateau in cost efficiency beyond 13.3–14.6 F. A detailed cost-energy analysis (
Table 9) confirms this as the optimal range.
Summarizing the results obtained, it can be concluded that a change in the capacity of the energy storage device within 10% does not give significant changes in the value of the accumulated energy and the voltage levels of the ES. The position of the substation in the contact network affects the efficiency of the energy storage device, which is associated with losses in the contact wire [
59]. The total energy savings for transport operations in the case of simultaneous operation of one to two or more traction trains can reach from 19.58 to 30.88%.
In the course of the study, a comprehensive simulation model of energy storage cycling in urban electric transport systems was performed. The work covered the modeling of the traction substation, supply lines, the contact network, rolling stock in traction and deceleration modes [
60], as well as the energy storage device itself. The main objective of the study was to assess the effectiveness of the use of energy storage to improve the energy efficiency of electrified transport through the utilization of regenerative braking energy and its subsequent use in the traction mode [
61].
The results of modeling confirmed the reliability of the developed model. The discrepancy between the calculated and simulated indicators turned out to be insignificant: the amount of energy generated in the braking mode was 7.184·10
5 J in the calculation and 6.884·10
5 J in the simulation with a relative error of 4.18%. The start rate of the run differed by 0.76%, the start time of the run changed by 3.26%, and the distance to the start of the run varied by 2%. These values indicate the high accuracy of the developed model and allow it to be used for further studies of the processes of energy accumulation and return [
62].
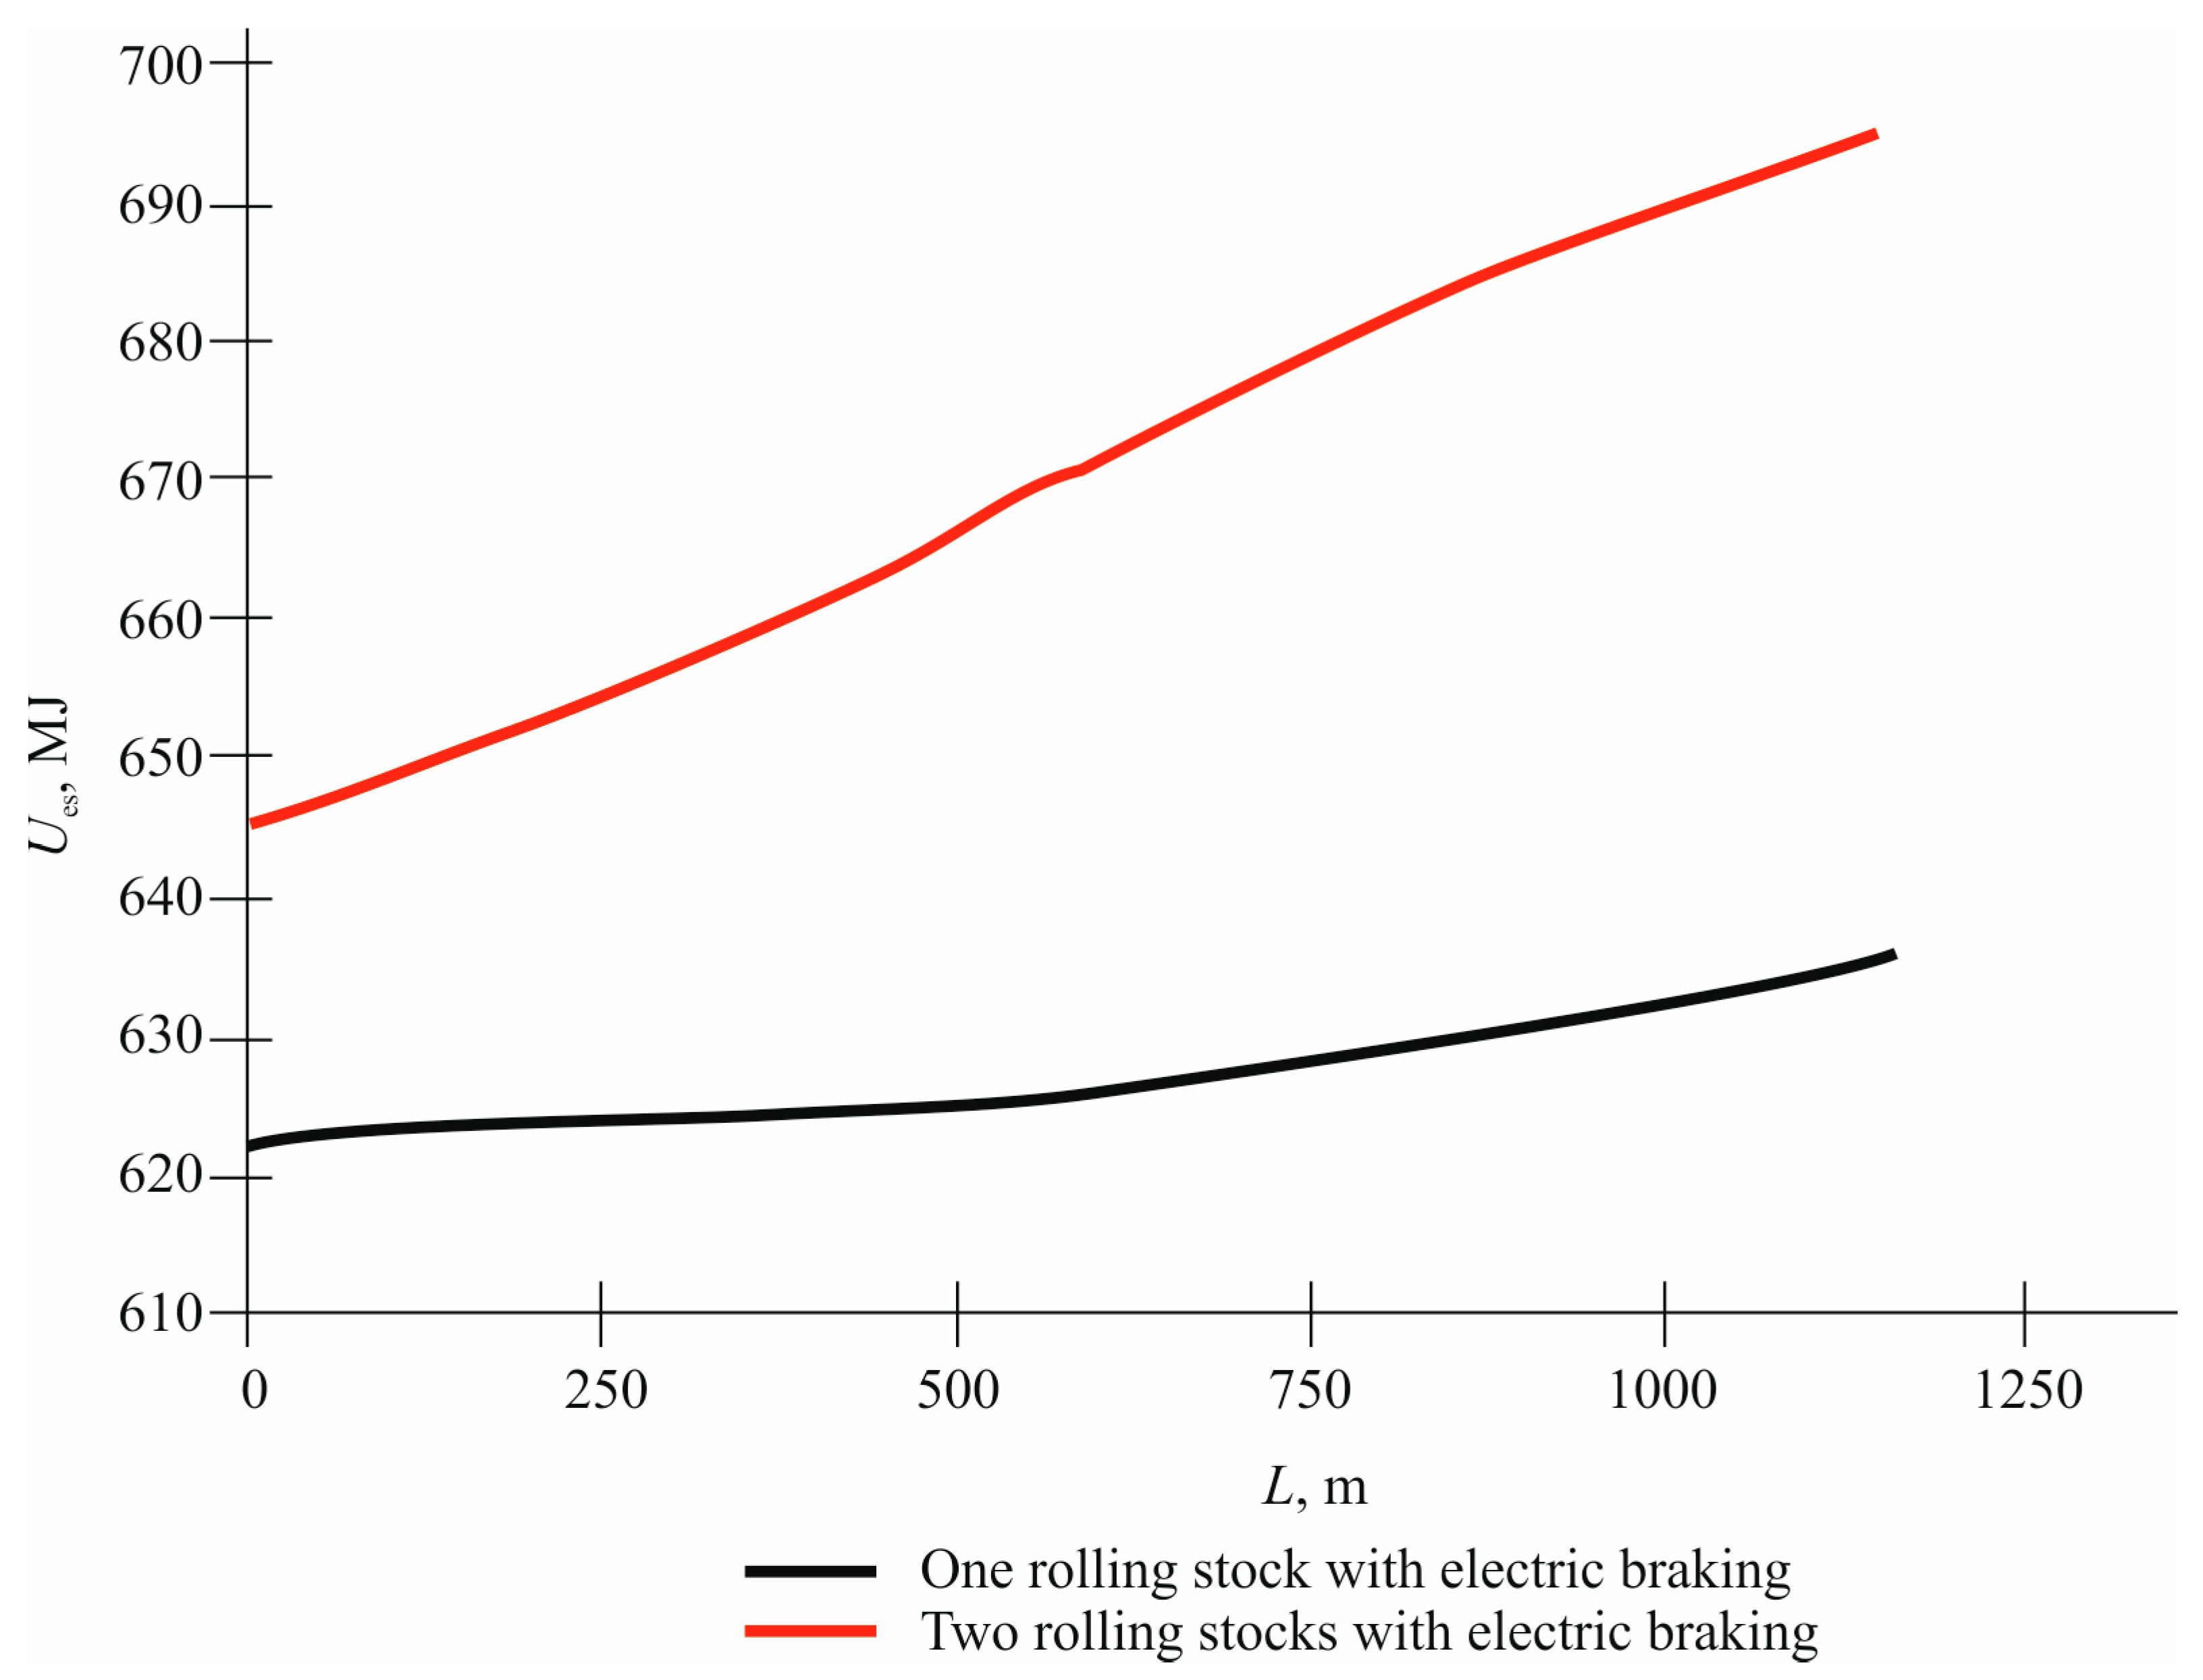
When analyzing the charging processes of the storage device, the dependencies of the accumulated energy (
Ees) and the voltage on the storage device (
Ues) on the distance of recuperating rolling stock to the traction substation were obtained. In the case of one rolling stock, at the maximum distance, the storage device accumulated 0.7231 MJ of energy, and the voltage level reached 640.75 V. With two rolling stocks, these indicators increased: the accumulated energy was 1.204 MJ, and the voltage was 694.5 V. At the same time, even under the most favorable conditions, the voltage level [
63] remained below the limit value of 720 V, which indicates a high capacitance of the system relative to the possible regenerative energy.
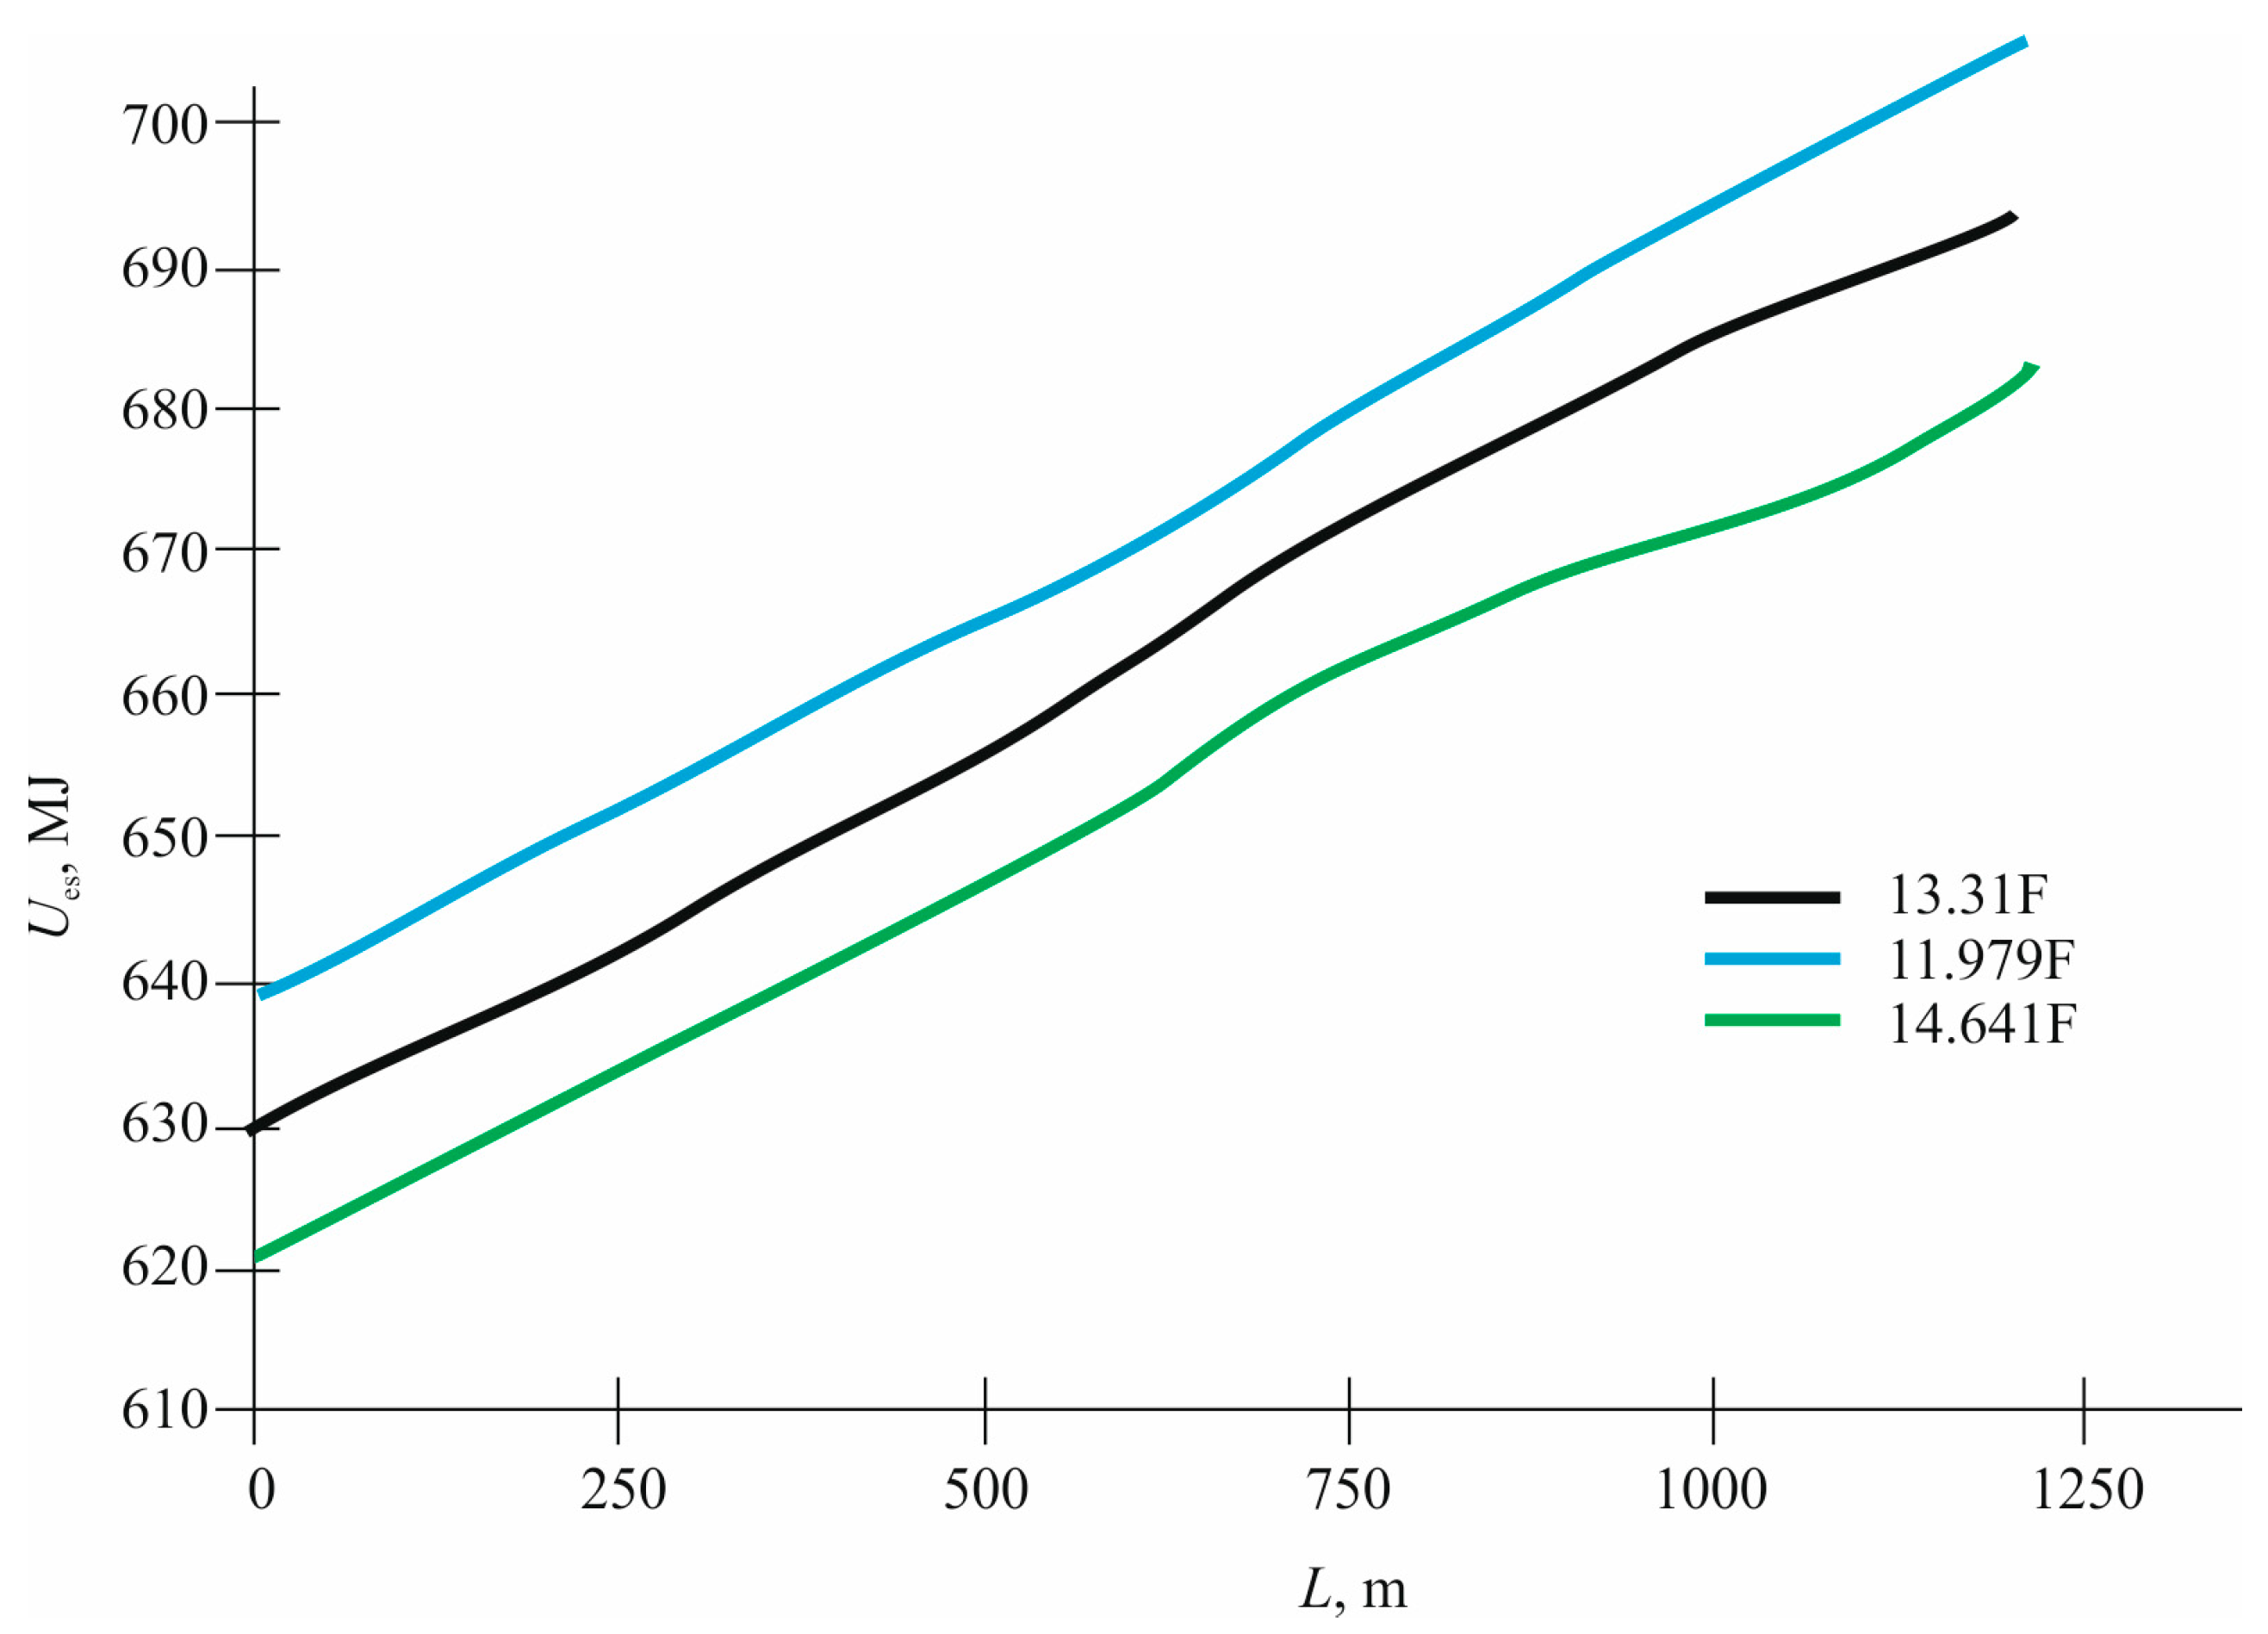
In addition, the effect of changing the storage capacity on charging processes was studied. With a 10% decrease in storage capacity (to 11.979 F), the stored energy decreased by 3.49%, and the voltage increased by 1.32%. With a 10% increase in capacitance (up to 14.641 F), the stored energy increased by 2.4%, and the voltage decreased by 1.31%. These results show that a ±10% change in capacity leads to relatively insignificant changes in the level of stored energy and voltage, which allows us to conclude that it is not advisable to vary the storage capacity within these limits from an economic point of view.
The inclusion of storage charge-discharge inefficiency into the model reveals that approximately 7–12% of the recuperated energy is irretrievably lost due to internal regulator losses and diode drops, even in well-matched systems. This slightly reduces the net benefit of energy storage, but provides a more realistic estimate compared to idealized models.
The simulation results confirmed that increasing ESS capacitance above 10% of the baseline brings marginal gains (<3%) in the energy recovered, while increasing investment by more than 10–12%. Hence, the cost-efficiency curve reaches a plateau, and a ±10% range of around 13.3 F offers optimal design flexibility.
Furthermore, the influence of braking frequency was found to be significant. Systems with closely spaced braking events (5 min interval) exhibited up to 18% higher total energy utilization than those with sparse braking (20 min), supporting the deployment of adaptive control algorithms in real time.
This work, therefore, proposes a robust, cost-aware, and technically grounded simulation model that helps in the design and planning of energy-efficient electric transport systems based on the legacy of the DC infrastructure. Special attention was paid to the analysis of energy losses during brake resistances with different storage capacities. With a decrease in capacity, energy losses on resistances increased, which is due to the inability to accumulate all the energy of regenerative braking and, as a result, its dissipation in the form of heat. An increase in capacity made it possible to somewhat reduce these losses, but the economic effect was comparable to the cost of increasing capacity.
6. Conclusions
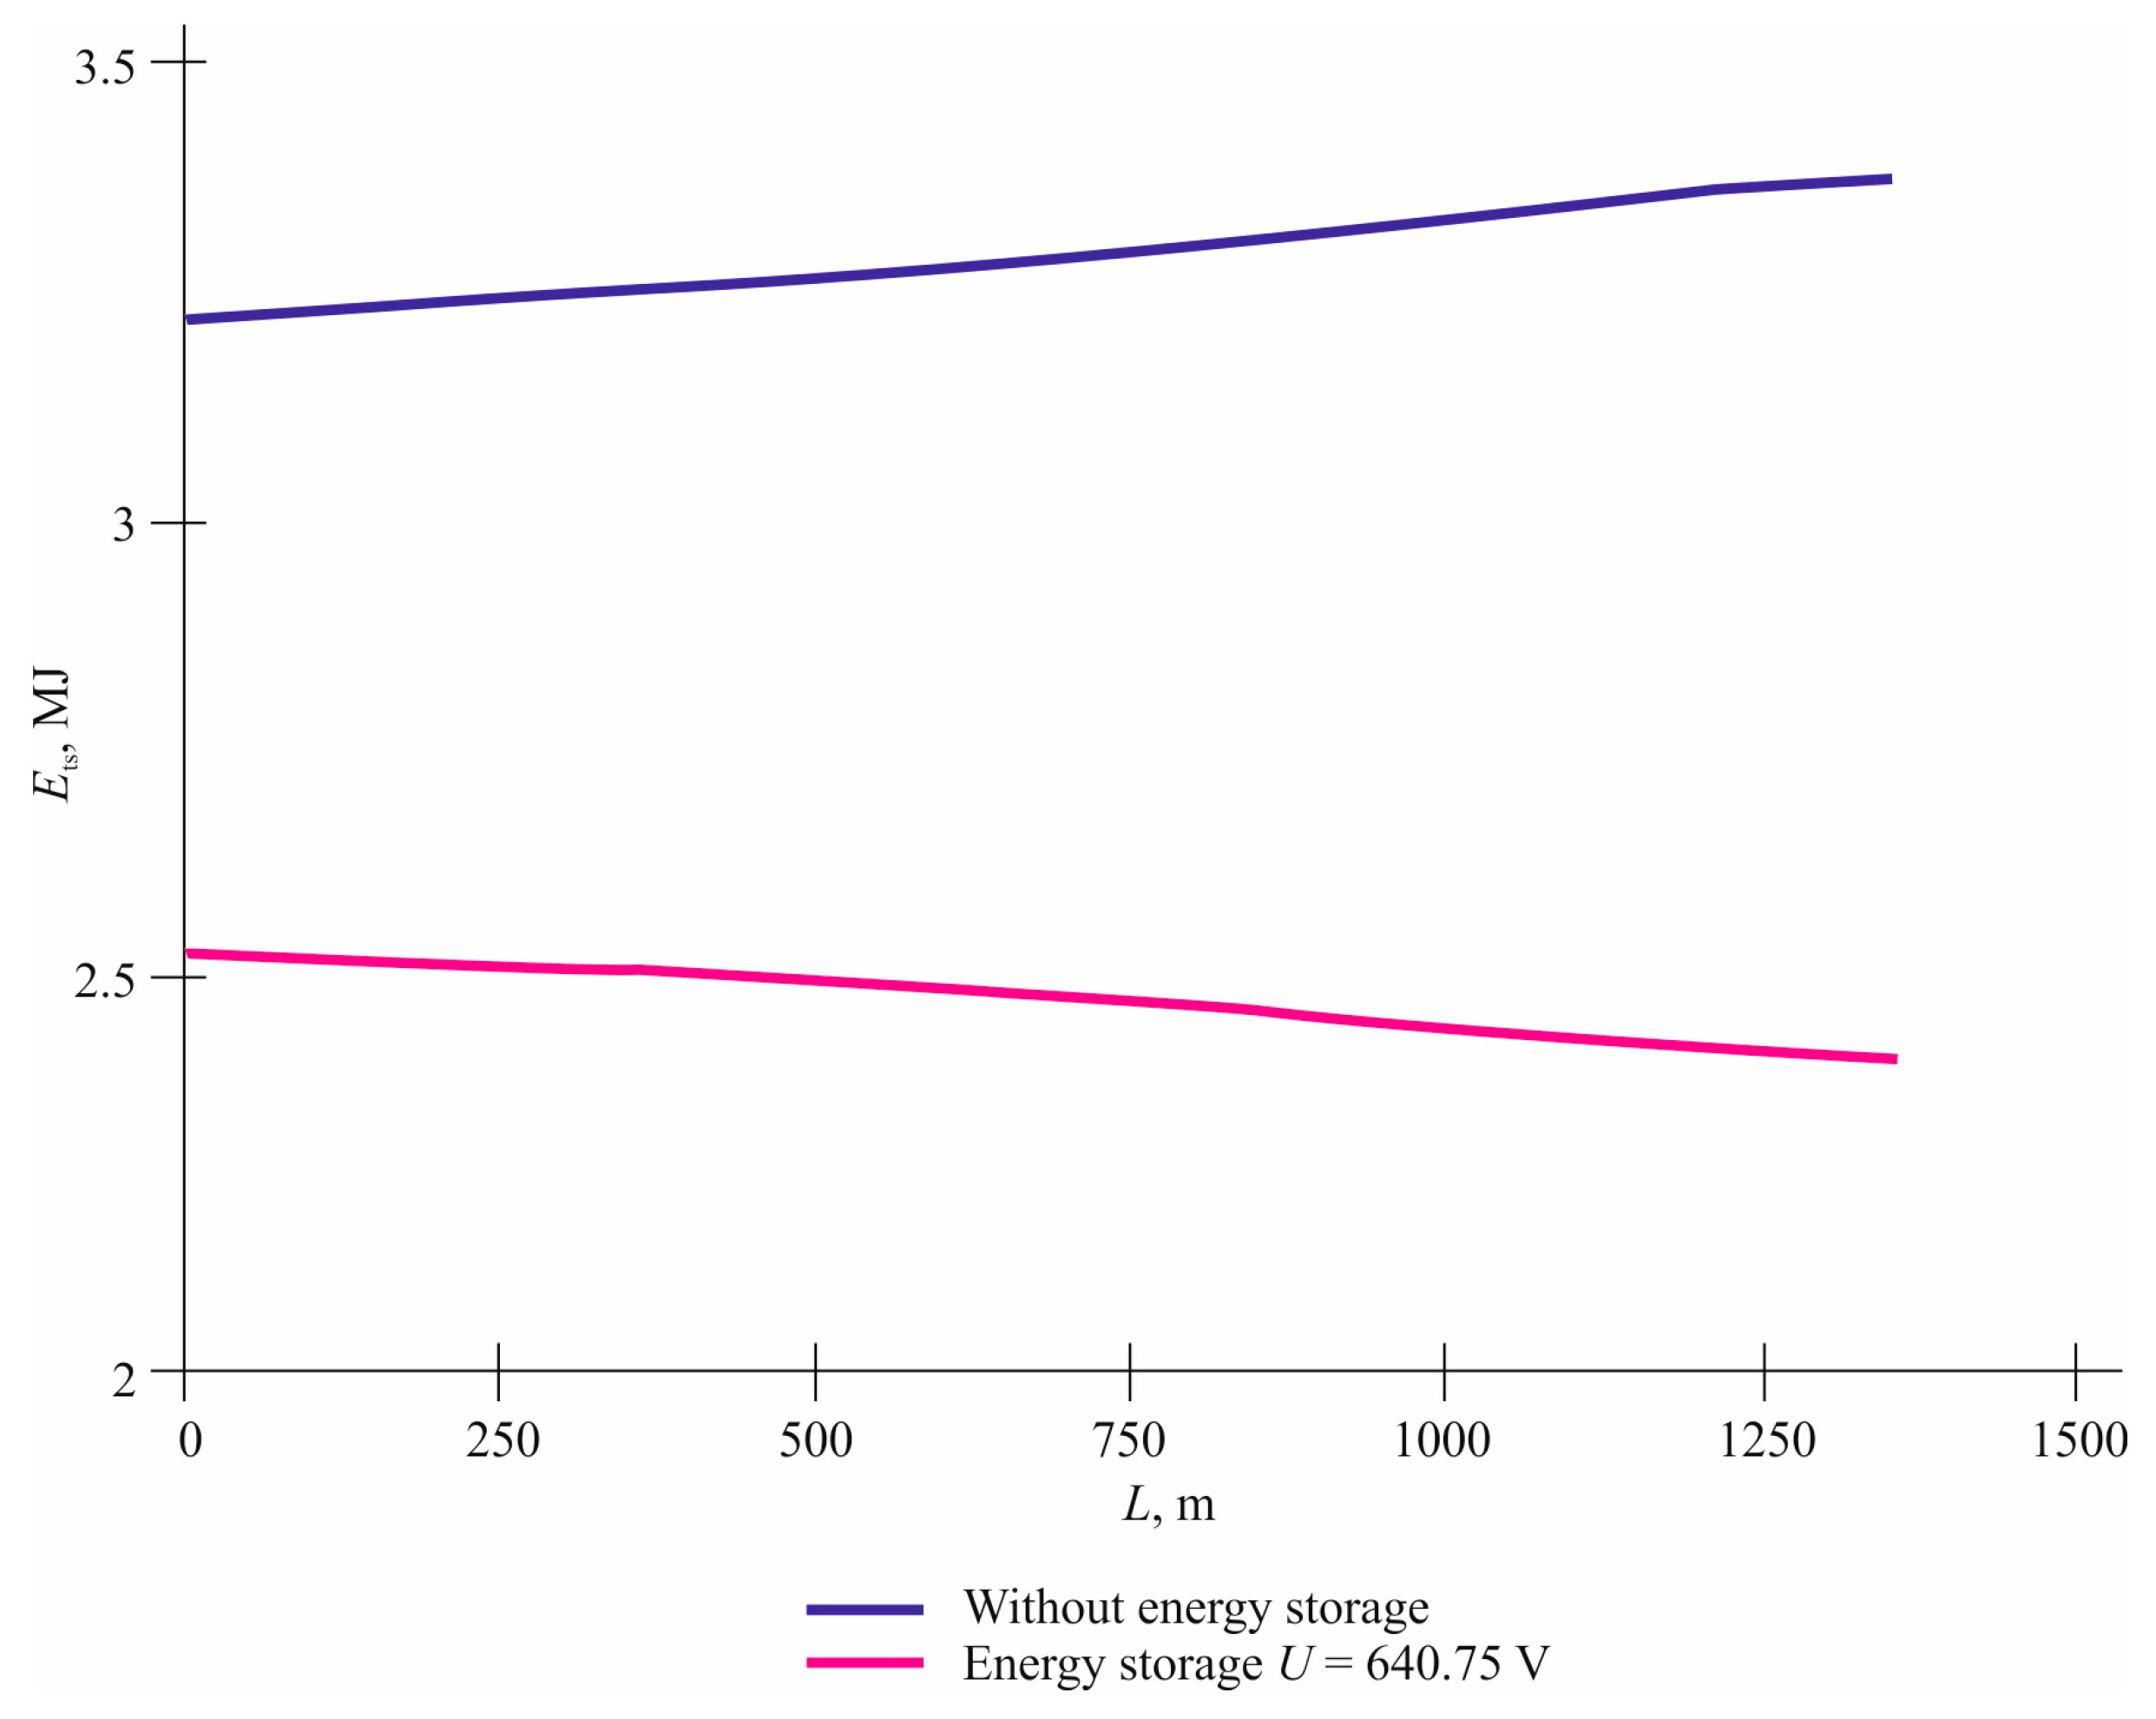
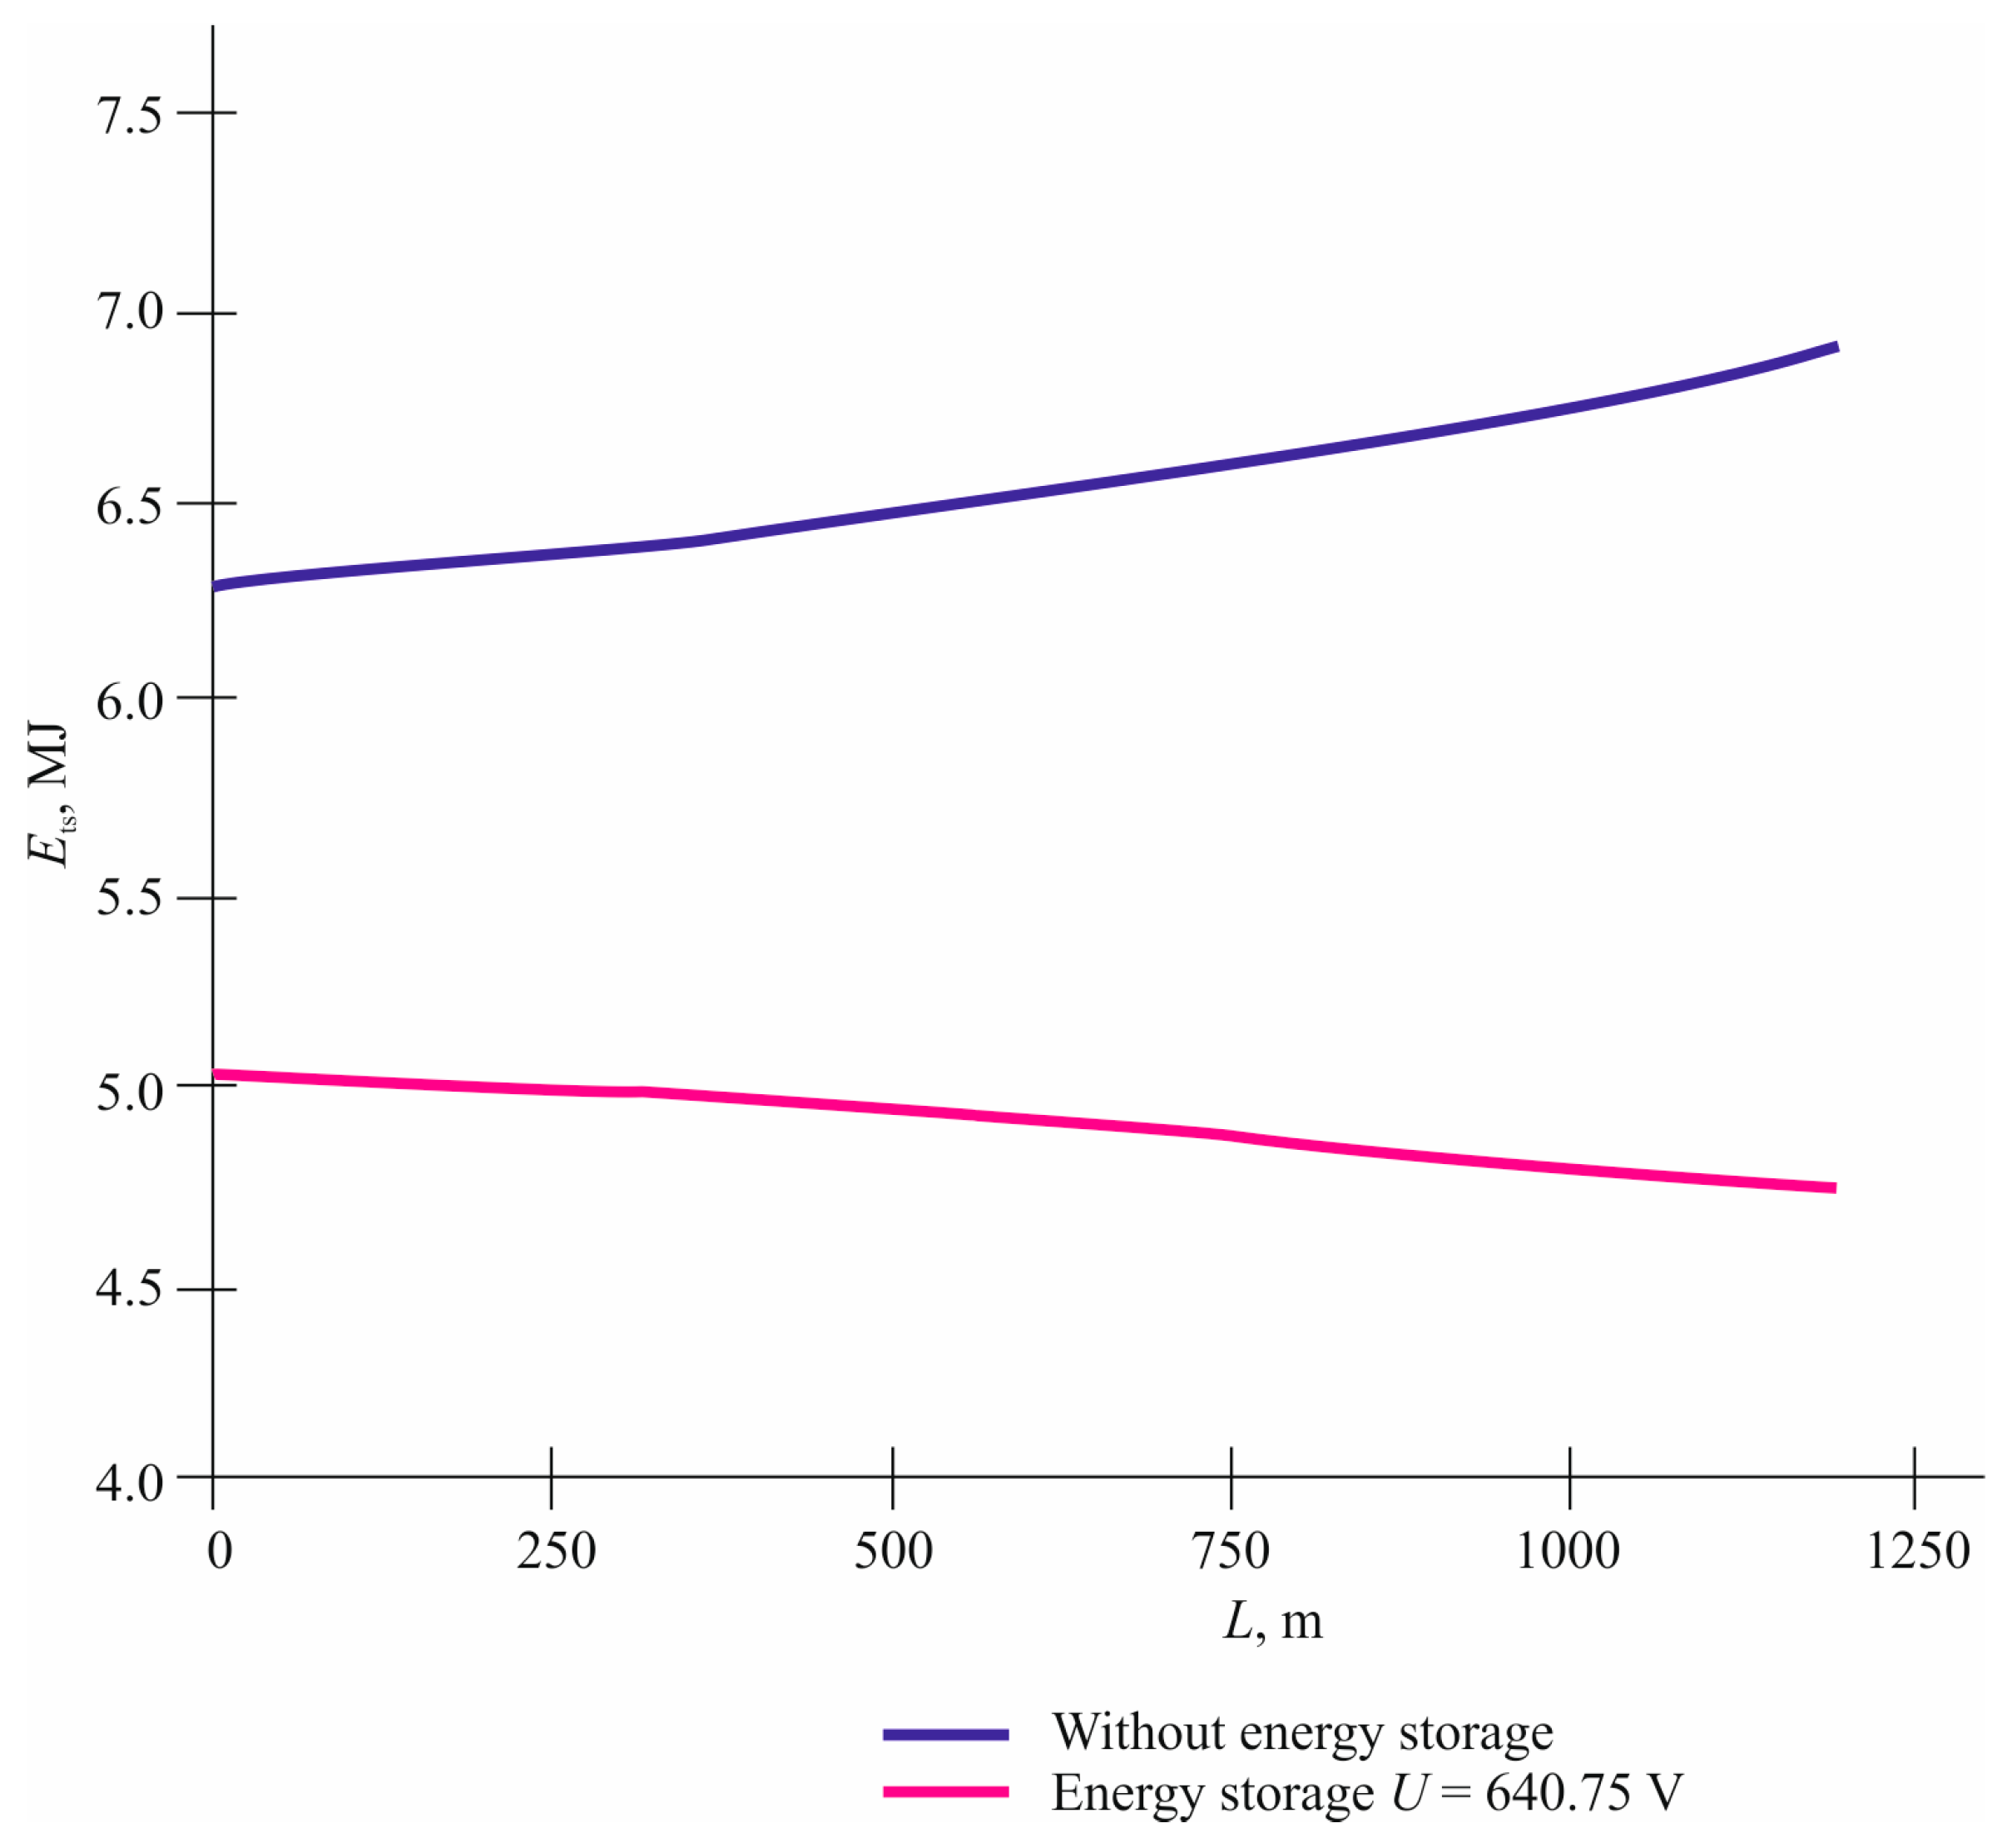
The study of the process of discharging the energy storage device revealed a noticeable decrease in the energy consumed by the traction substation when using the storage device as part of it. In the case of a single traction train, energy savings reached between 22.6 and 29.85%, depending on the position of the train in the network. With two trains, the savings ranged from 19.58 to 30.88%. These values demonstrate high efficiency in the use of energy storage devices to reduce the load on traction infrastructure and increase the energy efficiency of transport power supply systems.
Summarizing the results obtained, it can be concluded that the introduction of energy storage in electrified transport networks can significantly reduce the total energy consumption due to the use of regenerative braking energy. The developed model allows for effectively studying the processes of hopper cycling, as well as optimizing its parameters depending on the characteristics of the transport network and the characteristics of rolling stock. Although a ±10% change in storage capacity does not lead to radical changes in the energy performance of the system, the correct selection of the tank remains important in terms of minimizing energy losses in braking resistances and maximizing the use of recuperative energy.
The prospects for this work are the possibility of using energy storage not only to improve energy efficiency, but also to unload traction substations at peak load moments, to increase the stability of power supply, and to implement intelligent energy flow management systems in transport networks. Practical implementation of the results of the study may include the development of storage devices for specific urban transport lines and the integration of storage devices into larger transport systems. In addition, the dependencies and patterns obtained during the work can be used to further improve mathematical models and to develop automated systems for optimizing the cycling of storage devices based on real data on the rolling stock movement and the state of the electric grid infrastructure.
The improved simulation model, accounting for real-world cycling efficiency and capacitor sizing economics, demonstrates the feasibility of implementing energy storage systems in DC traction networks with minimal infrastructure modification. The study reveals that
Charge/discharge losses reduce net recuperated energy by up to 9%, requiring an efficiency-aware design.
Optimal storage capacity lies within 13.3–14.6 F, balancing capital cost and energy savings.
Systems with frequent braking (e.g., every 5 min) utilize up to 4× more energy than those with sparse intervals, making traffic patterns critical.
The model can be used as a design tool for transport authorities aiming to retrofit fleets and to optimize substation load. Future work will integrate real-world route data, life-cycle cost analysis (LCCA) models, and intelligent control for adaptive energy routing.
The proposed model is not limited to theoretical insights, but offers a scalable framework for real-world implementation. Practical scenarios include equipping trolleybuses and trams with modular capacitor blocks and integrating intelligent control systems that predict braking events and adjust charge-discharge parameters accordingly. Future work will extend the model by incorporating (LCCA) supercapacitors, performance degradation under temperature variation, and dynamic reconfiguration of energy flows using machine-learning-based energy management systems.


 ,
, 


