Abstract
The study evaluates the impact of massive electric vehicle (EV) penetration on Quito’s 138 kV distribution system in Ecuador, employing a probabilistic approach to support a sustainable energy transition. The rapid adoption of EVs, as projected by Ecuador’s National Electromobility Strategy, poses significant challenges to the capacity and reliability of the city’s electrical infrastructure. The objective is to analyze the system’s response to increased EV load and assess its readiness for this scenario. A methodology integrating dynamic battery modeling, Monte Carlo simulations, and power flow analysis was employed, evaluating two penetration levels: 800 and 25,000 EVs, under homogeneous and non-homogeneous distribution scenarios. The results indicate that while the system can handle moderate penetration, high penetration levels lead to overloads in critical lines, such as L10–15 and L11–5, compromising normal system operation. It is concluded that specific infrastructure upgrades and the implementation of smart charging strategies are necessary to mitigate operational risks. This approach provides a robust framework for effective planning of EV integration into the system, contributing key insights for a transition toward sustainable mobility.
1. Introduction
The increasing adoption of electric vehicles (EVs) poses a significant challenge to electrical distribution systems due to their uncertain demand and battery-charging patterns at various state-of-charge levels [1,2]. Several researchers have investigated the impact of EVs on distribution systems using diverse methodologies, highlighting the effects of batteries on various components, such as transformers and voltage quality [3,4,5]. For instance, studies have analyzed how long-range EVs affect distribution systems through Monte Carlo simulations based on real data [3], while others have projected the need for distribution network reinforcements by 2030 [6,7]. Furthermore, dynamic battery modeling is critical for simulating EV behavior in distribution systems, providing tools to evaluate their integration [8,9]. Within the framework of Ecuador’s National Electromobility Strategy, which aims to integrate thousands of EVs in the coming decades, this study assesses the impact of massive EV penetration on Quito’s 138 kV distribution system (EEQ).
Several authors have studied EV integration at global and regional levels. Comprehensive reviews emphasize that large-scale EV adoption requires coordinated charging strategies and integration with renewable energy sources to mitigate impacts on supply quality and system capacity [10,11]. In the Latin American context, studies such as those conducted in Colombia have employed probabilistic approaches to assess the impact of EVs on residential networks, accounting for uncertainty in charging patterns [12,13].
Several critical scenarios associated with the growth of electric mobility in distribution networks have been documented in the literature. Table 1 provides a summary of recent studies conducted in Latin American countries and international reference cases, highlighting significant impacts on power systems, such as overloads, voltage drops, harmonic distortion, and the need for infrastructure reinforcement. These cases emphasize the urgency of planning network expansion proactively, particularly for the 138 kV distribution system of the Metropolitan District of Quito.

Table 1.
Critical analysis of regional power infrastructure and impact.
Numerous studies have addressed this topic. Previous research has utilized forecasting models such as Bass, Gompertz, and Markov to predict EV penetration and evaluate its impact on electrical system load, employing power flow analysis software like ETAP [14,17]. Reviews have also highlighted the adoption of EVs as coordinated loads and the integration of renewable energy sources to mitigate their impact in the Latin American context [18,19]. Other works have proposed methods to determine the maximum additional load (MAL) that can be connected to each node of a radial distribution system (RDS) without violating safe voltage limits, using modified forward–backward sweep (MFBS) algorithms and validating results in 33- and 69-bus RDS systems [20,21]. Additionally, methodologies have been developed to model the daily charging load of EVs at charging stations, considering random factors such as charging power, initial state of charge (SOC), start time, and charging duration, through Monte Carlo simulations [22,23]. Probabilistic models have also been proposed to estimate EV quantities, using Monte Carlo methods to generate EV integration scenarios and superimposing load curves of different EV types to obtain the total demand curve [24,25]. Other studies have employed user probability distribution models based on data such as charging start time, initial SOC, power level, and charging duration to predict the physical distribution of EV load, considering geographical aspects, EV types, and climatic conditions, again using Monte Carlo simulations [26,27]. Analyses of factors affecting load, such as vehicle type, driving distance, charging start time, charging power, and battery capacity, have been conducted using lognormal distributions for daily mileage and normal distributions for charging start time, with Monte Carlo simulations [28,29].
Additionally, models have been proposed that utilize contingency analysis variables to determine the required power capacity, incorporating photovoltaic systems and energy storage [30], along with constant generation alternatives, and Monte Carlo simulations to assess the additional power capacity needed, with power flow optimization performed using software such as GAMS [31,32]. An EV charging model was developed using Monte Carlo simulation, considering travel distance, trip start and end times, and time-of-use electricity pricing. Linear programming was employed to optimize EV charging schedules and minimize costs. Subsequently, a continuation power flow (CPF) analysis was conducted to evaluate static voltage stability and determine the maximum EV connection capacity [33]. The integration of plug-in electric vehicles (PEVs) and distributed generation (DG) in distribution systems was assessed, accounting for uncertainties in renewable generation and load demand [34,35]. The objective was to optimize the placement and sizing of DG units to minimize energy losses and enhance system reliability [36,37]. Finally, studies based on surveys of EV users have evaluated their willingness to modify charging habits in response to economic incentives, alongside simulations modeling the impact of these incentives on the electrical grid and traffic [38].
The load imposed by EVs on distribution networks exhibits significant spatial and temporal randomness [39]. To capture this inherent uncertainty, this study employs the Monte Carlo method to generate a range of probabilistic scenarios simulating the integration of EVs into the system. This probabilistic approach enables a more robust evaluation of the system’s load capacity under various demand conditions, yielding results that are more representative of real-world scenarios. Consequently, this study contributes to a more accurate understanding of the challenges posed by the increasing penetration of EVs in distribution networks, while providing a more comprehensive and reliable loadability analysis methodology.
This study investigates the loadability of a 138 kV distribution system in Quito, Ecuador (EEQ), under massive EV integration. A methodology is employed that combines dynamic modeling of lithium-ion batteries based on models proposed by [40,41], power flow simulations, and probabilistic EV load distribution using the Monte Carlo method. This methodology enables a more realistic and robust evaluation of the system’s loadability under varying EV penetration conditions, accounting for the inherent variability in vehicle-charging patterns. The research aligns with the goals set by Ecuador’s National Electromobility Strategy, which projects the integration of 10,000 EVs by 2025, 100,000 by 2030, and over 750,000 by 2040, posing a significant challenge to the country’s electrical infrastructure. Therefore, this study aims to determine whether the current distribution system is prepared to support the anticipated growth in associated demand.
This article is structured as follows: Section 2 provides a detailed description of the methodology employed; Section 3 presents the case study, focusing on the 138 kV subtransmission system of Quito, Ecuador; Section 4 discusses the results obtained through the application of the methodology; and finally, Section 5 offers the conclusions and a discussion of the results.
2. Materials and Methods
2.1. Ecuadorian Case
The 138 kV distribution system of Quito (EEQ) was selected as the case study because it is representative of Ecuador’s power grid and records the highest increase in EV adoption nationwide. The objective of this research is to evaluate the operational behavior of the system under different levels of EV penetration, in order to identify potential overloads and critical lines. For this purpose, two load distribution scenarios were defined: (i) a homogeneous scenario, with EVs evenly distributed across all busbars (busbars are the distribution substations comprising the EEQ 138 kV system), and (ii) a non-homogeneous scenario, where EVs are randomly assigned based on load density and distance. In both cases, penetration levels of 800 and 25,000 EVs were analyzed, as they are considered representative of the current and short-term stages according to the National Electric Mobility Plan. The 100,000 EV scenario projected for 2030 was not considered, since the current system lacks the technical capacity to meet such demand, as evidenced in preliminary simulations.
2.2. Methodology
The methodology employed to assess the loadability of distribution lines under the massive integration of electric vehicles (EVs) is characterized by its comprehensive and probabilistic approach. The study integrates three key aspects: accurate modeling of battery behavior during EV charging to determine the required power; simulation of the inherent randomness in system operation using the Monte Carlo method to incorporate the electrical demand generated by EVs; and analysis of the system’s load capacity through the power flow (PF) technique.
2.2.1. EV Modeling
The modeling of lithium-ion batteries for electric vehicles (EVs) was carried out using the approach proposed by [40,41], which is widely accepted in the literature for its ability to represent the nonlinear relationship between voltage and state of charge (SOC). For the application in this study, the base parameters reported in [41] were simulated and validated, and the model was subsequently extended to various vehicle brands by adjusting key parameters according to the technical specifications of each manufacturer; the model is shown in Figure 1. Since the objective of this work is to evaluate the overall behavior of the distribution system under massive EV penetration, this modeling approach is considered appropriate and representative of the battery technology currently available on the Ecuadorian market.
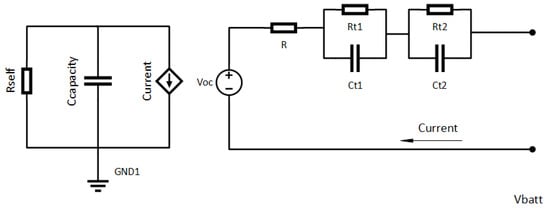
Figure 1.
Mathematical model of the charging and discharging of EVs.
The technical specifications of the batteries used in the Nissan, Kia, Renault, and BYD EV models were obtained from manufacturer-provided data and are presented as follows:
- Nissan: 24 kWh Li-NMC battery, with 192 cells (2 in parallel, 96 in series), nominal voltage of 3.8 V, and capacity of 66.2 Ah.
- Kia: 30 kWh LiPB/Li-NMC battery, with 192 cells (2 in parallel, 96 in series), nominal voltage of 3.75 V, and capacity of 75 Ah.
- Renault: 33 kWh Li-NMC battery, with 192 cells (48 modules, 96 in series), nominal voltage of 3.5 V, and capacity of 80 Ah.
- BYD: 80 kWh LFP (lithium iron phosphate) battery, with 324 cells (324 in series, 1 in parallel), nominal voltage of 3.2 V, and capacity of 200 Ah.
The allocation of electric vehicles to the brands (Nissan, Kia, Renault, and BYD) was based on their current market share in Ecuador—46.82% for Nissan, 23.96% for Kia, 21.91% for Renault, and 7.29% for BYD—according to official data from the national electric vehicle registry. These brands were selected because, together, they represent the majority of the Ecuadorian EV fleet. Although these proportions may evolve with the adoption of new models featuring higher battery capacities, this study aims to reflect the current operational state of the 138 kV distribution system under the present conditions. Initially, the average number of EVs per brand was estimated using these probabilities to account for the spatial uncertainty of each EV within the system. These specifications, including battery type, voltage level, current capacity, number of cells, and other technical parameters, are fundamental for modeling. A significant advantage of the model is its flexibility to adapt to different lithium-ion battery types; by adjusting its parameters, it can accurately simulate the behavior of a variety of EV batteries used in the Ecuadorian market.
To estimate the SOC, calculations were performed with a total of n = 14,000 iterations, modeled using a mixed probability distribution. This distribution assigns the SOC through the following expression:
- With a 60% probability, the SOC is uniformly selected within the interval [20%, 50%].
- With a 40% probability, the SOC is uniformly selected within the interval [51%, 79%].
The probability density function of the SOC was expressed in Equation (1):
Equation (1) probabilistically assigns initial SOC values, reflecting the variability of EV charging-level conditions.
The probabilistic assignment of the initial state of charge (SOC) is based on usage habits observed in the Ecuadorian context, where electric vehicle users tend to connect their units to charging stations when the battery level is in the low or medium ranges; that is, EVs are more likely to be charged when the is below 50%. Additionally, this behavior is influenced by factors such as the limited availability of charging infrastructure in certain urban areas and the desire to maintain sufficient driving autonomy. Based on operational data and mobility patterns, a higher probability was assigned to SOC values between 20% and 50%. This approach reflects real-world usage conditions and is considered a valid approximation for planning scenarios in regions with low charging station density.
Once the assignment is completed, the models proposed by [40,41] are applied, according to the following mathematical expressions formulated below.
Equation (2) models the open-circuit voltage of the battery () as a function of the state of charge () expressed as a percentage. This represents the battery voltage in an unconnected state, considering the exponential behavior during charging as a function of , in addition to a polynomial behavior that captures the nonlinear voltage variation as the SOC increases. The coefficients (−1.031, 3.685, etc.) are derived from experimental data, as reported in [40,41].
Equation (3) defines the series resistance () of the battery, which depends on the SOC percentage. The exponential nature of the formula reflects a reduction in internal resistance as the battery charges, with an additional base value of 0.0746 ohms representing the battery’s baseline resistance. This enables the modeling of energy losses during charging and discharging processes.
Equation (4) models the internal resistance , which is part of the parallel circuit representing the short-term transient response. The exponential term decreases with increasing , allowing the incorporation of the resistance behavior as it reduces while the battery charges, alongside a constant value that ensures a minimum resistance level. Equation (5) represents the capacitance associated with . The negative exponential term suggests an initial increase in capacitance with rising , enabling the adjustment of the constant capacitance value to stabilize the model. This captures the battery’s transient charge storage capacity.
Equation (6) represents the resistive component of the long-term transient response. The exponential term decreases rapidly with increasing , indicating very low resistance at high percentages, while the constant term represents the residual resistance at minimal levels, affecting the long-term voltage dynamics. Equation (7) models the capacitance in parallel associated with . The negative exponential term indicates an increase in capacitance with rising , and the constant term reflects the long-term charge storage capacity of the battery.
From Equation (8) to Equation (11), the calculation of the EV battery voltage is represented. Equation (8) calculates the voltage across the series resistance, representing the voltage drop due to the battery’s internal resistance. Equation (9) defines the voltage across the circuit, determined by the integral of the product of and divided by , multiplied by the charging current. This represents the short-term transient contribution to the total voltage, modeling the dynamic response of the battery. Similarly, is calculated in Equation (10) through the , defined by the integral of and divided by , multiplied by the charging current. This captures the long-term transient contribution, accounting for slow relaxation effects in the battery. Finally, Equation (11) represents the algebraic sum of all voltages calculated in the previous equations, adjusted by a correction term that accounts for the impact of SOC on resistance and open-circuit voltage. This final term ensures that the model accurately reflects the battery’s real-world operating conditions under load.
2.2.2. EV Demand Distribution in the EEQ System
The analysis of EV demand distribution was conducted for two specific cases. The first case is a homogeneous scenario, where the power demand of EVs is evenly distributed across all the busbars of the system. In contrast, the second case is a non-homogeneous scenario, utilizing the Monte Carlo method to assign EVs to different busbar in the system, which is critical for reflecting the variability in EV demand. This procedure generated multiple scenarios that were processed to obtain statistically significant results.
The assignment of EVs to the brands (Nissan, Kia, Renault, and BYD) was based on their market shares, defined as 46.82% for Nissan, 23.96% for Kia, 21.91% for Renault, and 7.29% for BYD, according to EV registration data in Ecuador. Initially, the average number of vehicles per brand was estimated using these probabilities; however, to account for uncertainty in spatial distribution, a Monte Carlo simulation was implemented to randomly assign each vehicle to a specific busbar within the system.
The simulation was executed with 1000 iterations. This number was defined based on a sensitivity analysis, which showed that from around 800 iterations onward, the results began to stabilize, with variations of less than 1% in the standard deviation. This choice ensures robustness in the results. In each iteration, EVs are assigned to the busbars using a binomial distribution, where the probability of assignment is weighted inversely to the distance of each busbar from the main load centers.
Equation (12) represents the random variable r, to assign each EV to a specific brand (Nissan, Kia, Renault, or BYD), a random variable r was generated using the Monte Carlo method, following a continuous uniform distribution within the interval [0, 1]. This approach introduces stochastic variability in the assignment process, reflecting the randomness observed in real-world scenarios, while maintaining consistency with the market share percentages reported by Ecuador’s national electric vehicle registry. The allocation is performed based on intervals defined by the cumulative participation values of each brand: when r falls within a specific range, the corresponding brand is assigned. This probabilistic method provides a more realistic representation of the progressive integration of electric vehicles into the national power system.
Equation (13) defines the stochastic allocation scheme for assigning each electric vehicle to a specific brand (Nissan, Kia, Renault, or BYD), using a random variable r generated through a continuous uniform distribution in the range [0, 1]. The intervals of r are directly linked to the market share of each manufacturer, based on official data from Ecuador’s national electric vehicle registry. This formulation allows for a realistic representation of the uncertainty inherent in the technology adoption process, avoiding deterministic rules and instead introducing controlled variability in the allocation. For example, if , and the cumulative interval for Kia is 0.4682 to 0.7080, the EV is assigned to Kia.
Equations (15)–(23) describe the stochastic assignment of EV by brand and the corresponding calculation of total power demand per battery type at each busbar in the distribution system. Once the brand assignment probability is determined, the distribution of EVs across the busbar is carried out based on the total number of EV and the energy requirements of each model. These formulations integrate both the spatial allocation—guided by probabilistic methods—and the specific power consumption associated with each EV type, considering technical parameters such as voltage differential and charging current. This approach allows for a more realistic estimation of nodal demand under large-scale EV penetration scenarios.
It is important to highlight that the voltage used in the power Equations (16), (18), (20) and (22) does not correspond to a constant or nominal value, but rather represents the voltage differential that occurs during the battery-charging process, from the initial state of charge () to the final state of charge (). This dynamic value captures the actual variation of voltage as a function of and is expressed by Equation (14):
where:
Equation (15) calculates the number of Nissan electric vehicles allocated to a specific busbar n. This is achieved by evaluating, for each EV in the total population, whether it belongs to busbar n and whether the random variable r falls within the probability range associated with the Nissan brand. The function ensures that only vehicles assigned to busbar n are counted, while ensures brand-based classification.
Equation (16) computes the total power demand associated with Nissan EV at busbar n. This is calculated by multiplying the number of Nissan EVs at that busbar () by the battery charging current and the voltage differential , which represents the change in battery voltage between the initial and final state of charge ( and ). Unlike a fixed or nominal voltage, captures the dynamic behavior of the battery during the charging process, as described in Equation (14). This formulation links the probabilistic brand and spatial assignment of EVs to their electrical impact on the network, enabling a more accurate estimation of nodal power consumption based on battery-specific characteristics.
where:
From Equation (17) to Equation (22), the same procedure applied for Nissan is extended to the remaining EV brands (Kia, Renault, and BYD). In each case, the number of EVs assigned to a given busbar is estimated based on the probabilistic allocation method, and the total power demand is calculated by multiplying the voltage differential derived from the variation in state of charge by the charging current specific to each battery model. These equations provide a brand-specific estimation of energy demand at each busbar, integrating both the quantity of vehicles assigned and their corresponding electrical characteristics.
Equation (23) calculates the total power demand at each busbar by summing the individual power contributions from all EV brands assigned to that busbar. This aggregated value represents the complete electrical load generated by electric vehicle charging and serves as a key input for the power flow analysis. It is essential for evaluating the operating conditions of the distribution network, particularly for assessing line loadability and identifying potential overloads under different EV penetration scenarios. Although the battery model used in this study reflects a dynamic behavior, since the voltage depends on the initial and final state of charge (), it is important to clarify that no temporal progression is explicitly simulated. The power demand per vehicle is calculated based on the voltage differential associated with the change, but the process is considered as a single charging event under maximum load conditions, rather than as a time-dependent simulation. As such, the battery model contributes to a more realistic estimation of nodal demand, without requiring a full temporal charging profile.
2.2.3. Loadability of the Distribution System
Loadability was evaluated as the percentage increase in distribution line power relative to the rated power before EV integration. This calculation was performed for each line of the 138 kV EPS (Electric Power System), considering both homogeneous and non-homogeneous scenarios at different EV penetration levels. The analysis focused on identifying lines most sensitive to EV integration, accounting for loadability effects, the power transmitted through each line, and demand variations at individual busbars.
For the loadability calculation, a power flow analysis was performed using the Newton–Raphson method. This method was selected due to its quadratic convergence characteristics and ability to handle nonlinear, multi-node systems. The primary objective was to determine system parameters while accounting for the additional demand generated by EVs.
Equation (24) computes the active power injected at each busbar, considering both line impedance and nodal voltage levels. This equation represents the total power contribution from all inter-busbar connections. Equation (25) determines the reactive power injection at each busbar, following a similar formulation to Equation (24). This calculation captures the reactive component of line power flow, which is influenced by the specific characteristics of each transmission line.
Equations (26) and (27) represent the power mismatch between the generated power minus the nodal power demand and the specified active power injection at the busbar. This variance is used to evaluate the convergence of the Newton–Raphson method, where values approaching zero indicate the system has reached a steady-state condition.
Equation (28) represents the system of linear equations that need to be solved iteratively by the Newton–Raphson method. This equation updates the state variables to bring the system closer to convergence. The state variables are the angles and voltages of the system. Equation (29) represents the linearized terms of the Jacobian matrix, which contains the partial derivatives of the active and reactive power with respect to the phase angles for the case of H and M and the voltage magnitudes for the case of N and L. This matrix is used to linearize the system of power flows.
Equation (30) calculates the loadability of a distribution line, defined as the percentage of the line’s power flow relative to its maximum transfer capacity (). This equation allows us to determine the utilization level of distribution lines and represents a critical value for identifying potential overloads. Additionally, a critical loadability threshold of 90% is considered, meaning that when this value is exceeded, the line is assumed to be operating under overload risk conditions. This threshold was used as a reference to analyze the system’s behavior under different levels of EV penetration.
For the loadability and system operation analysis, technical limits for voltage and angle were established. In particular, a voltage operating range of ±5% relative to the nominal value of 1 p.u. was considered. Likewise, an operational limit of ±40 degrees was set for the phase angles, ensuring stable system operation under both normal and high-load conditions. These criteria were used to verify the validity of the results obtained across the different simulated scenarios.
The proposed methodology is summarized in Algorithm 1, which outlines the complete workflow of the simulation model, from data input to the loadability analysis. Each step of the algorithm corresponds to a methodological stage described in the manuscript: input data (Step 1), dynamic EV battery modeling using dependent parameters (Step 2), stochastic brand assignment via Monte Carlo simulation (Step 3), nodal EV demand estimation based on voltage differential and charging current (Step 4), and finally, power flow and loadability analysis using Newton-Raphson and contingency-based metrics (Step 5).
| Algorithm 1 OST with loadability analysis and contingency rankings |
|
3. Results
This section presents the results of the proposed methodology applied to the 138 kV distribution system of the Quito District, Ecuador (EEQ), to evaluate the impact of massive EV integration in both homogeneous and non-homogeneous distribution scenarios for 800 and 25,000 EVs. The results include the system topology (Figure 2), battery modeling, EV demand distribution, and system loadability. The system is presented in Table 2, Table 3 and Table 4.
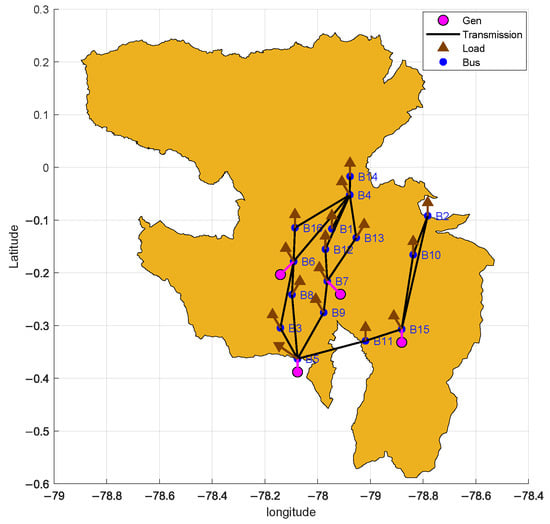
Figure 2.
Quitos Electrical Power System.
Table 2.
Generation data of the EEQ system.
Table 3.
Demand data of the Quito system.
Table 4.
Distribution line data of the Quito system.
3.1. Case Study
The 138 kV distribution system of Quito, Ecuador, was selected as the case study, detailed in Table 2 and Table 3 and represented in Figure 2. Table 2 summarizes the generation data, with four generators representing the connection to the Ecuadorian national interconnected system, including a slack generator at busbar 5 and PV generators at busbar 6, 7, and 15. All generator buses were assigned a voltage magnitude of 1.00 p.u., with the slack busbar having a phase angle of 0°, as required for power flow analysis. These values were used consistently throughout the simulation process. Table 3 lists the active and reactive power demands at each bus. Table 4 provides the electrical parameters of the distribution lines, including resistance (R), reactance (X) in the per-unit system, and the maximum amount of power each line can transmit (known as SIL). Figure 2 shows the georeferenced topology of the EEQ system.
Figure 3 shows the single-line diagram of the 138 kV distribution system. This schematic representation complements the georeferenced view by illustrating the electrical connectivity and topology of the system. The single-line diagram is essential for understanding the operational structure of the network and serves as the basis for power flow analysis, EV nodal allocation, and line loadability evaluation under different penetration scenarios. This figure provides the electrical foundation upon which the simulation developed in this study is based.
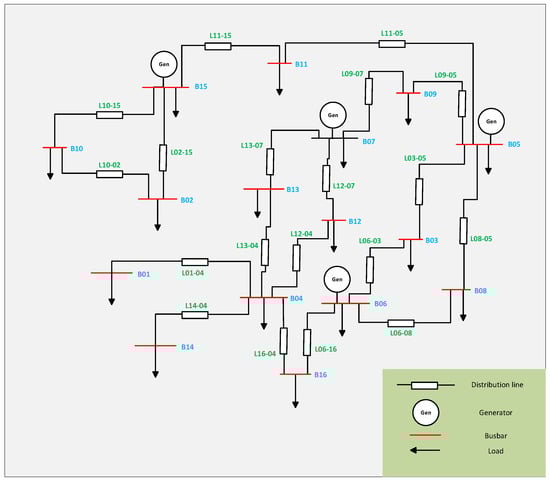
Figure 3.
Single-Line Diagram of the Quito Electrical Power System.
3.2. Battery Modeling
The battery modeling results demonstrate the dynamic behavior of voltage levels as a function of the state of charge (SOC) for lithium-ion batteries used in electric vehicles. The model effectively captures the nonlinear voltage response, as formulated in Equations (2)–(11), and reflects the charging characteristics of four representative EV brands in the Ecuadorian market.
Figure 4 presents the short- and long-term transient resistance behavior of the lithium-ion battery models for the electric vehicles analyzed. In the short term Figure 4a, resistance values vary slightly: 0.1 ohms for BYD, 0.07 ohms for Kia and Renault, and 0.04 ohms for Nissan. In the long term Figure 4b, the resistance is more uniform, with 0.07 ohms for Renault and 0.04 ohms for the other models. This suggests that, despite initial differences, the long-term resistive behavior of all batteries is similar and stabilizes over time.
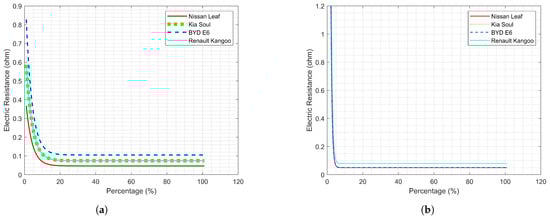
Figure 4.
Transient internal resistance: (a) Short transient internal resistance. (b) Long transient internal resistance.
Figure 5 show the short- and long-term transient capacitance behavior of the electric vehicles analyzed. In Figure 5a, BYD exhibits the highest capacitance (1584.29 F) and Nissan the lowest (703 F), while Kia and Renault share a value of 1121.16 F. In Figure 5b, Kia and Renault again show the highest capacitance (7137.6 F), compared to 4542.12 F for Nissan and BYD. These results indicate that Kia and Renault have greater energy-storage capacity during long-term transients, whereas BYD stands out in short-term conditions.
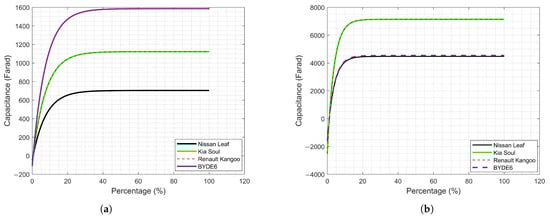
Figure 5.
Transient internal capacitance: (a) Short transient internal capacitance. (b) Long transient internal capacitance.
Figure 6 shows the output voltage of each battery as a function of SOC percentage. For the Kia, BYD, and Renault brands, the voltage ranges between 398 and 400 volts, with the highest voltage level observed for the BYD E6. In contrast, a lower voltage level between 373 and 374 volts is presented for Nissan. The nonlinear relationship between SOC and voltage is evident, showing more pronounced increases at both low and high charge levels, which is consistent with dynamic battery modeling.
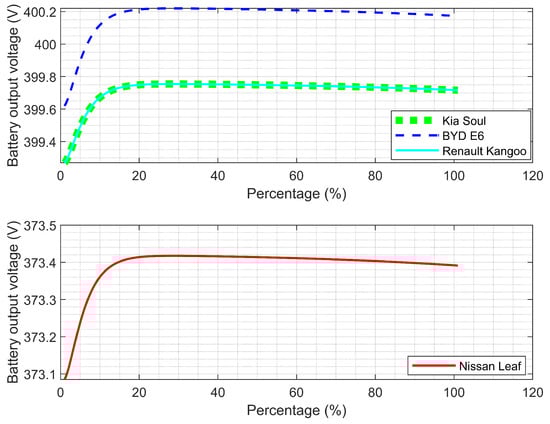
Figure 6.
Voltage behavior at different SOC levels.
Table 5 presents the power demand required by an EV, with power estimated by EV brand at a minimum SOC of 12%. These values range from 23.71 kW to 78.04 kW. The results highlight that BYD EVs have the highest power demand due to their higher-capacity batteries, which significantly impacts the distribution system’s loadability.
Table 5.
Power per hour required by an EV battery when its SOC is minimum.
3.3. EV Demand Distribution in the EEQ System
Table 6 details the EV distribution according to their market share, with Nissan representing 46.82%, followed by Kia with 23.96%, Renault with 21.92%, and BYD with 7.3%. This distribution was used to allocate EV demand across system buses according to Equations (13)–(22).
Table 6.
Estimated EV quantity for the case studies.
Table 6 presents the number of EVs per brand to be incorporated into the system as demand. The EV demand distribution across each system bus is shown for each of the cases presented below.
3.3.1. EVs Homogeneous Distribution in the EEQ System
Table 7 presents the additional demand generated by 800 and 25,000 EVs for a homogeneous distribution scenario, where EVs are equally distributed across all buses. Consequently, the EV power is uniformly allocated to all buses according to the values shown in the table. For the 800 EV case, the additional demand per bus ranges between 0.20 MW and 0.43 MW—values that do not represent a significant system increase. In contrast, for 25,000 EVs, the demand increases substantially, ranging between 6.28 MW and 13.56 MW.
Table 7.
Homogeneous distribution of EVs in the different busbars of the system.
3.3.2. EVs Non-Homogeneous Distribution in the EEQ System
Table 8 shows the EV demand in a non-homogeneous scenario, where EV distribution and demand allocation are determined by the Monte Carlo method, reflecting a more realistic demand pattern than the homogeneous Case I. For the 800 EV case, demand ranges from 0 MW (buses with no EV presence) up to 0.36 MW. For the 25,000 EV case, demand varies between 0 MW and reaches a maximum of 11.53 MW.
Table 8.
Non-homogeneous distribution of EVs in the different busbars of the system.
3.4. EEQ System Loadability
This section evaluates the loadability of the 138 kV EEQ distribution system under massive EV integration. The analysis examines results from both homogeneous and non-homogeneous scenarios, considering different penetration levels of 800 and 25,000 EVs, while identifying the lines most sensitive to load increases.
Figure 7 displays the loadability of Quito’s 138 kV distribution system without EV integration. The diagram presents the system topology and distribution lines according to their respective loadability percentages, visualized through a heat color scale: blue indicates low loadability (10%) while red represents high loadability (70%). In the EEQ system without EVs, specific lines like 11–5, 10–15, and 1–4 already exhibit 70% loadability.
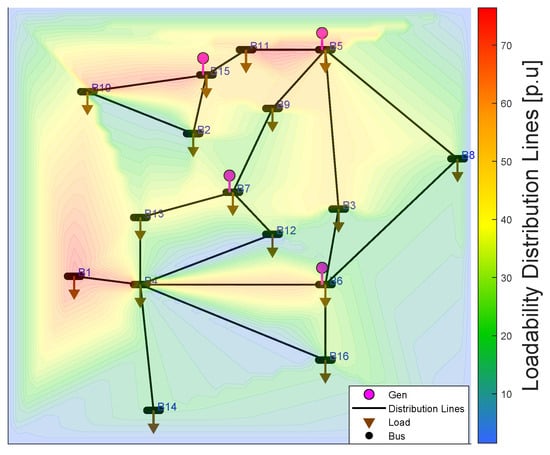
Figure 7.
Loadability analysis of the EEQ system without EV integration.
3.4.1. EVs Homogeneous Distribution in the EEQ System
Figure 8 presents the loadability of the EEQ system under a homogeneous distribution scenario, with a color scale ranging from 10% to 120%. In scenario (a) with 800 EVs, loadability shows a moderate increase compared to the initial condition (Figure 7). Most distribution lines maintain their original color tones, indicating a controlled system impact, where the most loaded lines remain below 75% capacity.
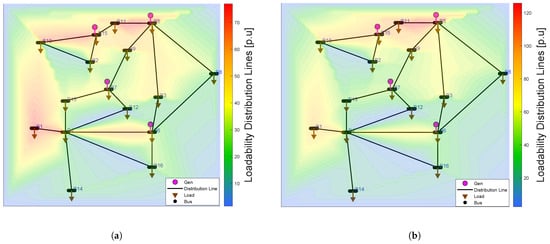
Figure 8.
Loadability analysis of the EEQ system with EV integration in a homogeneous scenario: (a) Loadability analysis of the EEQ system for the integration of 800 EVs. (b) Loadability analysis of the EEQ system for the integration of 25,000 EVs.
In contrast, scenario (b) with 25,000 EVs demonstrates a significant loadability increase, with multiple lines showing 60–80% loadability through different color shades. Certain lines connected to high-demand buses experience overloading, exceeding the 100% maximum threshold—specifically lines L10–15 and L11–5.
Figure 9 shows the active power flow (in MW) through each distribution line of the EEQ system under homogeneous allocation. Three conditions are compared: (1) no EV integration, (2) 800 EV integration, and (3) 25,000 EV demand increase.
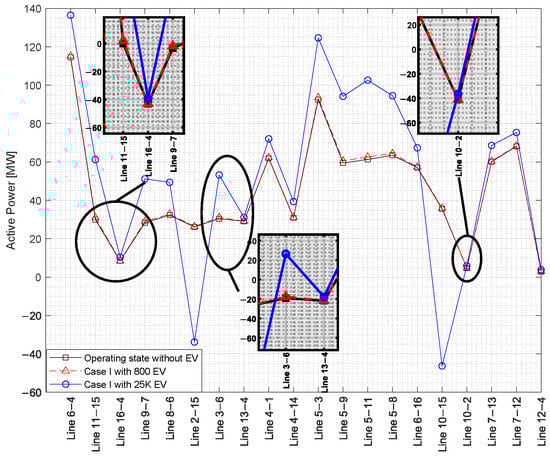
Figure 9.
Power distributed by each line of the EEQ system for the homogeneous case study.
In the baseline scenario without EVs, power flows vary naturally and serve as the reference for comparison. With 800 EVs (representing 4.77 MW total demand uniformly distributed), the system shows moderate power flow increases while maintaining adequate supply capacity. Lines L16–4, L13–4, and L10–2 show negligible flow changes, while lines L5–3, L5–11, and L3–6 exhibit more pronounced increases—though all remain within transmission capacity limits.
The 25,000 EV scenario (149.60 MW homogeneous demand) demonstrates dramatic flow increases, particularly in lines L5–3, L5–11, L3–6, L10–15, and L11–15. These results highlight the necessity of enhanced distribution capacity across multiple lines; the critical importance of real-time monitoring systems during EV transition phases; and the proportional relationship between EV penetration levels and network stress
3.4.2. EVs Non-Homogeneous Distribution in the EEQ System
In Figure 10, an analysis of the loadability of the EEQ system is presented, comparing scenario (a) with a demand increase due to 800 EVs and scenario (b) with the integration of a demand from 25,000 EVs, against the initial state without EVs. The system’s behavior shows adequate loadability, ranging between 40% and 50% of its maximum load, with a percentage no greater than 70%, concentrated in areas near the generation buses. With the demand increase from 800 EVs, Figure 10a shows a slight increase, with a maximum loadability of 72%, mainly in lines L1–4, L10–15, and L11–5, while most lines maintain adequate values between 40% and 60%. In contrast, with the demand increase from 25,000 EVs, as shown in Figure 10b, the loadability rises drastically, reaching 95% in lines such as L11–15, L9–5, L10–15, L11–5, and L1–4. This indicates that the system’s energy demands are high and that the lines are close to their operational limits, highlighting the system’s vulnerability to massive EV penetration.
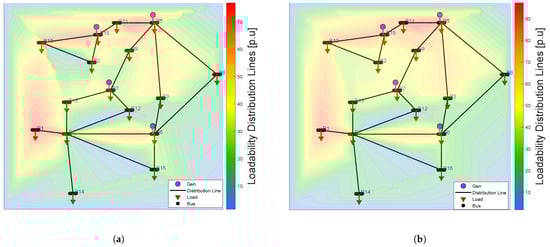
Figure 10.
Loadability analysis of the EEQ system with EV integration in a non-homogeneous scenario: (a) Loadability analysis of the EEQ system for the integration of 800 EVs. (b) Loadability analysis of the EEQ system for the integration of 25,000 EVs.
Figure 11 shows the active power flow through each distribution line of the EEQ system under non-homogeneous allocation. With 800 EVs, power flows increase slightly—lines L16–4, L9–7, L13–4, and L10–2 show values similar to the EV-free scenario. However, the 25,000 EV scenario demonstrates significant power flow increases, particularly in lines L10–15, L5–8, L5–3, and L2–15, which exhibit elevated power distribution due to concentrated demand. These lines display critical behavior under a high power concentration. Compared to the baseline, the 25,000 EV case reveals substantial variation caused by EV integration into the EEQ power system.
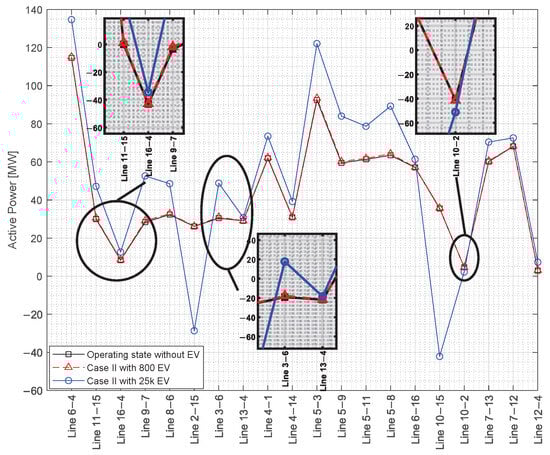
Figure 11.
Power distributed by each line of the EEQ system for the non-homogeneous case study.
Figure 12 and Figure 13 show the voltage and angle behavior at each bus of the system under the different scenarios analyzed. In Figure 12, it can be observed that the voltage remains within the acceptable operational range (0.95–1.05 p.u.), although a progressive reduction is evident as EV penetration increases, particularly at buses 1, 2, and 12. In contrast, Figure 13 illustrates the variation in voltage angle (in degrees), where a greater angular deviation is also observed as the EV charging demand increases. Although the system operates within the defined limits, it approaches critical conditions under high-EV-penetration scenarios.
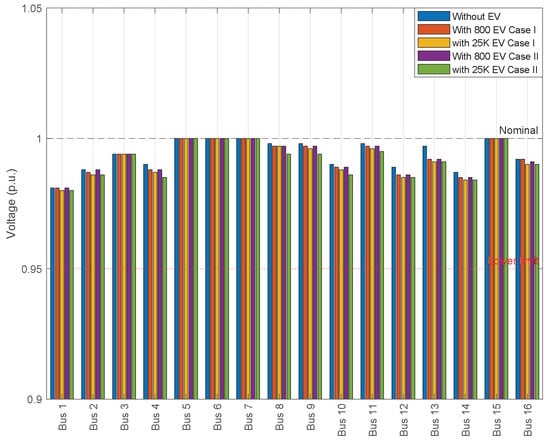
Figure 12.
Busbar voltage levels.
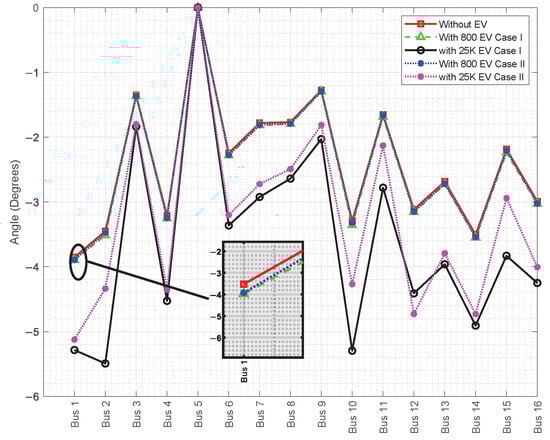
Figure 13.
Angle Variations Across Busbar.
4. Discussions
This study evaluates the operational behavior of the EEQ under different levels of EV penetration using a probabilistic modeling approach. The results indicate that, although the system remains within technical limits, high-penetration scenarios cause overloads exceeding 90% on critical lines such as L10–15, L11–5, L5–11, and L4–1, in both homogeneous and non-homogeneous distributions. These conditions compromise the system, revealing that the current infrastructure is not yet ready for large-scale electrification without reinforcements and demand management strategies. These findings highlight the need for proactive planning by utilities. While the international literature emphasizes integrating renewable energy in such analyses, this study did not include it, as EEQ’s 138 kV system currently lacks renewable generation. The main objective was to characterize the system’s actual operating conditions under realistic infrastructure constraints.
Similarly, although strategies such as demand response and time-of-use tariffs effectively mitigate EV-related impacts in other countries, they were not applied in this study because, under the current Ecuadorian regulatory framework, the electricity tariff is fixed and does not vary by time of day. This reality currently limits the practical application of differentiated pricing schemes. Nevertheless, their potential as complementary tools to manage future demand in high EV penetration scenarios is acknowledged.
This study presents limitations that should be considered when interpreting the results. The simulation was developed under a maximum simultaneous charging scenario, without modeling hourly load profiles or dynamic user behavior, which limits the temporal scope of the analysis. Moreover, the spatial allocation of EVs does not incorporate sociodemographic variables or residential usage patterns, although their importance is recognized and their inclusion is proposed for future work. Despite these limitations, the adopted approach is valid for evaluating the structural behavior of the system under critical scenarios, providing relevant results for planning reinforcements in the context of the energy transition.
To contextualize the results obtained, a comparison was made with similar studies conducted in other regions of the Americas. Table 9 presents the main impacts reported on distribution networks due to EV penetration, as well as the improvement needs identified in each case. This comparison shows that the behavior observed in the EEQ system, particularly in terms of critical line overloads, is consistent with the challenges faced by other electric systems in scenarios of increasing EV adoption.
Table 9.
Comparison of impacts on the distribution grid due to EV penetration.
Another indispensable aspect in countries with more mature EV integration is the study of power quality, primarily focusing on total harmonic distortion of voltage (THDv) and imbalances, as reported in Colombia by [14]. Although the current article does not focus on power-quality analysis, given Ecuador’s low EV penetration compared to other countries, this is a crucial form of analysis that will be addressed in future work. Additionally, in Latin America [30], further challenges have been identified, such as the lack of standardization in connectors and the need for advanced technologies to manage non-linear loads.
When drawing comparisons with other regions, a mixed scenario emerges. While Brazil and Costa Rica are advancing in electric mobility through the integration of renewable resources [19,30], California faces severe grid strain (with peak loads reaching up to 300%) [2]. In Ecuador, particularly in Quito, strategies for EV integration are beginning to be explored. The focus is shifting towards planning and verifying that the existing system can support EV demand and proactively considering the mitigation of future consumption peaks caused by EVs.
These findings underscore the need for a comprehensive approach to integrating EVs in Quito. While the current system has the capacity to support EV penetration, it requires significant enhancements for mass adoption. Regional and global comparisons highlight common challenges. Initially, the verification, analysis, and proactive planning of the EEQ system must be prioritized to address the objectives set for 2030 and 2040, respectively.
5. Conclusions
The results of this study highlight the significant impact that high EV penetration can have on the EEQ system. With the demand increase from 800 EVs, the system operates within acceptable limits, the flow increase through the distribution lines is considerable but does not significantly affect system operation; but with the demand increase produced by 25,000 EVs, there are critical lines such as L10–15, L11–5 and L1–4 that approach and in some cases exceed their capacity.
Although the model was able to capture the stochastic variability of EV growth, several methodological limitations should be addressed in future research. These include the absence of an explicit temporal dimension, as well as the lack of integration of sociodemographic variables, traffic density, and time-dependent mobility patterns. Nevertheless, these limitations do not invalidate the results obtained, as the model was designed to evaluate critical structural conditions within the current context of the Ecuadorian distribution system. In the specific case of the EEQ system, the identification of vulnerable lines highlights the need for targeted infrastructure investments. Distribution companies must prioritize the monitoring and reinforcement of these lines to prevent overloads and ensure reliable service especially considering the goals set by the National Electromobility Strategy, which aims to reach 10,000 EVs in the short term and 100,000 EVs by 2030.
The presented methodology provides valuable information to evaluate the behavior of the EEQ system; this methodology is transferable to other distribution systems where demand growth from EVs is projected. However, local factors such as system topology, existing demands, and EV penetration rates are fundamental for each case study.
6. Future Work
A time-explicit model will be developed to simulate hourly charging profiles, as well as dynamic user behavior and time-dependent mobility patterns, and to analyze differentiated pricing schemes such as time-of-use tariffs to evaluate system performance over time.
We plan to incorporate the limitations of the charging infrastructure, along with the progressive integration of distributed renewable generation particularly photovoltaic solar energy as a mitigation measure against overloads associated with high-demand scenarios. Its impact will be evaluated in hypothetical infrastructure development scenarios, where its contribution to reinforcement planning will be analyzed within the framework of the energy transition.
We suggest that the spatial allocation of EVs could be improved by incorporating sociodemographic variables and vehicle density. This will enable a more realistic representation of the location and concentration of charging points, in contrast to the current approach based solely on geographic distance. Furthermore, projections of EV fleet growth will be included using technology adoption curves and market data.
Author Contributions
Conceptualization, P.A.M.; methodology, A.L.M., P.A.R. and P.A.M.; software, A.L.M. and P.A.R.; validation, A.L.M., P.A.R., P.A.M. and L.G.C.; formal analysis, A.L.M., P.A.R. and P.A.M.; investigation, A.L.M., P.A.R. and L.G.C.; resources, P.A.R.; data curation, A.L.M., P.A.R. and W.R.F.; writing—original draft, A.L.M., P.A.R., L.G.C. and W.R.F.; writing—review and editing, L.G.C., W.R.F. and P.A.M.; visualization, L.G.C. and P.A.M.; supervision, P.A.M.; project administration, P.A.M.; funding acquisition, P.A.M. All authors have read and agreed to the published version of the manuscript.
Funding
This research received no external funding.
Data Availability Statement
The original contributions presented in this study are included in the article. Further inquiries can be directed to the corresponding author.
Acknowledgments
The authors would like to thank the Universidad de las Fuerzas Armadas ESPE for the support provided during the development of this research.
Conflicts of Interest
The authors declare no conflicts of interest.
Abbreviations
The following abbreviations are used in this manuscript:
| SOC | Percentage of battery state of charge |
| Series resistor voltage | |
| V1 | Voltage of the first parallel branch |
| V2 | Voltage of the second parallel branch |
| Initial battery voltage | |
| Battery voltage | |
| I | Battery-charged current |
| Rs | Internal series resistance of source Voc |
| Rt1, Ct1 | Component of the short-term transient response |
| Rt2, Ct2 | Component of the long-term transient response |
| EV | Electric vehicle |
| Probability of buying a Nissan electric vehicle | |
| Probability of buying a Kia electric vehicle | |
| Probability of buying a Renault electric vehicle | |
| Probability of buying a BYD electric vehicle | |
| Electric demand of Nissan electric vehicle | |
| Electric demand of Kia electric vehicle | |
| Electric demand of Renault electric vehicle | |
| Electric demand of BYD electric vehicle | |
| Number of Nissan Electric Vehicles | |
| Number of Kia Electric Vehicles | |
| Number of Renault Electric Vehicles | |
| Number of BYD Electric Vehicles | |
| Bus | |
| Power Injected into a Bus | |
| Bus angle | |
| Bus voltage | |
| Loadability | |
| Generator active power | |
| Generator reactive power | |
| Active power demand | |
| Reactive power demand | |
| Maximum distributed power |
References
- Khan, M.O.; Kirmani, S.; Rihan, M. Impact assessment of electric vehicle charging on distribution networks. Renew. Energy Focus 2024, 50, 100599. [Google Scholar] [CrossRef]
- Jenn, A.; Highleyman, J. Distribution grid impacts of electric vehicles: A California case study. iScience 2022, 25, 103686. [Google Scholar] [CrossRef] [PubMed]
- Angelim, J.H.; Affonso, C.M. Effects of long-range electric vehicles on distribution system using probabilistic analysis. Int. J. Electr. Power Energy Syst. 2023, 147, 108868. [Google Scholar] [CrossRef]
- Betancur, D.; Duarte, L.F.; Revollo, J.; Restrepo, C.; Díez, A.E.; Isaac, I.A.; López, G.J.; González, J.W. Methodology to Evaluate the Impact of Electric Vehicles on Electrical Networks Using Monte Carlo. Energies 2021, 14, 1300. [Google Scholar] [CrossRef]
- Mancini, E.; Longo, M.; Yaici, W.; Zaninelli, D. Assessment of the Impact of Electric Vehicles on the Design and Effectiveness of Electric Distribution Grid with Distributed Generation. Appl. Sci. 2020, 10, 5125. [Google Scholar] [CrossRef]
- Nogueira, T.; Sousa, E.; Alves, G.R. Electric vehicles growth until 2030: Impact on the distribution network power. Energy Rep. 2022, 8, 145–152. [Google Scholar] [CrossRef]
- Ray, S.; Kasturi, K.; Patnaik, S.; Nayak, M.R. Review of electric vehicles integration impacts in distribution networks: Placement, charging/discharging strategies, objectives and optimisation models. J. Energy Storage 2023, 72, 108672. [Google Scholar] [CrossRef]
- Rotas, R.; Iliadis, P.; Nikolopoulos, N.; Rakopoulos, D.; Tomboulides, A. Dynamic Battery Modeling for Electric Vehicle Applications. Batteries 2024, 10, 188. [Google Scholar] [CrossRef]
- Tremblay, O.; Dessaint, L.A.; Dekkiche, A.I. A generic battery model for the dynamic simulation of hybrid electric vehicles. In Proceedings of the VPPC 2007, 2007 IEEE Vehicle Power and Propulsion Conference, Arlington, TX, USA, 9–12 September 2007; pp. 284–289. [Google Scholar] [CrossRef]
- Chen, M.; Liu, R.X.; Hao, J. An Agent-Based Real-Time Game Model for Forecasting the Market Penetration of Vehicles in China. IEEE Access 2024, 12, 24631–24643. [Google Scholar] [CrossRef]
- Lopes, J.C.; Sousa, T.; Melo, J.D. Demand Estimation for Electric Vehicle Charging Infrastructure: An Extensive Approach Method. IEEE Access 2024, 12, 113215–113234. [Google Scholar] [CrossRef]
- Wang, B.; Dehghanian, P.; Zhao, D. Coordinated Planning of Electric Vehicle Charging Infrastructure and Renewables in Power Grids. IEEE Open Access J. Power Energy 2023, 10, 233–244. [Google Scholar] [CrossRef]
- Hussain, A.; Bui, V.H.; Kim, H.M. A Decentralized Dynamic Pricing Model for Demand Management of Electric Vehicles. IEEE Access 2023, 11, 13191–13201. [Google Scholar] [CrossRef]
- Bernal-Vargas, J.B.; Castro-Galeano, J.C.; Tibaduiza-Rincón, E.E.; López-Lezama, J.M.; Muñoz-Galeano, N. Prospective Analysis of Massive Integration of Electric Vehicle Chargers and Their Impact on Power Quality in Distribution Networks. World Electr. Veh. J. 2023, 14, 324. [Google Scholar] [CrossRef]
- Gómez-Ramírez, G.A.; Solis-Ortega, R.; Ross-Lépiz, L.A. Impact of electric vechicles on power transmission grids. Heliyon 2023, 9, e22253. [Google Scholar] [CrossRef]
- González, L.G.; Siavichay, E.; Espinoza, J.L. Impact of EV fast charging stations on the power distribution network of a Latin American intermediate city. Renew. Sustain. Energy Rev. 2019, 107, 309–318. [Google Scholar] [CrossRef]
- Gómez-Ramírez, G.A.; Solis-Ortega, R. Electric Vehicle Penetration Modelling for Costa Rica Power System. In Proceedings of the 2021 IEEE CHILEAN Conference on Electrical, Electronics Engineering, Information and Communication Technologies (CHILECON), Online, 6–9 December 2021; pp. 1–6. [Google Scholar] [CrossRef]
- Maldonado, J.; Jain, A.; Castellanos, S. Assessing the impact of electric vehicles in Mexico’s electricity sector and supporting policies. Energy Policy 2024, 191, 114152. [Google Scholar] [CrossRef]
- Mohammad, A.; Zamora, R.; Lie, T.T. Integration of Electric Vehicles in the Distribution Network: A Review of PV Based Electric Vehicle Modelling. Energies 2020, 13, 4541. [Google Scholar] [CrossRef]
- Mondal, S.; Acharjee, P.; Bhattacharya, A. Determination of maximum additional load for EV charging station considering practical security limits. J. Eng. Appl. Sci. 2023, 70, 1–17. [Google Scholar] [CrossRef]
- Moniot, M.; Ge, Y.; Wood, E. Estimating Fast Charging Infrastructure Requirements to Fully Electrify Ride-Hailing Fleets Across the United States. IEEE Trans. Transp. Electrif. 2022, 8, 2177–2190. [Google Scholar] [CrossRef]
- Ni, X.; Lo, K.L. A Methodology to Model Daily Charging Load in the EV Charging Stations Based on Monte Carlo Simulation. In Proceedings of the 2020 8th International Conference on Smart Grid and Clean Energy Technologies, ICSGCE 2020, Kuching, Malaysia, 4–7 October 2020; Institute of Electrical and Electronics Engineers Inc.: Kuching, Malaysia, 2020; pp. 125–130. [Google Scholar] [CrossRef]
- Jia, Z.; Li, J.; Zhang, X.P.; Zhang, R. Review on Optimization of Forecasting and Coordination Strategies for Electric Vehicle Charging. J. Mod. Power Syst. Clean Energy 2023, 11, 389–400. [Google Scholar] [CrossRef]
- Xing, Y.; Li, F.; Sun, K.; Wang, D.; Chen, T.; Zhang, Z. Multi-type electric vehicle load prediction based on Monte Carlo simulation. Energy Rep. 2022, 8, 966–972. [Google Scholar] [CrossRef]
- Yang, X.; Yun, J.; Zhou, S.; Lie, T.T.; Han, J.; Xu, X.; Wang, Q.; Ge, Z. A spatiotemporal distribution prediction model for electric vehicles charging load in transportation power coupled network. Sci. Rep. 2025, 15, 4022. [Google Scholar] [CrossRef] [PubMed]
- Wang, S.; Liu, B.; Li, Q.; Han, D.; Zhou, J.; Xiang, Y. EV Charging Behavior Analysis and Load Prediction via Order Data of Charging Stations. Sustainability 2025, 17, 1807. [Google Scholar] [CrossRef]
- Li, Z.; Li, C.; Zhang, B.; Duan, Q.; Liu, L.; Zu, G.; Li, Q. Research on new energy vehicle charging prediction based on Monte Carlo algorithm and its impact on distribution network. Front. Energy Res. 2023, 11, 1269041. [Google Scholar] [CrossRef]
- Jia, W.; Chen, H.; Liu, X. Research on electric vehicle charging load based on the monte Carlo. J. Phys. Conf. Ser. 2023, 2450, 012002. [Google Scholar] [CrossRef]
- Usman, H.M.; Elshatshat, R.; El-Hag, A.H. Distribution Transformer Remaining Useful Life Estimation Considering Electric Vehicle Penetration. IEEE Trans. Power Deliv. 2023, 38, 3130–3141. [Google Scholar] [CrossRef]
- Martínez-Gómez, J.; Espinoza, V.S. Challenges and Opportunities for Electric Vehicle Charging Stations in Latin America. World Electr. Veh. J. 2024, 15, 583. [Google Scholar] [CrossRef]
- Villanueva-Machado, C.W.; Luyo, J.E.; Ríos-Villacorta, A. Monte Carlo simulation of uncontrolled Electric Vehicle charging impact on distributed generation. Ingenius 2023, 2023, 120–134. [Google Scholar] [CrossRef]
- Elghanam, E.; Alzaatreh, A.; Hassan, M.S.; Osman, A.H. A Data-Driven Approach for EV Electricity Demand Modeling Using Spatial Regression: A UAE Case Study. IEEE Access 2024, 12, 57302–57314. [Google Scholar] [CrossRef]
- Lou, Y.L.; Wu, C.X.; Shi, Z.Z.; Yang, R. Evaluation of EV penetration level limit in distribution system applying charging and scheduling strategies. Sustain. Energy Grids Netw. 2022, 32, 100922. [Google Scholar] [CrossRef]
- Yang, Z.; Huang, X.; Gao, T.; Liu, Y.; Gao, S. Real-Time Energy Management Strategy for Parking Lot Considering Maximum Penetration of Electric Vehicles. IEEE Access 2022, 10, 5281–5291. [Google Scholar] [CrossRef]
- Rossi, F.; Diaz-Londono, C.; Li, Y.; Zou, C.; Gruosso, G. Smart Electric Vehicle Charging Algorithm to Reduce the Impact on Power Grids: A Reinforcement Learning Based Methodology. IEEE Open J. Veh. Technol. 2025, 6, 1072–1084. [Google Scholar] [CrossRef]
- Sahoo, J.P.; Ray, R.; Prakash, R.; Sivasubramani, S. Impacts of Plug-in EVs and decentralized power generation on distribution system operation. E-Prime—Adv. Electr. Eng. Electron. Energy 2024, 9, 100658. [Google Scholar] [CrossRef]
- Valenzuela, A.; Montalvo, I.; Singaña, C.B. Electrical vehicle: Facing future challenges in Quito. In Proceedings of the 2017 IEEE PES Innovative Smart Grid Technologies Conference— Latin America, ISGT Latin America 2017, Quito, Ecuador, 20–22 September 2017; pp. 1–6. [Google Scholar] [CrossRef]
- Mohamed, A.A.A.; Lojano, S.; Maldonado, C.; Ibrahim, T.; Mostafa, H.E.; Sarkar, R.; Soujad, T.; Rezk, H.; AlDhaifallah, M. Can charge scheduling incentives mitigate the impact of EVs on the power grid? Energy Rep. 2023, 9, 4337–4344. [Google Scholar] [CrossRef]
- Gao, S.; Li, H.; Jurasz, J.; Dai, R. Optimal Charging of Electric Vehicle Aggregations Participating in Energy and Ancillary Service Markets. IEEE J. Emerg. Sel. Top. Ind. Electron. 2021, 3, 270–278. [Google Scholar] [CrossRef]
- Biju, N.; Fang, H. On the Design of An Equivalent Circuit Model for Lithium-Ion Batteries Operating Across Broad Current Ranges. IFAC-PapersOnLine 2023, 56, 7127–7133. [Google Scholar] [CrossRef]
- Chen, M.; Rincón-Mora, G.A. Accurate electrical battery model capable of predicting runtime and I-V performance. IEEE Trans. Energy Convers. 2006, 21, 504–511. [Google Scholar] [CrossRef]
Disclaimer/Publisher’s Note: The statements, opinions and data contained in all publications are solely those of the individual author(s) and contributor(s) and not of MDPI and/or the editor(s). MDPI and/or the editor(s) disclaim responsibility for any injury to people or property resulting from any ideas, methods, instructions or products referred to in the content. |
© 2025 by the authors. Published by MDPI on behalf of the World Electric Vehicle Association. Licensee MDPI, Basel, Switzerland. This article is an open access article distributed under the terms and conditions of the Creative Commons Attribution (CC BY) license (https://creativecommons.org/licenses/by/4.0/).