Abstract
Road traffic significantly impacts global energy consumption and emissions, both of which contribute to climate change. Thus, energy conservation and emission reduction in road transportation are critical concerns, and traffic flow modeling is key to evaluating and improving these metrics. Therefore, this paper develops a microscopic traffic model to characterize energy consumption reflecting driver energy saving awareness. The well-known Intelligent Driver (ID) model cannot predict traffic dynamics within an energy saving driving environment because it is based on a fixed acceleration exponent. Simulation results are presented which demonstrate that the energy consumption in the proposed model decreases as driver energy saving awareness increases. Furthermore, traffic, in the proposed model, experiences smaller variations in flow, speed, acceleration, and density, higher speeds, and less congestion compared to the ID model. Thus, the proposed model can be employed to conserve energy and reduce emissions, thereby decreasing the overall carbon footprint of traffic and contributing to a more sustainable environment.
1. Introduction
Climate change and air pollution are significant global challenges that are now critical concerns [1]. Transportation contributes substantially to energy consumption and emissions, exacerbating these problems. According to the International Energy Agency (IEA), in 2021, the transportation sector was responsible for almost 30% of the total energy consumption in major countries [2], leading to over 8000 Mt of emissions [3]. Road transportation accounts for 75% of this energy [4]. The global energy consumption by the transportation sector is estimated to increase to quadrillion Btu by , an increase of quadrillion Btu from [5]. In Canada, from 1990 to 2017, the total energy consumption in the transportation sector increased by , and the associated greenhouse gas (GHG) emissions increased by 40% from Mt to Mt [6]. In Saudi Arabia, which is one of the largest per capita oil consumers in the world, road transportation accounts for of the total energy consumption, translating to approximately 4.698 trillion Btu equivalent per day [7]. Therefore, achieving energy conservation and emission reduction in urban road transportation is crucial to mitigate climate change.
Traffic flow modeling is crucial to energy conservation and emission reduction [8]. It is also important for road planning, intelligent transportation system design, and route guidance [9,10]. Traffic models are used to characterize traffic behavior, leading to improved utilization of road infrastructure which reduces congestion and traffic delays and improves safety [11,12,13,14].
Traffic models are categorized as microscopic, macroscopic, or mesoscopic. Microscopic models consider individual vehicle characteristics using parameters such as speed, position, acceleration, and headway [15,16]. They typically employ ordinary differential equations and, as a result, are easy to evaluate [15]. Macroscopic models consider the average behavior of traffic by considering density, flow, and speed and are based on partial differential equations [17]. Mesoscopic models combine individual and average vehicle behavior [18].
The first microscopic traffic models were introduced in [19,20]. However, they are too simple to depict traffic dynamics accurately. A model characterizing vehicle behavior in dense traffic conditions was developed in [21]. However, it neglects variations in driver behavior and, therefore, results in unrealistic acceleration [22]. In [23], a model considering driver reaction was proposed to reduce congestion and improve traffic stability. However, it ignores speed differences, causing unstable traffic behavior and accidents due to small distances between vehicles [22]. In [24], a model considering speed differences was developed that accurately characterizes vehicle behavior in dense traffic, but it can lead to collisions due to high speeds. The Intelligent Driver (ID) model was developed in [25]. It is based on driver response and can produce realistic acceleration and deceleration behavior. The ID model is widely used because it provides better results than earlier models. However, it employs a fixed acceleration exponent to characterize driver behavior, an approach that is not representative of real-world traffic conditions, leading to unrealistic traffic characterization. Several improvements have been made to the ID model such as incorporating driver reaction and sensitivity [26], driver response based on deceleration at intersections [27], and defensive driving behavior [28]. The ID model has been implemented in Adaptive Cruise Control (ACC) and cooperative ACC [29,30] systems. Furthermore, it has been employed for Connected Autonomous Vehicles (CAVs) to improve passenger comfort and safety [31,32] and traffic stability [33].
Ongoing energy concerns have prompted drivers to increasingly adopt driving strategies that reduce energy consumption. The goal is to limit vehicle movement to reduce fuel costs. However, traditional traffic models cannot effectively characterize the effect of driver energy saving behavior on traffic flow. Therefore, they cannot accurately and realistically depict real-world traffic dynamics considering energy concerns.
Several traffic models have been developed to analyze the energy consumption characteristics of traffic flow dynamics. The models developed in [34,35,36] consider changes in kinetic energy. The energy used by electric vehicles during lane changes was investigated in [16]. A transient fuel consumption model was proposed in [10,37] to assess energy consumption behavior. In [38], a fuel-efficient model was presented to evaluate vehicle energy saving capabilities. A model considering global optimality to reduce energy consumption was given in [39]. However, these models are based on changes in kinetic energy during deceleration and ignore factors such as road friction, air resistance, and internal vehicle energy consumption, so they do not accurately represent the total energy consumed by a vehicle. Thus, a new model is required to better predict the energy consumption characteristics of traffic flows.
In this paper, a microscopic energy consumption model is developed considering driver energy saving awareness. First, the relationship between energy consumption and traffic flow parameters is established. Then, the performance of the proposed and ID models is examined over a m circular road using MATLAB R2023a. The models are quantized using the Euler technique and the traffic behavior is observed for s. A flow chart of the research methodology is given in Figure 1. The results obtained demonstrate the advantages of the proposed model.
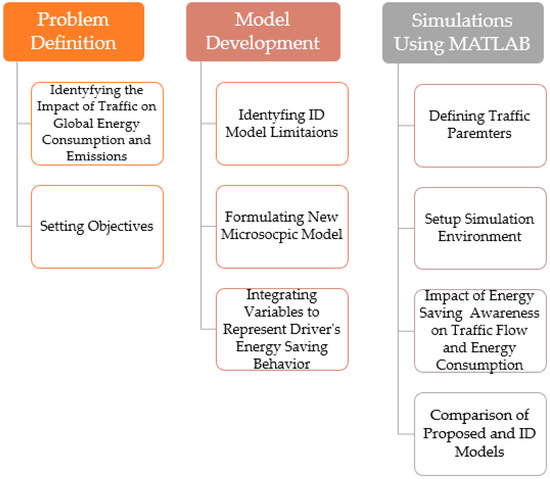
Figure 1.
The research methodology flowchart.
2. Energy Consumption Model
The ID model is a microscopic model characterizing traffic based on driver response. It incorporates traffic parameters such as desired speed , distance to align with forward conditions , and the speed difference between leading and following vehicles . According to this model, acceleration is based on driver response according to the ratio of the average speed to the desired speed . Acceleration in the ID model is expressed as [25]:
where is the maximum acceleration, is the acceleration exponent, and is the desired distance headway given by [25]:
where is the distance during congestion, is the time headway, and is the deceleration. The ID model utilizes (1) and (2) to characterize traffic considering driver response. However, driver response is based on a constant , meaning that the driver behavior does not vary with traffic conditions and that energy saving driving behavior is ignored. Thus, this model cannot depict real-world traffic dynamics.
The proposed traffic model characterizes driver energy saving awareness using vehicle energy conservation [40] as follows:
which is based on the principle of energy conservation. It is used during acceleration and deceleration to evaluate the changes in kinetic energy and potential energy , and the energy consumption due to air resistance , road friction , and vehicle internal systems . From [40], we have:
where is the total energy consumption, is the vehicle mass, is the gravitational acceleration, is the slope of the road, is the air density, is the air drag coefficient, is the vehicle front area, and is the road friction coefficient. From (3), the energy consumption with respect to time can be written as:
where is the vehicle braking energy consumption intensity coefficient and and are the internal energy coefficients during acceleration and deceleration, respectively.
Vehicle energy consumption is influenced by driver awareness of energy conservation [3]. Energy-conscious drivers adjust vehicle speed to reduce energy consumption, whereas traditional drivers ignore this consideration [3]. Thus, incorporating driver energy conservation awareness , can be expressed as:
where ranges from to . When , the driver has full awareness of energy conservation, meaning that the lowest amount of energy possible is consumed by their vehicle. When , the driver has no awareness of energy conservation, meaning that the most energy is consumed [3]. Vehicle energy consumption is also impacted by traffic density [41], so that:
Traffic flow is the product of density and speed, [42], which gives
The traffic flow is large with a small time headway , and a larger time headway decreases the flow [43,44]. Therefore, (7) can be expressed as:
Acceleration is the change in speed with respect to time, [45]. Therefore:
Substituting (9) in (1) gives the proposed energy consumption model:
This model characterizes energy consumption to reflect driver behavior in terms of energy-saving consciousness. Thus, it can predict traffic flow dynamics in an energy-saving driving environment more realistically compared to the ID model.
Traffic density is [45], where is the steady-state distance headway, that is, when , and is given by:
From [43], the traffic flow is:
By substituting (11) in (12), the flow for the proposed model becomes:
This indicates that the traffic flow in the proposed model is based on driver energy consumption awareness. Thus, the flow will vary according to the level of driver energy conservation awareness. This is more realistic than the ID model, which characterizes traffic flow based on a constant and cannot adequately characterize traffic in an energy-saving driving environment.
3. Performance Evaluation
The proposed and ID models were evaluated over a m road with a periodic boundary condition of s. First, the energy consumption characteristics of the traffic flow were examined using the proposed model, and then the results from the proposed and ID models were compared. The desired speed was m/s [45], and the maximum acceleration and deceleration were m/s2 and m/s2, respectively [46]. The value of is between and , so here values of , , and were employed. The acceleration exponent is typically [25], so here was used. For the ID model, a platoon of vehicles with a congestion spacing of m [25] was considered. For the proposed model, a platoon of vehicles with a congestion spacing of m was used so that the platoon lengths would be the same. The simulation parameters are provided in Table 1.

Table 1.
Simulation parameters.
3.1. Energy Consumption Characteristics of Traffic
Figure 2 presents the per meter energy consumption over time obtained by using the proposed model on a m road for , and . When the driver awareness of energy conservation was low (), the energy consumption was high with large fluctuations. On the other hand, with a higher awareness of energy conservation (), energy consumption was low, with small fluctuations that decreased over time. Figure 2 indicates that, for all values of , the fluctuations in energy consumption became smaller as the drivers employed energy-saving behavior, such as maintaining near constant speeds and avoiding abrupt acceleration or deceleration.
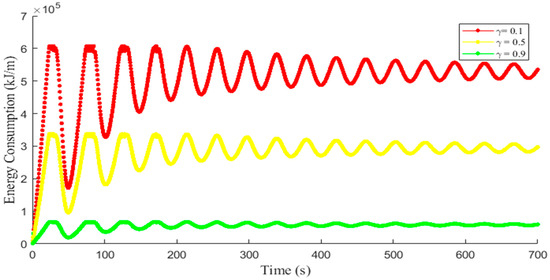
Figure 2.
Energy consumption evolution of traffic on a m road.
Figure 3, Figure 4 and Figure 5 present the relationship between energy consumption and acceleration, flow, and headway, respectively for , and . Figure 3 shows that, with a higher driver energy saving awareness (), vehicle energy consumption was more closely distributed within a somewhat circular region compared to lower driver energy saving awareness (), which had a more diverse energy consumption. This indicates that a high results in energy use which is more consistent owing to a smoother driving behavior involving fewer speed fluctuations. Conversely, with a low , energy consumption was high and more erratic due to irregular driving behavior. Moreover, when , energy consumption was high due to greater acceleration and deceleration variations, whereas when energy consumption was low owing to smaller acceleration and deceleration variations. Thus, a higher means that drivers make gradual speed adjustments and avoid unnecessary braking and acceleration, a behavior that conserves energy.
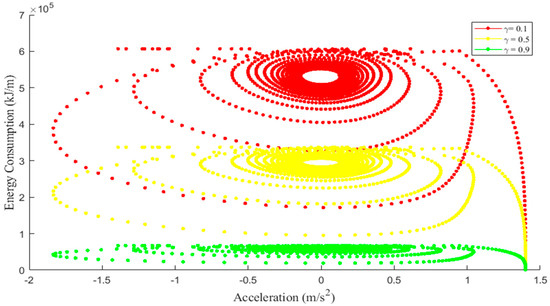
Figure 3.
The relationship between energy consumption and acceleration for and .
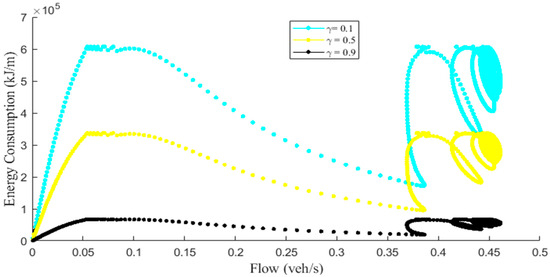
Figure 4.
The relationship between energy consumption and flow for and .
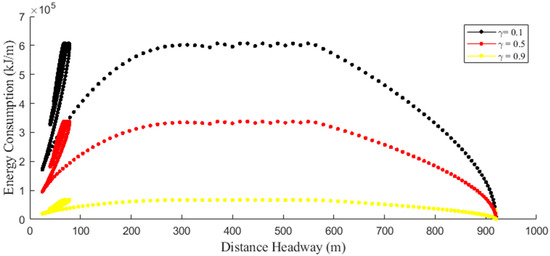
Figure 5.
The relationship between energy consumption and distance headway for and .
Figure 4 shows an increase in energy consumption variations due to an increase in traffic flow. This is because the flow significantly affects the driving patterns. As the number of vehicles on the road increased and the traffic flow became higher, drivers were required to adjust their speeds more frequently to adapt to the surrounding traffic. This resulted in more frequent acceleration and deceleration, in turn increasing both the number and magnitude of variations in energy consumption. Figure 4 also indicates that a high driver awareness () resulted in lower energy consumption with smaller variations, even with a higher traffic flow. Conversely, when driver awareness was low (), the energy consumption was large with greater variations, particularly with a higher traffic flow. This is confirmed by the greater variation in energy consumption.
Figure 5 shows that, in general, energy consumption decreased with increasing distance headway for all values of . This is because an increase in distance headway allowed drivers to maintain vehicle speed and react slowly to changing conditions. Thus, a larger distance headway reduced acceleration and deceleration, leading to a smoother traffic flow and lower energy consumption. Figure 5 also indicates that with higher awareness, , energy consumption was low with smaller variations on the road from m to m. This illustrates how energy saving driving techniques reduce energy usage. With a lower energy saving awareness (), although a large distance headway did lead to a reduction in energy consumption, the variations were greater, resulting in less efficient energy usage. Thus, energy consumption was higher compared to the scenario.
3.2. Comparison of the Proposed Model and ID Model
Figure 6 and Figure 7 present the traffic flow and density evolution over time, respectively, with (proposed model) and (ID model). These results show that the variations in both flow and density with were large, whereas when these variations were negligible and the flow and density became approximately constant over time.
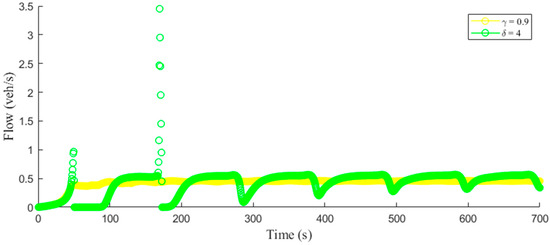
Figure 6.
Temporal flow evolution with the proposed model () and ID model ().
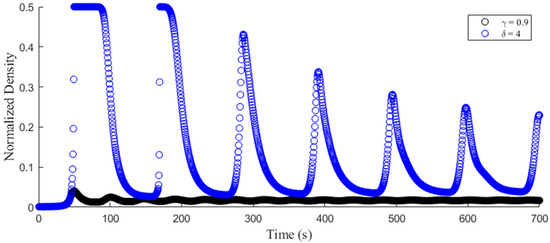
Figure 7.
Temporal density evolution with the proposed model () and ID model ().
Figure 8 and Figure 9 present the temporal speed and acceleration evolution, respectively, with (proposed model) and (ID model). Figure 8 shows that resulted in higher speeds with smaller variations which decreased over time. Conversely, led to lower speeds which decreased over time with larger variations that diminished less. Figure 9 indicates that, with , the variations in acceleration and deceleration were small and decreased over time. On the other hand, resulted in large acceleration and deceleration variations which did not decrease over time.
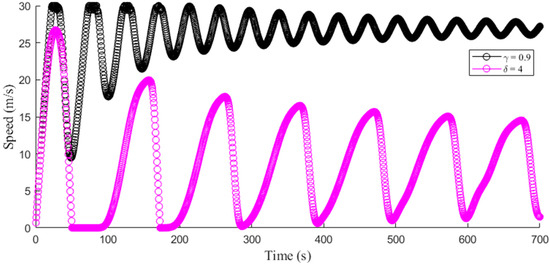
Figure 8.
Temporal evolution of speed with the proposed model () and ID model ().
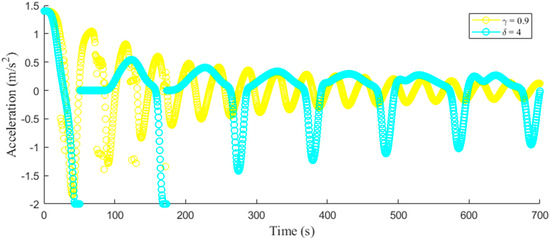
Figure 9.
Temporal evolution of acceleration with the proposed model () and ID model ().
Figure 10 presents the traffic speed behavior with (proposed model) and (ID model) on a m road. This shows that, for , speeds were high, as the maximum of m/s was achieved. At m, the speed was m/s after s, it decreased to m/s after 175 s, and then it varied between m/s and m/s from 186 s to 700 s, as shown in Figure 10a. In addition, after s, the speed was approximately constant, as it remained between m/s and m/s from m to m. Conversely, with , the speed was low with larger variations, as indicated in Figure 10b. At m, the speed was m/s after s, it decreased to m/s after s, and then it increased to m/s after s. The speed was m/s after at m, it decreased to m/s at m, and it reached m/s at m.
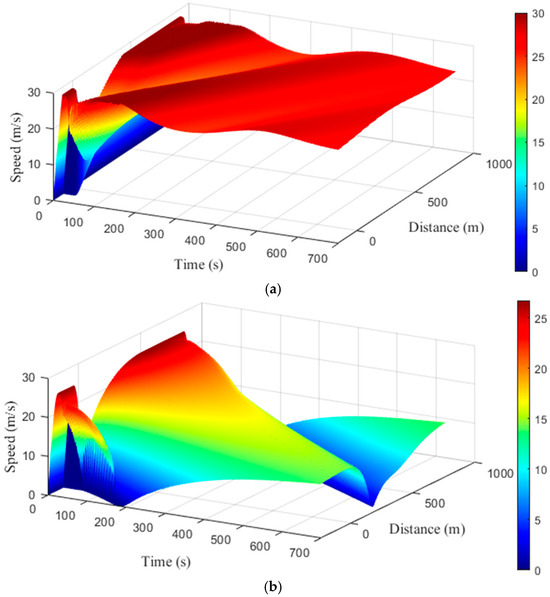
Figure 10.
Traffic speed behavior with the (a) proposed model () and (b) ID model () on a m road.
Figure 11 illustrates the traffic flow behavior with (proposed model) and (ID model) on a m road. With , after s, the flow was veh/s and increased to veh/s after s. The flow then became approximately constant, as shown in Figure 11a. Conversely, with , large variations in flow occurred, as indicated in Figure 11b. The flow varied between veh/s and veh/s from 54 s to 170.5 s at m, and it was – veh/s from 150.5 s to 195 s at m.
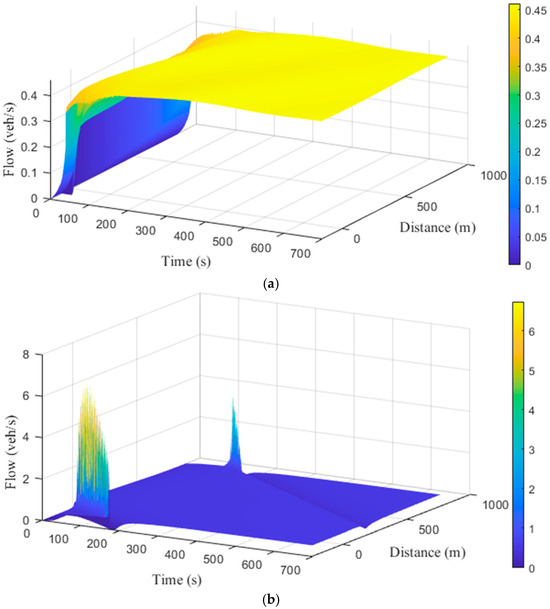
Figure 11.
Traffic flow behavior with the (a) proposed model () and (b) ID model () on a m road.
The traffic density behavior with (proposed model) and (ID model) on a m road is presented in Figure 12. With , after the congestion dissipated at s and m, the density was small at approximately , as shown in Figure 12a. This indicates that the congestion was resolved quickly in the proposed model owing to energy-aware driving. During the congestion, driver awareness resulted in a rapid return to normal traffic conditions, leading to a more stable environment. Figure 12b shows that, with , the traffic density was large with significant variations, and from s to s it reached , which was the maximum, indicating congestion. This congestion gradually dissipated and the density decreased to after s. Furthermore, congestion also existed from s to s, between m and m, and then the density decreased to after s at m. This shows that, with the ID model, vehicle interactions are chaotic, resulting in prolonged congestion and highlighting the inefficiencies of less energy-aware driving.
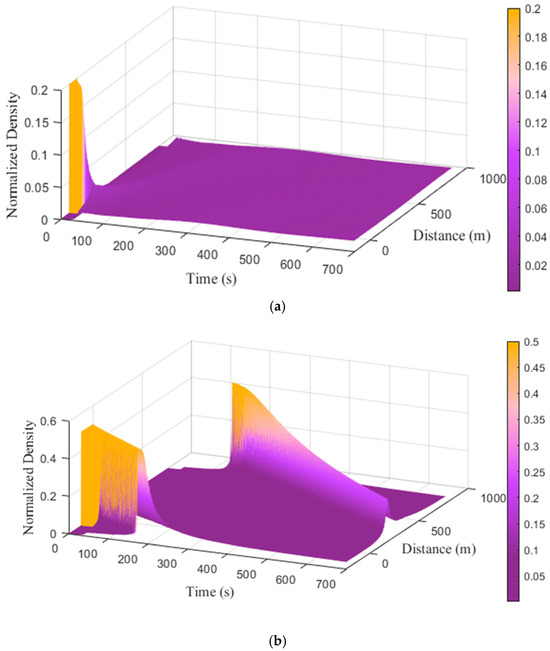
Figure 12.
Traffic density behavior with the (a) proposed model () and (b) ID model () on a m road.
The results presented in Section 3.1 indicate that the vehicle energy consumption was low in all cases when driver energy saving awareness was high (), whereas the energy consumption was significantly higher when this awareness was low (). Based on the physics of vehicle motion and its effect on energy consumption, vehicle acceleration requires substantially more energy than maintaining a constant speed. Thus, drivers with low energy saving awareness () consume more energy during stop-and-go traffic due to the more frequent stops and starts. Conversely, more aware drivers () adopt energy saving techniques such as gradual braking to conserve energy, reducing stop-and-go waves.
The results in Section 3.2 illustrate that the proposed energy consumption model results in smaller variations in traffic flow, speed, and density compared to the ID model. In addition, greater speeds are achieved with less acceleration and deceleration, leading to better energy consumption. Conversely, the ID model produces lower speeds with more acceleration and deceleration variations, causing higher fuel consumption. Moreover, the traffic density in the ID model is high, increasing congestion which takes longer to dissipate compared to the proposed model. The proposed model not only reduces congestion, but also results in its quick dissipation, highlighting the benefits of integrating energy conservation awareness into traffic modeling.
4. Conclusions
Energy concerns such as global warming underscore the importance of traffic energy savings. This paper introduces a microscopic traffic model that incorporates driver energy saving awareness and energy consumption. The constant , representing driver behavior in the ID model, is replaced with an exponent reflecting energy consumption and driver energy saving consciousness. It is shown that the ID model yields unrealistic traffic behavior because it cannot characterize changes in driver behavior. Conversely, the proposed model can realistically predict traffic flow dynamics in an energy-saving driving environment. Results are presented which show that, as driver energy conservation awareness increases, the energy consumption associated with traffic flow, acceleration, and headway decreases. Further, a driver with higher energy saving awareness () uses less energy compared to a driver with low awareness ().
Compared to the ID model, the proposed model results in smaller variations in traffic speed, flow, and density. It also leads to a smoother traffic flow, reduced congestion, and improved traffic efficiency, highlighting the importance of adopting energy-aware driving practices in traffic management strategies. Further, greater speeds with fewer acceleration and deceleration variations are achieved in the proposed model, substantially reducing fuel consumption. Reducing fuel consumption is critical when considering energy concerns such as climate change. In addition, lower fuel consumption reduces fuel costs and vehicle emissions, contributing to lower pollution levels and a decrease in the carbon footprint of traffic for long-term environmental sustainability.
Future work will focus on improving the proposed model by incorporating factors such as road and weather conditions. Psychological factors like stress and motivation also affect driver energy-saving decisions, thus real-world driver behavior should also be considered.
Author Contributions
Conceptualization, Z.H.K. and F.A.; methodology, Z.H.K. and F.A.; software, F.A.; validation, Z.H.K., F.A., T.A.G., A.B.A., M.A. and W.K.; formal analysis, Z.H.K., F.A., T.A.G., A.B.A., M.A. and W.K.; investigation, Z.H.K., F.A., T.A.G., A.B.A., M.A. and W.K.; writing—original draft preparation, F.A.; writing—review and editing, Z.H.K., F.A. and T.A.G.; visualization, Z.H.K., F.A., T.A.G., A.B.A., M.A. and W.K. All authors have read and agreed to the published version of the manuscript.
Funding
This research was funded by the Scientific Research Deanship, University of Ha’il, Saudi Arabia, through project number RG-24 090.
Data Availability Statement
The original contributions presented in this study are included in the article. Further inquiries can be directed to the corresponding author(s).
Conflicts of Interest
The authors declare no conflicts of interest.
References
- Li, H.; Li, H.; Hu, Y.; Xia, T.; Miao, Q.; Chu, J. Evaluation of fuel consumption and emissions benefits of connected and automated vehicles in mixed traffic flow. Front. Energy Res. 2023, 11, 1207449. [Google Scholar] [CrossRef]
- World Energy Statistics and Balances—Data product—IEA. Available online: https://www.iea.org/data-and-statistics/data-product/world-energy-statistics-and-balances (accessed on 27 June 2024).
- Sun, B.; Zhang, Q.; Zou, C.; Wei, N.; Jia, Z.; Wu, Z.; Mao, H. Research on microscopic traffic flow modeling and energy characteristics in the energy-saving driving environment. Nonlinear Dyn. 2023, 111, 14365–14378. [Google Scholar] [CrossRef]
- Energy Efficiency 2021—Analysis—IEA. Available online: https://www.iea.org/reports/energy-efficiency-2021 (accessed on 27 June 2024).
- Global Transportation Energy Consumption: Examination of Scenarios to 2040 Using ITEDD. Available online: https://www.eia.gov/analysis/studies/transportation/scenarios/pdf/globaltransportation.pdf (accessed on 10 July 2024).
- Energy Use in Canada: Trends Publications | Natural Resources Canada. Available online: https://oee.nrcan.gc.ca/publications/statistics/trends/2017/transportation.cfm#L2 (accessed on 10 July 2024).
- Saudi Energy Efficiency Center, Land Transport Sector. Available online: https://www.seec.gov.sa/en/energy-efficiency-sectors/land-transport-sector (accessed on 10 July 2024).
- Cattin, J.; Leclercq, L.; Pereyron, F.; El Faouzi, N. Calibration of Gipps’ car-following model for trucks and the impacts on fuel consumption estimation. IET Intell. Transp. Syst. 2019, 13, 367–375. [Google Scholar] [CrossRef]
- Jiao, S.; Zhang, S.; Zhou, B.; Zhang, Z.; Xue, L. An extended car-following model considering the drivers’ characteristics under a V2V communication environment. Sustainability 2020, 12, 1552. [Google Scholar] [CrossRef]
- Tang, T.Q.; Yu, Q.; Liu, K. Analysis of the traffic running cost under random route choice behavior in a network with two routes. Phys. A Stat. Mech. Its Appl. 2016, 449, 408–415. [Google Scholar] [CrossRef]
- Chung, K.; Rudjanakanoknad, J.; Cassidy, M.J. Relation between traffic density and capacity drop at three freeway bottlenecks. Transp. Res. Part B Methodol. 2007, 41, 82–95. [Google Scholar] [CrossRef]
- Yuan, K.; Knoop, V.L.; Leclercq, L.; Hoogendoorn, S.P. Capacity drop: A comparison between stop-and-go wave and standing queue at lane-drop bottleneck. Transp. B Transp. Dyn. 2017, 5, 145–158. [Google Scholar] [CrossRef]
- Rao, A.M.; Rao, K.R. Measuring urban traffic congestion-a review. Int. J. Traffic Transp. Eng. 2012, 2, 286–305. [Google Scholar]
- Carlson, R.C.; Papamichail, I.; Papageorgiou, M. Local feedback-based mainstream traffic flow control on motorways using variable speed limits. IEEE Trans. Intell. Transp. Syst. 2011, 12, 1261–1276. [Google Scholar] [CrossRef]
- Adebisi, A. Adebisi, A. A Review of the Difference among Macroscopic, Microscopic and Mesoscopic Traffic Models. In Technical Report; Department of Civil and Environmental Engineering, Florida Agricultural and Mechanical University: Tallahassee, FL, USA, 2017. [Google Scholar]
- Li, Y.; Zhang, L.; Zheng, H.; He, X.; Peeta, S.; Zheng, T.; Li, Y. Evaluating the energy consumption of electric vehicles based on car-following model under non-lane discipline. Nonlinear Dyn. 2015, 82, 629–641. [Google Scholar] [CrossRef]
- Ali, F.; Khan, Z.H.; Khan, F.A.; Khattak, K.S.; Gulliver, T.A. A new driver model based on driver response. Appl. Sci. 2022, 12, 5390. [Google Scholar] [CrossRef]
- Imran, W.; Khan, Z.H.; Gulliver, T.A.; Khattak, K.S.; Nasir, H. A macroscopic traffic model for heterogeneous flow. Chin. J. Phys. 2020, 63, 419–435. [Google Scholar] [CrossRef]
- Pipes, L.A. An operational analysis of traffic dynamics. J. Appl. Phys. 1953, 24, 274–281. [Google Scholar] [CrossRef]
- Reuschel, A. Vehicle movements in a platoon. Oesterreichisches Ing. Archir. 1950, 4, 193–215. [Google Scholar]
- Newell, G.F. Nonlinear effects in the dynamics of car following. Oper. Res. 1961, 9, 209–229. [Google Scholar] [CrossRef]
- Ali, F.; Khan, Z.H.; Khattak, K.S.; Gulliver, T.A.; Khan, A.N. A Microscopic Heterogeneous Traffic Flow Model Considering Distance Headway. Mathematics 2023, 11, 184. [Google Scholar] [CrossRef]
- Bando, M.; Hasebe, K.; Nakayama, A.; Shibata, A.; Sugiyama, Y. Dynamical model of traffic congestion and numerical simulation. Phys. Rev. E 1995, 51, 1035–1042. [Google Scholar] [CrossRef]
- Helbing, D.; Tilch, B. Generalized force model of traffic dynamics. Phys. Rev. E 1998, 58, 133–138. [Google Scholar] [CrossRef]
- Treiber, M.; Hennecke, A.; Helbing, D. Congested traffic states in empirical observations and microscopic simulations. Phys. Rev. E 2000, 62, 1805–1824. [Google Scholar] [CrossRef]
- Ali, F.; Khan, Z.H.; Gulliver, T.A.; Khattak, K.S.; Altamimi, A.B. A microscopic traffic model considering driver reaction and sensitivity. Appl. Sci. 2023, 13, 7810. [Google Scholar] [CrossRef]
- Liebner, M.; Baumann, M.; Klanner, F.; Stiller, C. Driver intent inference at urban intersections using the intelligent driver model. In Proceedings of the IEEE Intelligent Vehicle Symposium, Madrid, Spain, 3–7 June 2012. [Google Scholar]
- Tian, J.; Jiang, R.; Li, G.; Treiber, M.; Jia, B.; Zhu, C. Improved 2D intelligent driver model in the framework of three-phase traffic theory simulating synchronized flow and concave growth pattern of traffic oscillations. Transp. Res. Part F Traffic Psychol. Behav. 2016, 41, 55–65. [Google Scholar] [CrossRef]
- Milanés, V.; Shladover, S.E.; Spring, J.; Nowakowski, C.; Kawazoe, H.; Nakamura, M. Cooperative adaptive cruise control in real traffic situations. IEEE Trans. Intell. Transp. Syst. 2013, 15, 296–305. [Google Scholar] [CrossRef]
- Wang, M.; Treiber, M.; Daamen, W.; Hoogendoorn, S.P.; van Arem, B. Modelling supported driving as an optimal control cycle: Framework and model characteristics. Procedia-Soc. Behav. Sci. 2013, 80, 491–511. [Google Scholar] [CrossRef]
- Liu, P.; Fan, W. Exploring the impact of connected and autonomous vehicles on freeway capacity using a revised intelligent driver model. Transp. Plan. Technol. 2020, 43, 279–292. [Google Scholar] [CrossRef]
- Rahman, M.; Islam, M.R.; Chowdhury, M.; Khan, T. Development of a connected and automated vehicle longitudinal control model. arXiv 2019, arXiv:2001.00135. [Google Scholar]
- Schakel, W.J.; Van Arem, B.; Netten, B.D. Effects of cooperative adaptive cruise control on traffic flow stability. In Proceedings of the International IEEE Conference on Intelligent Transportation Systems, Funchal, Portugal, 19–22 September 2010; pp. 759–764. [Google Scholar]
- Sun, D.-H.; Kang, Y.-R.; Li, H.-M. Analysis of evolution mechanism of traffic energy dissipation by considering driver’s forecast effect. ACTA Phys. Sin. 2015, 64, 154503. [Google Scholar]
- Jin, Z.; Cheng, R.; Ge, H. Nonlinear density wave and energy consumption investigation of traffic flow on a curved road. Chin. Phys. B 2017, 26, 110504. [Google Scholar] [CrossRef]
- Wang, J.; Ding, J.X.; Shi, Q.; Kühne, R.D. Lane-changing behavior and its effect on energy dissipation using full velocity difference model. Int. J. Mod. Phys. C 2016, 27, 1650013. [Google Scholar] [CrossRef]
- Yu, S.; Shi, Z. An improved car-following model considering headway changes with memory. Phys. A Stat. Mech. Its Appl. 2015, 421, 1–14. [Google Scholar] [CrossRef]
- Awal, T.; Kulik, L.; Ramamohanrao, K. A k-leader fuel-efficient traffic model. In Proceedings of the 2013 IEEE Intelligent Vehicles Symposium (IV), Gold Coast, QLD, Australia, 23–26 June 2013; pp. 1014–1021. [Google Scholar]
- Tan, J.; Gong, L.; Qin, X. Global optimality under Internet of Vehicles: Strategy to improve traffic safety and reduce energy dissipation. Sustainability 2019, 11, 4541. [Google Scholar] [CrossRef]
- Sun, B.; Zhang, Q.; Wei, N.; Jia, Z.; Li, C.; Mao, H. The energy flow of moving vehicles for different traffic states in the intersection. Phys. A Stat. Mech. Its Appl. 2022, 605, 128025. [Google Scholar] [CrossRef]
- Bharadwaj, S.; Ballare, S.; Rohit; Chandel, M.K. Impact of congestion on greenhouse gas emissions for road transport in Mumbai metropolitan region. Transp. Res. Procedia 2017, 25, 3538–3551. [Google Scholar] [CrossRef]
- Ali, F.; Khan, Z.H.; Khattak, K.S.; Gulliver, T.A.; Altamimi, A.B. A microscopic traffic model incorporating vehicle vibrations due to pavement condition. Mathematics 2023, 11, 4911. [Google Scholar] [CrossRef]
- Ali, F.; Khan, Z.H.; Altamimi, A.B.; Khattak, K.S.; Gulliver, T.A. A microscopic traffic model considering time headway and distance headway. Appl. Sci. 2023, 13, 7234. [Google Scholar] [CrossRef]
- Halim, H.; Adisasmita, S.A.; Ramli, M.I.; Aly, S.H. The relationship of volume and headway on heterogen traffic conditions in Makassar City. In Proceedings of the IOP Conference Series: Earth and Environmental Science, Bali, Indonesia, 29–30 August 2019; p. 12105. [Google Scholar]
- Kessels, F. Traffic Flow Modelling: Introduction to Traffic Flow Theory Through a Genealogy of Models; Springer: Cham, Switzerland, 2019. [Google Scholar]
- Kesting, A.; Treiber, M.; Helbing, D. Enhanced intelligent driver model to access the impact of driving strategies on traffic capacity. Philos. Trans. R. Soc. Math. Phys. Eng. Sci. 2010, 368, 4585–4605. [Google Scholar] [CrossRef]
- Xu, X.; Aziz, H.M.A.; Liu, H.; Rodgers, M.O.; Guensler, R. A scalable energy modeling framework for electric vehicles in regional transportation networks. Appl. Energy 2020, 269, 115095. [Google Scholar] [CrossRef]
- Wang, J.; Besselink, I.; Nijmeijer, H. Electric vehicle energy consumption modelling and prediction based on road information. World Electr. Veh. J. 2015, 7, 447–458. [Google Scholar] [CrossRef]
- How Long Is A Car? (Average Car Length According to Types). Available online: https://www.smartmotorist.com/average-car-length (accessed on 8 May 2022).
Disclaimer/Publisher’s Note: The statements, opinions and data contained in all publications are solely those of the individual author(s) and contributor(s) and not of MDPI and/or the editor(s). MDPI and/or the editor(s) disclaim responsibility for any injury to people or property resulting from any ideas, methods, instructions or products referred to in the content. |
© 2024 by the authors. Published by MDPI on behalf of the World Electric Vehicle Association. Licensee MDPI, Basel, Switzerland. This article is an open access article distributed under the terms and conditions of the Creative Commons Attribution (CC BY) license (https://creativecommons.org/licenses/by/4.0/).