Abstract
In the context of achieving carbon peaking and carbon neutrality goals, focusing on coordinated efficiency in loss and carbon reduction, and promoting comprehensive green transformation of economic and social development are critical strategies. Line loss is an economic and technical indicator for measuring losses in a power system, and loss reduction is one of the important ways to achieve the carbon peaking and carbon neutrality goals in the power system. However, with the continuous increase in the power grid scale and the increasingly complex operation mode of the system, it is difficult to clearly quantify the carbon reduction benefits brought by system loss reduction. In order to synergize grid loss reduction and system carbon reduction, and generate economic and environmental benefits at the same time, this paper proposes a carbon market trading model that considers multi-layer reactive power compensation strategies. Based on the carbon emission flow model, a node carbon cost pricing is formed, and multi-layer reactive power compensation measures are set in the distribution network nodes to obtain an optimal loss reduction strategy, with the carbon market trading cost minimization as the objective. The effectiveness of the model is verified by simulating and analyzing four scenarios. Compared with the original system that does not consider carbon trading and reactive compensation, the model proposed in this paper can reduce losses by 20% and reduce carbon emissions by 5.7%. This paper is of great value for reactive power loss reduction management in distribution networks of a low-carbon background.
1. Introduction
Against the backdrop of the implementation of the ‘carbon peaking and carbon neutrality goals’ policy, China’s ecological civilization construction has entered a critical period, with a focus on carbon reduction as a strategic direction. In order to actively practice carbon emission reduction, the power system continuously pursues safe and stable energy operation, while reducing losses, optimizing structure, improving efficiency, and collaborating to optimize various multi-layer carbon reduction strategies [1].
Line loss is usually used as an important economic and technical indicator to measure grid loss [2], where the planning, production, and management level of the power system can be reflected, and is also an important factor in determining electricity prices or settling electricity quantities in the electricity market trading process.
The extensive research on theoretical network loss calculation methods based on forward and backward generation [3], the Newton–Raphson method [4], and other power flow calculation methods have greatly promoted the implementation of technical loss reduction measures [5]. However, the impact of source storage and charging access on power system losses has not been comprehensively considered up to date. Previous studies have mainly reduced the theoretical losses of the power system by applying energy-saving equipment (replacing high-energy consumption distribution transformers), adjusting the grid structure (modifying wires to reduce the power supply radius), and improving power factor (reasonably configuring reactive power compensation), thereby achieving loss reduction [6]. Among them, the literature [7] indicates that measures such as replacing high-energy consumption distribution transformers and renovating wires have long construction cycles and high investment costs. The power supply reliability and overall layout of the power system need to be considered when reducing power supply radius, network reconstruction, and when other technologies are applied.
The reactive power compensation technology of the distribution network can balance the reactive power of the lines, distribution transformers, and users’ power supply, reducing the network losses increased by the transmission of reactive power in the distribution line. Therefore, research on energy-saving and loss reduction technologies in distribution networks that incorporate renewable energy technology elements has shown new trends in loss reduction work. Reference [8] proposed improved calculation methods for power loss caused by renewable energy access in low-voltage distribution networks and medium to high voltage distribution networks, respectively, and loss reduction strategies considering renewable energy access based on factors that affect system loss were analyzed. Reference [9] proposed an optimized loss reduction method by adjusting voltage to enhance the adaptability of regulation decisions to intermittent prediction errors for renewable energy. An optimal scenario method was applied in reference [10] to simulate the randomness of distributed generation (DG) and load, establish a multi-objective mathematical model with minimum network loss and voltage deviation, and effectively reduce the network loss of the system through coordination and cooperation with other reactive power compensation devices.
Reactive power compensation is a common method of managing line losses, which adjusts the reactive power flowing through the line through compensation devices to reduce power system losses. By compensating multiple nodes for reactive power, not only can active power losses and reactive network losses be reduced, but also the characteristic voltage level of the power system can be maintained, the stability of the power system can be improved, and the safe and economic operation of the power system can be ensured.
Reference [11] believes that the management level of the power generation side is closely related to the power system loss. Technological transformation and improvement of the management level of the power generation side can reduce the power loss and improve the economic benefits of the power generation enterprise. Reference [12] shows that the level of demand side management is related to power system loss as well. By strengthening the demand side load management and improving the power usage effectiveness of terminal loads, the power loss can be reduced. Therefore, reference [13] considers changes in load demand and conducts research on distributed and centralized ESS (energy storage system) application technologies to reduce technical losses in distribution systems. In addition, reference [14] found that improving the economic operation level of the entire network can significantly reduce power system losses. Measures to improve the economic operation level such as optimizing the distribution of reactive power, increasing the load rate of transmission and distribution equipment, and appropriately increasing the operating voltage level of the power system were discussed. Reference [15] indicates that power loss can be reduced by reasonable selection and use of transformers, on-site reactive power compensation to improve power factor, and the use of energy-saving electrical equipment on the power user side. However, there is still limited research on the collaborative optimization strategies between carbon reduction and loss reduction, and a new theory that couples and develops carbon and loss reduction with each other has not been formed.
There is an inseparable connection between loss reduction and carbon reduction. Currents research indicates that the carbon flow model can be used to calculate the carbon emissions of the system and quantify the carbon reduction environmental benefits of the system from the power side.
Reference [16] proposed a new carbon emission flow model to quantify carbon emissions during power transmission. The operational and network characteristics of the power system are considered in the new CEF model, which depicts the relationship between power transmission and CEF. Some CEF concepts of power systems and the basic characteristics and distribution principles of CEF are defined. Based on the CEF technology, [17] studied the energy-carbon comprehensive pricing for the low-carbon operation of multi energy systems. Reference [18] proposed a customer-side carbon emission measurement model based on carbon emission flow theory, discussing the calculation of fine-grained carbon emissions on the distribution network side, including photovoltaic and energy storage, to depict the correlation between the carbon emissions of power generation units and the carbon flow rate of each load on the user side. Reference [19] used the energy-carbon flow method to study carbon emissions. An energy-carbon flow model for a comprehensive energy station is established, which promoted to analyze the sources of carbon flow in typical scenarios and calculate the carbon emissions throughout the day. Reference [20] studied the impact of distributed power sources on active distribution networks (ADNs). Based on the carbon emission flow (CEF) theory, the bidirectional power flow with corresponding CEF in ADN was analyzed, and a simple optimal scheduling model considering CEF modeling was proposed to solve the carbon intensity without iterative methods.
The focus of this paper is to combine loss reduction and carbon reduction and optimize loss reduction measures, thus improving the environmental benefits and cost-effectiveness of a power system. Based on CEF theory, the node carbon cost of the power system is calculated in this paper and multi-layer reactive power compensation measures are set up within the distribution network nodes. Taking into account the collaborative strategy of line loss and carbon emission optimization, the system is optimized in both loss reduction and carbon reduction aspects, improving the system’s operational economic benefits and environmental friendliness. This paper proposes a carbon market trading model considering multi-layer reactive power compensation strategy, providing a collaborative optimization scheme of reactive power compensation to reduce system loss and carbon emission. The final system output and carbon emissions results, as well as grid losses are calculated too.
The innovation and advantages of this paper are as follows:
- Based on the CEF, the spot trading pricing mechanism of the carbon market is constructed. The carbon flow constraints and carbon quota constraints are then written into the trading model, introducing the peer-to-peer carbon trading market into the power system, and the carbon cost for nodes can be priced, so as to change the carbon use decision, optimize the carbon emissions of the system, and improve the environmental benefits of the grid.
- A multi-layer reactive power compensation strategy has been proposed, based on the principles of bottom-up, hierarchical zoning, and local balancing. Priority is given to the local balance of reactive power at each lay of reactive power compensation, taking into account the collaborative cooperation between the substation layer, distribution line layer, distribution station area layer, and user compensation layer. A four-layer linkage is formed between the voltage levels of the distribution network to maximize the optimization of reactive power local balance, reduce the reactive power flowing on the transmission line and effectively reduce losses in the distribution network, respectively.
- Focused on the collaborative optimization method about power system dispatching operation and the user carbon trading mechanism, from the perspective of power system operation dispatching, this paper designs multi-layer reactive power compensation measures for distribution network, interactively regulating the system power flow, and optimizing the operation scheme. In terms of carbon market trading mechanisms, the carbon emissions and carbon cost optimization benefits brought about by scheduling decisions and trading mechanism are analyzed as well. Collaborative research on the two aspects, complementing each other, is an innovation that has rarely been studied before.
2. Carbon Emission Flow Model
2.1. Carbon Flow Theory
In the electricity market, power generators are considered as direct sources of carbon dioxide emissions, but the demand side is the fundamental driving factor for carbon emissions. The thread diagram of carbon emission flow is shown in Figure 1. Carbon flow is a ‘virtual flow’ that exists based on the power flow, accompanying the power flow through each node, branch, and load in the power system. The proposal of carbon emission flow theory (the Smart Energy Laboratory of the Collage of Electrical Engineering at Tsinghua University in 2012, Beijing, China) can effectively allocate the carbon emissions injected into generators to various nodes, branches, and loads in a fair and reasonable manner, and clarify the carbon emission responsibilities of the consumer side. In order to track carbon emissions from the generation side to the consumption side, a carbon emission flow (CEF) model based on the proportional sharing principle (PSP) has been proposed in [21]. It should be noted that the PSP is a fundamental assumption of the CEF model, which can linearize the relationship between power flow and accompanying virtual emission flow.
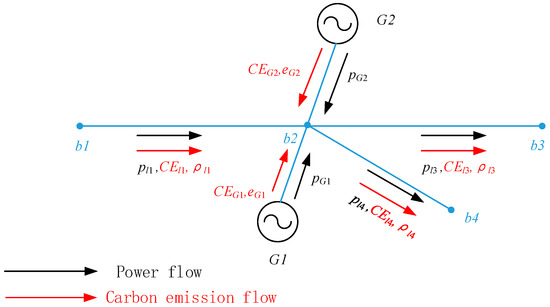
Figure 1.
Thread diagram of carbon emission flow.
2.2. Carbon Flow Modeling
Assuming that the number of nodes in a certain power system is N, the number of injection nodes for the unit is K, and the number of load nodes is M.
2.2.1. Carbon Flow Calculation Based on DC Power Flow
Reference [22] proposes a basic method for calculating carbon emissions in power systems without considering network losses. The carbon emission intensity eNi of node i in the system is:
where, ρl represents the carbon flow density of branch l. Equation (2) means that for a given node, its carbon emission intensity eNi only depends on the total inflow carbon emission flow from the branches and generators of the node.
According to the properties of CEF, the density of branch carbon flow is equal to the node carbon potential of its outflow node. Therefore, Equation (1) can be rewritten as follows:
where, is the N-dimensional unit row vector, where the i-th element is 1.
The carbon potential of system nodes can be obtained as follows:
where, is the node active matrix, which is calculated using Equation (4). is the branch power flow distribution matrix, is the unit injection distribution matrix, and is the generator carbon emission intensity vector.
When , it can be obtained:
where, is the row vector of order N + K, and all elements in the vector are 1.
2.2.2. Carbon Flow Calculation Based on AC Power Flow
To achieve accurate tracking and tracing of carbon emissions, a power system carbon emission calculation method based on power flow distribution matrix has been proposed. A power flow distribution matrix is constructed based on the power flow results considering network losses, using the PSP principle, so as to obtain the connection between the carbon emission flow injected by the units and the carbon emission flow flowing through the node. The calculation method for carbon emission flow is as follows.
The power flow distribution matrix is represented by Au, and its calculation formula is:
The branch carbon flow rate is represented by Rij, and its calculation formula is
where, ei is a vector with the i-th component being 1 and the remaining components being 0.
The carbon flow rate of network loss is represented by , and its calculation formula is:
The calculation formula for the carbon potential of node j is
where, Sj represents the set of nodes connected to node j and with active power flowing to j, Rij represents the branch carbon flow rate, and represents the network loss carbon flow rate.
3. Multi-Layer Reactive Power Compensation Loss Reduction Model
- User compensation layer
The demand for reactive power compensation in the user compensation layer mainly comes from the inductive power load on the demand side. Power users are encouraged to install random compensation capacitors on the motor side,
where represents the actual reactive power compensation demand of the user compensation layer, i.e., the total reactive power deficiency of the user, and P represents the average active power of the motor during the user’s production period. and are the average power factor of the user before and after compensation, respectively.
The average active power P of the motor during the production period on the demand side can be calculated, and then the average power factor before reactive power compensation will be obtained. The expected optimized power factor after compensation is set to calculate the total reactive power compensation amount that needs to be configured on the demand side according to Equation (9).
- Distribution station area layer
Considering the installed capacity of random compensation capacitors on the demand side, the actual reactive power compensation demand gap of the distribution station area layer can be calculated and determined, as shown in Equation (11).
where, QT is the actual reactive power compensation demand of the distribution station area layer.
Equation (10) indicates that the maximum reactive power deficiency of the distribution transformer can be determined by considering the parameters and operating data of the distribution transformer, and comprehensively considering the prediction of reactive power compensation on the user side. The total reactive power compensation capacity QT can be calculated on the distribution transformer side, taking into account the self-compensating capacitor capacity on the user side of the first layer.
- Distribution line layer
On the basis of user compensation and substation compensation, in order to minimize reactive power flow and achieve on-site absorption of reactive load, the reactive power shortage of 10 kV line is calculated through theoretical calculation. Reactive power compensation devices are installed in appropriate positions to reduce losses caused by long-distance transmission of reactive current on the line.
where, represents the minimum reactive power deficiency of the line, represents the average reactive power deficiency of the line. represents the minimum operating current of the line. is the average operating current of the line. is the resistance per unit length of the wire, L is the length of the conductor.
The minimum reactive power deficiency and average reactive power deficiency of the line can be calculated based on the resistance per unit length of the wire , wire length L, operating current data and . On this basis, the local reactive power compensation capacity QL of the distribution line that needs to be configured can be determined by considering the compensation margin on the distribution transformer side, as shown in Equation (14).
where, ηT is the compensation margin on the distribution transformer side. Considering that the distribution transformer does not have the function of on-load voltage regulation, and some dedicated transformer users have not achieved on-site compensation for reactive power shortage, the compensation margin on the distribution transformer side ηT is set.
- Substation layer
In summary, priority should be given to the on-site balance of reactive power compensation at all levels, while also considering the coordination and cooperation among the four distribution network levels: substation level, distribution line level, distribution station area level, and user compensation level, maximizing the optimization of local reactive power balance, reducing reactive power through transmission lines, and effectively reducing losses in the distribution network.
4. Carbon Market Trading Mechanism Considering Multi-Layer Reactive Power Compensation
Considering the carbon market trading model under multi-layer reactive power compensation, the carbon emission intensity of nodes can be calculated based on the CEF theory. Additionally, peer-to-peer market trading is introduced in the distribution network substation area, and the carbon cost of nodes with the dual factor of power flow constraints and carbon emission constraints will be measured.
The method flowchart is as follows.
The objective function of the model is to minimize the operation cost and carbon emission trading cost, as shown in Equation (16):
where, is the transaction price of excess carbon emissions ($/tCO2), and represent the cost of injected active and reactive power, respectively.
The constraints of the model are listed as follows:
Equations (17) and (18) represent the upper and lower limit constraints on the active and reactive power output of the generator units, respectively. Equations (19) and (20) represent the upper and lower capacity of the active and reactive power flow through the lines. Equation (21) represents the reactive power constraint after considering reactive power compensation. Equations (22) and (23) represent the supply demand balance constraints of active and reactive power in the system, and Equation (24) represents the relationship between the carbon emissions of the units. Equations (25) and (26), respectively represent the carbon quota limit for the buyer and seller in the carbon market trading in the distribution system.
Lagrange multiplier method is used and the Lagrangian expression of the objective function under constraints can be described as Equation (27):
The carbon quota constraint Equations (25) and (26) is also calculated by the first order partial derivative of the Lagrange function:
In the above two equations, , , , , , , , , , , , respectively represent the Lagrange multipliers corresponding to each constraint.
By definition, LMP is closely related to system power flow. The multi-layer reactive power compensation model is introduced to change the existing reactive power flow on the line, thus changing the cost of electricity by source caused by the change of node load. The reactive power cost component in LMP is closely related to the reactive power compensation strategy. In summary, multi-layer reactive power compensation strategies can not only balance system voltage levels and reactive power, but also change node LMP prices and carbon emission intensity, affecting the trading of electricity and carbon markets.
5. Case Study
The modified 14-bus system is applied to verify the carbon market trading model considering multi-layer reactive power compensation. From Figure 2, the topological structure of the power system can be known, providing system data such as the node where the generators are located, the nodes connected between branches, and the number of loads for programming.
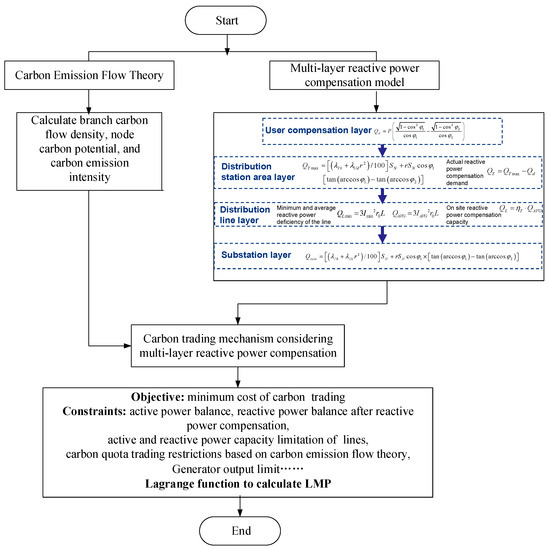
Figure 2.
Flowchart on carbon trading considering multi-layer reactive power compensation.
To verify the effectiveness of the model, four scenarios are set for comparative analysis.
Scenario 1: Carbon market trading and reactive compensation are not considered;
Scenario 2: Only carbon market trading is considered;
Scenario 3: Carbon market trading and reactive compensation are both considered.
Scenario 4: Carbon market trading and multi-layer reactive power compensation are considered.
The output of generators in Scenario 1 and Scenario 2 are shown in Figure 3.
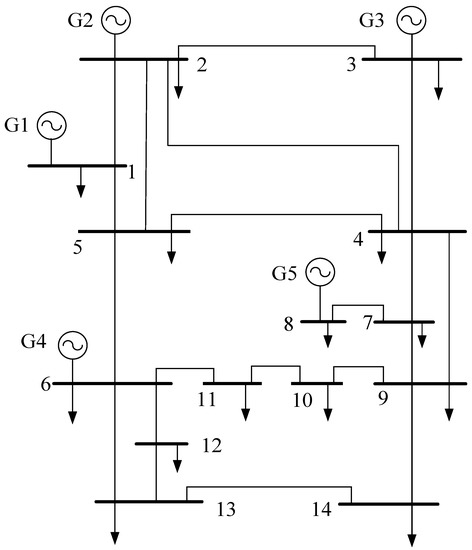
Figure 3.
Modified 14-bus system.
1–14 numbers above represent the node number in the modified system. The 14-bus system in this case has a total of 5 generators, among which G1 is a coal-fired unit with a carbon emission intensity set as 0.875; G2 and G4 are gas turbines with carbon emission intensities set as 0.525 and 0.520, respectively; G3 and G5 are distributed wind and hydropower units with carbon emission intensity set as 0. Set a free carbon quota of 130 t in scenarios 2, 3, and 4.
With consideration of the carbon market trading mechanism, the unit outputs have been changed. The coal-fired unit G1 has reduced output due to its high carbon emissions; The G3 and G5 are renewable energy units, with increased output due to zero carbon emission intensity. The introduction of carbon a market trading mechanism is conducive to improving the power supply structure, optimizing resource allocation, and promoting the competitiveness of renewable energy generators.
The node carbon potentials of the 14-bus system in Scenario 2 are shown in Figure 4, and node load data before and after reactive power compensation are shown in Figure 5.
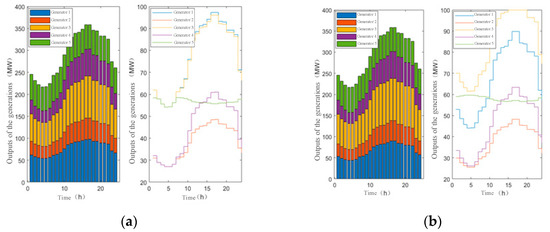
Figure 4.
(a) Generator output in scenario 1; (b) generator output in scenario 2.
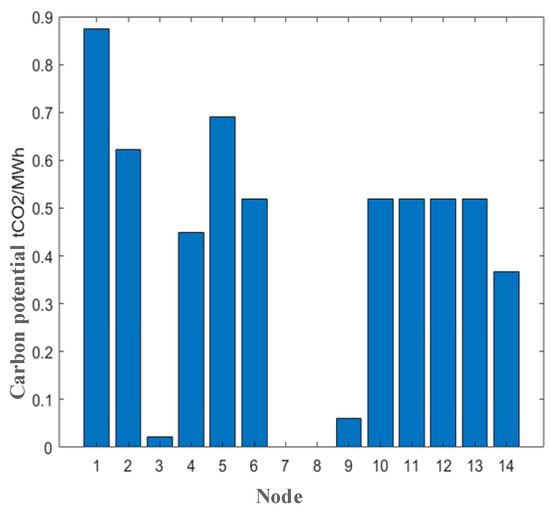
Figure 5.
Node carbon potential of a 14-bus system in Scenario 2.
Due to the relatively high carbon potential of nodes 1, 2, and 5, the demand of nodes 1, 2, and 5 decrease after reactive power compensation. On the contrary, the carbon potential of nodes 3, 7, and 8 is relatively low, and after reactive power compensation, the demand of nodes 3, 7, and 8 increases.
The system costs under four scenarios are shown in Table 1, with a set carbon price of 80 CNY/t and a free carbon quota of 130 tons.

Table 1.
System costs under different scenarios.
The carbon market trading mechanism and reactive compensation are not considered in Scenario 1, and generation producers tend to use coal-fired units with low cost but high carbon emission intensity for power generation, without involving carbon trading costs. Comparing Scenario 1 and Scenario 2, it can be seen that the total system cost of Scenario 2 is lower than Scenario 1, and the total carbon emissions of the system were also reduced by 5.3808 tons. With the addition of carbon trading mechanism, power producers tend to use gas units and renewable energy units with lower carbon emission intensity to actively reduce carbon emissions. The cost of carbon trading in Table 1 is negative, which means that power generation companies make profits by selling excess carbon quotas in the carbon market, thereby reducing the total cost of the system. Comparing Scenario 1 and Scenario 3, it was found that the total system cost of Scenario 3 is much lower than Scenario 1, and the total carbon emissions of the system are reduced by 8.031 tons. Scenario 3 has better economic and environmental benefits compared to Scenario 2, demonstrating the effectiveness of the model. Scenario 4 shows the most benefits in both loss reduction and carbon emission reduction, which indicates that the carbon market trading mechanism of multi-level reactive power compensation can promote the system operating efficiency and reduce system loss, then further illustrate the synergy between loss reduction and carbon reduction.
The LMP of nodes in three scenarios is shown in Figure 6.
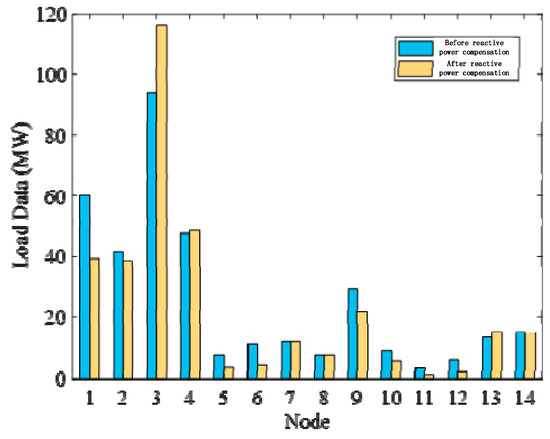
Figure 6.
Load data before and after reactive power compensation.
From Figure 7, it can be seen that the modified 14-bus system has undergone an increase in LMP for each node in both Scenario 3 and Scenario 4. However, comparing Scenario 3 and Scenario 4, it can be seen that the LMP growth rate of most nodes in Scenario 4 is lower, except for the LMP growth rate of nodes 1, 4, and 14. It can be seen that considering multi-layer reactive power compensation optimization and loss reduction in the power system can effectively improve the LMP growth caused by carbon market trading.
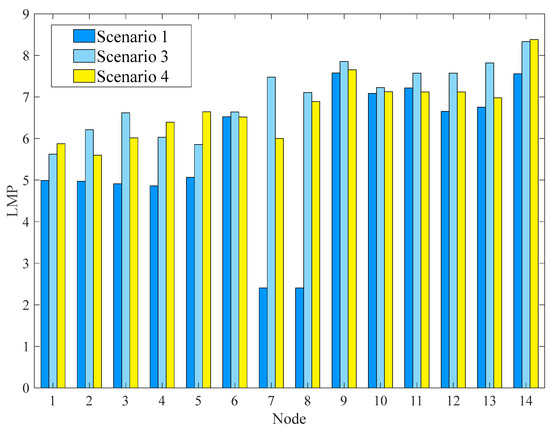
Figure 7.
LMP in different scenarios.
6. Conclusions
This paper proposes a carbon emission trading mechanism that considers multi-layer reactive power compensation and loss reduction measures in distribution networks. The carbon emission flow theory is used to calculate the parameters such as node carbon potential and branch carbon flow density through the carbon flow model, analyze the system node characteristics, and obtain the node carbon emission trading cost. Subsequently, a multi-layer loss reduction and reactive power compensation strategy was constructed, with reactive power compensation amounts set at the user layer, substation layer, line layer, and substation layer, respectively, to improve the operational efficiency of the distribution network, save costs, and form a loss reduction strategy for reactive power on-site compensation. On this basis, the carbon emission trading cost is initially introduced, and a carbon emission trading mechanism model considering multi-layer reactive power compensation is constructed. This article uses a modified IEEE 14-bus distribution network model and presents system losses and carbon emissions for four typical scenarios. Through the collaborative optimization of reactive power compensation and carbon emission trading, multi-level node reactive power compensation, and end-to-end carbon emission trading are considered, and the system cost, carbon emissions, and network losses in this scenario are minimal. At the same time, this example also gives the load data and LMP of distribution network nodes before and after the introduction of multi-layer reactive power compensation and carbon emission trading. Through example verification, it can be seen that the model used in this article can optimize the reactive power compensation strategy of the distribution network, reduce system costs, reduce system losses, reduce system carbon emissions, and thus improve the operating conditions of the distribution network. The improved the economic and environmental benefits of the distribution network during operation ensure its safe and reliable operation while promoting the coordinated development of carbon markets and loss reduction strategies.
Author Contributions
Conceptualization, H.A. and B.C.; methodology, T.Z.; validation, H.A., Q.Z. and Y.W.; formal analysis, X.J.; investigation, T.Z.; writing—original draft preparation, T.Z.; writing—review and editing, Y.W.; supervision, H.A., X.J., Q.Z. and B.C.; project administration, H.A. All authors have read and agreed to the published version of the manuscript.
Funding
This research was funded by [National Key R&D Program of China] grant number [2022YFB2703500], [National Natural Science Foundation of China] grant number [52007032], [Basic Research Program of Jiangsu Province] grant number [BK20200385], [State Grid Jiangsu Electric Power Research Institute project] grant number [SGJSDK00XTJS2310252]. And The APC was funded by [State Grid Jiangsu Electric Power Research Institute project] grant number [SGJSDK00XTJS2310252].
Data Availability Statement
Data available on request due to restrictions. The data presented in this study are available on request from the corresponding author. The data are not publicly available due to privacy.
Conflicts of Interest
The authors declare no conflict of interest.
References
- Wan, H. Application of Technical Loss Reduction Measures in Lean Improvement of Online Loss Management. J. Jiangxi Electr. Power Vocat. Tech. Coll. 2022, 35, 7–8. [Google Scholar]
- Usman, M.; Coppo, M.; Bignucolo, F.; Turri, R. Losses management strategies in active distribution networks: A review. Electr. Power Syst. Res. 2018, 163, 116–132. [Google Scholar] [CrossRef]
- Gangil, G.; Goyal, S.K.; Srivastava, M. Optimal Placement of DG for Power Losses Minimization in Radial Distribution System using Backward Forward Sweep Algorithm. In Proceedings of the 2020 IEEE International Conference on Advances and Developments in Electrical and Electronics Engineering (ICADEE), Coimbatore, India, 10–11 December 2020; pp. 1–6. [Google Scholar] [CrossRef]
- Manirakiza, J.F.; Ekwue, A.O. Technical Losses Reduction Strategies in a Transmission Network. In Proceedings of the 2019 IEEE AFRICON, Accra, Ghana, 25–27 September 2019; pp. 1–5. [Google Scholar] [CrossRef]
- Kundu, M.; Jadhav, S.; Bagdia, K. Technical loss reduction through active repair of distribution transformers: Results from the field. In Proceedings of the 2017 7th International Conference on Power Systems (ICPS), Pune, India, 21–23 December 2017; pp. 265–268. [Google Scholar] [CrossRef]
- Guo, X.; Guo, D.; Zhang, Y. Study on Optimal Energy Conservation and Loss Reduction Modification Scheme for Distribution Network. Power Capacit. React. Power Compens. 2014, 35, 43–49. [Google Scholar]
- Wu, J. Analysis of power grid line loss and loss reduction measures. Lamps Light. 2023, 243–245. [Google Scholar]
- Chen, Y.; Huang, Y.; Yin, H.; Li, Z.; Li, S.; Yang, X.; Liu, J. SAC-based Voltage control in Active Distribution Network with Renewable Energy Resource. In Proceedings of the 2023 Panda Forum on Power and Energy (PandaFPE), Chengdu, China, 27–30 April 2023; pp. 2134–2138. [Google Scholar] [CrossRef]
- Hao, L.; Wang, G.; Song, P.; Hu, Q. Voltage Control Method Based on Coordinative Optimization of User Energy Saving and Power Loss Reduction in Distribution Network. In Proceedings of the 2018 2nd IEEE Conference on Energy Internet and Energy System Integration (EI2), Beijing, China, 20–22 October 2018; pp. 1–6. [Google Scholar] [CrossRef]
- Wang, G.; Guo, W.; Liao, J.; Chen, G.; Zhang, Y. Distribution Network Reactive Power Optimization and Loss Reduction Strategy Considering DG Randomness. Autom. Instrum. 2018, 33, 5–10. [Google Scholar]
- Zhang, K.; Yang, X.; Bu, C.; Ru, W.; Liu, C.; Yang, Y.; Chen, Y. Theoretical Analysis on Distribution Network Loss Based on Load Measurement and Countermeasures to Reduce the Loss. Chin. Soc. Electr. Eng. 2013, 33, 92–97. [Google Scholar]
- Monteiro, R.V.; Guimarães, G.C.; Silva, F.B.; da Silva Teixeira, R.F.; Carvalho, B.C.; Finazzi, A.D.P.; de Vasconcellos, A.B. A Medium-Term Analysis of the Reduction in Technical Losses on Distribution Systems with Variable Demand Using Artificial Neural Networks: An Electrical Energy Storage Approach. Energy 2018, 164, 1216–1228. [Google Scholar] [CrossRef]
- Nowdeh, S.A.; Davoudkhani, I.F.; Moghaddam, M.H.; Najmi, E.S.; Abdelaziz, A.Y.; Ahmadi, A.; Razavi, S.E.; Gandoman, F.H. Fuzzy multi-objective placement of renewable energy sources in distribution system with objective of loss reduction and reliability improvement using a novel hybrid method. Appl. Soft Comput. 2019, 77, 761–779. [Google Scholar] [CrossRef]
- Jahani, M.T.G.; Nazarian, P.; Safari, A.; Haghifam, M.R. Multi-objective optimization model for optimal reconfiguration of distribution networks with demand response services. Sustain. Cities Soc. 2019, 47, 101514. [Google Scholar] [CrossRef]
- Pegado, R.; Ñaupari, Z.; Molina, Y.; Castillo, C. Radial distribution network reconfiguration for power losses reduction based on improved selective BPSO. Electr. Power Syst. Res. 2019, 169, 206–213. [Google Scholar] [CrossRef]
- Kang, C.; Zhou, T.; Chen, Q.; Wang, J.; Sun, Y.; Xia, Q.; Yan, H. Carbon Emission Flow From Generation to Demand: A Network-Based Model. IEEE Trans. Smart Grid 2015, 6, 2386–2394. [Google Scholar] [CrossRef]
- Lu, Z.; Bai, L.; Wang, J.; Wei, J.; Xiao, Y.; Chen, Y. Peer-to-Peer Joint Electricity and Carbon Trading Based on Carbon-Aware Distribution Locational Marginal Pricing. IEEE Trans. Power Syst. 2023, 38, 835–852. [Google Scholar] [CrossRef]
- Wang, D.; Zhang, Q.; Cui, H.; Cheng, H.; Zhang, X.; Fan, L. A Precise Carbon Emission Model on Electricity Consumption Side with Carbon Emission Flow Theory. In Proceedings of the 2022 4th International Conference on Electrical Engineering and Control Technologies (CEECT), Shanghai, China, 16–18 December 2022; pp. 1126–1131. [Google Scholar] [CrossRef]
- Li, Y.; Wang, D.; Zhang, Q.; Pan, X.; Xu, Y.; Sun, X. Energy Flow and Carbon Emission Flow Analysis for the Integrated Energy Station. In Proceedings of the 2022 IEEE 5th International Electrical and Energy Conference (CIEEC), Nangjing, China, 27–29 May 2022; pp. 596–601. [Google Scholar] [CrossRef]
- Chai, Z.; Shen, X.; Sun, H. Impacts of DGs in Active Distribution Network Considering Bi-Directional Power Flow and Carbon Emission Flow Theory. In Proceedings of the 2022 IEEE 6th Conference on Energy Internet and Energy System Integration (EI2), Chengdu, China, 11–13 November 2022; pp. 309–314. [Google Scholar] [CrossRef]
- Kang, C.; Zhou, T.; Chen, Q.; Xu, Q.; Xia, Q.; Ji, Z. Carbon emission flow in networks. Sci. Rep. 2012, 2, 479. [Google Scholar] [CrossRef] [PubMed]
- Zhou, T.; Kang, C.; Xu, Q.; Chen, Q. Preliminary Investigation on a Method for Carbon Emission Flow Calculation of Power System. Autom. Electr. Power Syst. 2012, 36, 44–49. [Google Scholar]


Disclaimer/Publisher’s Note: The statements, opinions and data contained in all publications are solely those of the individual author(s) and contributor(s) and not of MDPI and/or the editor(s). MDPI and/or the editor(s) disclaim responsibility for any injury to people or property resulting from any ideas, methods, instructions or products referred to in the content. |
© 2023 by the authors. Licensee MDPI, Basel, Switzerland. This article is an open access article distributed under the terms and conditions of the Creative Commons Attribution (CC BY) license (https://creativecommons.org/licenses/by/4.0/).