1. Introduction
German freight traffic is mainly based on road transportation. About 4.56 billion tons of cargo were moved within Germany in 2020, whereof 80% of the total freight volume is transported by trucks. In comparison, the second largest carrier type by mass is rail transport, accounting for a share of less than 10% in 2020, a corresponding ratio of 1:8 in freight transportation mass [
1]. A concerning development in relation to climate change is that the truck transportation sector is growing while the rail sector has a slight downward trend [
1,
2]. Despite the improvements in engine technology and decreasing emission values per vehicle, the total fleet emissions remained nearly constant in the last 20 years due to an increasing fleet [
3,
4]. The transportation sector is currently responsible for about 20% of the emitted carbon dioxide equivalent (CO
-eq) in Germany. Out of this, approximately 40% can be attributed to truck transportation [
5].
Despite the technical potential reduction in CO
-eq emissions from conventional powertrains in the upcoming years, the growing size of the truck fleet and the increasing volume of freight transportation will outweigh these savings and lead to a net increase in total fleet emissions. Because of the current dominance of road freight transportation over rail [
1], a significant shift towards rail in the short term is unlikely. In order to reach the German and EU climate targets, the introduction of zero-emission trucks, such as hydrogen-powered and battery electric trucks (E-Trucks), is inevitable. Currently, the urban bus sector is leading the way in zero-emission heavy-duty vehicles, with 3836 battery electric vehicles in service in Europe in 2021 [
6]. The comparatively short daily mileage and the possibility of intermediate charging at turnaround points make it possible to carry out a complete change in drive system with the technology available today and at moderate additional total cost of ownership (TCO) of 13–15% compared to diesel-powered buses [
7]. It is not surprising that the first pioneers in the field of zero-emission trucks are in the field of urban distribution transport, which is very similar to urban bus transport in terms of the requirements placed on range and charging infrastructure. Along with many promising field trials using E-Trucks for urban distribution, there are also recent studies that consider the technical and financial difficulties for a complete conversion of urban heavy distribution traffic to E-Trucks to be low [
8]. In contrast, the long-haul freight transport sector has so far been classified as a very difficult sector to decarbonize. Only recently, E-Trucks suitable for long-haul have been introduced by German truck manufacturers. However, their applicability in a real-world setting is still restricted as there is no sufficient energy supply along German and European highways. Hence, the deployment of an adequate number of charging stations nationwide is crucial. Aside from the sheer number and availability, charging time, and thus charging power, is another critical factor.
In order to address the challenges associated with the introduction of E-Trucks, the project
Hochleistungsladen im LKW-Fernverkehr (HoLa) [
9] is investigating a nationwide introduction and expansion of a high-performance charging network for long-haul freight transportation with heavy trucks in Germany. A crucial aspect of this project is to thoroughly examine efficient energy supply and strategically determine optimal charging site locations, ensuring adequate charging capabilities for E-Trucks [
10]. In this context, this paper develops an infrastructural proposal for different levels of truck traffic electrification based on the truck traffic volume of 2020 in Germany. The focus of this work is on analyzing and modeling the current truck traffic to implement a long-distance electric truck traffic simulation with high adaptability to respond to technical developments.
The selection of an appropriate traffic simulation approach is crucial for generating an accurate and reliable model. Basic traffic simulation strategies can be categorized into three types: macroscopic, mesoscopic and microscopic [
11]. Macroscopic traffic simulations provide an aggregate of traffic metrics, including the average speed, traffic flow information and traffic density [
12], and are used in traffic flow analysis [
13], such as statistical dispersion models or freeway traffic models [
14]. The microscopic approach, on the other hand, is based on individual vehicle interaction modeling in order to determine the characteristics of single journeys, as well as the speed, the location at a given time [
12] or the State of Charge (SoC). Examples for microscopic simulation approaches include cellular automata, multi-agent simulation and particle system simulation [
13]. Mesoscopic models are hybrid models, combining features of both above-mentioned strategies [
12].
The macroscopic approach is frequently used for large-scale traffic simulation as it requires less computing power compared to microscopic methods. Soylu et al. (2016) implemented a macroscopic model in order to build a demand-oriented charging infrastructure for electric vehicle traffic considering two approaches: first, the repetitive and short trips travel and, second, long-distance trips [
15].
However, for a detailed model of truck traffic and the following energy demand analysis, a higher degree of traffic resolution is required. Furthermore, to design a sufficient charging infrastructure with a high degree of accuracy and specificity, a detailed determination of the charging behavior, the SoC history and the accumulation of trucks at roads and rest areas are necessary, making a macroscopic traffic simulation less suitable.
Other case studies on charging infrastructure and truck traffic simulation use an agent-based simulation approach (e.g., Multi-Agent Transport Simulation (MATSim)), which is a microscopic method. For example, Gallet et al. (2019) developed a microscopic traffic simulation platform to model an electric public bus operation system and the corresponding bus charging infrastructure. The simulation provided detailed results related to the energy demand and the charging infrastructure requirements [
16]. Göhlich et al. (2021) used a methodology built around a microscopic transport simulation to investigate strategies for decarbonizing the entire urban transport sector. They explicitly consider heavy urban distribution traffic and urban municipal vehicles, such as waste collection vehicles, and are able to make precise statements on the amount of vehicles required, necessary ranges and charging requirements [
17]. The framework described above is also used to explicitly design charging infrastructure for heavy urban distribution transport, both in operators depots and in public locations [
18]. A multi-agent-based freight traffic simulation with the focus on long-haul freight traffic in Germany is implemented by Lu et al. (2022) [
19]. All the examples mentioned above highlight the suitability of a microscopic simulation approach as it enables a detailed analysis of large-scale scenarios, which is required for approaching a high-performance German-wide infrastructural charging design for long-distance truck traffic.
In order to select an agent-based simulation framework, Nguyen et al. (2021) provide an overview of several options [
20]. The simulation framework selected must meet the following requirements: the framework is designed for large-scale scenarios, is adaptable and open-source, contains a built-in electric vehicle module and traces resource usage of the charging facilities, as well as the energy demand of the E-Trucks.
The Fraunhofer Institute for Systems and Innovation Research ISI is currently elaborating design approaches for the public fast-charging infrastructure for E-Trucks. The researchers use macroscopic approaches to determine a charging infrastructure network on a European scale [
21,
22] and also propose a German-wide infrastructure design [
23,
24]. They use a generic approach to locate charging sites, based on their distance from each other, with a charging site interval of every 50 km or 100 km along important highways. In order to determine the charger quantity of each charging site, Plötz et al. (2020) utilized a queuing model with an average queuing time of 5 min. Furthermore, using their methods, they determined the required charging facilities for eight different scenarios varying the electrification level (5% and 15%), the distance interval of charging sites (50 km and 100 km) and the average charging power (350
and 720
) [
24]. Assuming an electrification level of 15%, a public charging rate of 50%, an average charging power of 720
and an average queuing time of less than 5 min, Speth et al. (2022) determined 267 charging sites for the 50 km location distance interval, with 2–8 chargers per site, and 142 charging sites, with 2–13 chargers per site, for a 100 km distance interval charging network [
23]. The generic distance interval between charging sites could lead to an unrealistic distribution within the recharging network. However, the results of these studies are intended to be used for comparison with the outcome of this relying work.
Currently, there is a research gap in determining a large-scale charging infrastructure based on a microscopic approach. Furthermore, the geographical location, density and distribution of rest areas as well as their associated infrastructural prerequisites has not yet been considered in designing a high-performance recharging network. To address this gap, the work at hand considers a scenario that more accurately reflects the real world. The aim is to provide insights into the design of a realistic and implementable recharging network for E-Trucks, taking into account the locations and necessary infrastructure requirements for rest areas.
To implement a high-performance simulation framework for infrastructural charging designs, methods and approaches are being elaborated that are based on more detailed and realistic data than previous approaches.
Section 2 outlines the methodology used to model the German long-haul electric truck traffic, including the exploratory data analysis of the current traffic volume, as well as the simulation framework implementation, assumptions, infrastructural design approaches, traffic analysis and model selection.
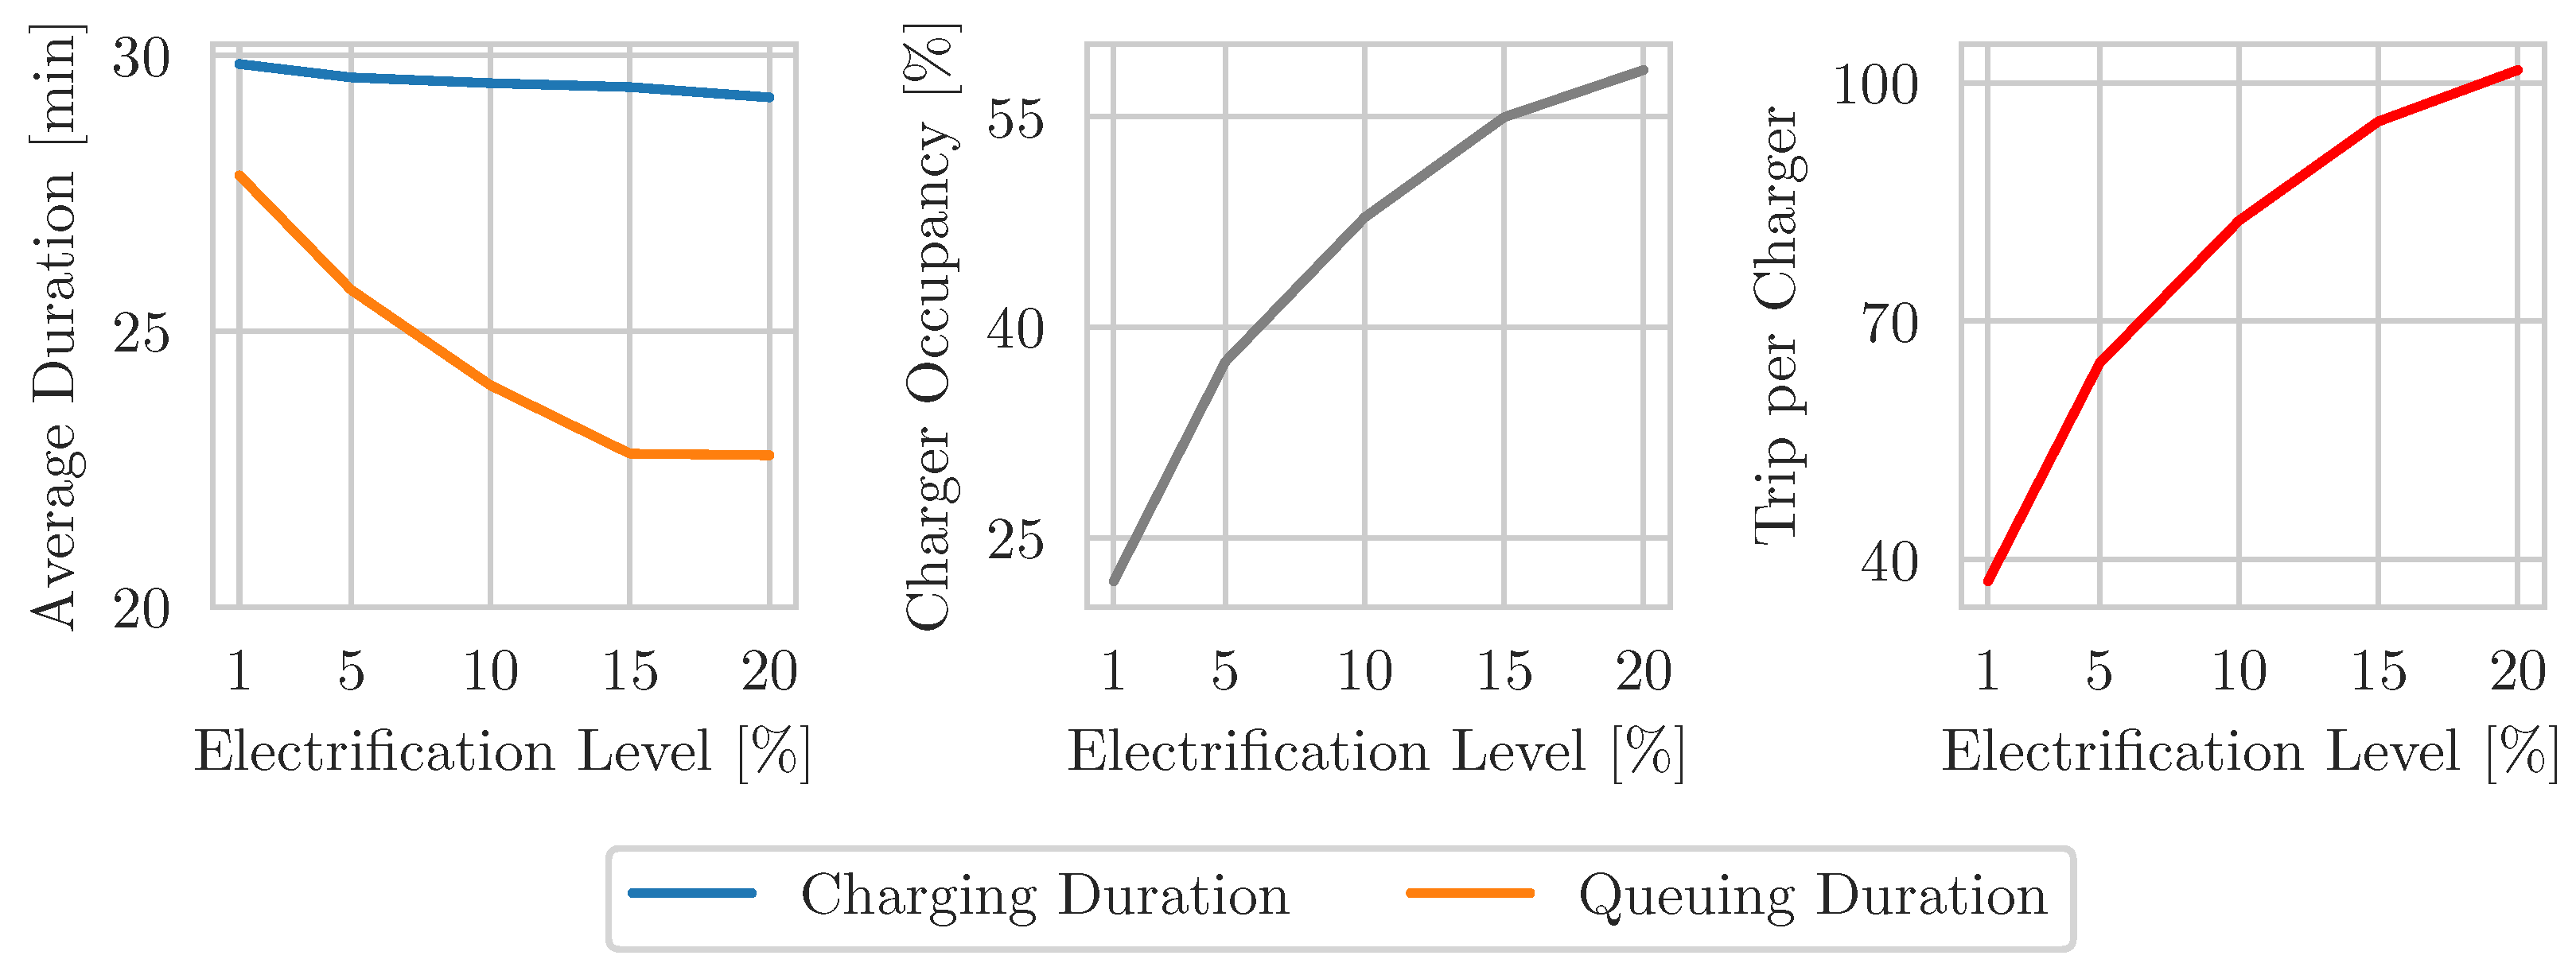
The results are shown in
Section 3. The focus lies in the development of the charging infrastructure depending on the degree of electrification. Especially significant are sufficient recharged E-Trucks, as well as a high occupation rate of the charging facilities. Finally, these results are critically discussed in
Section 4 and concluded in
Section 5.
2. Methods
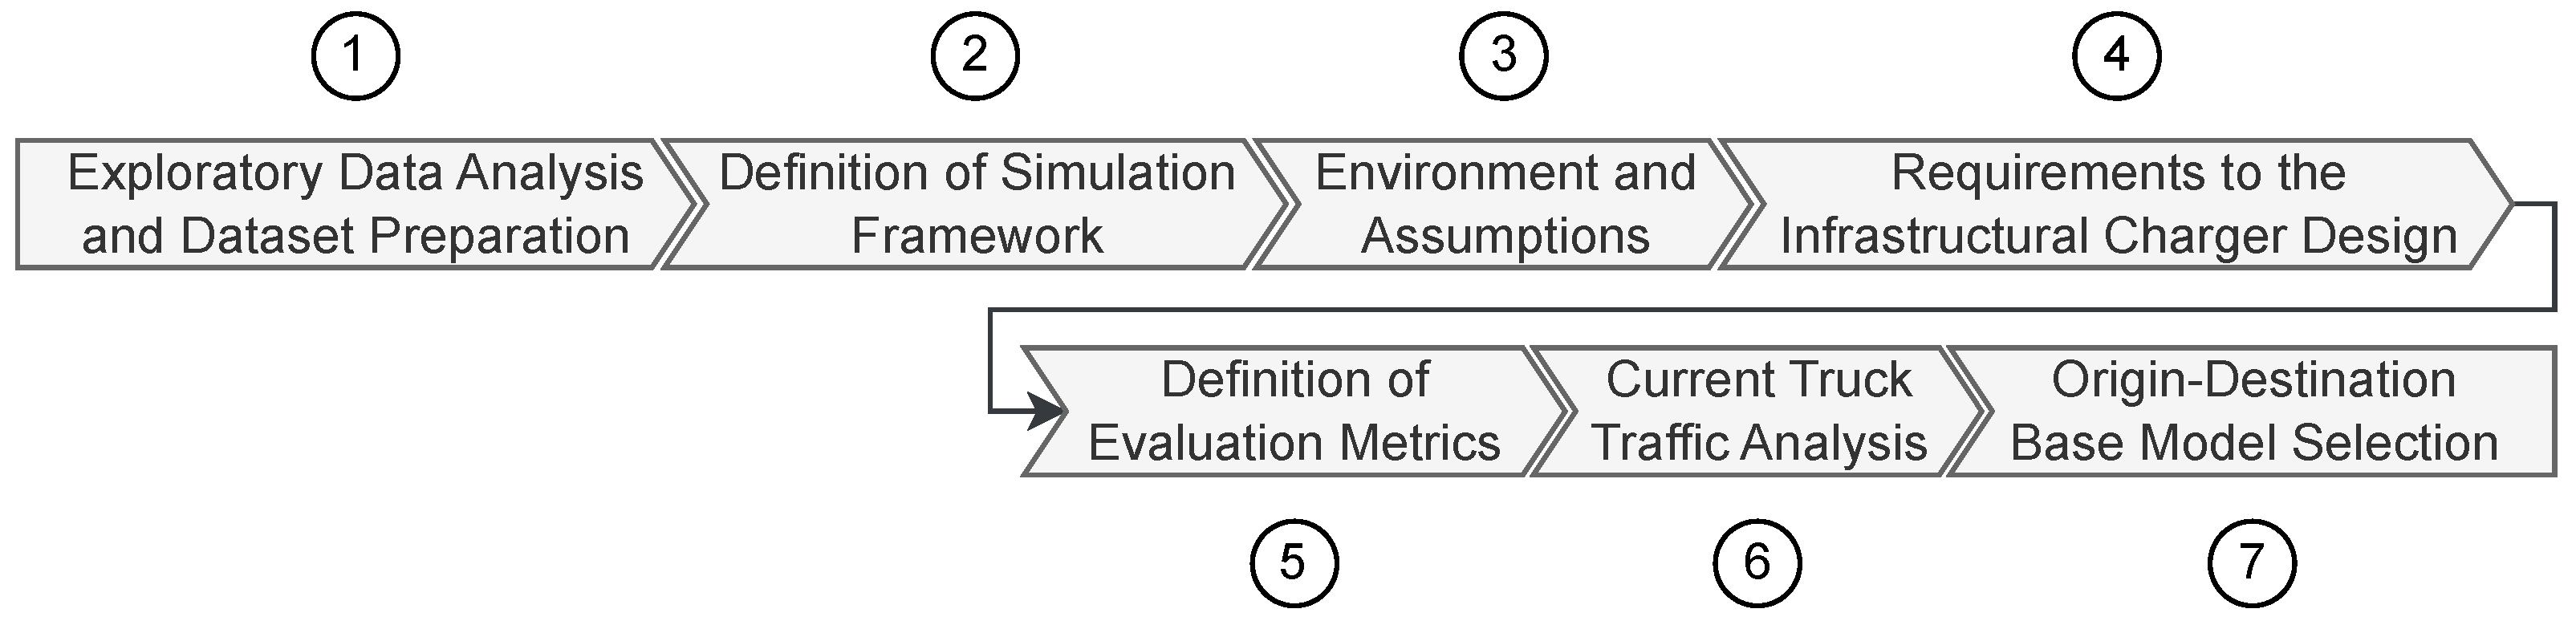
The methodology can be segregated into 7 sequential stages as illustrated in
Figure 1. The initial stage comprises the exploratory data analysis and the generation of the simulation environment for a specific multi-agent simulation framework. The subsequent stage involves executing the multi-agent simulation and data collection, followed by the final stage of post-processing and the evaluation.
2.1. Scenario Preparation
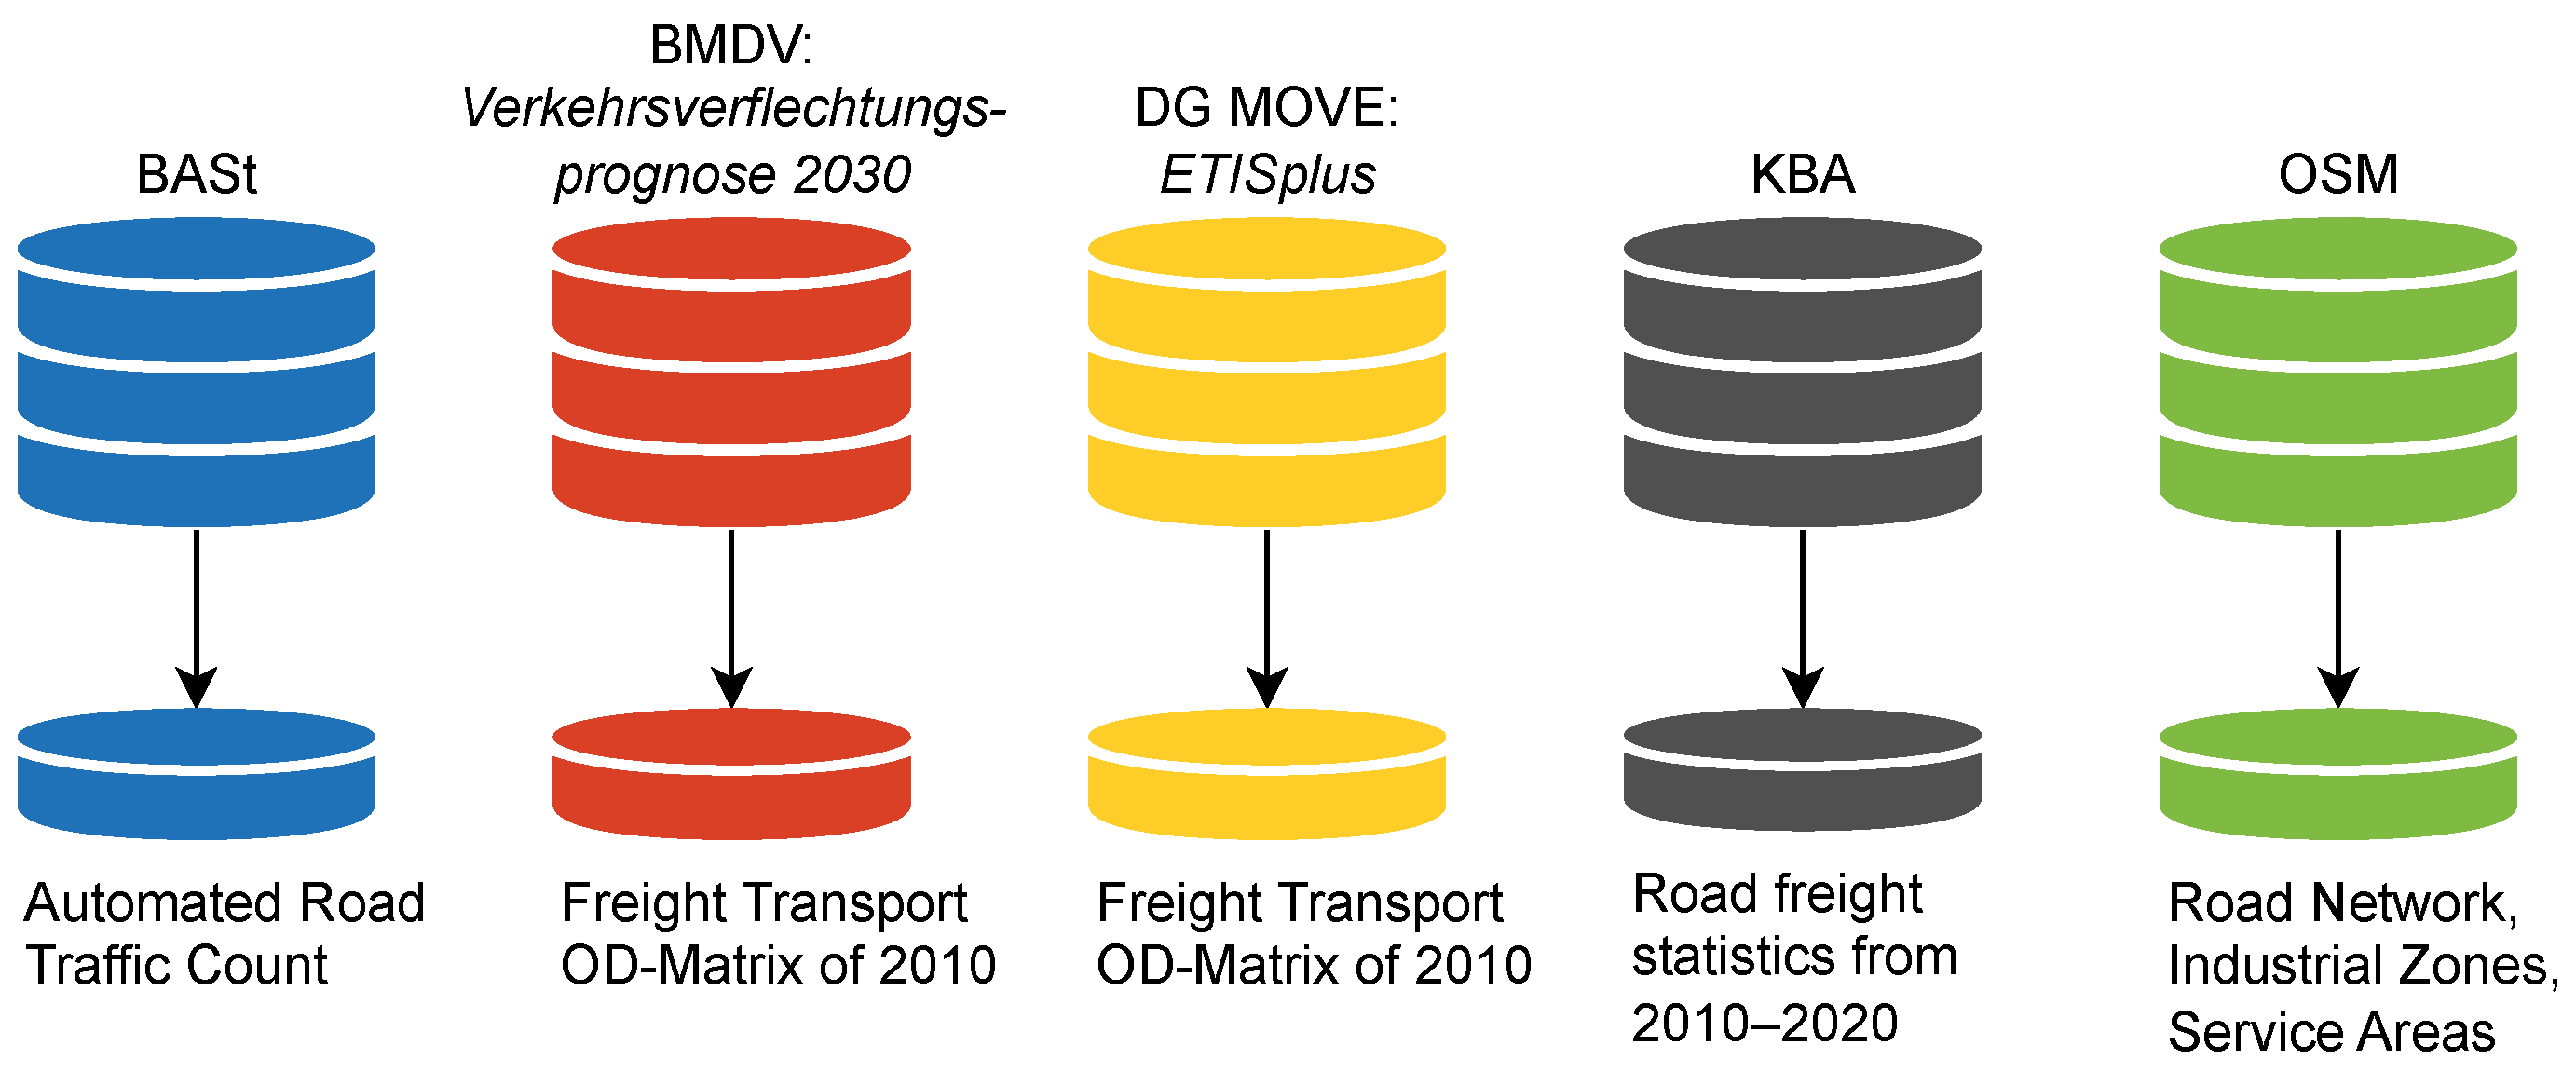
The following provides a brief overview of the main data that are required to analyse the current traffic and to build a simulation environment. For analysis as well as for modeling and simulation, several datasets are used. The main data is provided by the Federal Highway Research Institute (BASt), the Federal Ministry for Digital and Transport (BMDV), the Kraftfahrt-Bundesamt (KBA), the European Commission’s Directorate-General for Mobility and Transport (DG MOVE) and OpenStreetMap (OSM). All data used is open and fully accessible. Furthermore, the data use from the different data sources is summarized in
Figure 2 and described in the following.
We apply a multi-agent simulation. These agents operate on schedules or plans based on an origin-destination (OD) matrix, which defines the transportation movement from specific locations. Two appropriate databases where examined for this purpose. The first is provided by the
ETISplus project (Project full title:European Transport policy Information System Development and implementation of data collection methodology for EU transport modelling) from the reference year 2010 [
25,
26]. A main objective of this project is traffic modeling (both passengers and freight) at the origin destination level NUTS-3 (full title:
Nomenclature des unités territoriales statistiques—A hierarchical system to identify and classify regions within the European Union and the United Kingdom [
27]) in order to identify new reference data for EU transport strategies. The second dataset is extracted from the
Verkehrsverflechtungsprognose 2030 (english Traffic Interconnection Forecast 2030) [
28]. In essence, this project collects the data from the reference year 2010, which will serve as base data to forecast traffic relations in 2030 to provide a general orientation framework for long-term transport policy in Germany. The content of the dataset is passenger and freight transport of all types. Geographical differentiation was made within Germany according to NUTS-3 regions.
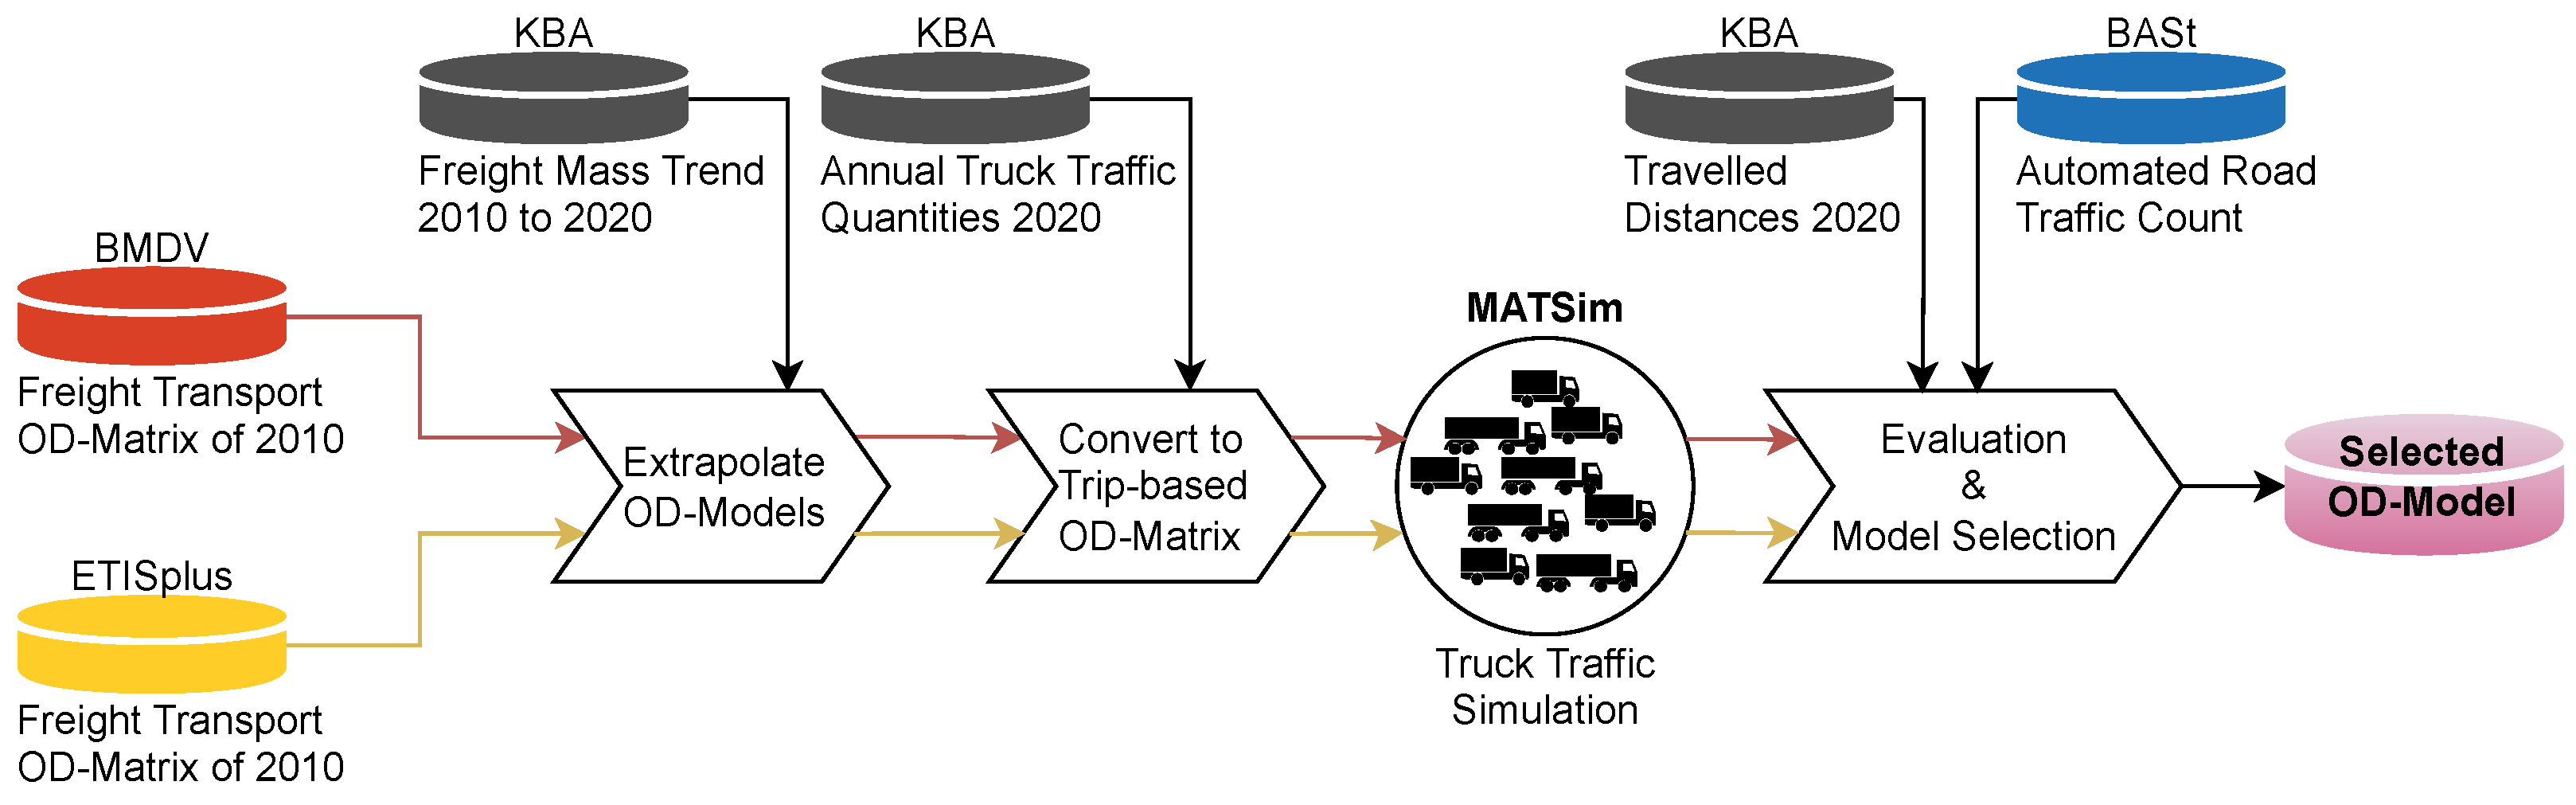
In order to compare the accuracy of these two datasets, the deviation from statistical surveys is measured. The evaluation pipeline is demonstrated in
Figure 3. The base data of both datasets from 2010 are first extrapolated to the year 2020 with the use of the data from the KBA. The KBA summarizes a wide range of information relating to domestic and international freight transport by road on an annually basis [
4]. In particular the total transported freight and information relating to traveled distance are important to validate the OD models, as pointed out in
Figure 3. Since the OD matrices provide freight mass models, the KBA database will also be used to estimate the number of loaded freight trips and the fraction of unloaded trips. To convert the freight mass-based model to a journey-based model, it is assumed that the distribution within the OD matrix has only slightly altered or not changed at all, so that the proportion of total mass between two locations can be assumed to be equivalent to the share of total traffic. As soon as the models are transformed into journey-based models, their deviation from the actual truck traffic will be analyzed. Therefor, the BASt provides time-resolved data from their automatic counting stations on motorways and federal highways [
29,
30]. Among others, the dataset includes the count of different vehicle types (e.g., trucks) per hour and the location of the station. The purpose of these data is to first validate the agents behavior based on both OD models and to create a realistic schedule for the simulation.
Additionally to the OD matrix, location mapping and a road network on which the agents will operate are required. The road network as well as industrial areas, which serve as start and end points, and potential charging site locations are extracted from the OSM database [
31]. The regional OSM data of Germany is optained from [
32]. The road network comprises all roads classified under the key
highway with the values
motorway, trunk, primary, motorway_link, trunk_link or
primary_link. To maintain a realistic approach origin and destination coordinates for each trip are selected from random industrial zones within the respective NUTS-3 region area, since both freight-mass models operate on this geographical classification. In order to extract these areas the key
landuse is filtered by the value
industrial. Furthermore, potential locations for charging sites are placed at rest or service areas that already have chargers or petrol stations. Thus, the assumption can be made that infrastructural prerequisites already exist to install new chargers. To identify these areas, the key
highway is filtered by the values
services and
rest_area. Followed, by filtering these areas for the key
amenity matching the values
fuel or
charging_station. Supplementary, a maximum distance of these potential charging site locations to the motorway is defined, to avoid detours for charging actions. Based on a study by [
33], detours of up to 10 km are accepted by 75% of the surveyed participants. Consequently, and assuming up to three recharging cycles, the maximum distance from a potential charging site to the motorway has been determined to be
km.
2.2. Simulation Framework
The framework MATSim Version 15.0 is chosen, which is designed for large-scale agent-based transport scenarios [
34]. MATSim is implemented in Java (a frequently used programming language), open-source (downloadable from Github (at
https://github.com/matsim-org, accessed on 1 July 2022)), extendable, well documented [
34] and contains an implemented electric vehicle module [
35]. Thus, MATSim fulfils all the requirements for a simulation environment mentioned in
Section 1.
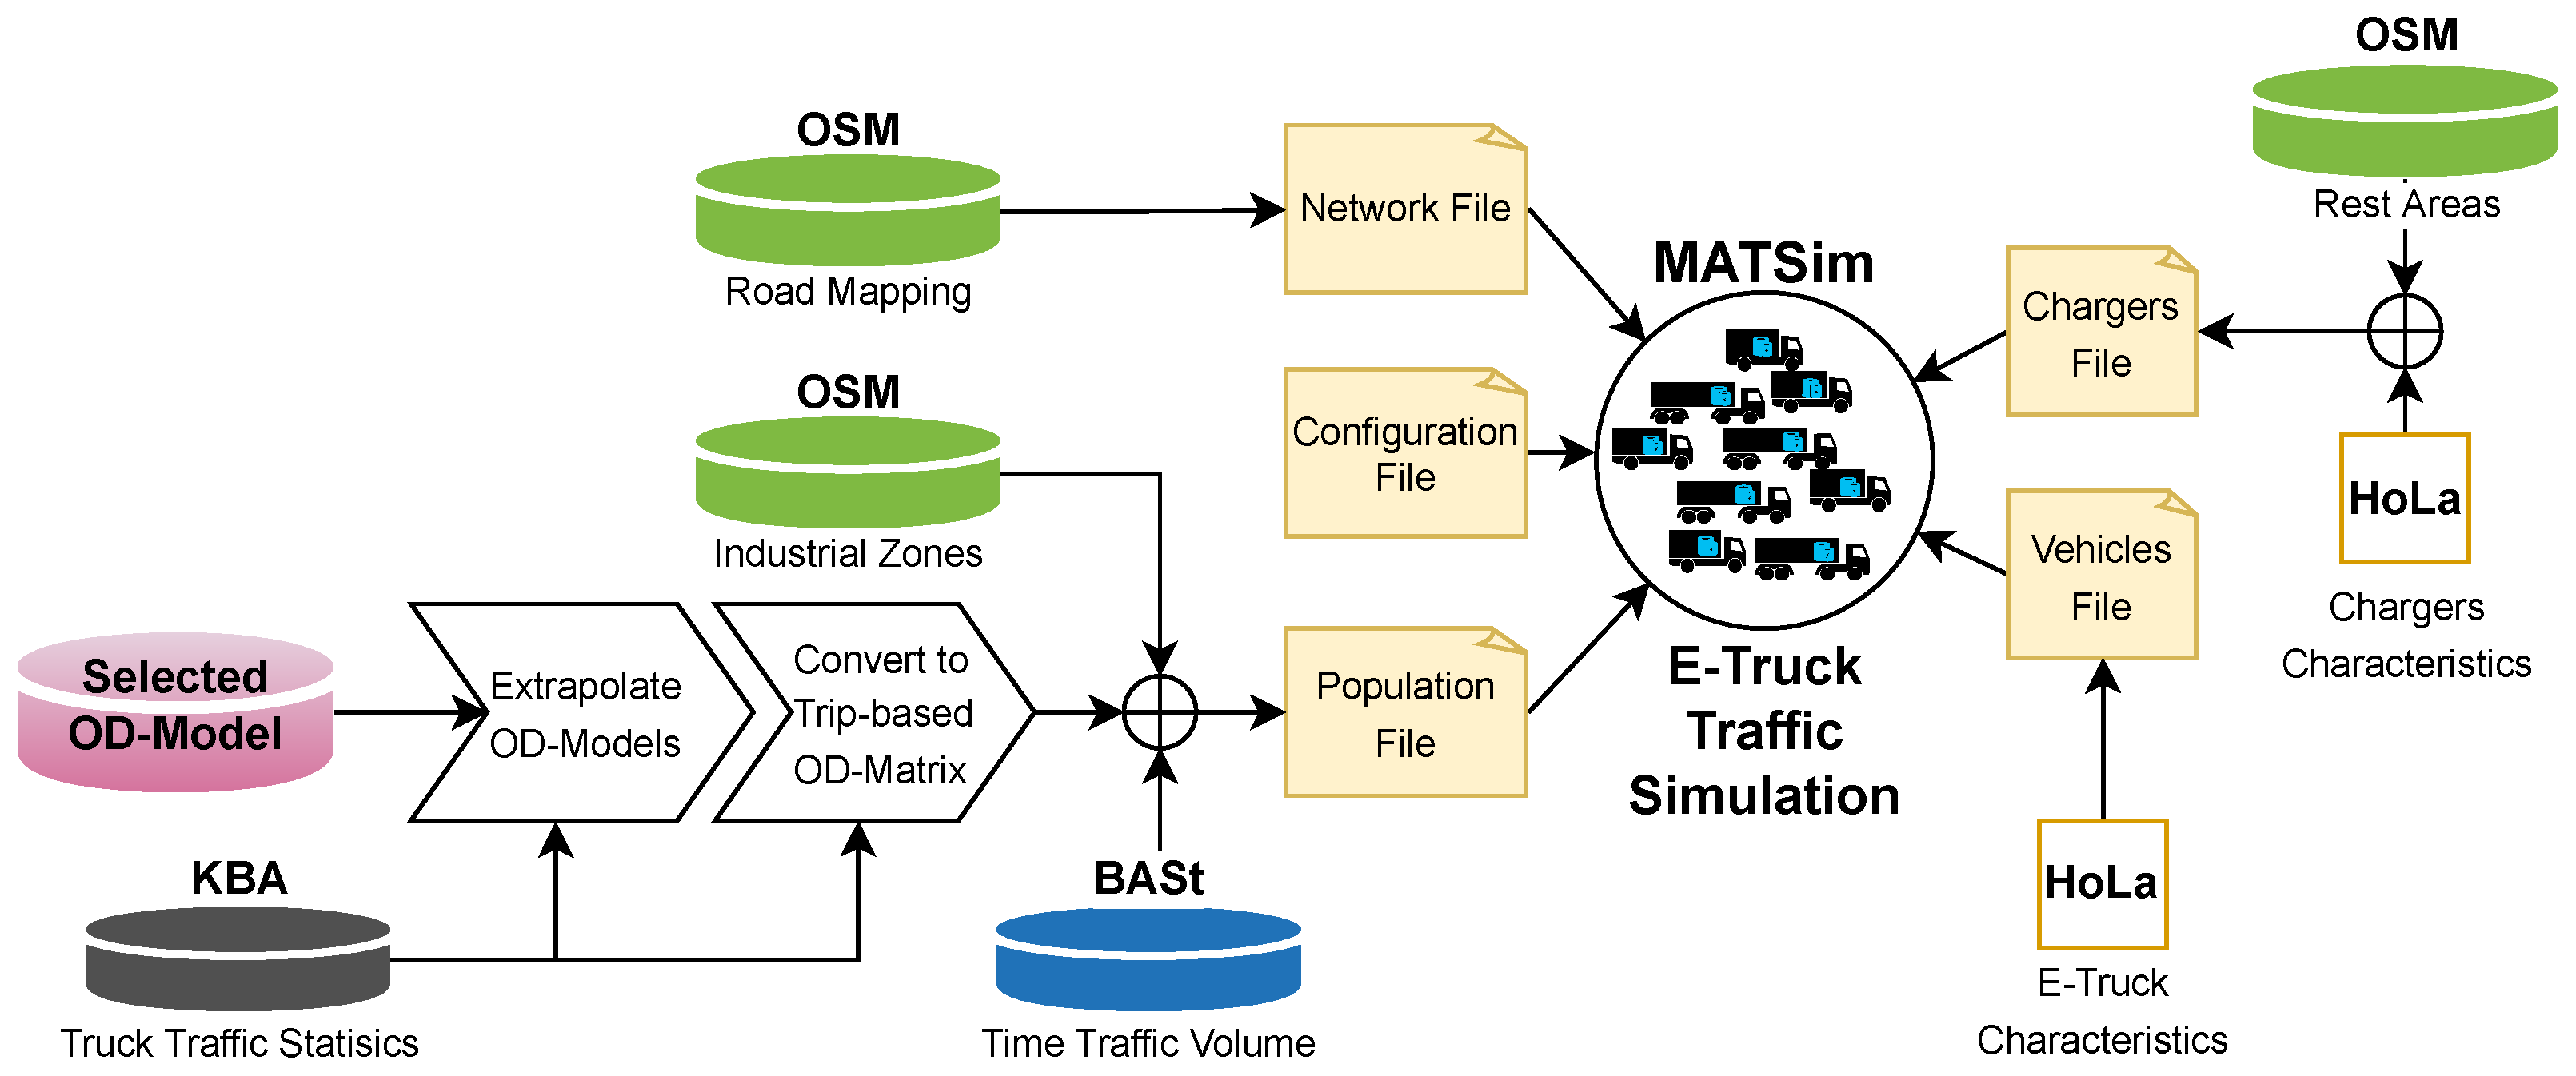
Mandatory for a simulation in MATSim are the following three input files: the configuration file, the network file and the population file. The configuration file contains the settings for each run as the simulation’s start/end time and the file paths of the network file and population file. The network file contains the road map information. The road map is described as a graph of nodes and edges within that file on which agents can move. All agents’ activities as well as their schedule are defined in the population file. The standard for input files is the Extensible Markup Language (XML) data format.
In addition to the three fundamental input files, two supplementary files (see
Supplementary Materials) are required in order to implement an E-Truck scenario based simulation in MATSim [
36]. The first file, referred to as the chargers file, comprises essential information about the charging infrastructure, including locations of charging sites, identifier, the type of the charging socket, electrical output and charger quantity per charger site. This configuration will be adjusted in iterations by the simulation, which also includes to remove unnecessary sites. The second supplementary file, the vehicle file, provides additional details about the vehicles, including the identifier for assignment to a vehicle in the population file, the vehicle type, compatible chargers, battery capacity, energy consumption and the initial SoC. The procedure for implementing the input files to build a simulation environment is illustrated in
Figure 4.
The large-scale agent-based transport simulation, which requires high computing power, is conducted on a machine equipped with an AMD Ryzen Threadripper 3970X 32-core processor running at 3.69 GHz (64 processors) and 100 GB of RAM, operating on a Windows 10 64-bit system.
2.3. Environment and Assumptions
In this study, the focus is on developing an approach to describe and model the
German Long-Distance Electric Truck-Traffic. To achieve this, all trips with at least one origin or destination within Germany are simulated (exact number and type is examined in
Section 2.6). The simulation covers a weekly average of these long-distance electric truck traffic, where long-distance is defined as a single trip with a cumulative distance exceeding 300 km. Furthermore, the study evaluates the impact of five different stages of electrification of the current truck volume. A suitable charging infrastructure design is developed for each level (1%, 5%, 10%, 15% and 20%), which includes the location and number of charging sites as well as the number of charger per charging site.
To keep the study as realistic as possible, acceptance from the freight transport and logistics industry is mandatory. Hence, the infrastructural design must take into account that charging actions must be efficient and take place during legally prescribed driving breaks or rest periods without causing significant detours [
33]. Driving breaks within the European Union are regulated as follows: at least 45 min rest (divisible into at least 15 min, followed by a break of at least 30 min) after four and a half hours of driving and 11 h rest after a total driving time of nine hours [
37]. To ensure adequate recharges, a constant rest period of 45 min is assumed in this approach.
It is assumed that all vehicles start a journey with 100% SoC. The considered E-Truck (the E-Truck characteristics are predefined by the HoLa-Project.) is equipped with a 600
battery pack and an average consumption of 1.2 kW h km
−1. The SoC-level should not drop under 20%, resulting in an effective usable energy amount of 480 kW h and a total range on a single charge of 400 km. Based on an average speed of 65 km h
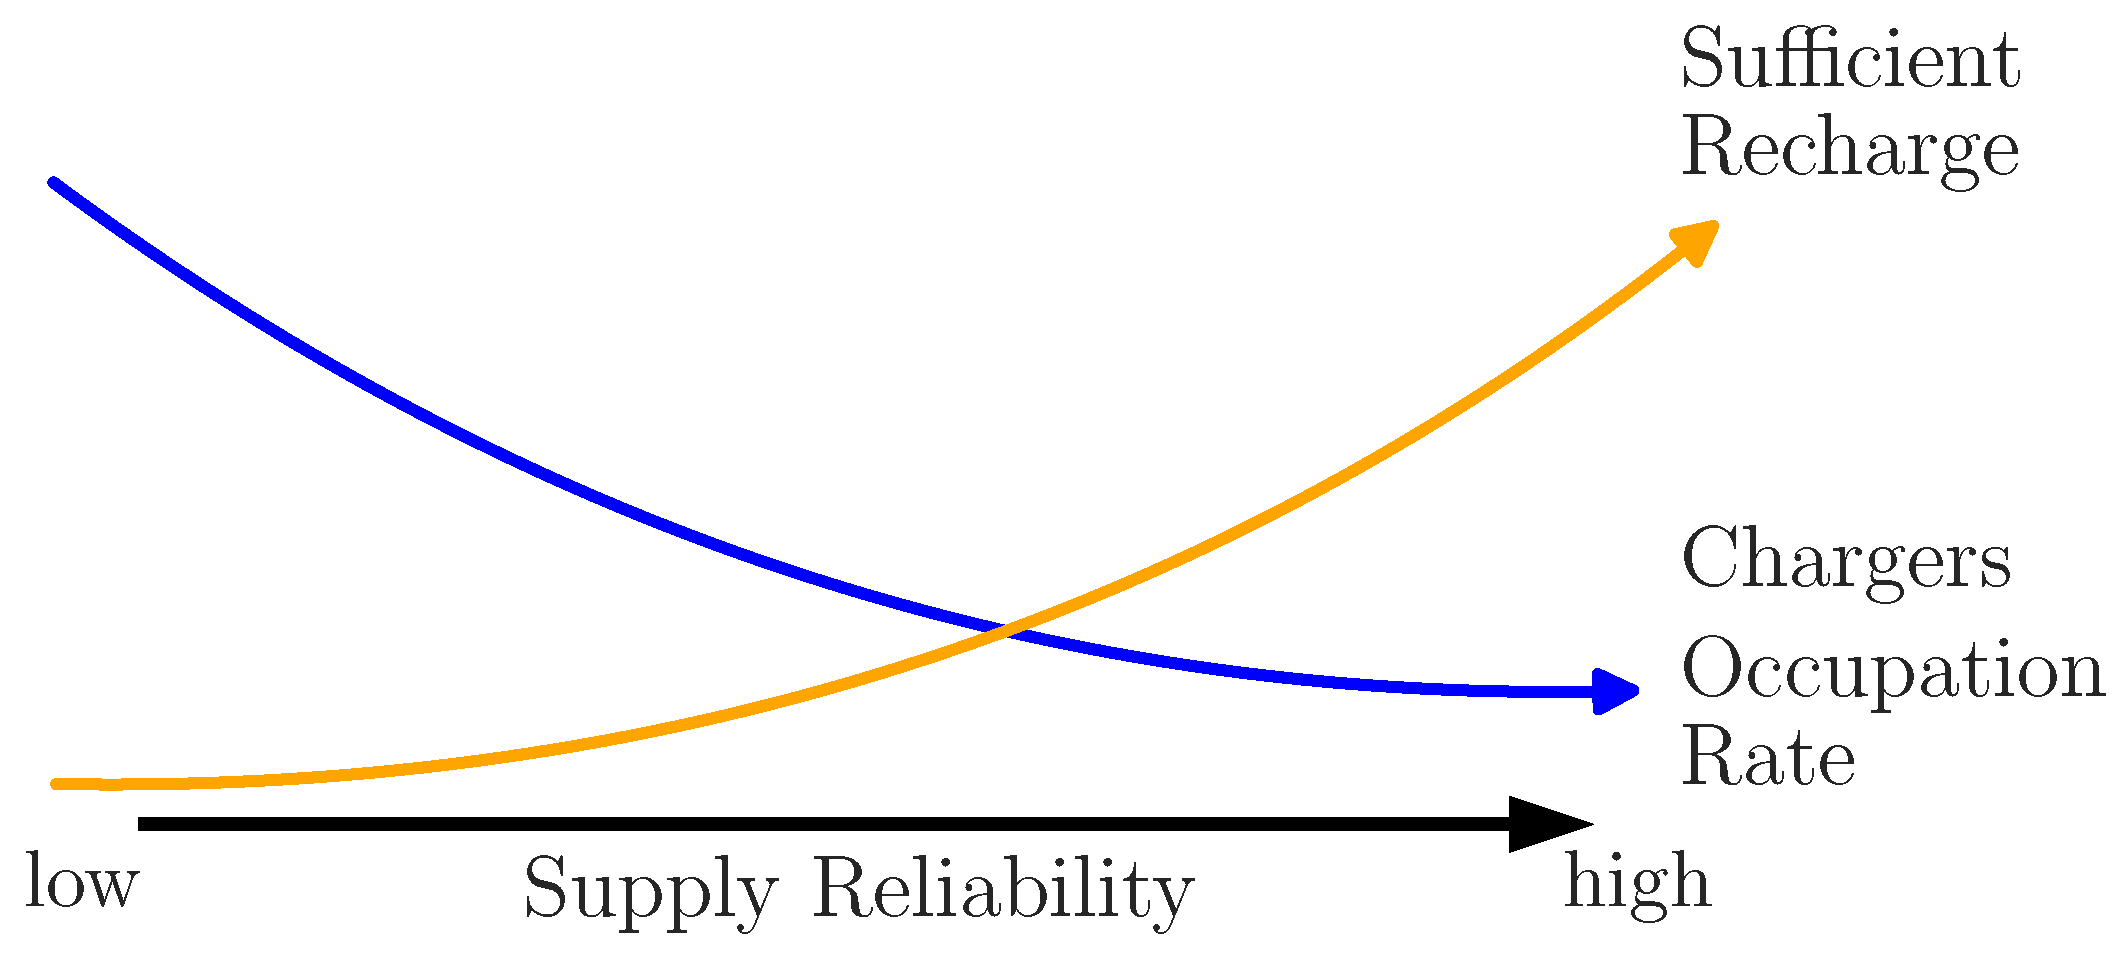
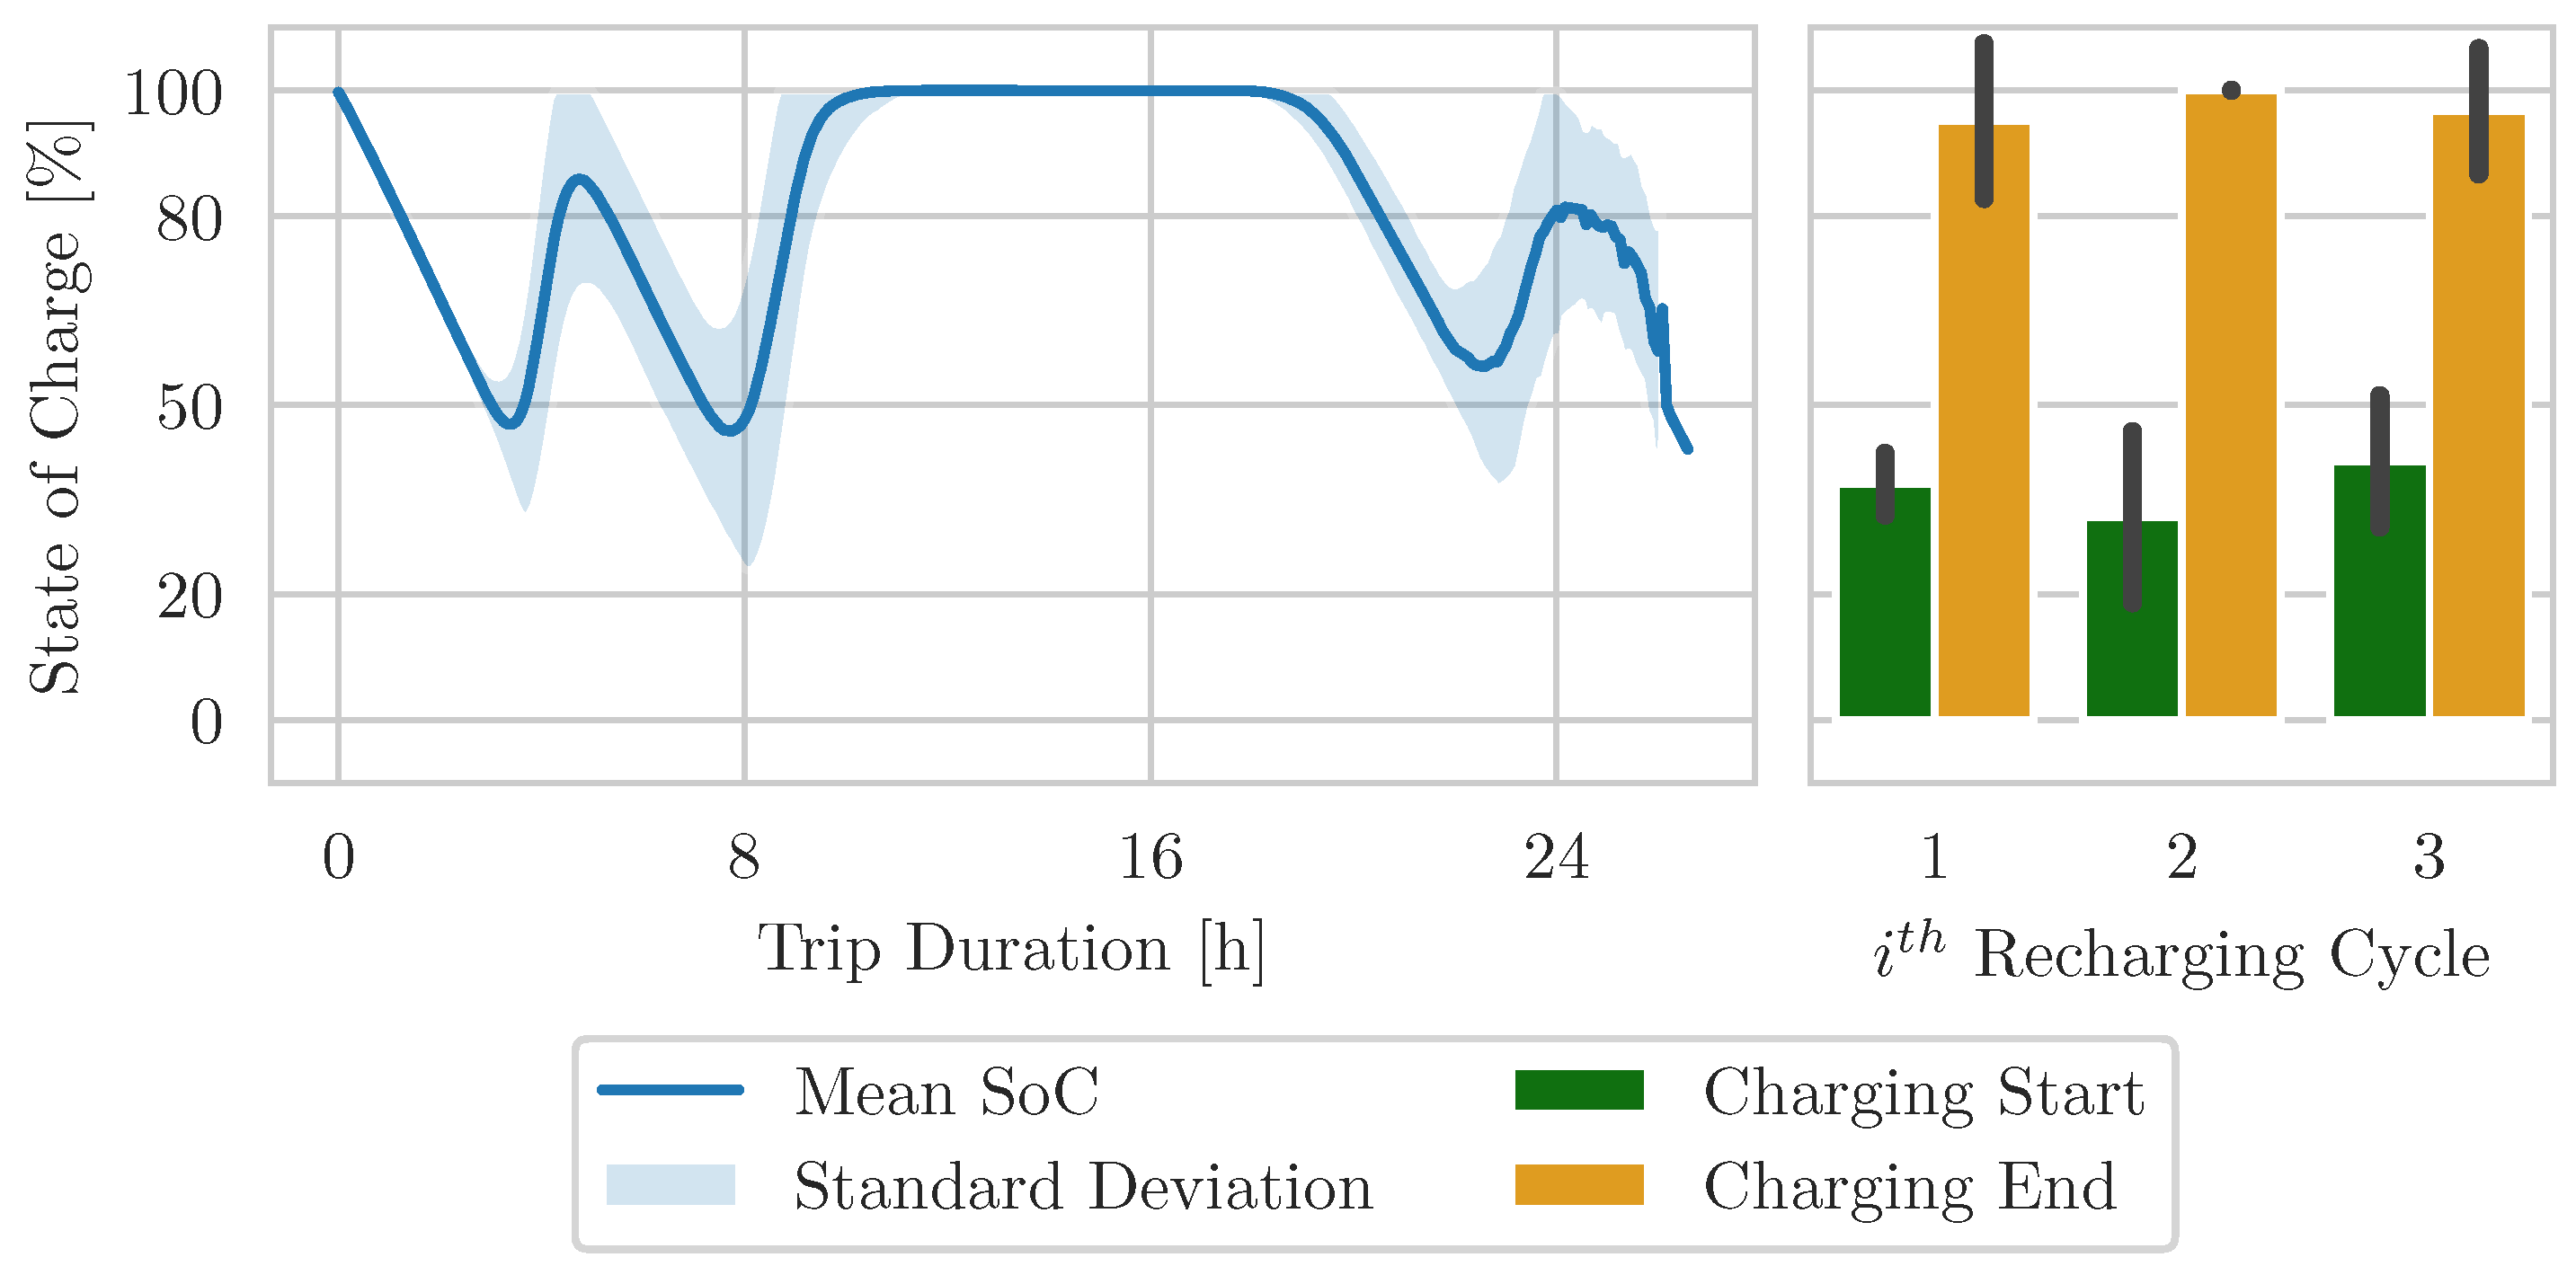
−1 and the aforementioned four and a half hours of uninterrupted driving, the maximum distance without a possible charging stop is about 300 km. These results in the conclusion that a charging cycle must end with a minimum 80% SoC, in order to avoid exceeding the lower threshold of 20% in the worst case scenario. This means, that the designed charging infrastructure must be able to recharge all trucks to at least 80% SoC during their driving break, even if a truck is queued up after arriving at the charging site. However, ensuring this SoC level for all E-Trucks may require a significant increase in charging facility building. As shown in
Figure 5, the number of sufficient recharging cycles increases with an increased supply reliability, but the effective usage rate decreases. To keep the design proposal realistic and efficient, the tradeoff of a small proportion of E-Trucks within the scenarios has to be accepted to operate below the 20% SoC threshold.
The assumed average charging power of the high-performance charging network is 720
. This value is based on the specifications of the HoLa project. The choice of this charging power is also consistent with [
23], ensuring a high degree of comparability between the design approaches. Alternatively, using an average charging power of 350
is also feasible for comparison purposes. However, a recharging event from 40% to 80% SoC takes 41 min, which is likely to lead to a high charger number to ensure sufficient recharging.
As mentioned in
Section 2.1, the road mapping is based on Germany’s main road network, limiting the agents’ to act within the inner German borders. E-Trucks originating or ending outside of Germany start or terminate at the border. For this, the nearest road at the border to the corresponding region is identified and designated as the origin or destination of the respective E-Truck.
2.4. Infrastructural Charger Design
Approaching charging sites are preplaned actions, as well as the origin and the destination. Thereby, a modified routing module of MATSim searches for the fastest route, determines the distance and searches for charging locations as soon as a route section exceeds 300 km. An 800
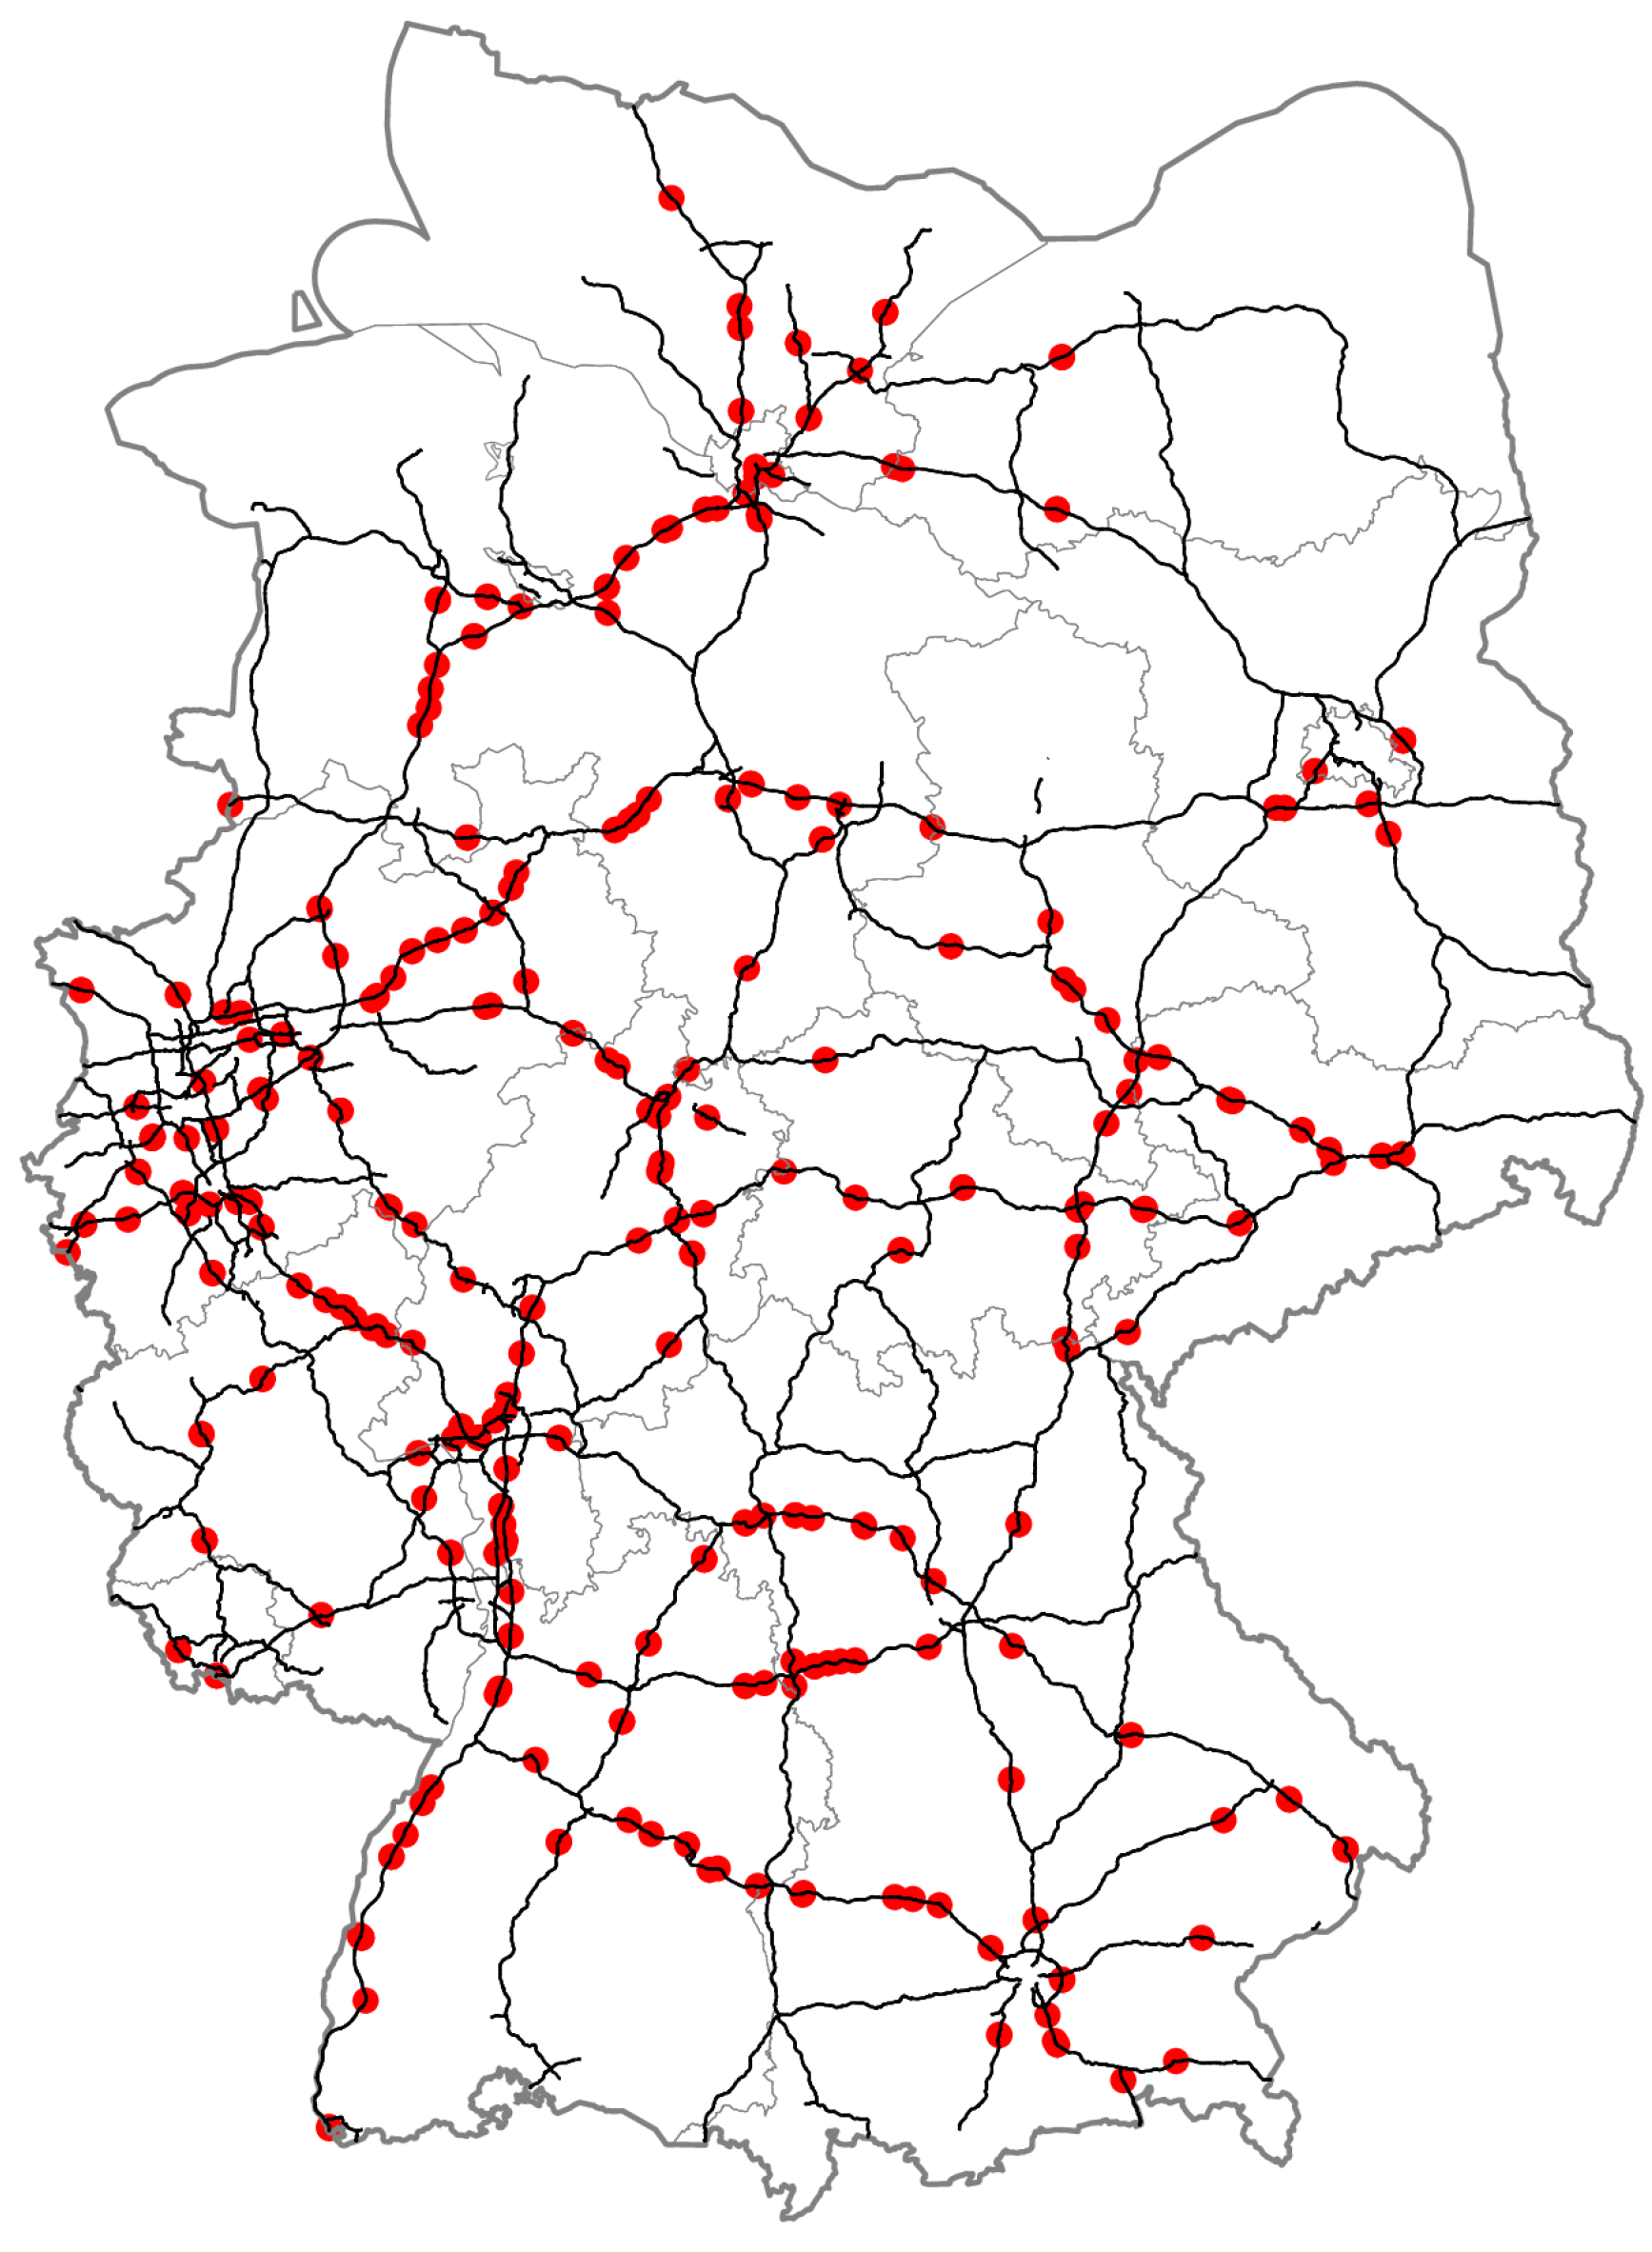
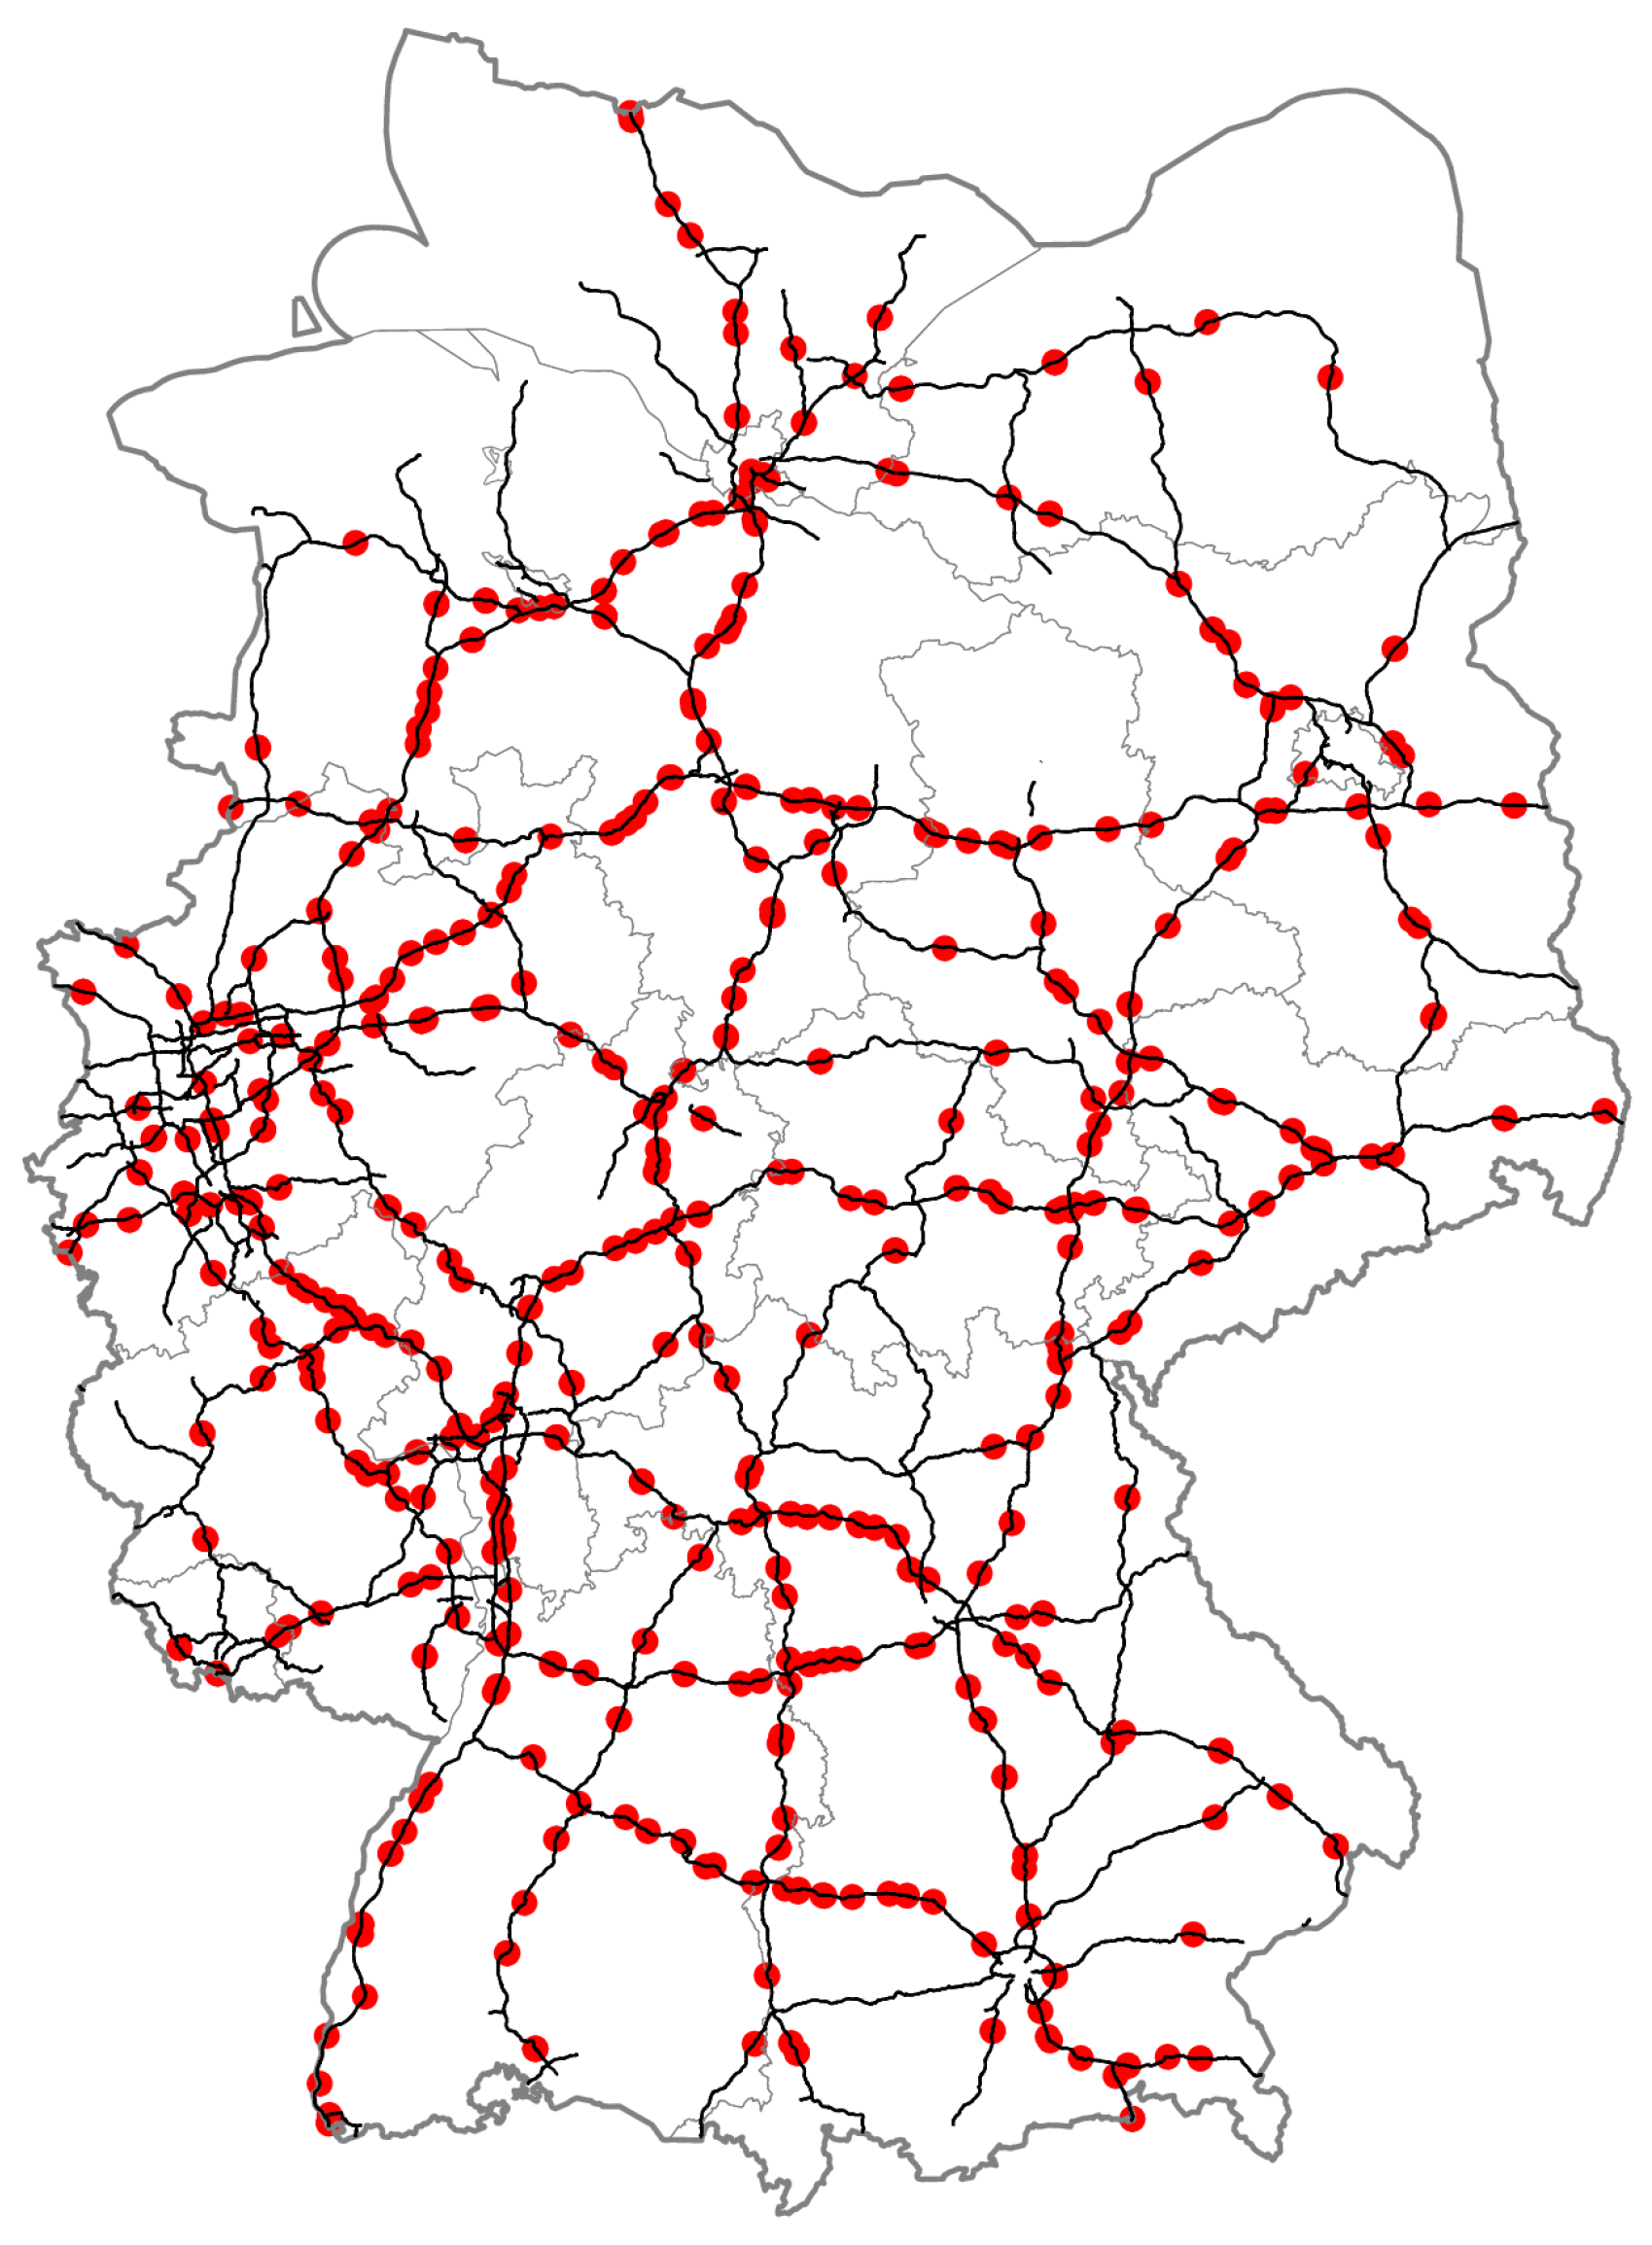
journey for example would be divided into 3 legs with 2 recharging stops. To ensure supply reliability of chargers, the charging infrastructure design must consider two crucial aspects. First, the locations of the potential charging sites and second the number of charger per site. The locations are ascertained by the existing rest and service station infrastructure, as previously indicated in
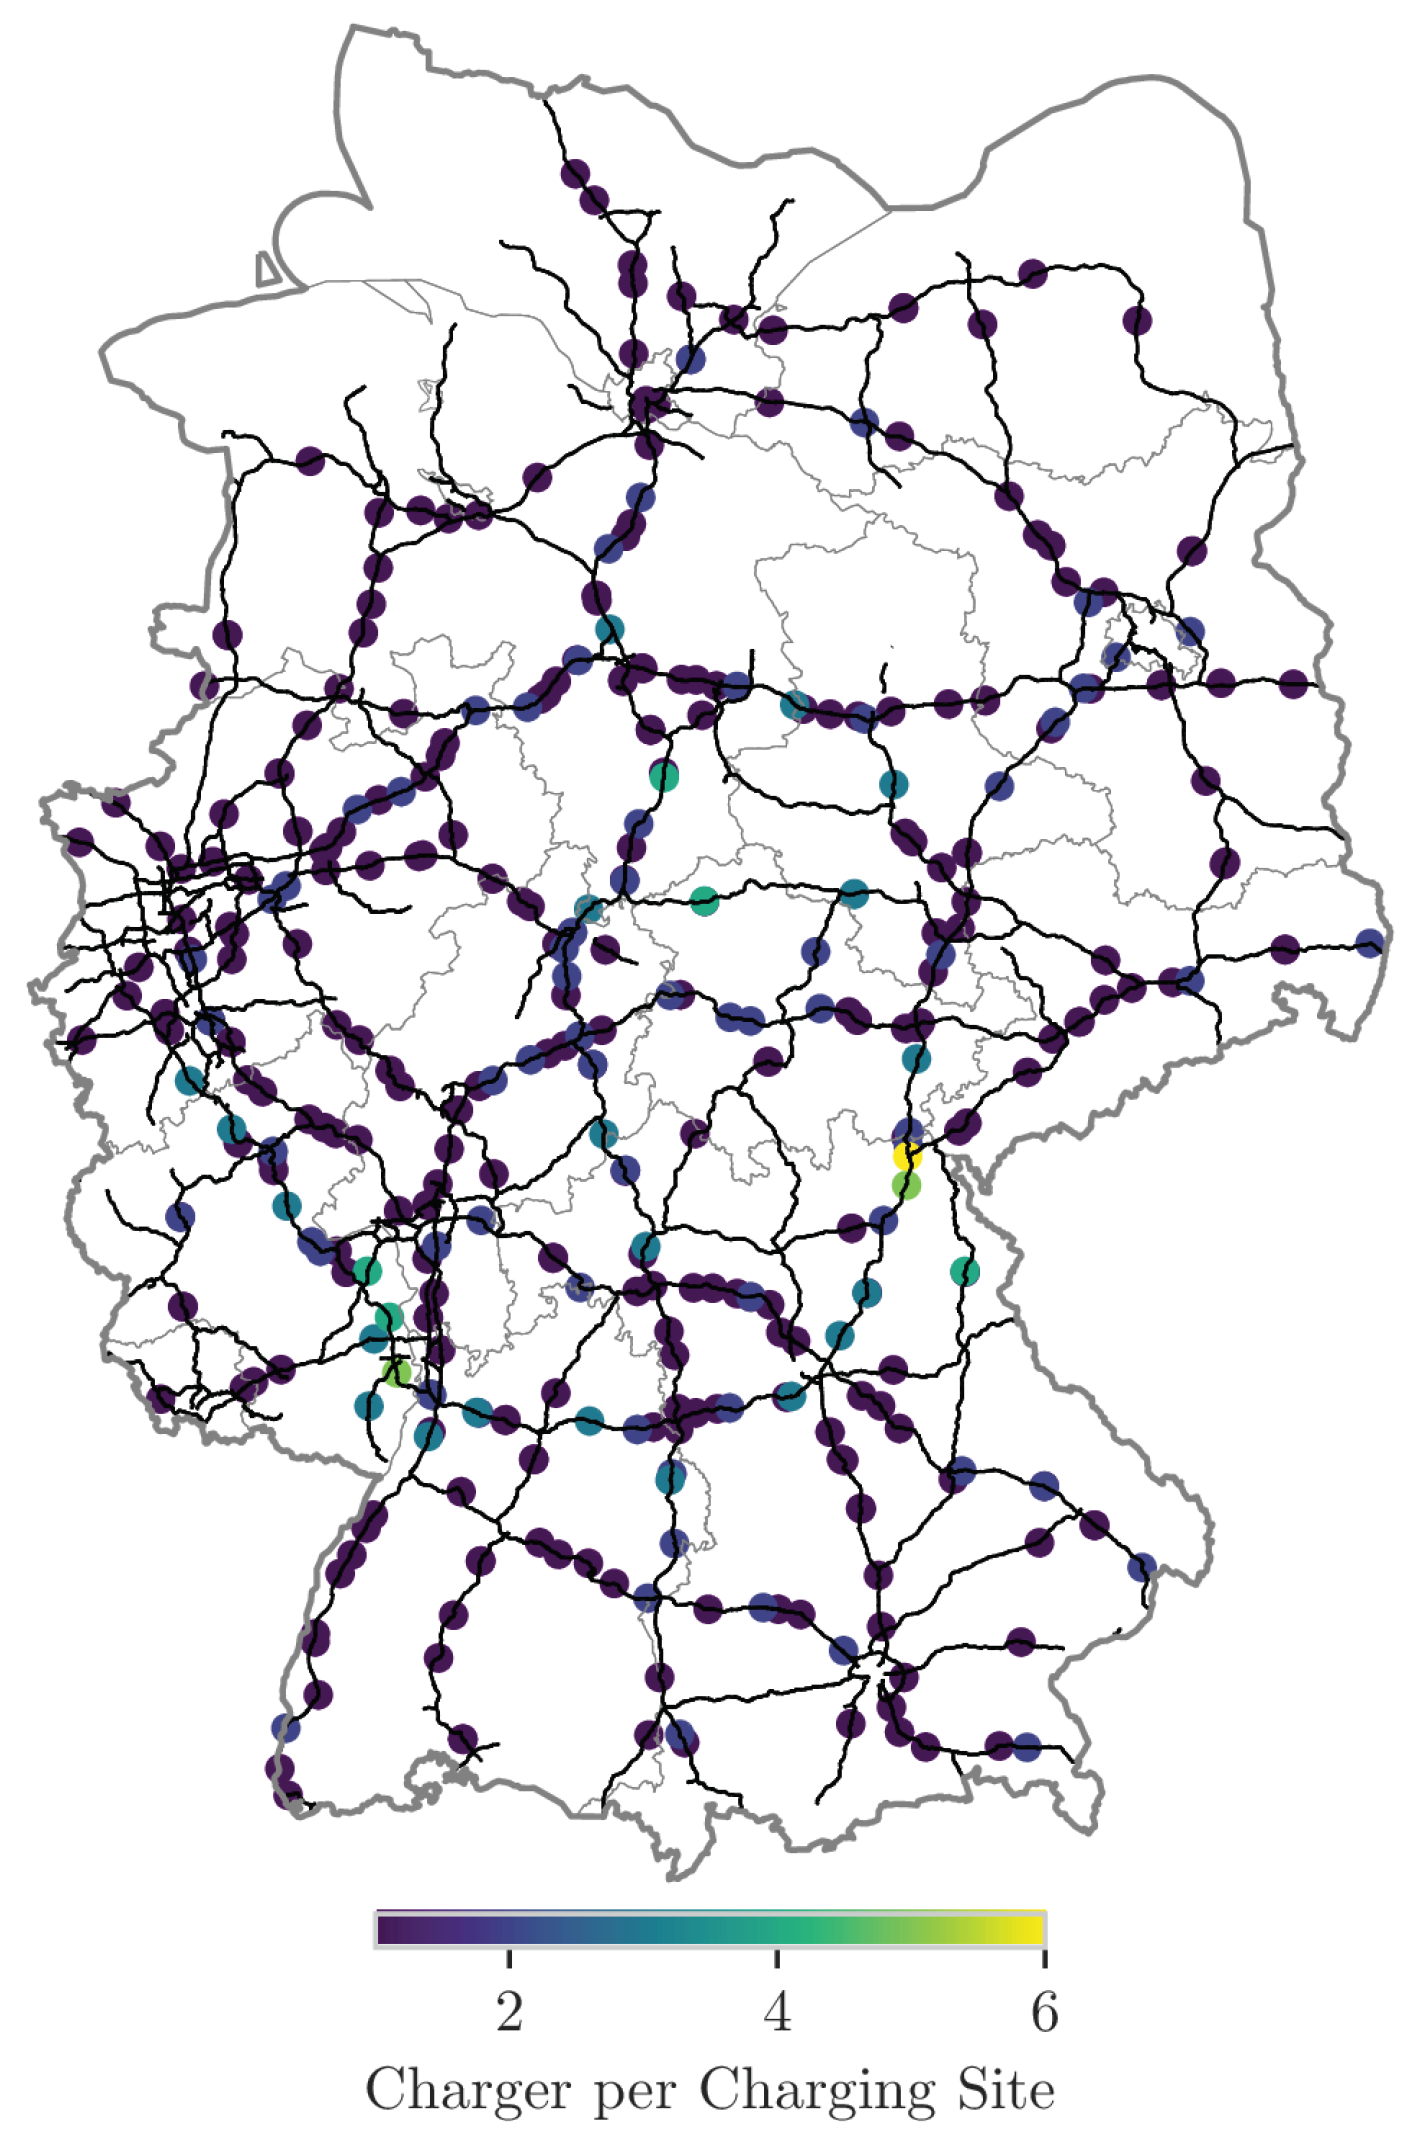
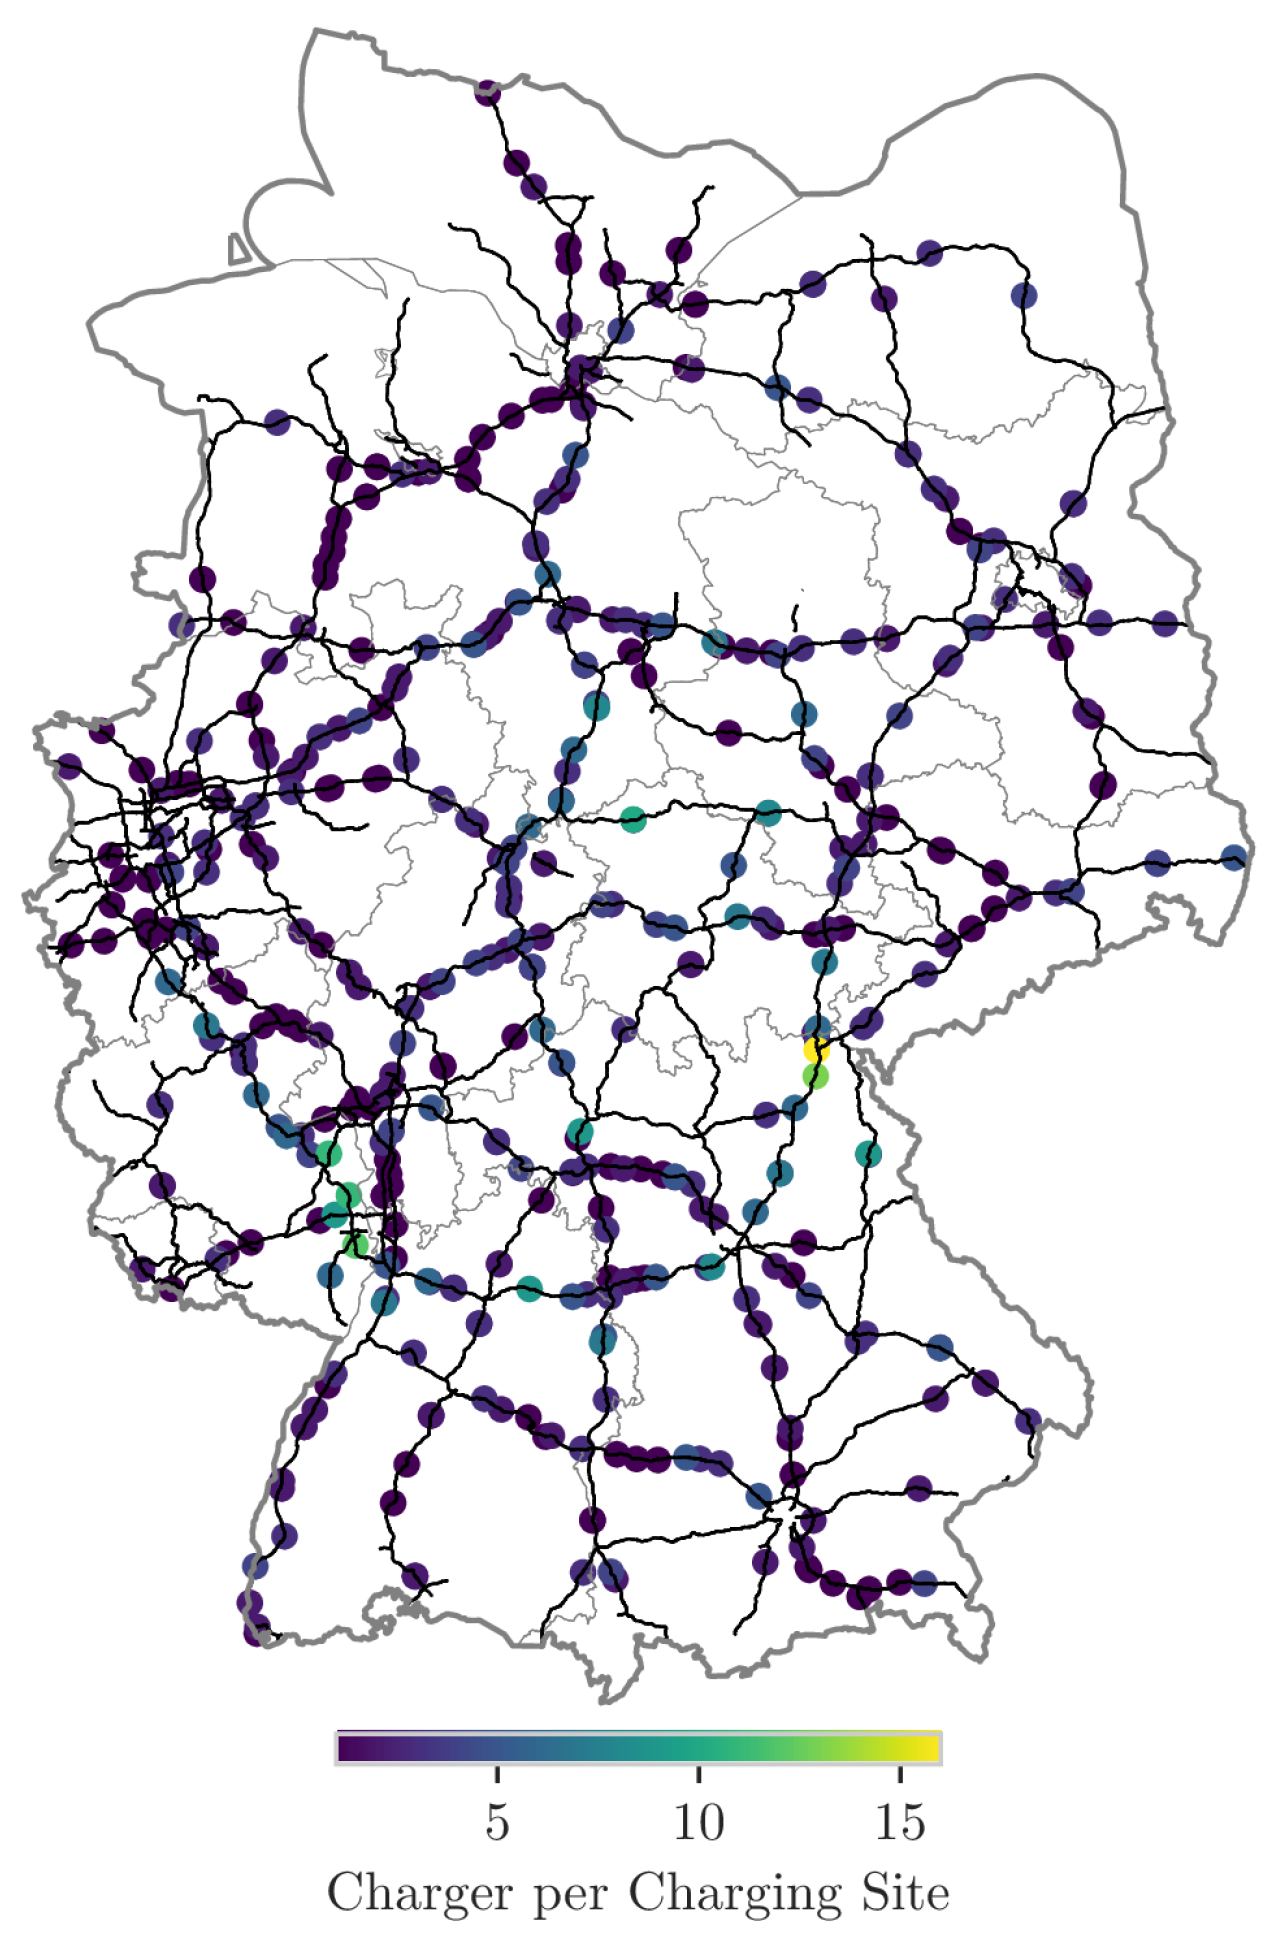
Section 2.1. Following this approach, 588 potential charging locations are identified, as shown by
Figure 6. The depicted charging sites distribution is used as the initial layout for the infrastructure design.
Second, the quantity of charger per site is specified iteratively within the simulation. Therefor, the design proposals for the charging infrastructure bases on the energy demand of each charging site. The energy demand at the charging locations during various electrification stages is determined through a first simulation run, which is characterized by unlimited access to chargers. This scenario represents among others daily peak demands and serves as the basis for determining the required number of charger at each site. The resulting number of chargers is used as a reference for further design proposals, which are tested and evaluated in subsequent simulation iterations.
To determine the total number of charging sites and chargers, the charger occupancy is recorded at a 5 min sampling rate within the simulation to measure utilization frequency. In order to evaluate the infrastructure design the SoC-curves of the E-Trucks are reviewed. Insufficient design will result in many trucks operating below the 20% SoC threshold. On the other hand, an abundance of chargers will lead to many idle chargers. Hence, the utilization of the individual charging sites must also be analyzed.
2.5. Postprocessing
In the following chapter, methods and metrics are defined to score and evaluate the truck traffic prediction, chargers quantity and simulation results.
The OD models from [
25,
26,
28] are first compared by the total deviation respective to the [
4] database. Followed, by measuring the performance on regression analysis metrics, including the determination coefficient
and the mean absolute error (MAE). The determination coefficient
is an indicator to evaluate the relationship between expected real world and modeled fluctuation. This score function can be calculated by the Equation (
1), where
represents the observed values,
the modeled values and
the mean of the observed data. In general, the score achieves a value between 0 and 1, with 1 being the highest score to be achieved. However, the score can also be negative if the model predictions are arbitrary. The MAE on the other hand, indicates the average error between the observed and the modeled system and is calculated by the Equation (
2). The best score that can be achieved with this metric is 0, meaning that no error occurs in average.
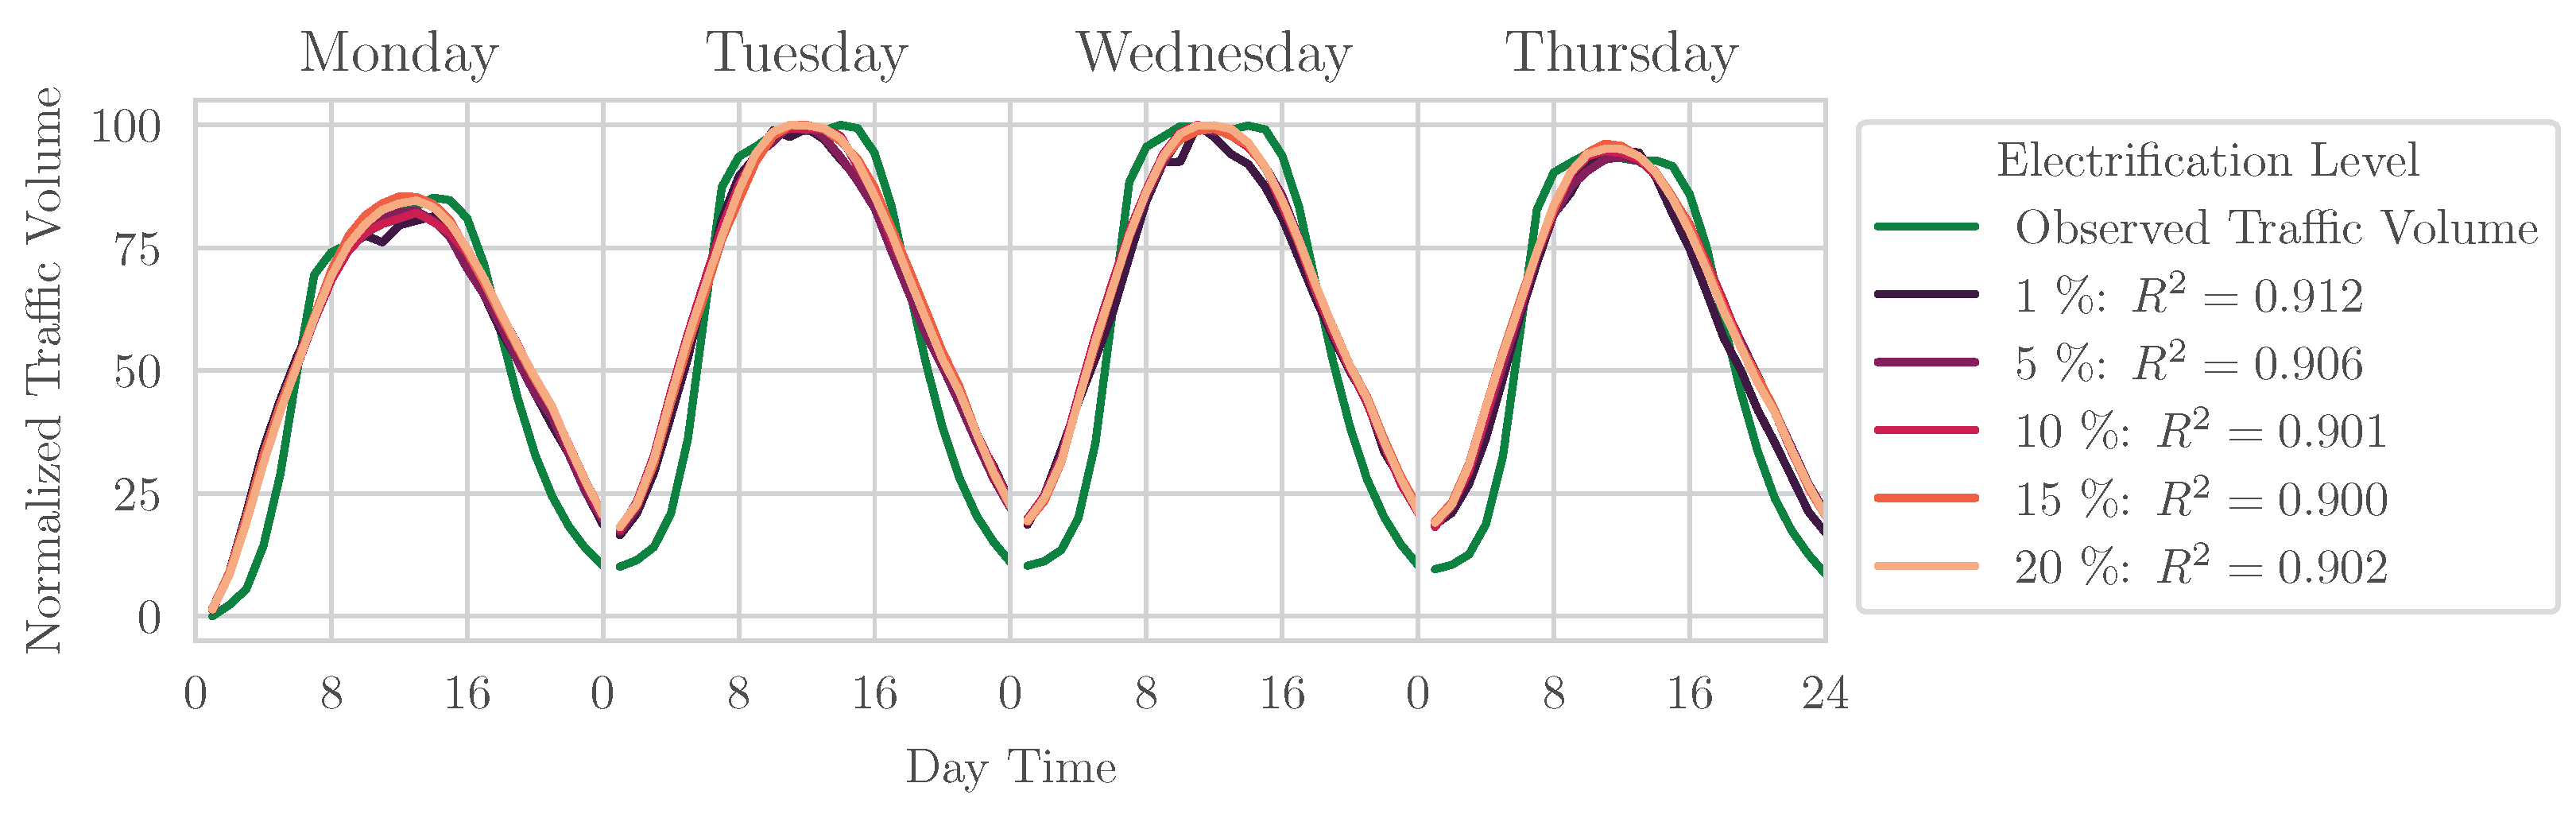
The process of selecting the proper model, which includes a simulation run of the entire truck population, is followed by simulation runs with operating E-Trucks. The results of the initial runs are evaluated against the observed road utilization to ensure that the generated scenario plans follow a realistic concept. The simulated truck volumes and the observed truck volume are normalized between 0 and 100 due to different magnitudes using min-max normalization according to Equation (
3), where
v represents the time-dependent truck traffic volume magnitude. The validity of the results is then evaluated using the determination coefficient
metric.
Subsequently, the results of the run, including SoC characteristics, charger quantity, charger utilization, energy demand and queuing behavior, are examined by statistical functions like the mean, variance, standard deviation and extreme values.
The first runs are likely to result in an inefficient charging infrastructural design, caused by the unlimited number of charger at the charging sites, as mentioned in
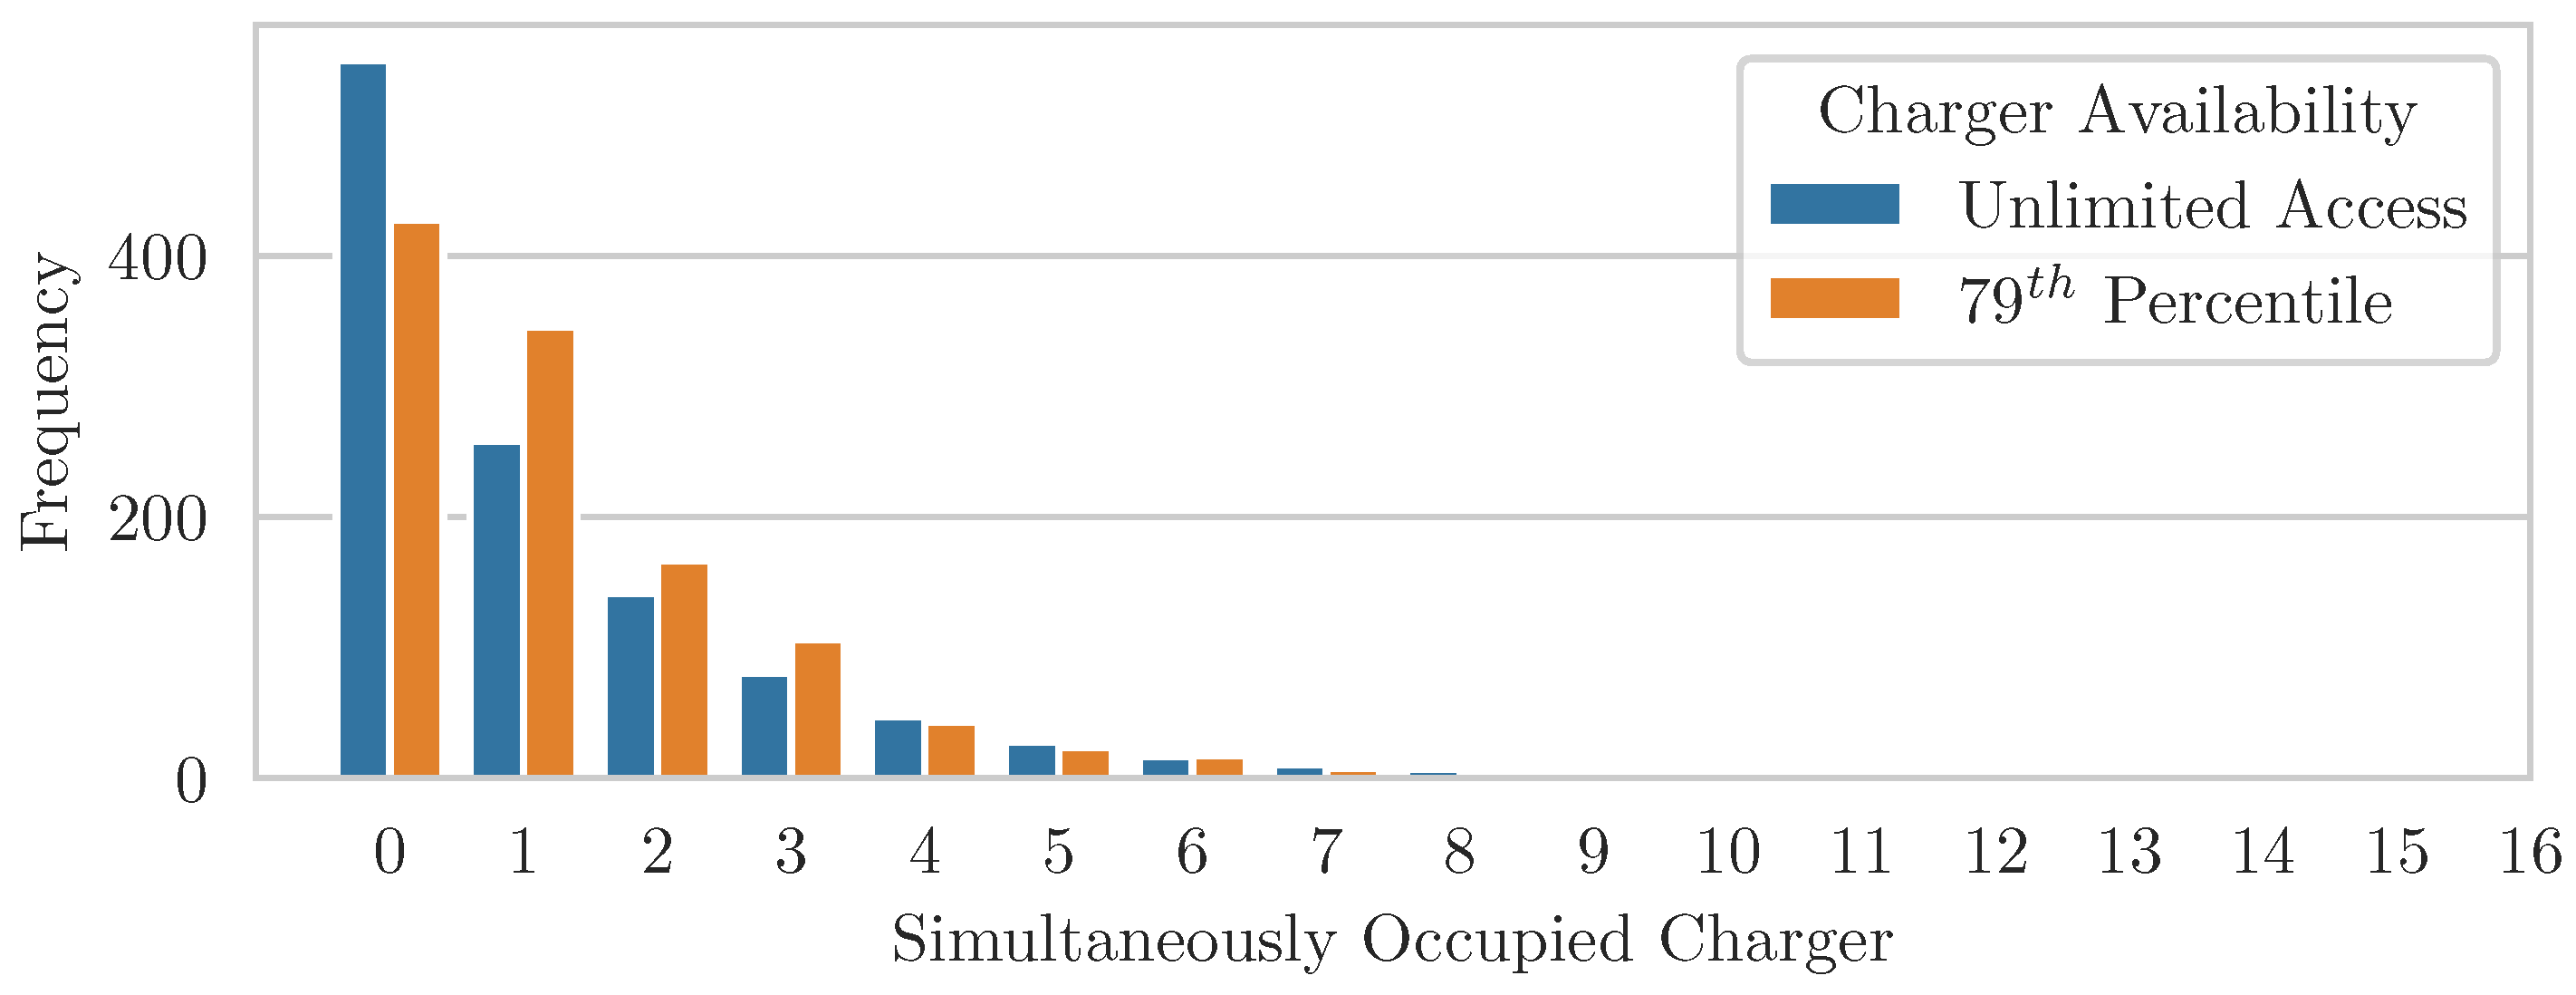
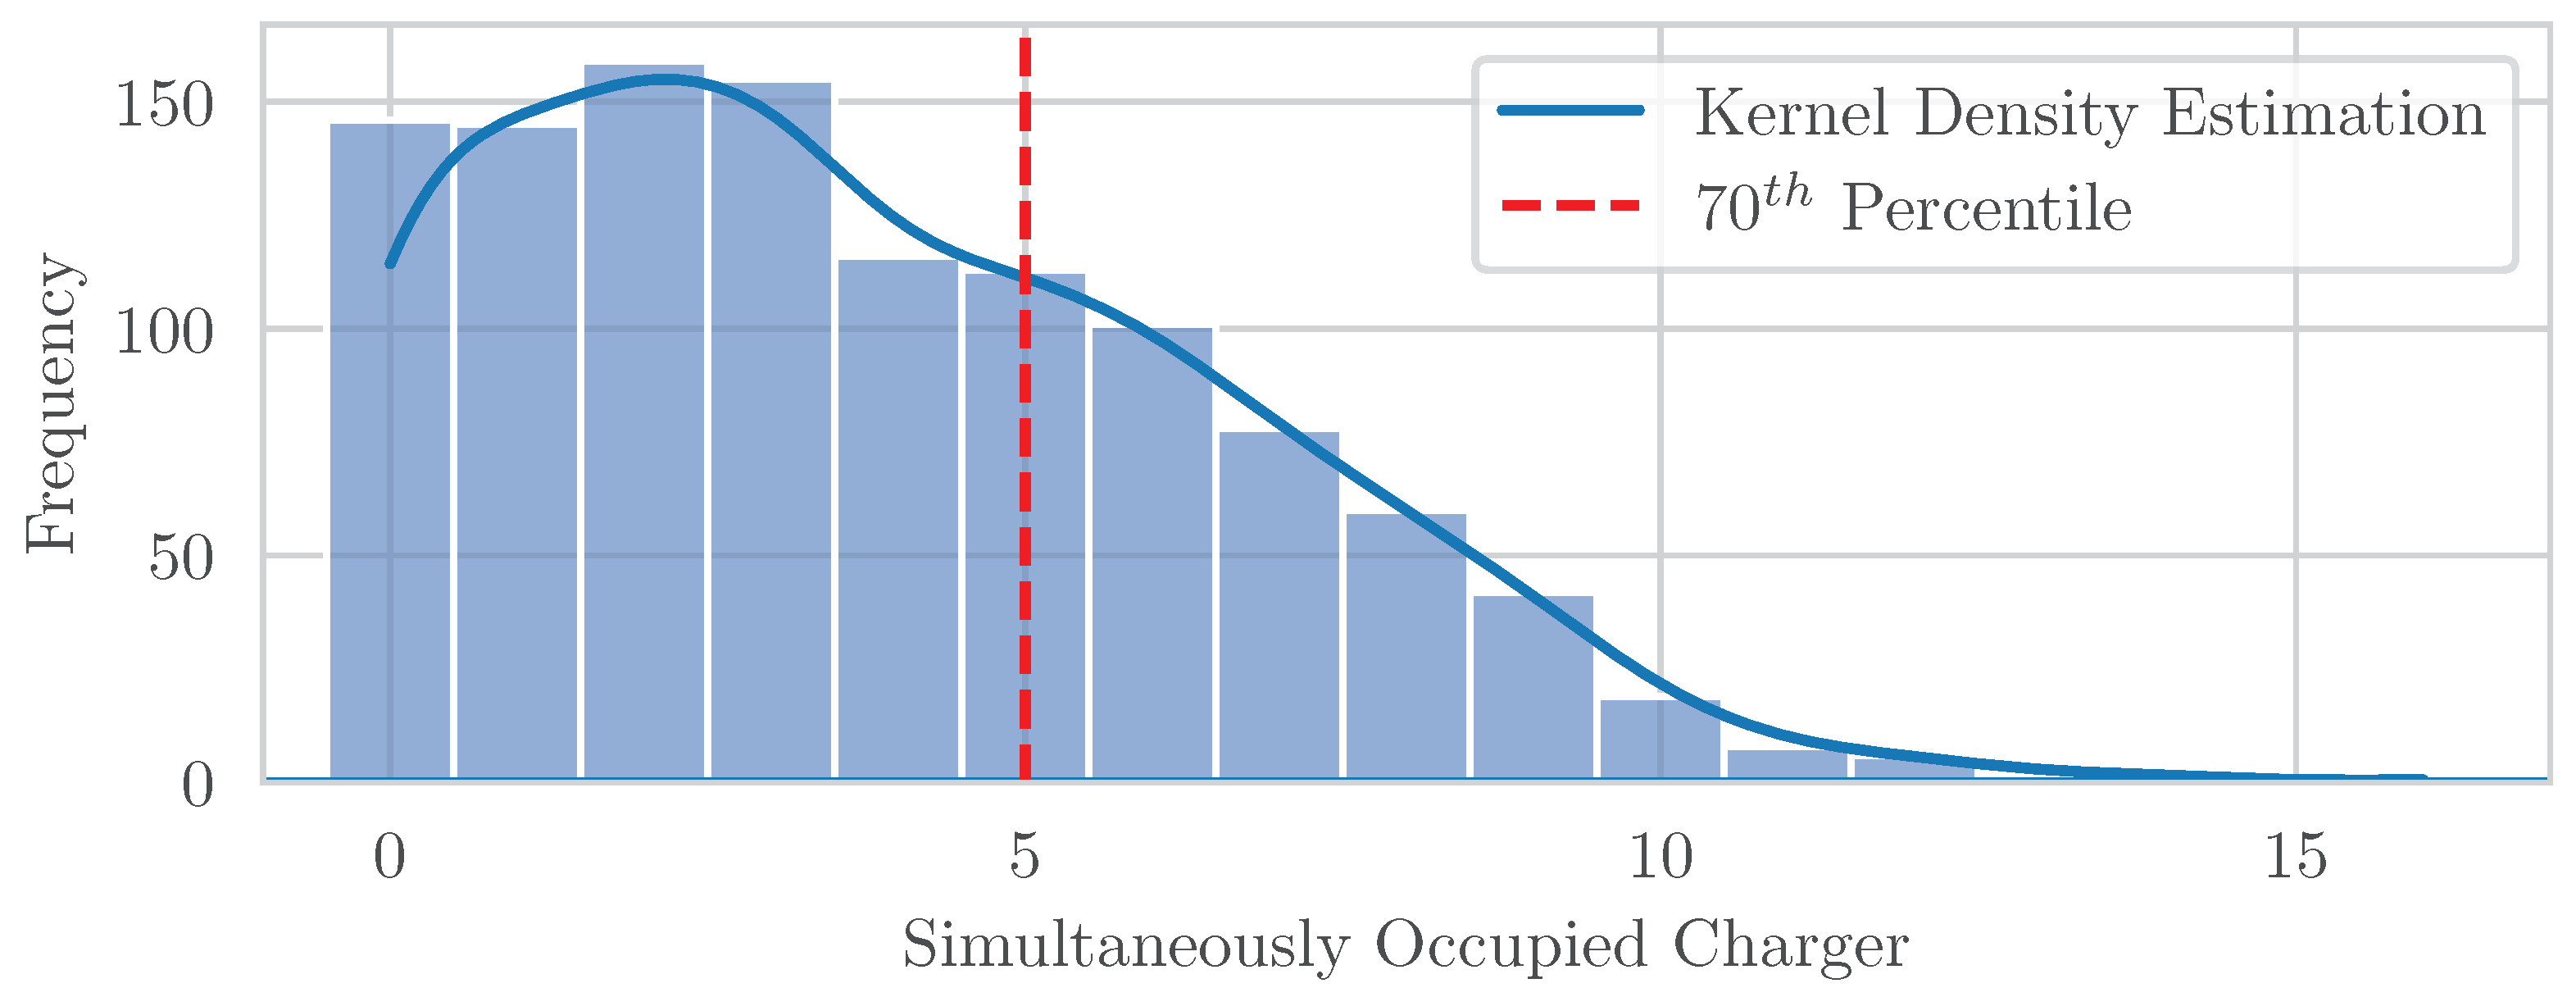
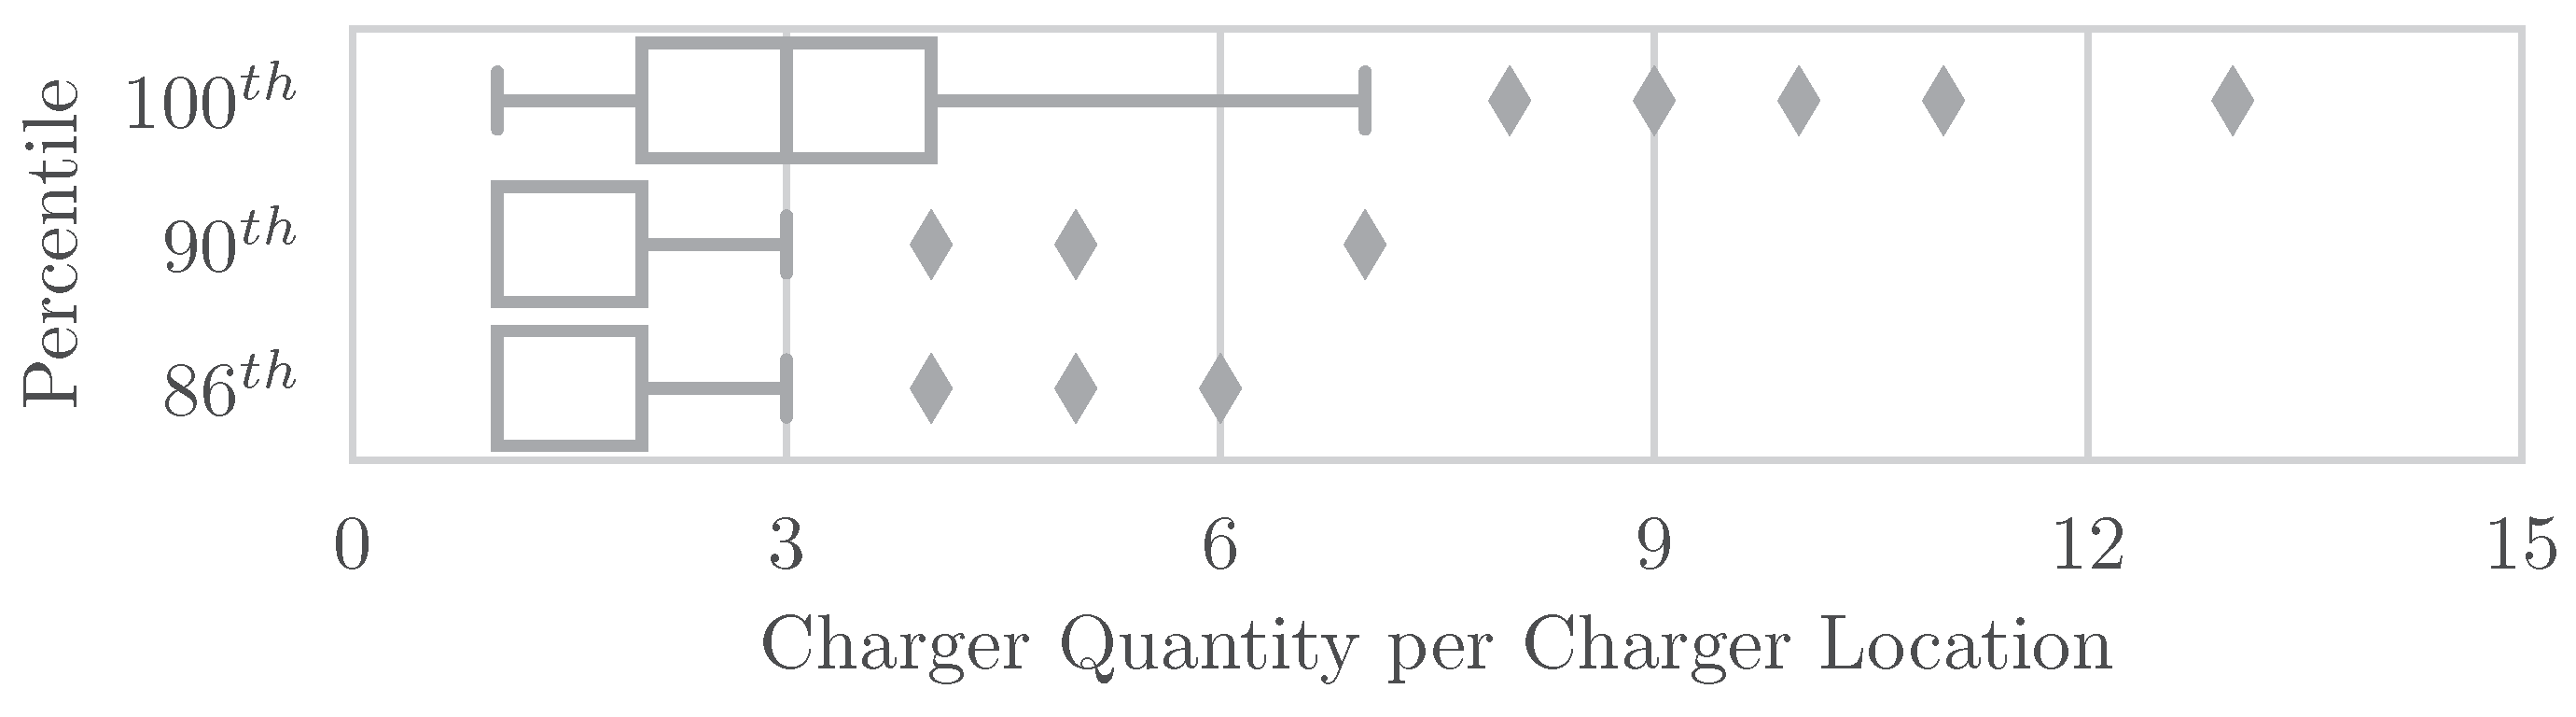
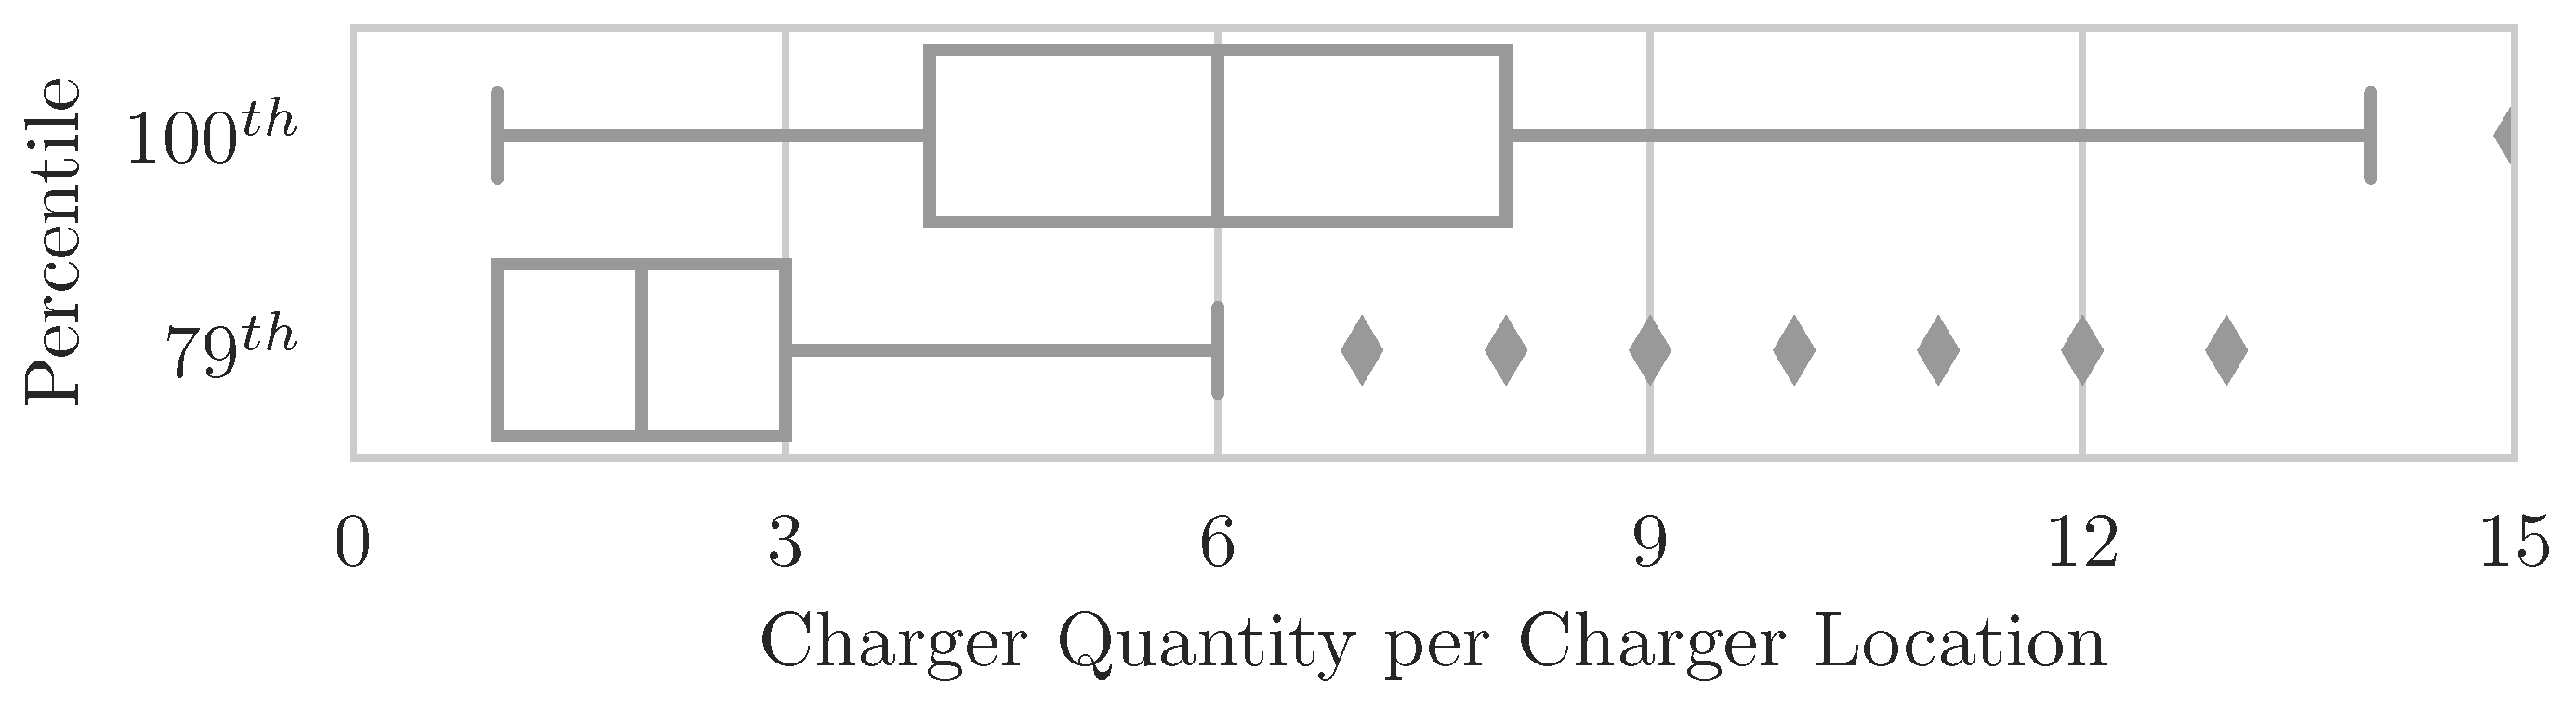
Section 2.4. In order to achieve an appropriate number of charging sites and chargers per site the charger utilization frequency distribution is analyzed. To reduce the quantity of charging facilities and to optimize the design proposal, the statistical measure function
nth percentile is established. The
nth percentile indicates the value
k that separates the lower
of observations in a frequency distribution from the higher values. In this case, the observations are the number of simultaneously occupied charger at a charger site. The demand for chargers corresponds to the frequency distribution and
k specifies the number of charger of a site. The
nth percentile is associated with the supply reliability of the charging facilities.
n is constantly decreased in each subsequent simulation run, until the supply reliability of the charging site cannot be guaranteed. As demonstrated in
Figure 7, implementing the 70th percentile on the charger occupancy frequency distribution leads to a significant reduction in required chargers at this particular site from 15 to 5.
2.6. Traffic Analysis
The main traffic types of the German truck traffic can be classified into four types:
Domestic traffic
Exchange traffic (from German “Wechselverkehr”) (Traffic between two locations (origin and destination) in two different states with vehicles from these states. One or more states may be passed through in the process.)
Three-country traffic (from German “Dreiländerverkehr”) (Traffic between two locations of different states (cross-border traffic) with vehicles from a third state.)
Transit traffic (from German “Durchgangsverkehr”) (Journey between two foreign locations, with Germany as the third country passed through without loading and unloading.)
The majority of truck traffic is classified as domestic, with approximately 257 million loaded and 155 million unloaded trips in 2020. The remaining three traffic groups account for only around 13% of total freight transports and for 5% of the unloaded trips, according to data from the KBA [
4]. The exact quantities of the individual groups can be obtained from
Table 1. This study focuses on simulating journeys that originate or end within Germany, so only the domestic and exchange categories are of particular relevance. These categories cover approximately 97% of all truck trips, 82% of the total distance traveled and 93% of the goods transported.
Due to the availability of more comprehensive data, the domestic traffic is analyzed in greater detail. In the following, it is assumed that the conclusions drawn from the domestic data are also applicable to exchange traffic.
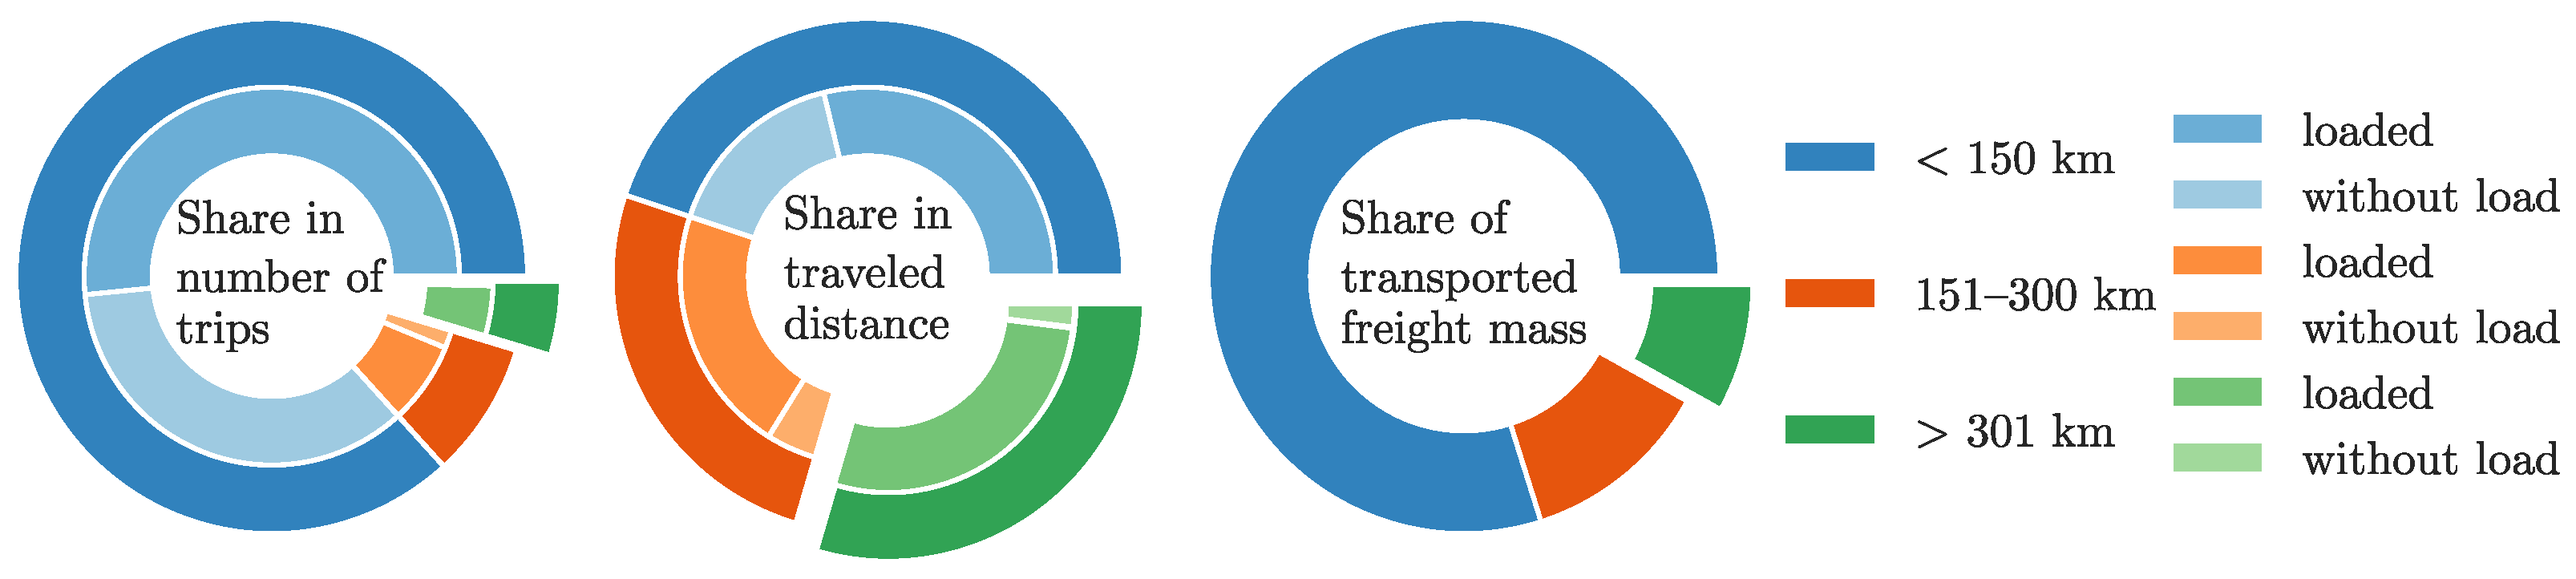
As mentioned in
Section 2, the OD matrices represent freight mass models. However a journey-based model is necessary to provide a comprehensive model. To achieve this, the proportion of freight mass, as indicated by the OD model, is directly translated into the number of loaded trucks. This assumption is based on the observation that the distribution of trips and the distribution of transported freight mass are similar with regards to the distance, as suggested by
Figure 8.
The analysis of trips based on distance level is crucial as this study focuses on long-distance journeys and significant variations in behavior have been observed across different distance levels. As shown in
Figure 8, trips with a cumulative distance of 301 km or more make up a small proportion in total number of trips and transported freight mass. By contrast, the share of travelled distance is over-proportionally high. As a result, this distance group has the highest emissions per trip rate, making the electrification especially here tremendously important. As also illustrated in
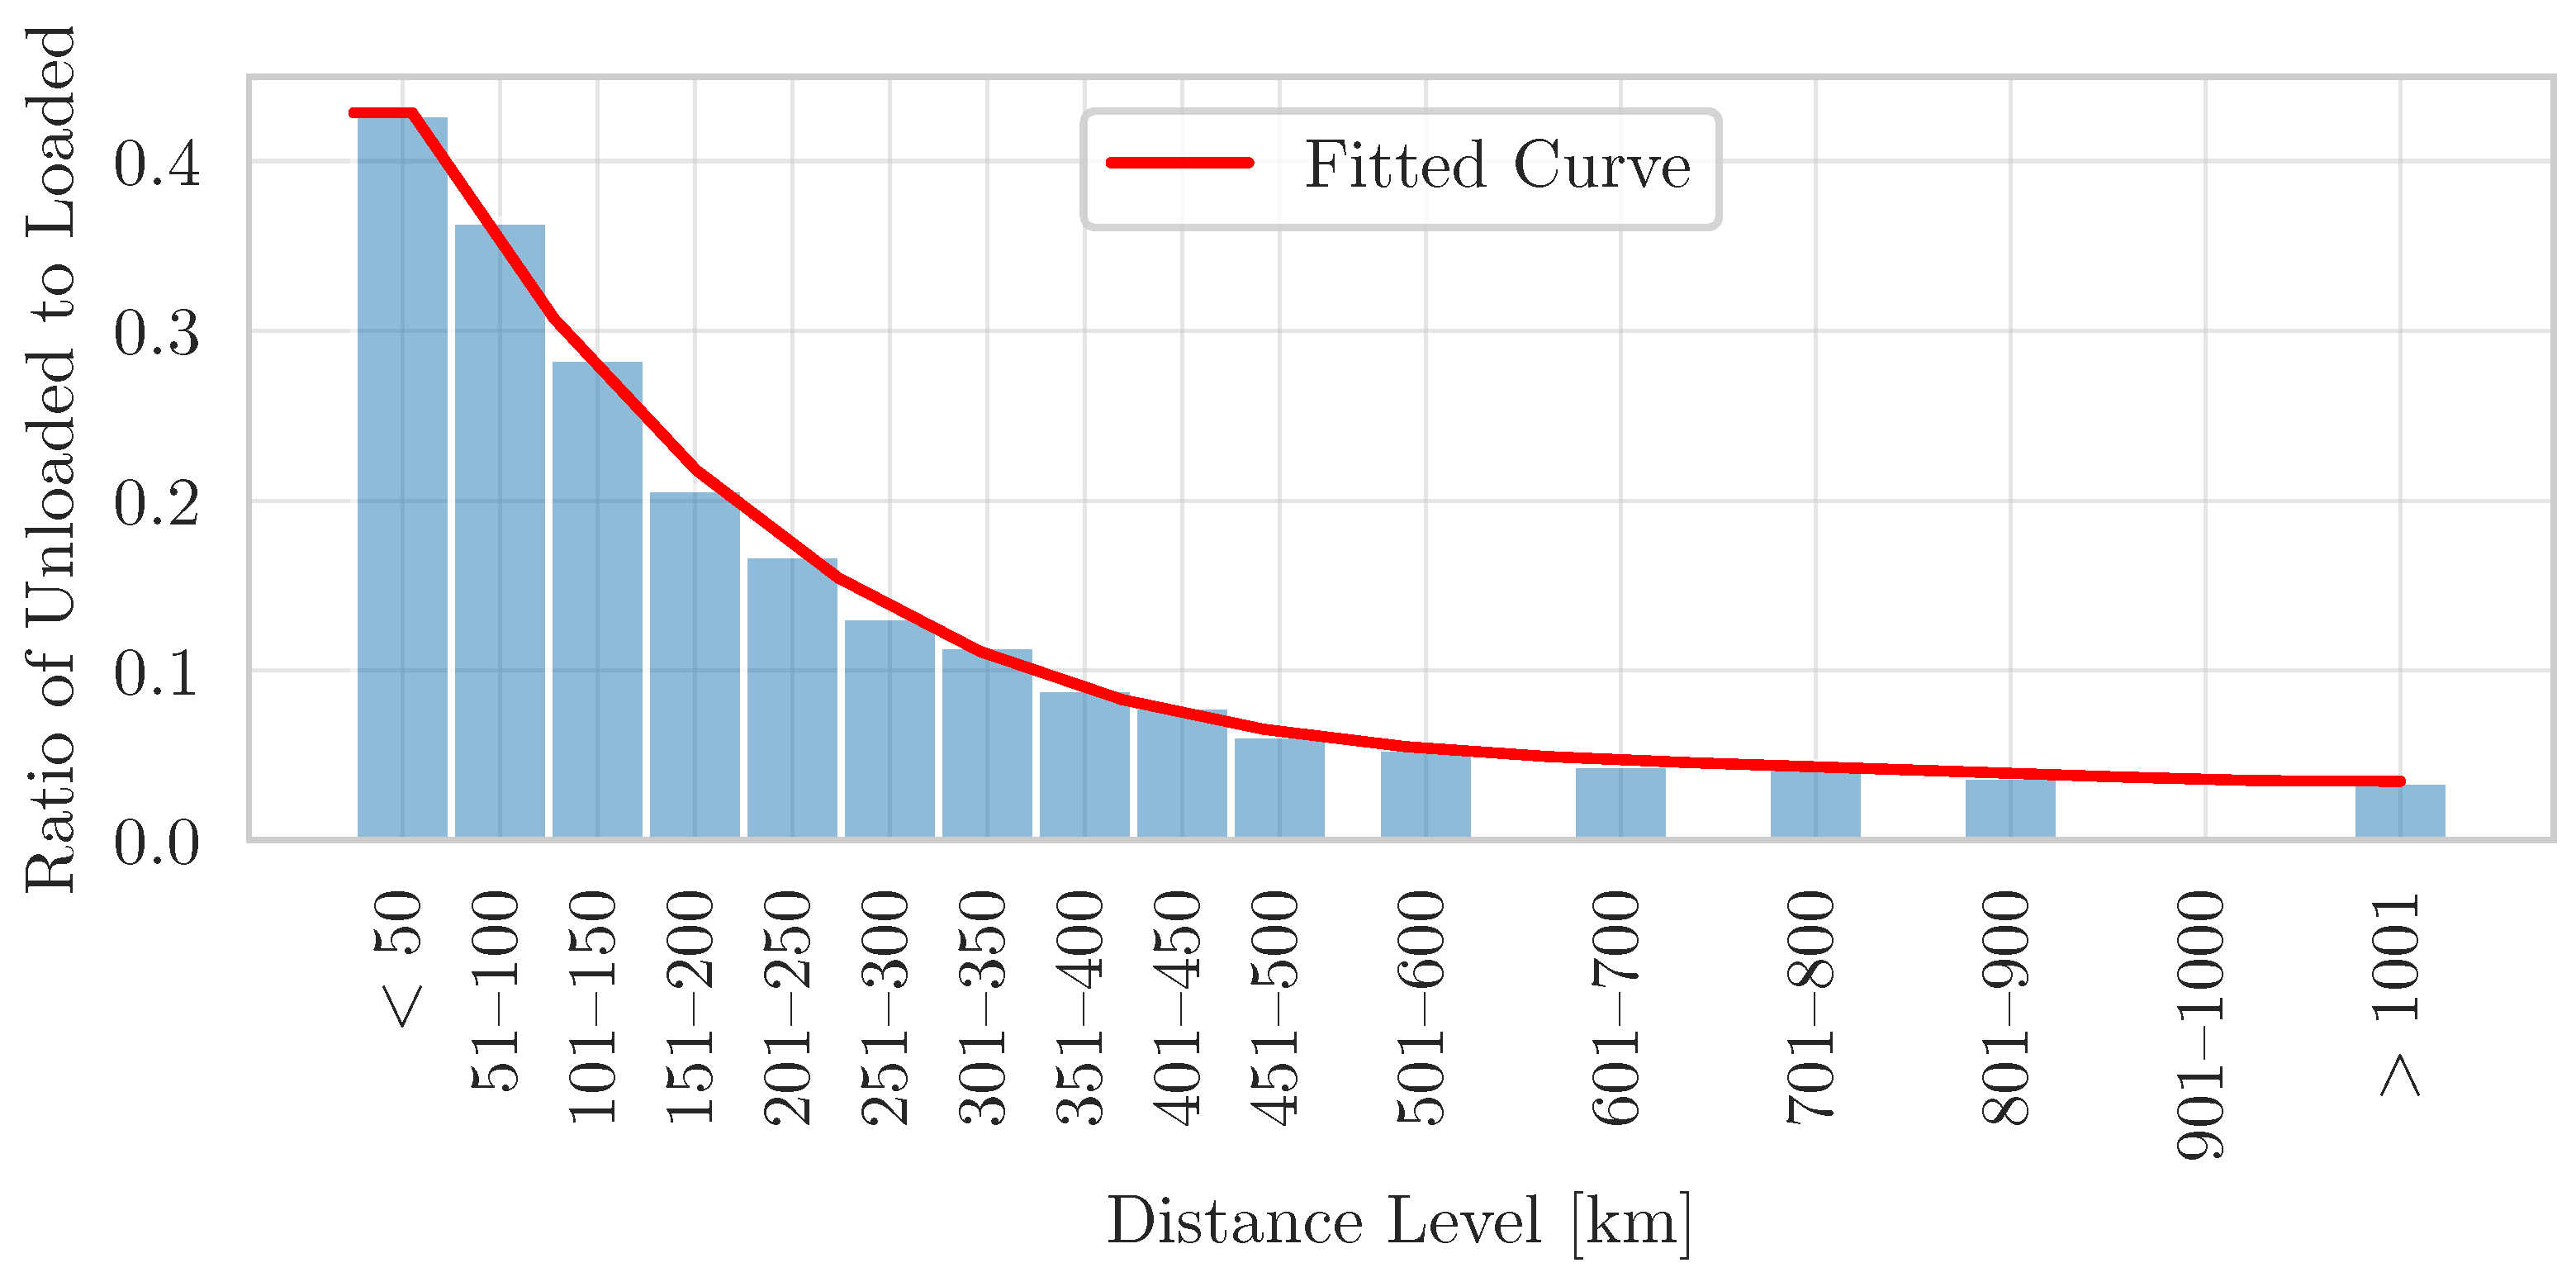
Figure 8, the ratio of unloaded to loaded trips depends on the distance. As the distance increases, the ratio decreases. The
Figure 9 presents a more detailed representation of the relationship between the ratio of unloaded to loaded trips and the distance. Since the OD matrix models are freight mass-based (and the unloaded trips are not depicted), the proportion of unloaded trips are estimated by this observed behaviour. The specific ratio at various distance levels is obtained from the source [
4].
In order to make a projection of the loaded-unloaded ratio, curve fitting is utilized. Resulting in the distance-dependent fourth degree polynomial functions displayed in
Figure 9 (No available data for the distance level 901 km to 1000 km). Based on the given data the model has a sufficient degree of goodness of fit. Resulting in an approach to convert the freight mass-based model into a trip-based model including loaded and unloaded journeys.
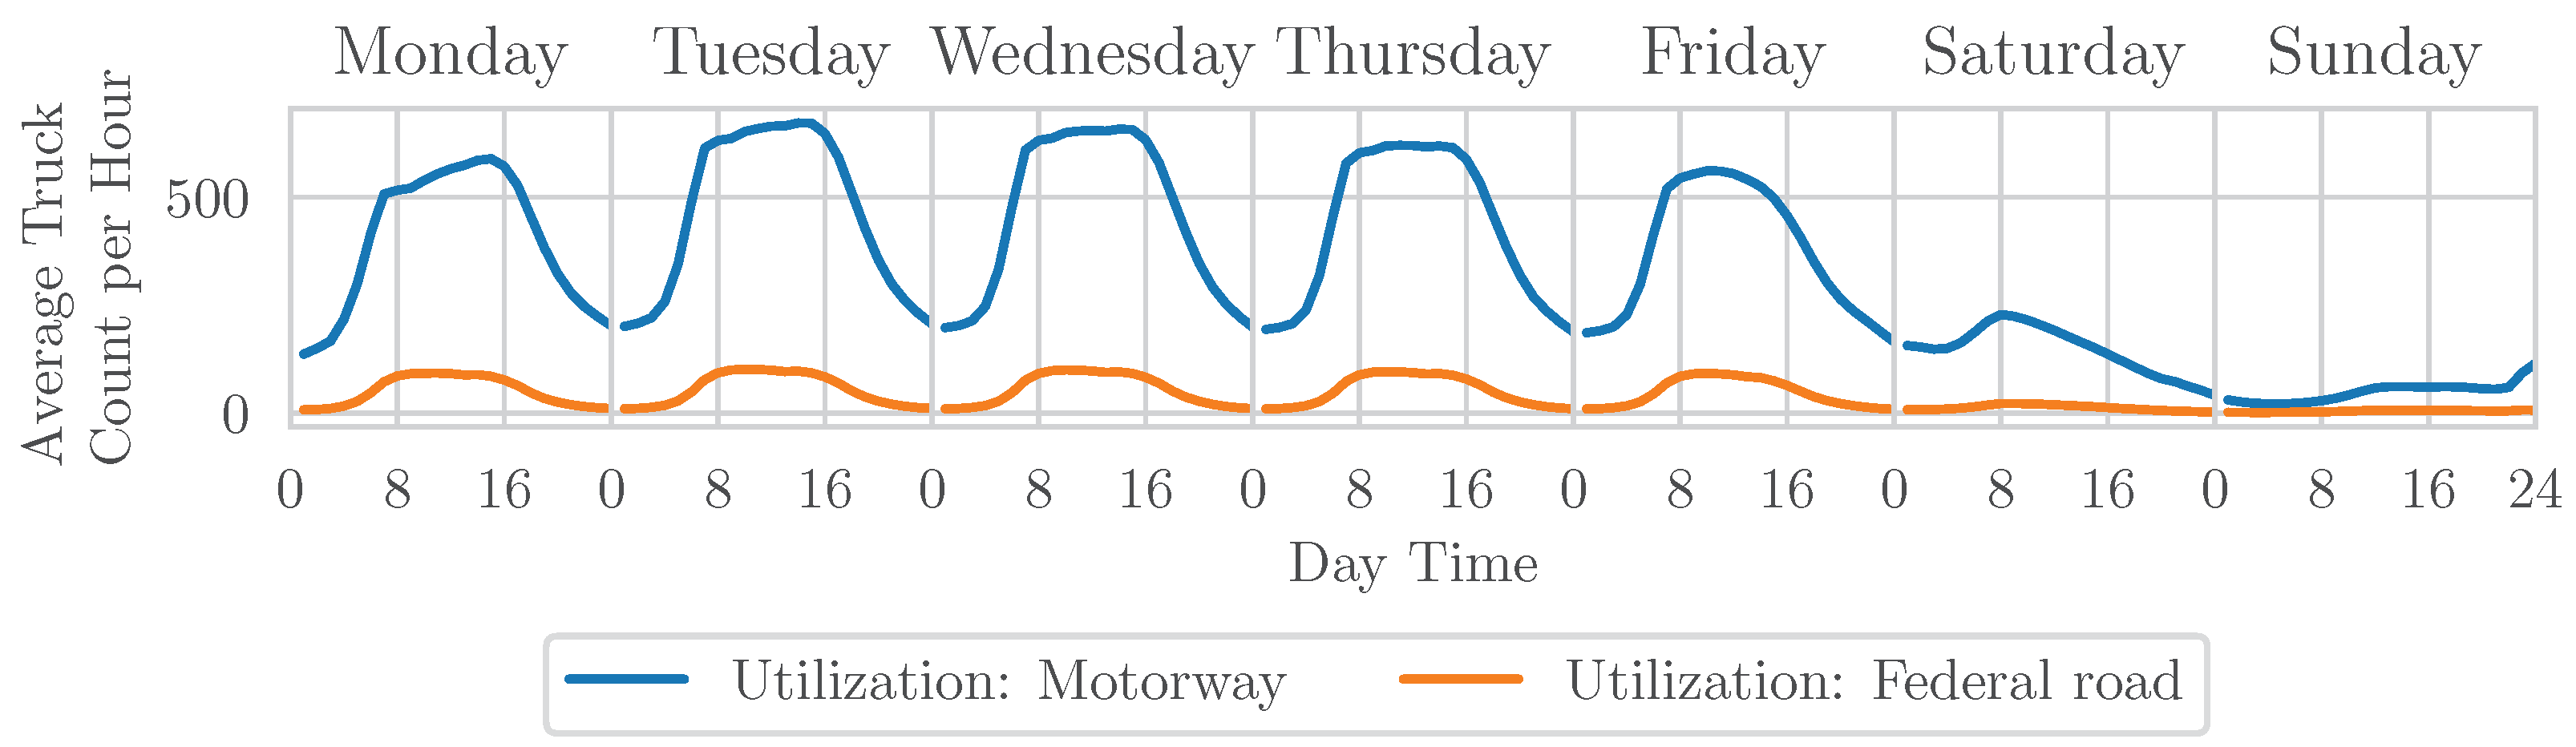
Followed by the established truck population procedure, a method for creating the schedule must be developed in order to create the simulation scenario. In this study, we use the average of the hourly discretized traffic volume of trucks of an entire week. The data used for this purpose is provided by [
29,
30]. The behaviour of the average hourly count of a week is shown by the
Figure 10. The peak utilization occurs on Tuesday and Wednesday between 8:00 and 20:00, whereas the lowest utilization is observed on Sunday. This observation is a direct consequence of the Sunday driving ban for trucks in Germany on motorways. As the utilization exhibits a high variance based on the weekday, only the weekdays from Monday to Thursday are included in the charging infrastructure design. This is necessary to obtain a more representative estimate of the effective energy and charging station demand. Including the weekend into the design approach of the infrastructure will likely lead to a biased conclusion. Due to the fact that the majority of chargers are likely to be idle at the weekend, even if their are heavily used on other weekdays.
To finally create a schedule for the simulation the departure time is determined by the distribution of the frequency. Therefor, the behavior of the graph from
Figure 10 is used as probability density function, meaning that the likelihood of a specific departure time is higher if the traffic volume at that day time is higher. Subsequently, the time table is shifted by a time parameter
t to match the observed traffic volume. This constant is determined by the simulation and is needed for presentation purposes but does not influence the results.
2.7. Origin Destination Base Model Selection
In the following, the model selection is determined. First, the total mass transported within Germany will be compared. Since both datasets are models that represent the OD matrix from the reference year 2010, both are expected to consequently underestimate the total mass as the truck quantity as well as the freight volume are steadily increasing since 2010 [
4]. To reproduce this behavior, both models are multiplied by a scaling factor. The transported goods mass increased from about 2.72 billion tonnes in 2010 to around 3.11 billion tonnes in 2020, representing a growth of
% [
4]. The models both underestimated the total domestic freight mass, while the ETIS dataset is slightly more accurate at 4% less freight, the BMDV dataset contains 7% less inner-German cargo mass.
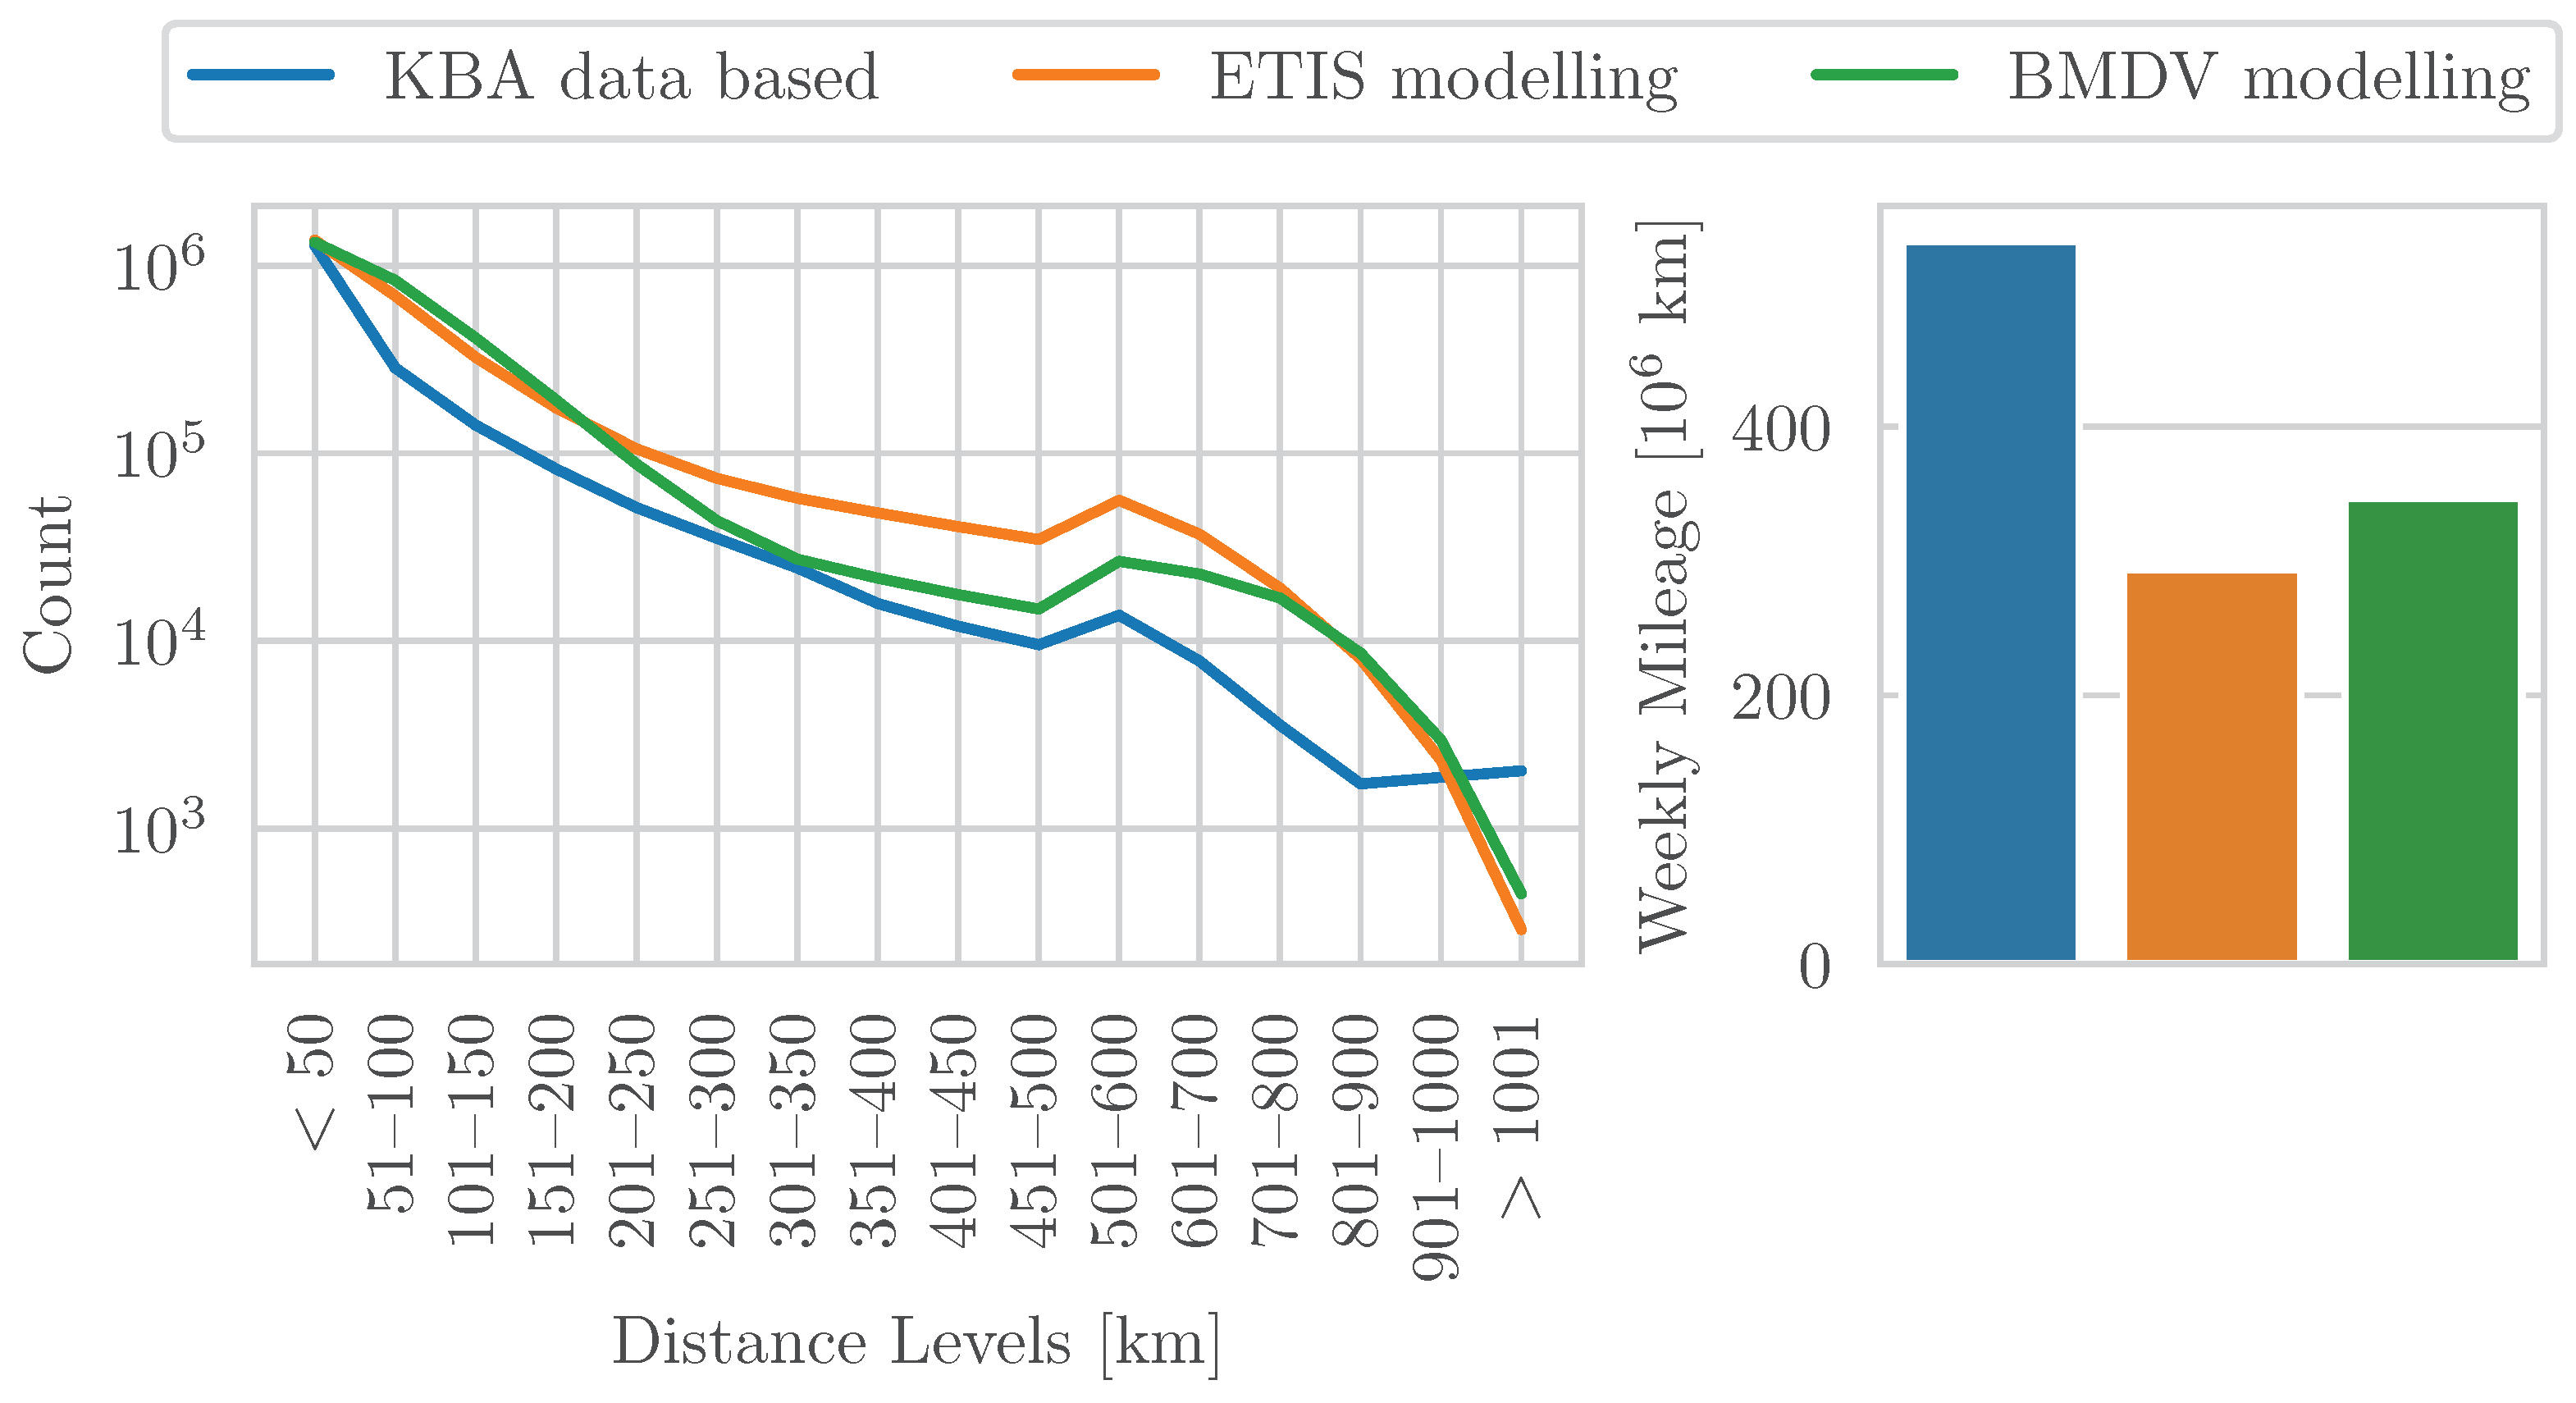
The travelled distance modeled by the OD-matrices is crucial as it is mainly responsible for the total consumption. In the following, the cumulative distances as well as the distribution of distance levels of both OD-models are evaluated and compared to the KBA data. Therefore, two truck traffic simulation scenarios as shown in
Figure 3 are built. Both represent an average week (Monday to Sunday) of truck traffic of all distance levels. The results of these simulation runs are displayed in
Figure 11. The model performances on the cumulated traveled distance per week are similar. Both scenarios are good fits in relation to presenting the distance-level distribution. According to the observed model metrics coefficient of determination
and mean absolute error, a higher goodness of fit is identifiable at the BMDV model. Specifically, the BMDV model shows an
value of 0.85, while the ETIS model obtained the value 0.74. The mean absolute error of the BMDV model is 2% lower than that of the ETIS model.
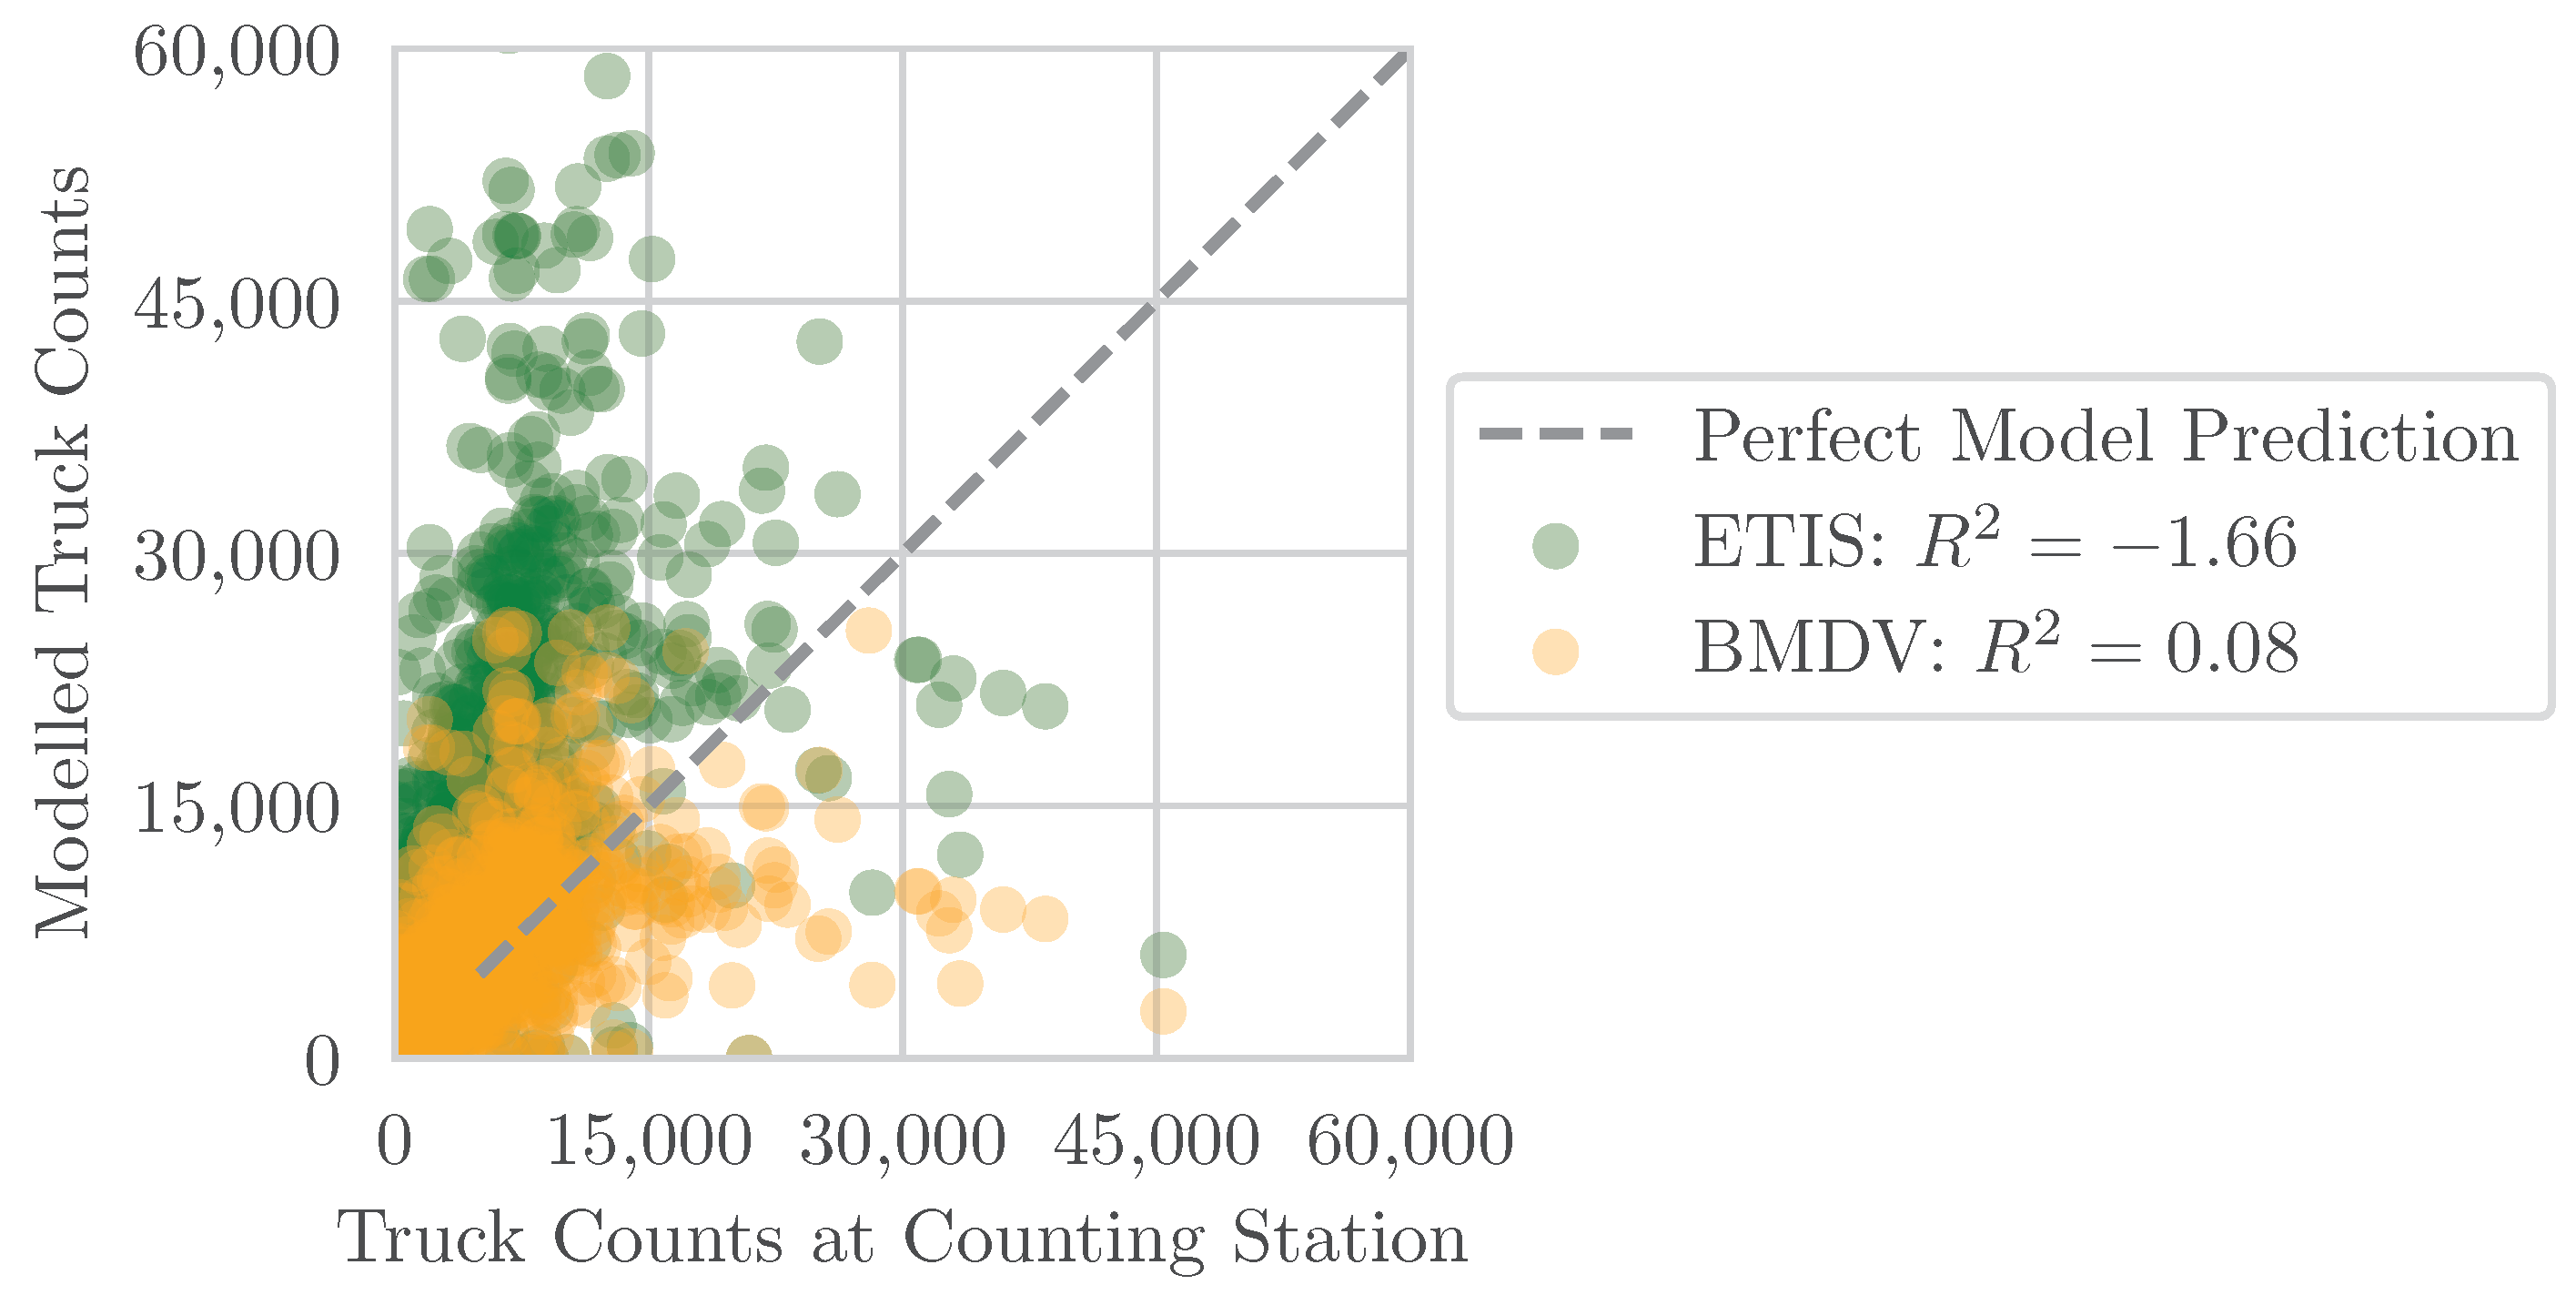
Last, to assess the accuracy of the models, the results are compared with observation data from the automatic counting stations [
29,
30]. For this, the locations of the counting points are incorporated into the network. During a run, the counter associated with a link is incremented each time a
LinkLeavingEvent (MATSim simulation specific) occurs, caused by an agent leaving a specific link to proceed to the next or has reached their destination. The results are summarized in
Figure 12. An optimal model prediction is represented by a point on the dotted gray line. While the ETIS model has poor accuracy in truck counts, the BMDV model shows an acceptable performance on this indicator. This is also recognizable by the
metric, where a negative value indicates that the model fails to capture the behavior of the observed value and is arbitrary in terms of prediction.
In conclusion, the OD matrix from the BMDV will be used for the German Long-Distance Electric Truck-Traffic scenario. All subsequent results are based on this dataset.
4. Discussion
In this section, the results are discussed, beginning with a reconsideration of the charging location selection criteria. Further restrictions are then introduced to achieve a more realistic and implementable charging network design. The obtained recharging infrastructural designs from
Table 4 are compared to a previous work [
23] in the field of designing a fast recharging network for E-Trucks in Germany.
The localization of potential charging sites within rest areas is based on two conditions: closeness to the motorway and availability of existing infrastructure, such as chargers or gas stations. Challenges associated with these assumptions are the lack of information on available space and the suitability of the existing power grid for a high-performance charging site. The parking capacity lack for trucks is already a major challenge in Germany, resulting in 23,347 daily missing parking slots in 2018 [
39]. This issue is likely to worsen as developing the charging infrastructure potentially eliminates parking spaces due to the expected higher space requirement. However, area space could be considered as a prerequisite for potential charging locations. In addition, power grid conditions must also be taken into account to define potential charging locations. A condition to consider is the closeness of an electrical substation. By adding a closeness constraint of a Euclidean distance of 3 km to a substation, the number of potential charging locations decreases from 588 to 337, recognizable by a lower distribution density, as shown in
Figure 24. Particularly in the northeast of Germany, the available electricity grid infrastructure is challenging in relation to the available potential charging locations.
In addition to the location, the distribution of chargers could also be reconsidered more explicitly. Further research could explore alternative algorithms for optimizing the design of the number of chargers per charging sites, with a particular focus on optimizing the supply reliability and the occupancy of individual charging sites.
In [
23], Speth et al. (2022) designed a public fast-charging infrastructure for E-Trucks with a gross vehicle weight above 12 t with 1198 required chargers at 267 charging sites assuming the following model characteristics:
an average truck speed of 65 km h−1, resulting in 300 km per leg;
an average energy consumption of km−1;
an average charging power of 720 ;
a recharging duration of 30 min;
an average queuing duration smaller than 5 min;
an en-route charging level of 50%;
an electrification share of 15%;
a daily mileage of 97.5 million kilometres and
50 km charger site interval along the Germany motorway.
The comparability between the models is high due to the similarity in vehicle, charger and scenario characteristics. The cumulated distance travelled serves as the basis for the comparison as this parameter is the most significant for the energy demand and thus for the required charging infrastructure. The daily modelled mileage by E-Trucks of the scenario from Speth et al. is 14.63 million kilometres, while the underlying work models a daily electric mileage of 12.92 million kilometres at 15% electrification and 15.64 million kilometres at 20% electrification. Interpolating the outcomes based on the mileages leads to the conclusion that the resulting charging duration, average queuing duration and total number of chargers are sufficiently similar to [
23]. However, the charging site quantity and distribution differ due to the different design approaches. Furthermore, the charging sites in [
23] serve both directions, while the sites in the present work are only accessible to E-Trucks traveling in the right direction, which explains the nearly twofold difference in this characteristic. A final verification of the accuracy of our simulation results is yet not possible due to the lack of data and implemented infrastructure. So far, the results have been shared and discussed with partners from the HoLa project and will be further evaluated during the project.
In terms of charging, this work assumes an average charging power of 720
. However, that value is strongly influenced by many variables, such as the SoC and the weather conditions. Due to the currently limited data on charging cycles of E-Trucks, it is not yet possible to make reliable statements on charging patterns of E-Trucks. Further research is needed to gather more data on charging behavior, which can then be used to refine the assumptions made in the current study. Another important aspect is the impact of the assumed charging rates on the service life of vehicle batteries. In the base case, we consider an average charging power of 720
. Due to the large vehicle batteries with 600
installed capacity, the C-rate is only
C despite this immense charging power. This is well within the range of current fast charging in both passenger cars and commercial vehicles, so it can be assumed that the degradation mechanisms are technically manageable. More critical is the 1500
charging power, which we assumed as a sensitivity analysis. For the same battery size, this corresponds to a C-rate of
C. In this range, without a special battery chemistry and correspondingly designed battery and charging management systems, considerable stress on the batteries is to be expected, which would result in losses in the maximum expected charging cycles. However, in current field tests, precisely such battery chemistry and management systems are being tested very successfully, even at such high C-rates. One example is the E-MetroBus research project in Berlin, where 17 articulated buses with an installed battery capacity of 180
are being charged at up to 450
[
40]. Here, even after three years of operation, the state of health (SoH) of the batteries is within the expected range. Of course, this is not empirical evidence for the safe applicability of such high charging powers, but it does indicate a fundamental feasibility. Nevertheless, this issue is an important constraint and the research and development in fast chargeable batteries must be critically observed and included in the further planning of high-power charging for long haul transport.
Finally, the assumption of a homogeneous fleet should be reconsidered. A heterogeneous fleet of E-Trucks, differing in characteristics like battery capacity, consumption, charging behaviour and initial SoC, might have a significant impact on the results presented in this work.
5. Conclusions
In conclusion, this study has demonstrated the feasibility of a realistic demand-oriented design approach of the charging infrastructure based on a microscopic traffic simulation using publicly available data. The implemented model is realistic and adaptable in terms of charging sites and establishing E-Truck traffic. Adjusting the network, charging facilities or traffic pattern are also possible in order to adapt the model to different scenarios. For example, the large-scale German-wide simulation can be adapted to a smaller scenario in order to model the E-Truck traffic and to design a charging infrastructure for individual routes. Moreover, the model enables the evaluation of the efficiency and occupation rate of the charging network as well as individual charging sites. In addition, a variety of vehicle and trip-specific variables, such as SoC and average waiting time at charging sites, can be determined, both from the fleet and from individual journeys. The distance targets for introducing high-performance charging sites can be reconsidered on the basis of the achieved results.
Further research in this certain area could optimize the charger location dimensioning. A possibility for optimizations is considering the suitability of chargers with a lower charging power at locations with low utilization so that “low-performance” charging sites are implemented within the high-performance network, which is likely to increase the supply reliability. Furthermore, to increase the realistic character of the E-Truck traffic simulation, a heterogeneous E-Truck fleet could be modelled. In this context, the battery capacity and the consumption could be varied.
We hope that this research provides valuable insights for legislators, haulage companies, network operators and charging station operators. This research contributes to the development of a more sustainable and efficient transport system and can support future policy and planning decisions on charging infrastructure for electric E-Trucks.


