Abstract
Improvement in electric vehicle technology requires the lithium-ion battery system’s safe operations, protecting battery fire damage potential from road debris impact. In this research a design of sandwich panel construction with a lattice structure core is evaluated as the battery protection system. Additive manufacturing technology advancements have paved the way for lattice structure development. The sandwich protective structure designs are evaluated computationally using a non-linear dynamic finite element analysis for various geometry and material parameters. The lattice structure’s optimum shape was obtained based on the highest Specific Energy Absorption (SEA) parameter developed using the ANOVA and Taguchi robust design method. It is found that the octet-cross lattice structure with 40% relative density provided the best performance in terms of absorbing impact energy. Furthermore, the sandwich panel construction with two layers of lattice structure core performed very well in protecting the lithium-ion NCA battery in the ground impact loading conditions, which the impactor velocity is 42 m/s, representing vehicle velocity in highway, and weigh 0.77 kg. The battery shortening met the safety threshold of less than 3 mm deformation.
1. Introduction
Global development of electric vehicle (EV) technology is progressed rapidly. According to McKinsey, EV sales from 2010 until 2017 are always increasing, reaching a new milestone of 1 million units sold in 2017 [1]. Furthermore, until September 2021, the plug-in EV had been sold for approximately 4.3 million YTD, and it is expected that by the end of 2021, the sales will exceed 6 million vehicles [2]. The EV usage results in an incredible environmental impact, as in China, the number of gasoline usage and CO2 emission in 2011–2017 was reduced by 1.6 billion tons and 612 kilotons, respectively [3]. Furthermore, the EV also has a higher efficiency compared to common internal combustion engine vehicle due to electrical components usage and minimal power conversion [4].
Most electric vehicles use the lithium-ion battery as the primary power source due to its high energy density and battery’s long lifespan [5,6]. Although the battery is good for the environment, there are still potential hazards to the passengers. Battery fires cause several accidents, for example, the Chevrolet Volt accident in May 2011 and the Tesla Model S accident in October 2013 and May 2018 [7,8,9]. Recently, in July 2021, an electric car in Norway [10], and a BMW i3 [11] in Poland also caught fire and took a long time to cool the battery down as it had thermal runaway. The battery burns mostly happened because of a short circuit caused by the battery deformation. Therefore, it is critical to give sufficient protection to the battery, to ensure passenger and car safety.
Some battery protection concepts for EV have been studied and implemented. Currently, Tesla uses three components to shield the battery, which combines the hollow aluminum bar, titanium plate, and aluminum plate [12]. Another concept was studied by Irawan [13] utilizing a sandwich structure with a composite core, and the design provides good safety for the electric vehicle’s battery. In this research, a novel design of a battery protection system will be studied.
The advanced development of additive manufacturing technology has paved way a new possibility of core topology in the sandwich structure, one of which uses the lattice structure. This advancement results in more complex structure manufacturability without any significant additional cost [14]. Lattice structure has been well received, especially in the aerospace and biomedical sector, due to its characteristics. This structure is lightweight but has excellent acoustic, vibration, dielectric, and mechanical properties, including energy absorption capabilities, better than its constituent material [15].
Much research has been done, utilizing lattice structure for several applications. Shen [16] studied the effect of lattice core in sandwich structure and showed an improvement compared to aluminium foam as the sandwich core. Besides that, the usage of the lattice structure also increases beam stiffness and strength. Other researchers, Tancogne-Dejean et al. [17] studied static and impact load to the octet-truss lattice structure, which can be applied as an energy absorption structure. Schaedler [18] also researched the usage of the lattice structure for energy absorption application and concluded that metallic micro-lattice structure offers a new level of energy absorption materials that has more flexibility to control the structural response under impact load.
In this research, several lattice geometries will be explored as the core using non-linear dynamic finite element analysis to obtain the optimum sandwich structure configurations. This paper studied the sandwich structure as a battery protection system using a lattice structure as the core due to the need to protect the battery and the lattice structure’s properties. It can be carried out to obtain a lighter but safe structure and create a more efficient vehicle.
2. Materials and Methods
2.1. Lattice Models and Definition
According to Nguyen [19], there is twelve (12) unit cell topology of the lattice structure. However, only four (4) models of the lattice structures will be covered in this research, which are Octahedron-Cross (OHC), Octet-Cross (OC), Octet-Truss (OT), and Octet-Truss-Modified (OTM). These models are chosen based on the Maxwell stability criteria [20]:
where b is the number of struts and j denotes the number of friction-less joints. Each cell topology has a different structural response. OHC and OTM have M values greater than zero, which means these cell topologies are over-constrained and have internal stresses generated. However, OC has an M value less than zero, which means the structure is bending dominated, and OT has M equal to zero, indicating it is stretch dominated structure. Besides that, these unit cell topologies are chosen so that the geometry parameters, defined later, is applicable for all geometry in the experiment design. OHC, OC, and OT shapes are based on Nguyen, but the OTM is a newly generated model. The OTM is made to provide a more robust unit cell and create another protection inside the model to prevent stone chips penetration better. The illustration of the unit cells is shown in Figure 1.
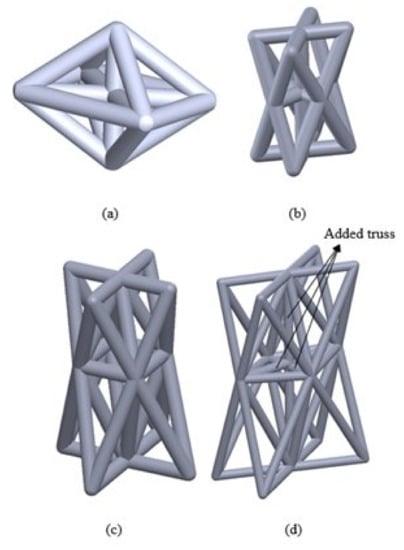
Figure 1.
Four Lattice Structure Cell Model: (a) Octahedron-Cross (OHC). (b) Octet-Cross (OC). (c) Octet-Truss (OT). (d) Octet-Truss-Modified.
The chosen unit cell structures have a cube shape of the solid cell, with the length (A), width (B), and height (H), as illustrated in Figure 2. Herein new variables are introduced: α and C. As shown in Figure 2, α is defined as the taper angle between the base and the top surface of the square frustum, with the positive value having an inward direction. Meanwhile, the C is the average cross-section size of the lattice structure, with:
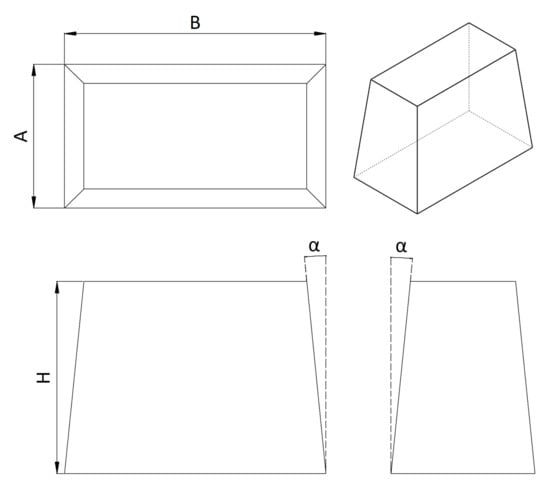
Figure 2.
Solid Cube Dimension Reference.
Cellular solid structures have one (1) common term used to describe the structure’s porosity, called relative density (ρ). Relative density is the ratio between the material’s density and solid forms’ density from the cell walls [21]. Based on the definition, relative density can also be further derived into a ratio between the lattice structure volume and the solid cell volume. The lattice structure volume is obtained from the CAD software; meanwhile, the solid cell volume is calculated analytically, using the following equation:
where A and B are the cell length, H is the cell length, and α is the taper angle of the structure, as defined in Figure 2.
2.2. Taguchi Design of Experiment
Taguchi Design of Experiment (Taguchi DoE) is a statistical tool to optimize the product [22]. In this research, the optimization was done to obtain the highest Specific Energy Absorption (SEA) value of the single-cell lattice structure model, with the idea to get the most efficient structure to protect the lithium-ion battery. The Taguchi DoE can be visualized using a process diagram, which shows the relation between the input and output. The relationship between the input and output in this study is shown in Figure 3.
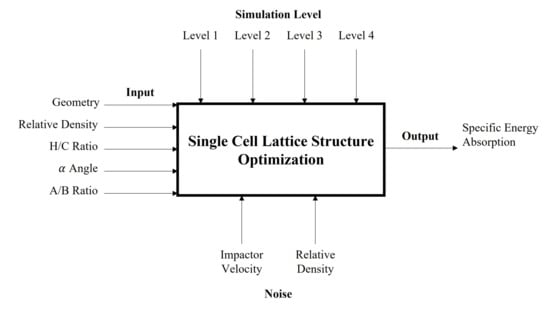
Figure 3.
Process Diagram of The Single-Cell Lattice Structure Simulation.
As shown in Figure 3, the input is differentiated into five control factors, which assumed to contribute to the energy absorption performance of the lattice structure, which is geometry (variable A), relative density (B), H/C Ratio (C), α angle (D), and A/B Ratio (E), with each control factors, have four levels of value. Details of each parameter are shown in Table 1.

Table 1.
Lattice Structure Simulation Parameters.
The parameters, which are shown in Table 1 are selected as they represent the lattice’s cell shape and dimension. The first parameter, geometry, is chosen because the lattice structure has various unit cell configurations, which may affect the energy absorption performance as the compression mode may stretch or bending dominated mode [20]. ρ, or relative density, is an essential feature in solid cellular structure, which includes lattice, representing the cavity of the structure. This parameter also had been studied by Nasrullah [23] with a similar value. The third and fifth parameters, H/C Ratio and A/B Ratio represent the unit cell dimension, independent of each other. Lastly, α is chosen to represent the taper angle of the lattice structure, which is mentioned as well by Nasrullah [23].
Based on the chosen control factors and the corresponding levels, the suitable Orthogonal Array for the Taguchi DoE is L16’. The Orthogonal Array used is based on Elizalde-González’s experiment [24], as shown in Table 2.
Table 2.
Complete Taguchi’s Design of Experiment.
Three repetitions were conducted for each simulation, with three noise levels, as shown in the process diagram. The noises are limited only occurs in the impactor’s velocity and the relative density. Noises represent the uncertainty during the simulation, which is the lattice structure’s velocity disturbance and manufacture capability. The details of the noises are shown in Table 3.
Table 3.
Noise Applied in Finite Element Simulation.
2.3. Finite Element Analysis
The single-cell lattice structure analyzed using the finite element method software, LS-DYNA. The lattice structure was subjected to a quasi-static load on the top, with a base structure below the structure, illustrated in Figure 4. The impactor velocity is set initially to zero and increased until a specified velocity (depends on the noises applied) within the first two milliseconds, as shown in Figure 5.
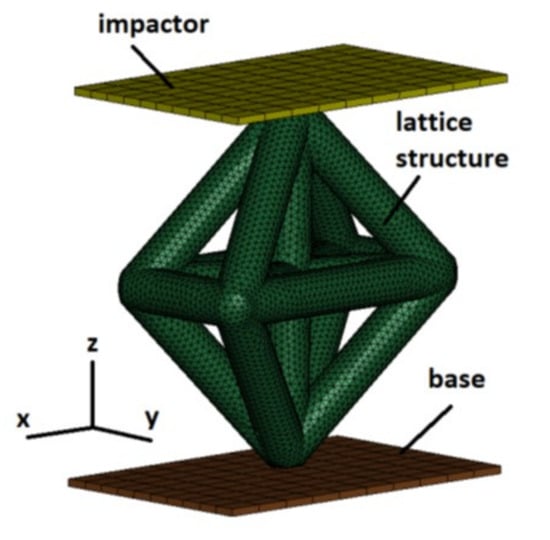
Figure 4.
Numerical Simulation Model.
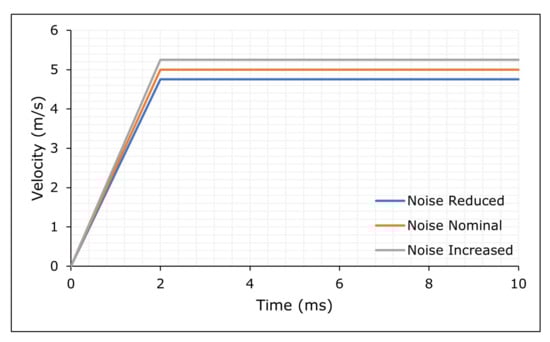
Figure 5.
Impactor’s Velocity Curve.
Some boundary conditions are applied to the structure as well. The impactor’s movement is restricted to only in the Z-axis direction towards the base, which means no translational movement in the X and Y direction and unable to rotate during the impact. At the same time, the base cannot move in any direction. These conditions are applied to the finite element model to obtain the lattice structure performance, such as the force-displacement curve during compression.
The material used in the lattice structure is titanium alloy Ti-6Al-4V. This material is popular to be used in the lattice structure, along with AlSi-12 and polymer-based material. The properties of Ti-6Al-4V are shown in Table 4 and Figure 6.
Table 4.
Ti-6Al-4V Material Properties.
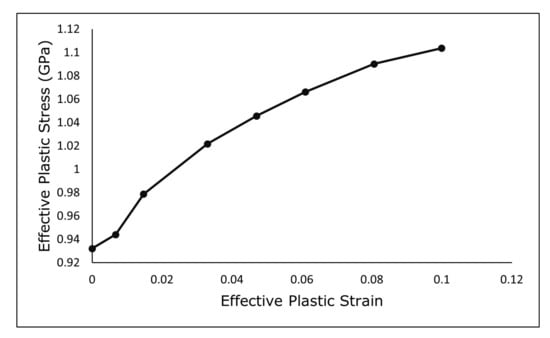
Figure 6.
Ti-6Al-4V Effective Plastic True Stress-Strain Curve [26].
The results obtained from the finite element simulations are the force-displacement curve, which shows the reaction force given to the impactor for each impactor’s displacement value. However, the total energy absorbed needs to be known as the specific energy absorption is the optimization parameter, which can be calculated by integrating the force-displacement curve. The energy absorbed calculation limited up to 60% deformation of the lattice structure. The limitation obtained by observing the force-displacement curve and the value higher than 60% deformation shows structural densification.
3. Optimization Result and Analysis
3.1. Taguchi Optimization
Forty-eight finite element simulations were conducted, with sixteen combinations of control factors and three noise levels, shown in Table 2 and Table 3. The simulation result is SEA value, as shown in Table 5.
Table 5.
SEA Results from Simulations Based on Taguchi Design of Experiment.
From the results above, the signal-to-noise ratio (S/N Ratio) for larger-the-better quality was calculated using the equations [22]:
with n shows the number of noise levels, and yi shows the output value. For each control factor and corresponding levels, the mean and S/N Ratios of the lattice structure’s SEA are averaged, presented in Table 6, and visualized in Figure 7 and Figure 8.
Table 6.
Average and S/N Ratio for Each Control Factor and Level.
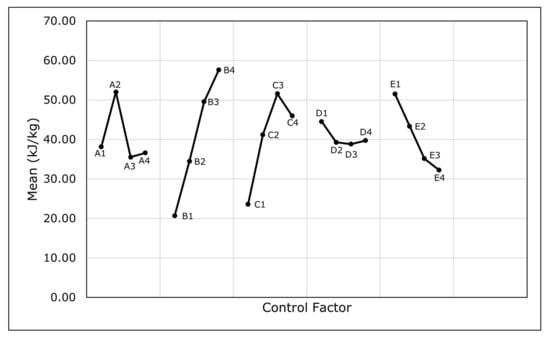
Figure 7.
Response Chart: Mean.
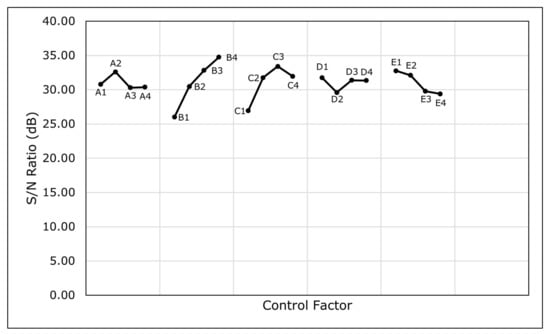
Figure 8.
Response Chart: S/N Ratio.
The response chart shows the change in SEA value according to the difference in design parameters. As the base geometry model of the lattice structure changed, the SEA value also changes with the optimum model is the A2 (octet-cross geometry). From the control factor B, relative density, the higher the relative density, will cause a higher SEA value, which implies that the energy absorption capability is more efficient than the structural mass. Hence, the optimum parameter for the relative density is B4, 40%.
Control factor C, H/C ratio, shows that the structural slenderness reaches a peak SEA value at 1.5, followed by a reducing performance if the ratio increases. It indicates that the optimum design has a value of 1.5 also, with the parameter C3. The next control factor, D or α angle, shows a different characteristic, in which the S/N ratio dropped from D1 to D2, then increased again. As the D1 shows the highest S/N ratio value, the optimum parameter is D1 or 0° of α angle. Finally, the last control factor, E or A/B ratio, shows that the S/N ratio reduces and a higher A/B ratio, in which the structure tends to be flatter. Hence, the optimum control factor is E1, A/B ratio of 1. Each control factor optimum parameter is summarized in Table 7.
Table 7.
Optimum Lattice Structure Parameters.
Prediction can be made to estimate the S/N Ratio and mean SEA value of the optimum design using the data obtained from the finite element simulations before (see Table 5). A predictive equation is used by using the obtained S/N Ratio and mean value [28,29]:
with η is the predicted variable (in this case, S/N or SEA), is the average value of the variable from all simulations, and Xij is the average value of control factor i with the optimum level j.
The estimated S/N ratio and mean SEA value from Equation (4) found to be 41.21 dB and 94.97 kJ/kg, respectively. Compared to the reference value of the optimization, the average S/N ratio (31.02 dB) and average SEA value (40.59 kJ/kg), the improvement in S/N value and SEA are 10.19 dB and 54.38 kJ/kg, respectively.
3.2. Analysis of Variance (ANOVA)
The purpose of analyzing the variance using ANOVA is to obtain the contribution for each control factor. A higher contribution means that the corresponding control factor has a more significant influence on SEA value. The number of runs, repetitions, and levels for each control factor must be defined to do the ANOVA analysis. Each value will determine the degree of freedom (DoF) value of each control factor.
The contribution of each control factor is determined by the Sum of Square (SS) value. SS for each control factor calculated using the equation below [22]:
with k shows the number of levels, Tt is the sum of response at level t, T is the total sum response, N is total number of runs, and n shows number of repetition.
Furthermore, the total SS value for the whole orthogonal array can be evaluated using the following equation:
The SS and the Total SS ratio for each control factor determined the corresponding control factors’ percentage contribution. This ratio shows a relative significance between each control factor. The result of the variance analysis is shown in Table 8. As visualized in Figure 9, the relative density has the highest contribution to the single-cell lattice structure SEA performance, with a 48.92% contribution, followed by H/C ratio and A/B ratio. The next smaller contribution is base geometry design and the taper (α) angle, which has the smallest contribution to the SEA value, hinting that changing these variables will have a less significant effect on SEA value.
Table 8.
Analysis of Variance Result.
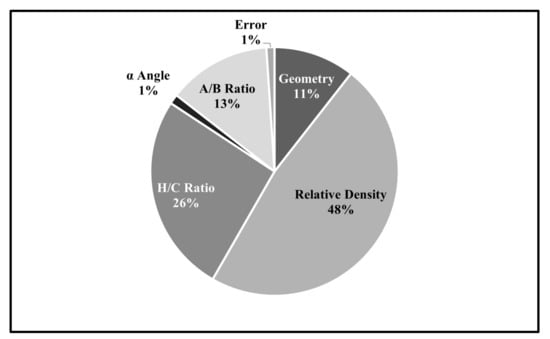
Figure 9.
Contributions of Each Control Factor.
As the contribution values only show each control factor’s relative significance compared to each other, another test was done to observe each control factor’s statistical significance, so-called the F-test. The test is required to calculate the mean of the square (MS) and F value for each control factor. MS is the ratio between the SS and DoF; meanwhile, F is the ratio between the MS of each control factor and the error MS. The F value is compared to the critical value (with 95% confidence), 2.9 [30]. The results show that all control factors are statistically significant to the single-cell lattice structure’s SEA performance.
3.3. Optimization Result and Verification
The optimized model of the lattice structure was made using the parameters obtained before, which are octet-cross geometry (control factor: A2), 40% relative density (B4), H/C ratio of 1.5 (C3), 0-degree of alpha angle (D1), and A/B ratio of 1 (E1). These parameters result in the model, as illustrated in Figure 10. The CAD model then analyzed using LS-DYNA with three levels of noise, which results in the force-displacement curve of the lattice structure (see Figure 11). The force-displacement curve was then analyzed to calculate the SEA value, summarized in Table 9.
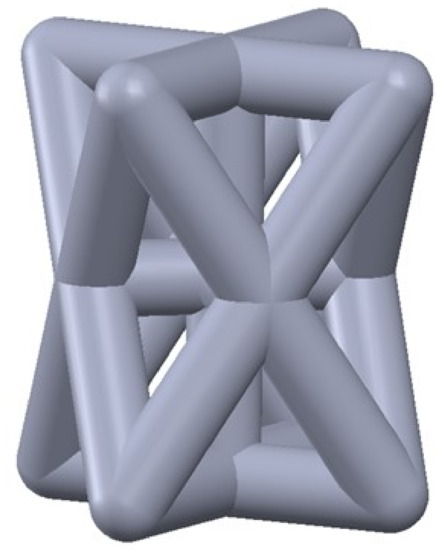
Figure 10.
Optimized Model Illustration.
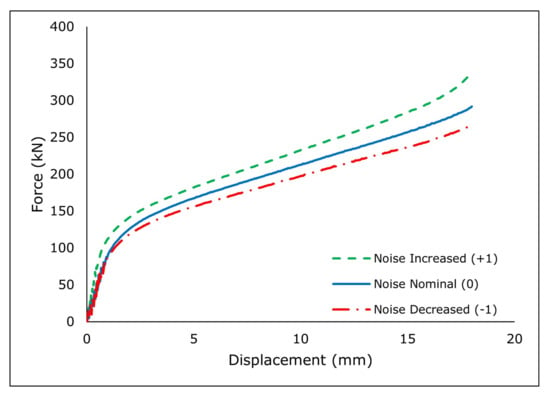
Figure 11.
Force-Displacement Curve of Optimum Model.
Table 9.
Performance of The Optimum Model.
Based on the SEA value, the S/N ratio and the mean value is obtained, 38.63 dB and 85.47 kJ/kg, respectively. Using the performance of the baseline model (31.02 dB and 40.59 kJ/kg), the improvement based on the finite element simulations are 7.61 dB for S/N and 44.88 kJ/kg for the SEA.
In Design for Six Sigma (DFSS), the S/N ratio’s gain determined the optimization’s quality. If the gain is larger than 1, the optimization results in excellent improvement, but the optimization shows a poor improvement if the gain is smaller than 1. Recall the S/N ratio gain, 7.61 dB; it is larger than 1, which means that the quality is greatly improved.
The SEA value improvement happens as the geometry parameters chosen are the best in each control factor. It is observed from the force-displacement curve (see Figure 11) that the crushing mode that occurs in the lattice structure is the bending-dominated mode. This structure has constant plateau stress and no initial peak force, and it is more suitable for energy absorption application [31]. This application requires the peak force to be as low as possible to achieve the highest crushing force efficiency.
The gain in S/N ratio and mean SEA value observed appears to be different between the estimated value based on the Taguchi method and the obtained value from the finite element simulations. There is a 9.51 kJ/kg difference in mean SEA gain and 2.58 dB difference in S/N ratio gain, as summarized in Table 10. The error may happen in the optimization process due to a limited number of experiments done and can be further reduced by increasing the number of experiments.
Table 10.
Verification of The Optimized Model Summary.
4. Battery Pack Design and Analysis
The optimum lattice structure design was studied as a part of the lithium-ion battery protection system. The lattice structure is arranged in a multi-cell configuration, in which the dimension will vary. The battery protection system configuration used a model based on Irawan [13] to prevent battery deformation more than 3 mm [32]. The configuration is illustrated in Figure 12.
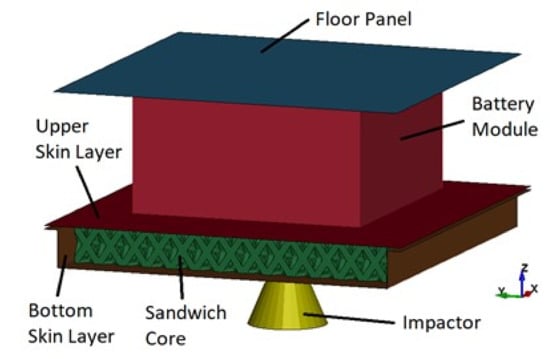
Figure 12.
Battery Protection Simulation Modelling Configuration.
4.1. Battery Impact Simulation Model
The battery protection system simulation consists of several parts: the battery module, the sandwich structure, the vehicle floor panel, and the impactor. The battery module consists of 7 by 7 of 18650 type of battery, surrounded by a housing with a thickness of 0.25 mm (see Figure 13). The 18650-battery jellyroll modeled as a crushable foam with the properties, as shown in Table 11, and the battery skin was modeled as a shell element with a thickness of 0.25 mm and assigned with steel material. Moreover, the battery housing was also built as a shell element with a 3 mm thickness, made of polypropylene.
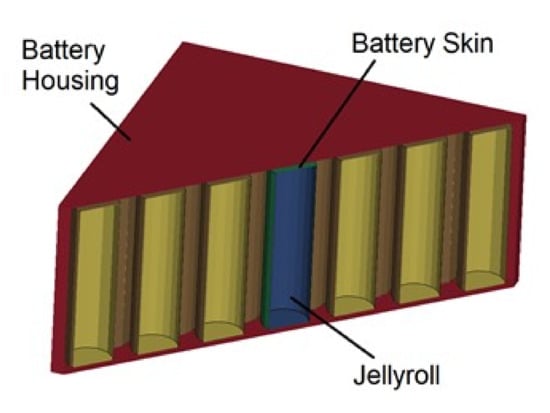
Figure 13.
Internal Configuration of Battery Module.
Table 11.
Jellyroll Material Properties [13].
The battery protection system’s sandwich structure is made of 2 skin layers separated by the sandwich core. Both skin layers are modeled as shell elements with a thickness of 0.4 mm for the top skin and 0.25 mm for the bottom skin layer. These skins are made of Al2024-T351. However, the sandwich structure’s core uses a multi-cell lattice structure with the material of Ti-6Al-4V. There are three configurations studied, as detailed in Table 12 and illustrated in Figure 14.
Table 12.
Lattice Structure Scaling Configuration.
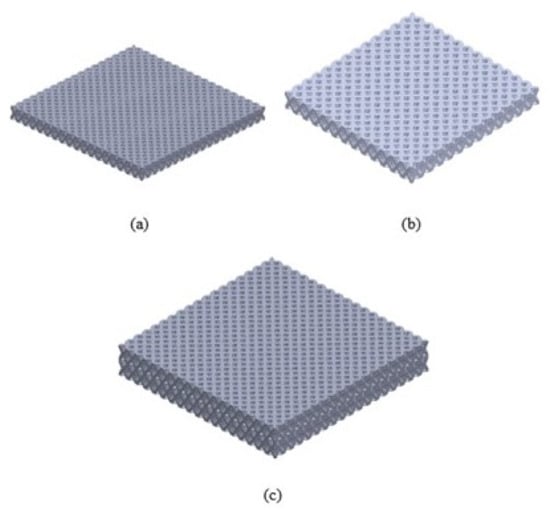
Figure 14.
Multicell Lattice Structure Configuration: (a) Configuration #1. (b) Configuration #2. (c) Configuration #3.
The battery system’s floor panel is made to represent the vehicle structure’s base above the battery module. The floor panel is useful to limit the battery module’s displacement, so it will not be breached into the vehicle’s main compartment. The floor panel is also made of Al2024-T351.
The impactor is modeled to represent road debris impacting the battery system. This part was modeled as a cone shape with a flat tip, with a conical angle of 45°. The impactor weighed 0.77 kg, with an initial velocity of 42 m/s, the same as a typical vehicle velocity on the road and moves towards the battery pack. This condition induced an impact force in the battery system and should be absorbed by the lattice structure as the primary energy absorption system of the battery. As the weight and impactor’s velocity are known, the initial energy of the impactor (and thus the whole structure) can be calculated using equation:
means the total energy the system is 679.14 J.
The battery impact simulation is done to obtain the maximum battery deformation for 3 different lattice structure array configurations. As the impactor was placed in the centre of the battery module, it was assumed that the maximum deformation occurred on the battery in the middle as well. The deformation is then extracted by placing several trackers on the upper side and below the jellyroll, which shows the displacement of each side, and taking the difference to obtain the jellyroll deformation. These trackers are shown in Figure 15.
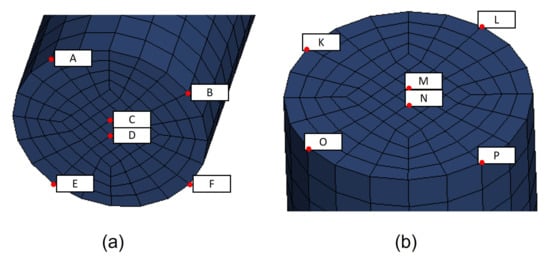
Figure 15.
Trackers Position: (a) Under The Jellyroll. (b) Above The Jellyroll.
The finite element simulation consists of several moving parts. Several contact parameters then need to be defined to avoid any penetration between those parts. The master and slave parts are elaborated in Table 13, with the friction coefficient being 0.4 in the static condition and 0.3 in the dynamic condition.
Table 13.
Master and Slave Parts of Defined Contact Parameters.
4.2. Results and Discussion
The finite element simulation is done in three different lattice structure configurations, resulting in the 18650-battery deformation curve to time is shown in Figure 16. The graph shows that configurations #1 and #2 of the lattice core (one-layer configuration) have a maximum battery deformation larger than the allowable value, 5.91 mm and 6.27, respectively. Comparing with the 18650 battery safety criteria, which 4 mm of axial deformation [32], these configurations still failed to perform a good battery protection system. However, a different result shows in configuration #3 the lattice structure. Using two-layers of lattice core shows a significant reduction in battery deformation, which deformed only 2.7 mm. This result means that configuration #3 provides sufficient protection to the battery system.
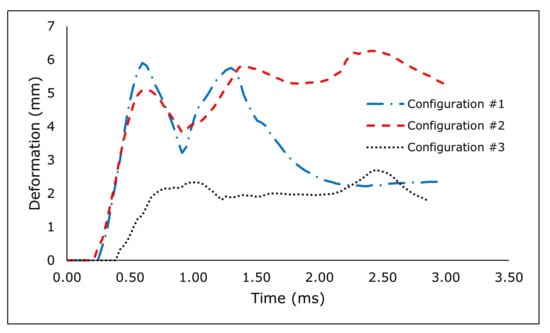
Figure 16.
Deformation Curve of The Battery for Each Lattice Configuration.
The battery deformation of the system is related to the energy absorption capability of the sandwich structure. The lattice structure’s energy absorption performance may see in the change of the structure’s internal energy, as shown in Figure 17. Configuration #3 of the lattice structure has the highest internal energy change, resulting in the smallest battery deformation, while the lattice structure configurations #1 and #2 have lower internal energy than configuration #3. However, the battery deformation of configuration #2 is larger than configuration #1, although the internal energy is higher in configuration #2.
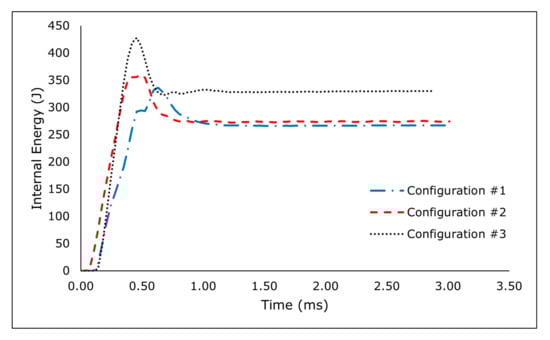
Figure 17.
Internal Energy Change of The Lattice Structure.
As visualized in Figure 18, the beginning of the impact is at t = 0.14 ms. The impact force deformed the lattice structure as shown at t = 0.28 ms and followed by the structure’s bending at t = 0.49 ms. The sandwich structure starts moving straight towards the battery module at t = 0.66 ms, which causes the battery deformation. It ends at t = 0.98 ms when the impactor and the protector are changing their movement direction. The phenomenon shows that the impactor’s energy is distributed into the lattice structure’s plastic deformation (as energy absorption) and the kinetic energy of the lattice structure. The kinetic energy establishes a translational movement, impacting the battery module, which means that the lattice structure configuration used is still too stiff.
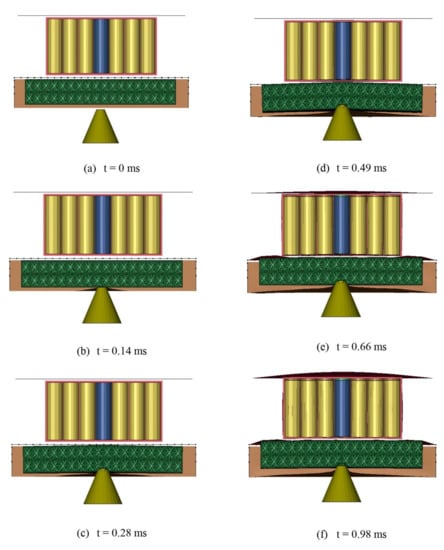
Figure 18.
Battery Protection System Response to Ground Impact.
The third configuration lattice structure provides a sufficient energy absorption capability which limit the battery’s deformation below 3 mm. The maximum deformation occurs at t = 2.45 ms, where the observed battery’s jellyroll (in blue color) shortened by 2.7 mm, which visualized in Figure 19. As shown in the same figure, it is shown that the battery deformation is larger in the area where the impactor hit the battery module, which indicates the battery in the centre is the most critical part.
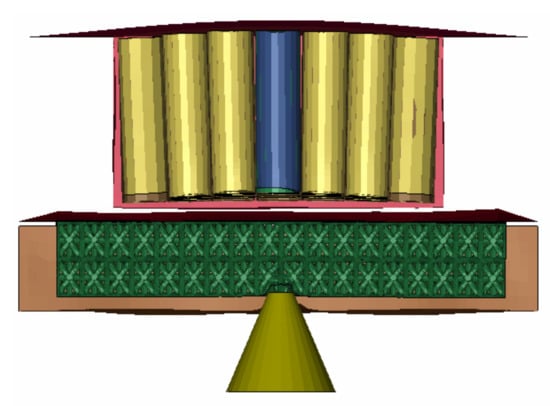
Figure 19.
Battery Protection System Response to Ground Impact.
The change in the internal energy of each lattice structure shares the same pattern. The value rises until a peak value, then reduced until a steady-state value—the elastic and plastic deformation causes this pattern. The peak value consists of a combination of these deformation types, while the steady-state value only consists of plastic deformation. Figure 20, Figure 21 and Figure 22 show the plastic deformation of each lattice configuration.
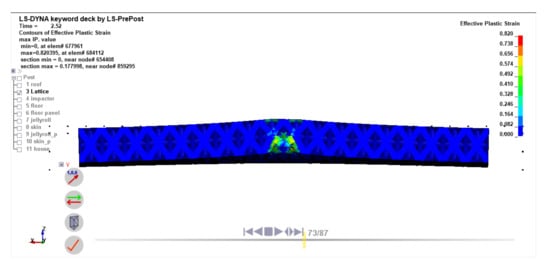
Figure 20.
Plastic Deformation of The Configuration #1 Lattice Structure.
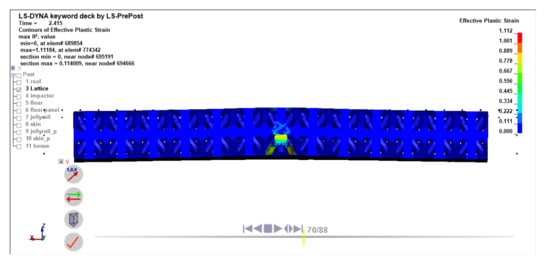
Figure 21.
Plastic Deformation of The Configuration #2 Lattice Structure.
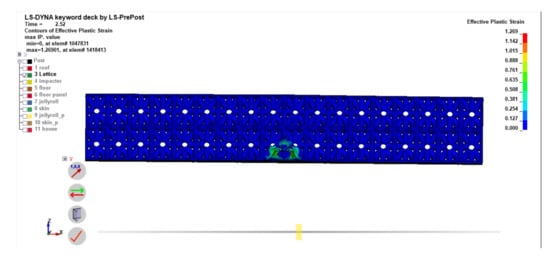
Figure 22.
Plastic Deformation of The Configuration #3 Lattice Structure.
5. Conclusions
The computational study is carried out to find solutions for frequent problems in the electric vehicle implementation of the lithium-ion-based battery undergoing impact loading due to road debris. Using non-linear finite element analysis, it is found that:
- The sensitivity analysis using Analysis of Variance results in the contributions of 5 control factors for SEA output. The most sensitive parameter is the relative density (47.73% contribution), followed by height-to-cross section characteristic length – H/C ratio (25.96%), length-to-width – A/B ratio (13.43%), geometry (10.57%), and taper (α) angle (1.25%), with the error contribution of 1.05%. Based on the F-test analysis, all control factors significantly affect the SEA output, with a 95% confidence level;
- The optimum design, with the highest SEA output, based on the Taguchi Orthogonal Array has configuration of the octet-cross geometry structure, with 40% relative density, with a H/C ratio of 1.5, α angle 0°, and the A/B ratio of 1. The SEA output from this optimum design is 85.47 kJ/kg.
- The lattice structure’s optimized model can be applied as the sandwich core in the battery protection system. The lattice structure size is 10 mm by 10 mm by 15 mm, arranged in 18 × 18 × 2 cells. This structure’s total mass is 1722 grams and can maintain the battery deformation for a maximum of 2.7 mm.
In this research, the optimization is focused on the lattice structure geometry parameters to achieve the highest SEA of a single cell lattice shape. The obtained design was then applied for the battery protection system, and it is capable of withstanding the impact load given to the battery. However, as the SEA reaches its peak, the mean crushing force of the lattice structure is also high, which may create an over stiff structure and reduce the energy absorption capability of the structure. Therefore, for future works, it is recommended to use a multi-objective optimization for a similar problem to increase the energy absorption capability of the lattice structure while keeping the battery deformation and the structural mass low. Furthermore, the lattice array configuration has to be included as the optimization parameter.
Author Contributions
Conceptualization, S.P.S.; methodology, S.P.S. and D.W.; software, L.K.P.; validation, T.D. and D.W.; formal analysis, L.K.P. and S.P.S.; investigation, T.D. and D.W.; resources, T.D. and D.W.; data curation, L.K.P.; writing—original draft preparation, L.K.P.; writing—review and editing, S.P.S., T.D. and D.W.; visualization, L.K.P.; supervision, S.P.S., T.D., D.W.; project administration, S.P.S.; funding acquisition, S.P.S. All authors have read and agreed to the published version of the manuscript.
Funding
This research was supported by the ITB Research Program (2021).
Data Availability Statement
The data presented in this study are available on request from the corresponding author.
Acknowledgments
This research is fully funded by ITB Research Program managed by the Center for Research and Community Service (2021).
Conflicts of Interest
The authors reported no potential competing interest.
Abbreviations
The following abbreviations are used in this manuscript:
| EV | Electric Vehicle |
| OHC | Octahedron-Cross |
| OC | Octet-Cross |
| OT | Octet-Truss |
| OTM | Octet-Truss Modified |
| DoE | Design of Experiment |
| SEA | Specific Energy Absorption |
| ANOVA | Analysis of Variance |
| DoF | Degree of Freedom |
| SS | Sum of Square |
| MS | Mean Square |
| CAD | Computer-aided Design |
| DFSS | Design for Six Sigma |
References
- Hertzke, P.; Müller, N.; Schenk, S.; Wu, T. The Global Electric-Vehicle Market Is Amped up and on the Rise. Available online: https://www.mckinsey.com/industries/automotive-and-assembly/our-insights/the-global-electric-vehicle-market-is-amped-up-and-on-the-rise (accessed on 16 December 2021).
- Kane, M. Global Plug-In Car Sales September 2021: Doubled to A New Record. Available online: https://insideevs.com/news/544743/global-plugin-car-sales-september2021/ (accessed on 16 December 2021).
- Zheng, J.; Sun, X.; Jia, L.; Zhou, Y. Electric passenger vehicles sales and carbon dioxide emission reduction potential in China’s leading markets. J. Clean. Prod. 2020, 243, 118607. [Google Scholar] [CrossRef]
- Reksowardojo, I.K.; Arya, R.R.; Budiman, B.A.; Islameka, M.; Santosa, S.P.; Sambegoro, P.L.; Aziz, A.R.A.; Abidin, E.Z.Z. Energy Management System Design for Good Delivery Electric Trike Equipped with Different Powertrain Configurations. World Electr. Veh. J. 2020, 11, 76. [Google Scholar] [CrossRef]
- Jia, Y.; Yin, S.; Liu, B.; Zhao, H.; Yu, H.; Li, J.; Xu, J. Unlocking the coupling mechanical-electrochemical behavior of lithium-ion battery upon dynamic mechanical loading. Energy 2019, 166, 951–960. [Google Scholar] [CrossRef]
- Yang, S.; Wang, W.; Lin, C.; Shen, W.; Li, Y. Improved constitutive model of the jellyroll for cylindrical lithium ion batteries considering microscopic damage. Energy 2019, 185, 202–212. [Google Scholar] [CrossRef]
- Smith, B. Chevrolet Volt Battery Incident Overview Report; NHTSA: Washington, DC, USA, 2012. [Google Scholar]
- Jensen, C. Tesla Says Car Fire Started in Battery. Available online: https://wheels.blogs.nytimes.com/2013/10/02/highway-fire-of-tesla-model-s-included-its-lithium-battery/ (accessed on 16 December 2021).
- Gastelu, G. NTSB: Tesla Was Going 116 mph at Time of Fatal FLORIDA Accident, Battery Pack Reignited Twice Afterwards. Available online: https://www.foxnews.com/auto/ntsb-tesla-was-going-116-mph-at-time-of-fatal-florida-accident-battery-pack-reignited-twice-afterwards (accessed on 16 December 2021).
- Mossing, J.B. Batteribrann i elbil på E39 i Alver. Available online: https://www.nrk.no/vestland/batteribrann-i-elbil-pa-e39-i-alver-1.15585202 (accessed on 22 December 2021).
- Kromer, O.; Pożar Elektrycznego bmw i3 na Służewie. Samochód Spłonął doszczęTnie. Available online: https://warszawa.wyborcza.pl/warszawa/7,54420,27296173,pozar-elektrycznego-bmw-na-mokotowie-kierowca-zdazyl-wysiasc.html?disableRedirects=true (accessed on 22 December 2021).
- Tesla Adds Titanium Underbody Shield and Aluminum Deflector Plates to Model S | Tesla. Available online: https://www.tesla.com/blog/tesla-adds-titanium-underbody-shield-and-aluminum-deflector-plates-model-s (accessed on 16 December 2021).
- Irawan, D.; Santosa, S.P.; Jusuf, A.; Sambegoro, P.L. Sandwich Panel Composite Based Light-Weight Structure Design for Reserved Energy Storage System (RESS) Protection. In Proceedings of the 2019 6th International Conference on Electric Vehicular Technology (ICEVT), Bali, Indonesia, 18–21 November 2019; pp. 124–134. [Google Scholar] [CrossRef]
- Jansen, M.; Pierard, O. A hybrid density/level set formulation for topology optimization of functionally graded lattice structures. Comput. Struct. 2020, 231, 106205. [Google Scholar] [CrossRef]
- Maconachie, T.; Leary, M.; Lozanovski, B.; Zhang, X.; Qian, M.; Faruque, O.; Brandt, M. SLM lattice structures: Properties, performance, applications and challenges. Mater. Des. 2019, 183, 108137. [Google Scholar] [CrossRef]
- Shen, Y. High-Performance Sandwich Structures Based on Novel Metal Cores. Ph.D. Thesis, University of Liverpool, Liverpool, UK, 2009. [Google Scholar]
- Tancogne-Dejean, T.; Spierings, A.B.; Mohr, D. Additively-manufactured metallic micro-lattice materials for high specific energy absorption under static and dynamic loading. Acta Mater. 2016, 116, 14–28. [Google Scholar] [CrossRef]
- Schaedler, T.A.; Ro, C.J.; Sorensen, A.E.; Eckel, Z.; Yang, S.S.; Carter, W.B.; Jacobsen, A.J. Designing Metallic Microlattices for Energy Absorber Applications. Adv. Eng. Mater. 2014, 16, 276–283. [Google Scholar] [CrossRef]
- Nguyen, D.S.; Vignat, F. A method to generate lattice structure for Additive Manufacturing. In Proceedings of the 2016 IEEE International Conference on Industrial Engineering and Engineering Management (IEEM), Bali, Indonesia, 4–7 December 2016; pp. 966–970. [Google Scholar]
- Mines, R. Metallic Microlattice Structures: Manufacture, Materials and Application; Springer International Publishing: London, UK, 2019. [Google Scholar]
- Gibson, L.J.; Ashby, M.F. Cellular Solids: Structure and Properties; Cambridge University Press: Cambridge, UK, 1997. [Google Scholar]
- Yang, K.; El-Haik, B.S. Design for Six Sigma: A Roadmap for Product Development; McGraw-Hill: New York, NY, USA, 2009. [Google Scholar]
- Nasrullah, A.I.H.; Santosa, S.P.; Dirgantara, T. Design and optimization of crashworthy components based on lattice structure configuration. Structures 2020, 26, 969–981. [Google Scholar] [CrossRef]
- Elizalde-González, M.; García-Díaz, L. Application of a Taguchi L16 orthogonal array for optimizing the removal of Acid Orange 8 using carbon with a low specific surface area. Chem. Eng. J. 2010, 163, 55–61. [Google Scholar] [CrossRef]
- Military Handbook: Metallic Materials and Elements for Aerospace Vehicle Structures; U.S. Department of Defense: Arlington, VA, USA, 1998.
- Dong, L.; Deshpande, V.; Wadley, H. Mechanical response of Ti–6Al–4V octet-truss lattice structures. Int. J. Solids Struct. 2015, 60, 107–124. [Google Scholar] [CrossRef]
- Zhu, G.; Li, C.; Zhang, Z. Model Verification for Material Parameters of Titanium Alloy Ti-6AL-4V and Steel. MATEC Web Conf. 2018, 227, 01005. [Google Scholar] [CrossRef][Green Version]
- Gianfranco. What Is the Difference between ANOVA and Regression (and Which One to Choose). Available online: https://www.statsimprove.com/en/what-is-the-difference-between-anova-and-regression-and-which-one-to-choose/ (accessed on 16 December 2021).
- Chamoli, S. A Taguchi approach for optimization of flow and geometrical parameters in a rectangular channel roughened with V down perforated baffles. Case Stud. Therm. Eng. 2015, 5, 59–69. [Google Scholar] [CrossRef]
- Walpole, R.; Myers, R.; Myers, S. Probability and Statistics for Engineers and Scientists; Prentice Hall International: Boston, MA, USA, 2012. [Google Scholar]
- Deshpande, V.S.; Ashby, M.F.; Fleck, N.A. Foam topology: Bending versus stretching dominated architectures. Acta Mater. 2001, 49, 1035–1040. [Google Scholar] [CrossRef]
- Zhu, J.; Zhang, X.; Sahraei, E.; Wierzbicki, T. Deformation and failure mechanisms of 18650 battery cells under axial compression. J. Power Sources 2016, 336, 332–340. [Google Scholar] [CrossRef]


Publisher’s Note: MDPI stays neutral with regard to jurisdictional claims in published maps and institutional affiliations. |
© 2021 by the authors. Licensee MDPI, Basel, Switzerland. This article is an open access article distributed under the terms and conditions of the Creative Commons Attribution (CC BY) license (https://creativecommons.org/licenses/by/4.0/).