
Research on Hydrogen Consumption and Driving Range of Hydrogen Fuel Cell Vehicle under the CLTC-P Condition


Abstract
:1. Introduction
2. Research Object
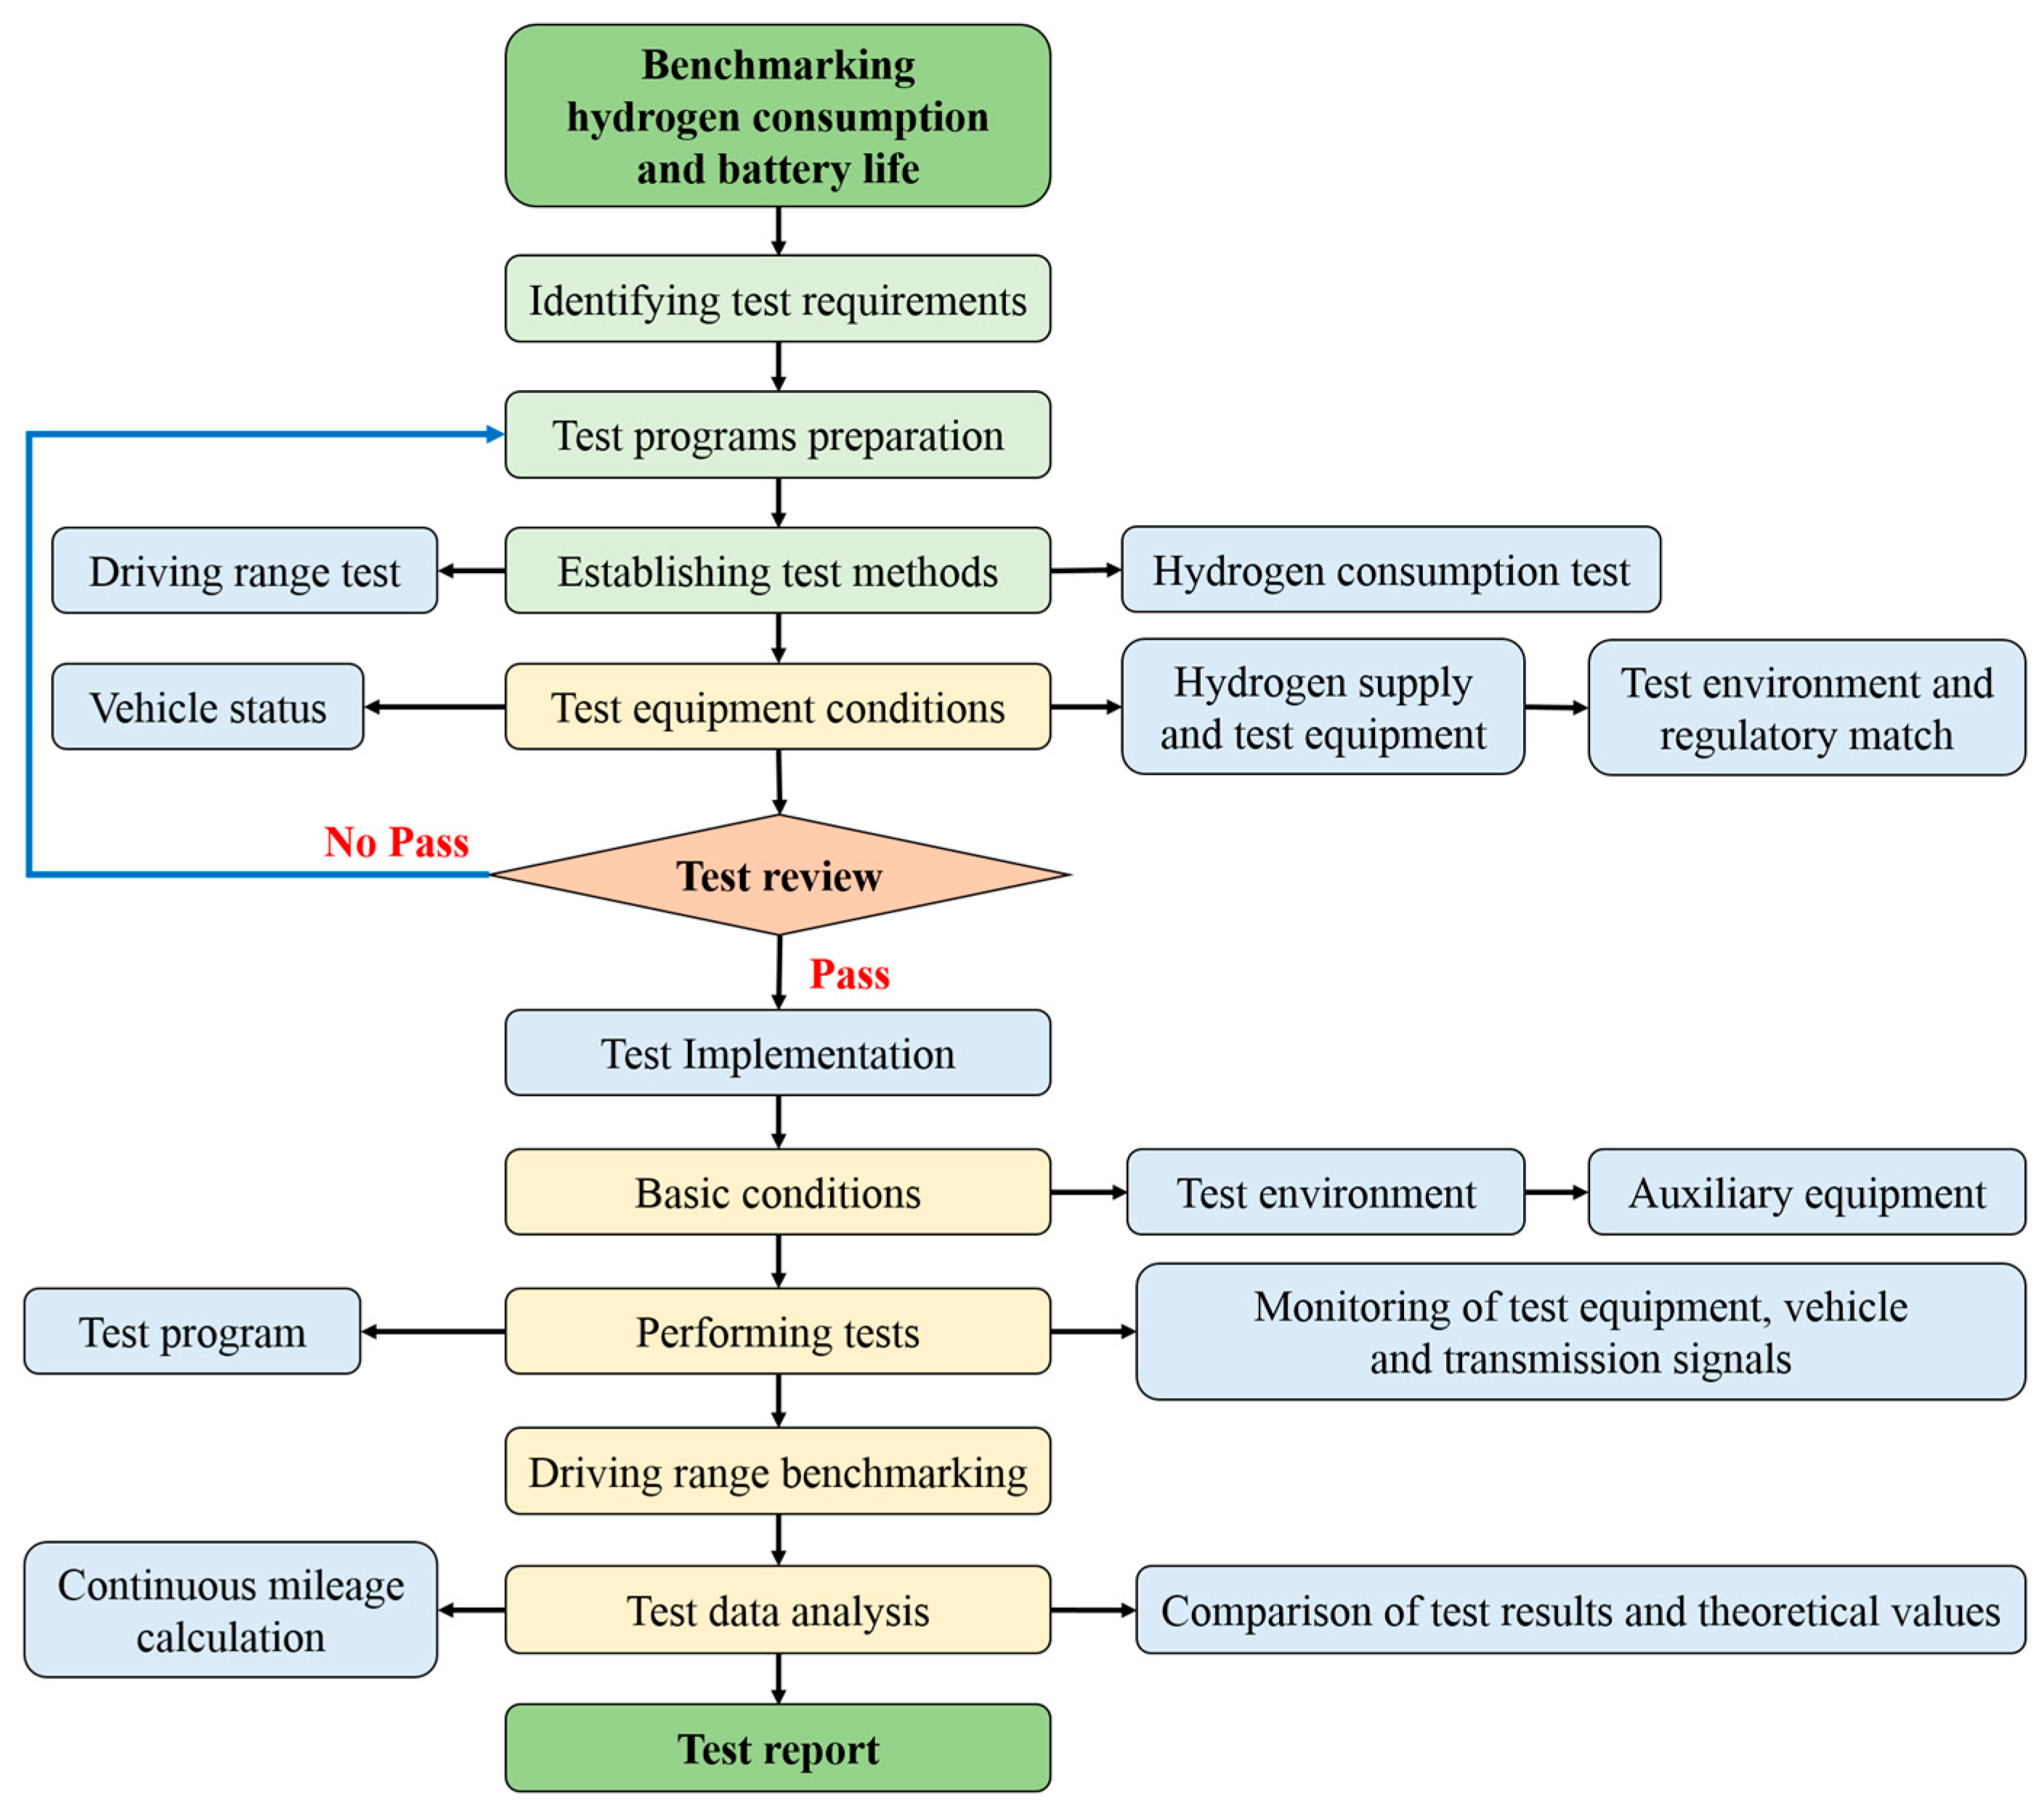
3. Test Method
3.1. Introduction to the Test Methods for Hydrogen Consumption of Fuel Cell Vehicles
3.2. Introduction of Fuel Cell Vehicle Driving Range Test Method
- (1)
- The vehicle meter will give a parking indication;
- (2)
- The vehicle speed tolerance does not meet ±2 km/h or the time tolerance exceeds 10 s.
3.3. Test Method and Procedure
3.3.1. Hydrogen Consumption Test for Fuel Cell Vehicles
- (1)
- Test vehicle A vehicles close the on-board hydrogen supply system and use the hydrogen from the hydrogen supply pipeline outside the test room. In this study, Austrian AVL’s hydrogen flow metering system was used to measure the value of vehicle hydrogen consumption. Test vehicle B vehicles use the pressure-temperature method of the vehicle’s hydrogen storage tank to measure hydrogen consumption indirectly;
- (2)
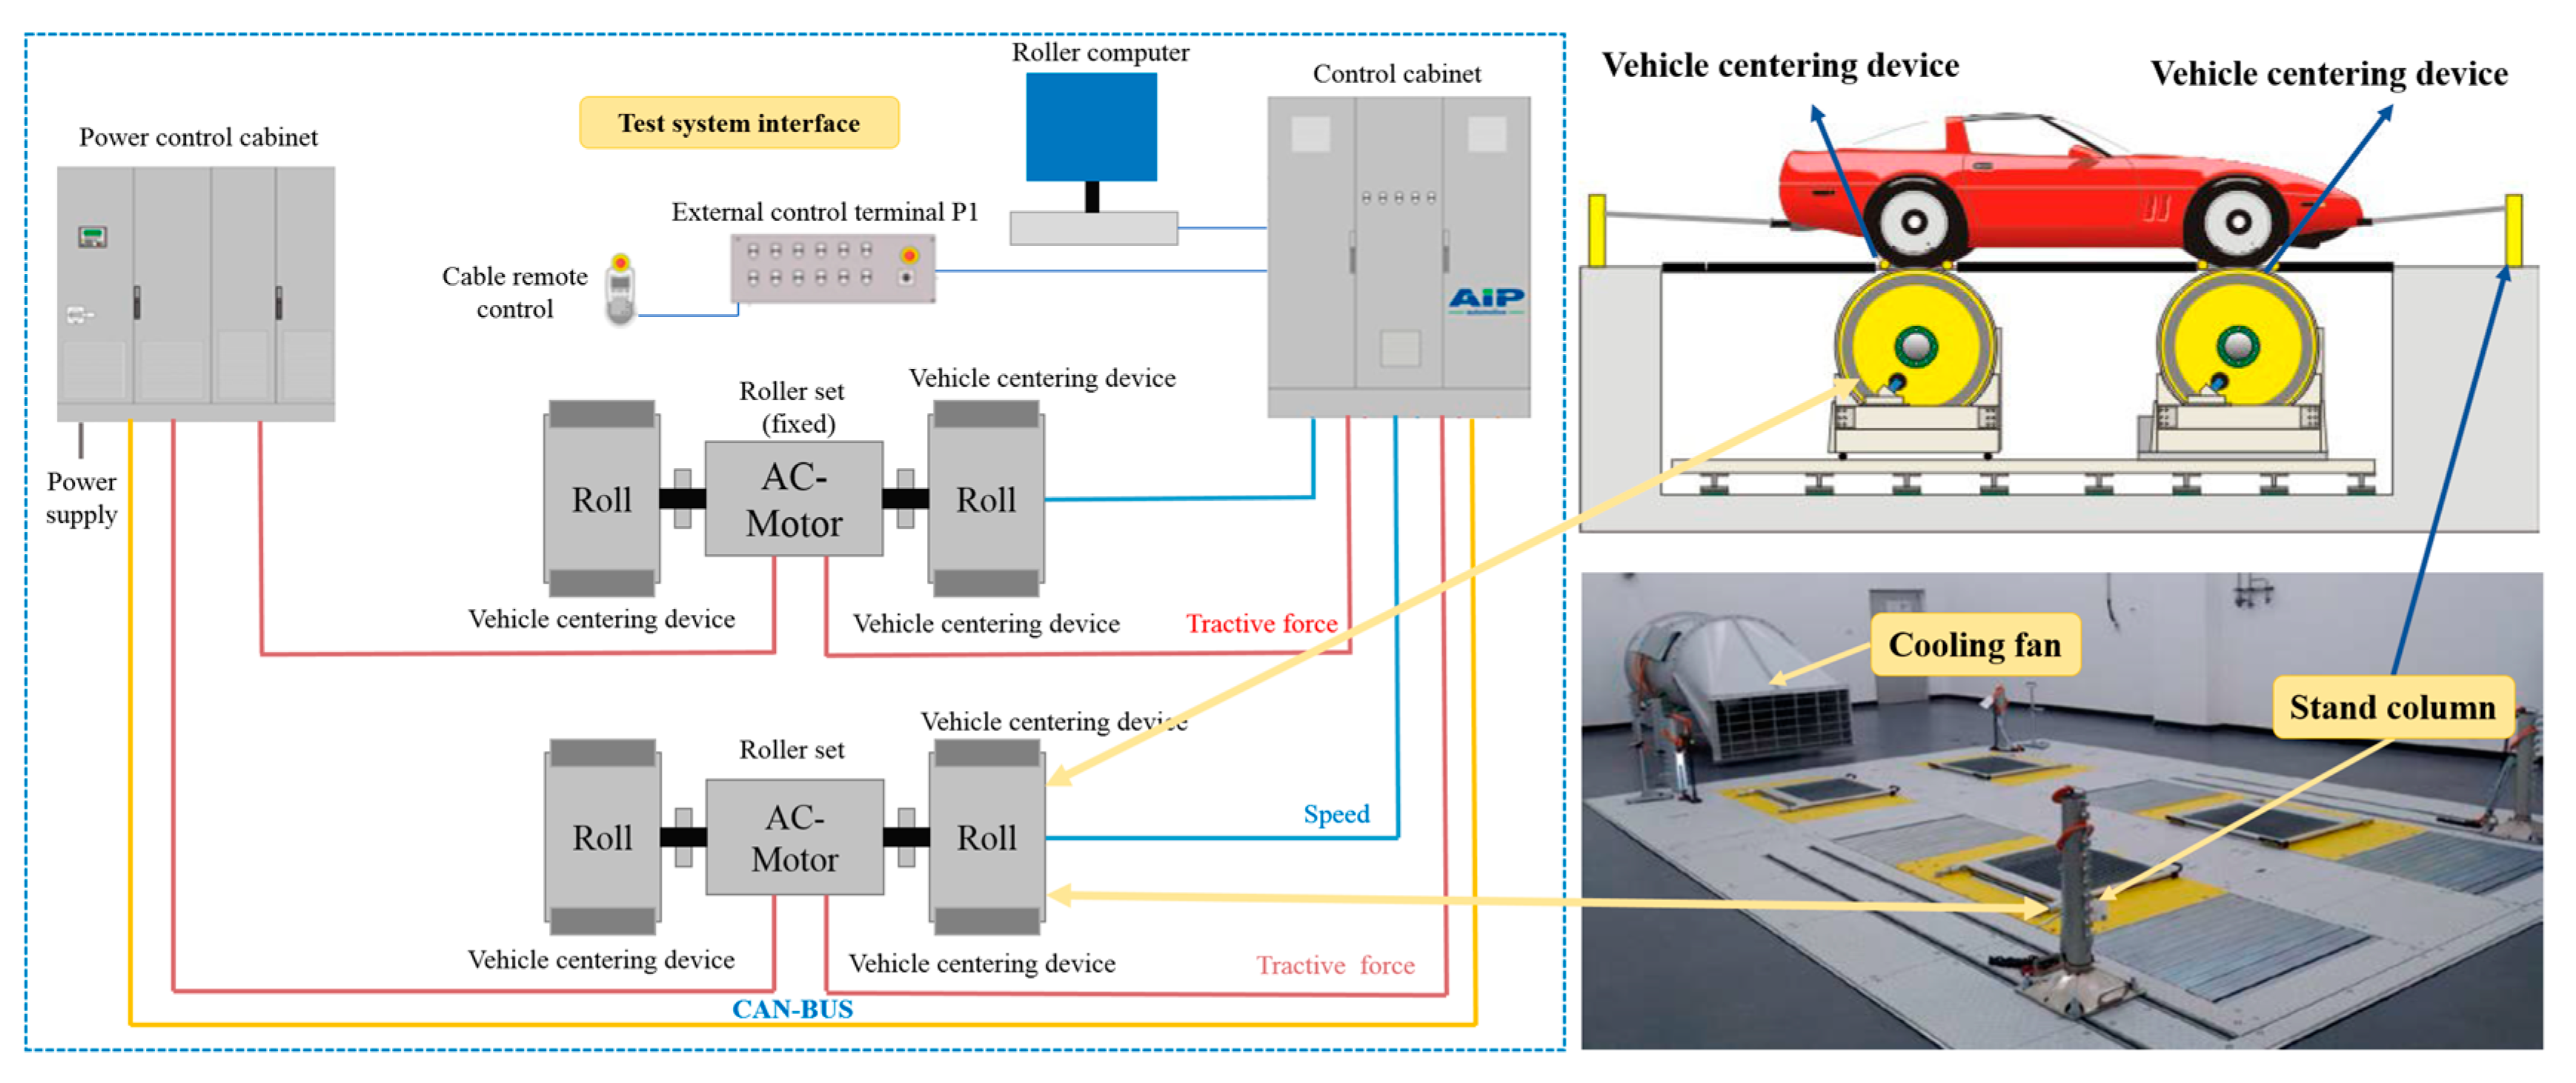
- After the vehicle is fixed to the chassis dynamometer, leave it at room temperature (20–30 °C) for 30 min;
- (3)
- Vehicle road load and chassis dynamometer load are set following national standards;
- (4)
- The vehicle is warmed up, the vehicle is driven on the chassis dynamometer, the vehicle is turned off after the CLTC-P cycle is completed, and the vehicle is set to the initial value for 15 min;
- (5)
- Start the vehicle signal acquisition equipment. The acquired signals include but are not limited to each hydrogen cylinder temperature, hydrogen cylinder pressure, hydrogen fuel cell stack current, voltage, vehicle mileage, hydrogen consumption, and hydrogen flow, and the acquisition frequency of each signal is 10 Hz;
- (6)
- Start the vehicle and perform 13 continuous working condition tests in accordance with the CLTC-P working condition table. The vehicle cannot be stopped during the test operation until the end of the test;
- (7)
- Record the mileage at the end of each test cycle and keep the mileage to one decimal place. If the hydrogen flow rate is used to test the hydrogen consumption, the hydrogen consumption is recorded at the same time, and the hydrogen consumption is kept to one decimal place;
- (8)
- After the vehicle completes 13 cycles of testing, record the total mileage and stop the vehicle;
- (9)
- Stop data recording and analyze the data.
3.3.2. Hydrogen Consumption Test for Fuel Cell Vehicles
- (a)
- Fill the vehicle-mounted hydrogen cylinder with hydrogen until the rated pressure is 70 MPa;
- (b)
- Keep the car static at room temperature (20–30 °C) for 30 min, then fix the car to the chassis dynamometer;
- (c)
- Start the vehicle, test according to CLTC-P working conditions, and stop when the test end conditions are reached;
- (d)
- Record the mileage and accumulated mileage of each cycle working condition, keeping one decimal place for the mileage of each working condition. The accumulated mileage is rounded up.
4. Test Results and Discussion
4.1. Analysis and Discussion of Hydrogen Consumption Test Data
4.1.1. Analysis of Test Vehicle A Test Results and Hydrogen Consumption Measurement Method
4.1.2. Analysis of Test Vehicle B Test Results and Hydrogen Consumption Evaluation Method
4.2. Analysis and Discussion of Test Data of Vehicle Driving Range
4.2.1. Analysis of Test Vehicle A Test Results and Driving Range Test Method
4.2.2. Analysis of Test Vehicle B Test Results and Driving Range Test Method
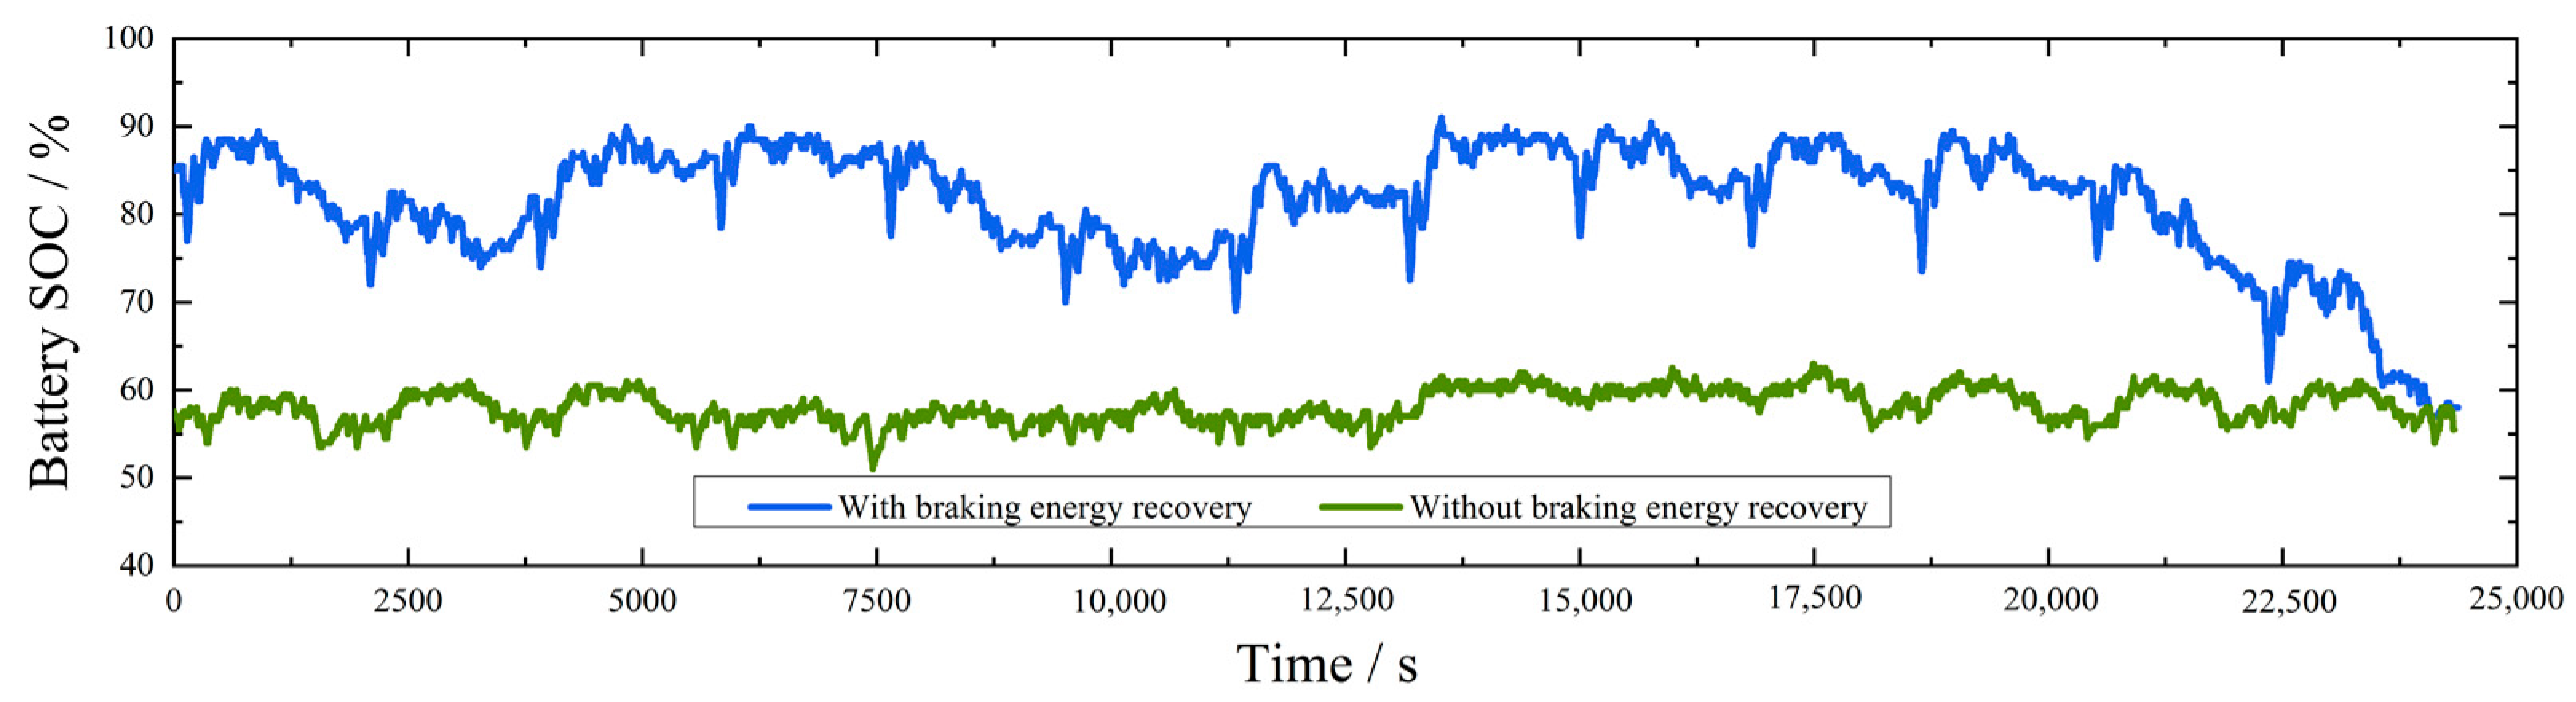
4.3. Energy-Saving Effect of the Braking Energy Recovery Strategy
5. Conclusions
Author Contributions
Funding
Institutional Review Board Statement
Informed Consent Statement
Data Availability Statement
Conflicts of Interest
References
- Mathieu, T.; Kourosh, M.; Asmae, M. Techno-Economics of a New High Throughput Process for Proton Exchange Membranes Manufacturing. World Electr. Veh. J. 2016, 8, 431–442. [Google Scholar]
- Speers, P. Hydrogen Mobility Europe (H2ME): Vehicle and Hydrogen Refuelling Station Deployment Results. World Electr. Veh. J. 2018, 9, 2. [Google Scholar] [CrossRef] [Green Version]
- Zhou, S.; Jin, J.; Wei, Y. A Driving Cycle for a Fuel Cell Logistics Vehicle on a Fixed Route: Case of the Guangdong Province. World Electr. Veh. J. 2021, 12, 5. [Google Scholar] [CrossRef]
- Hong, J.; Wang, Z.; Chen, W.; Wang, L.; Lin, P.; Qu, C. Online Accurate State of Health Estimation for Battery Systems on Real-World Electric Vehicles with Variable Driving Conditions Considered. J. Clean. Prod. 2021, 294, 125814. [Google Scholar] [CrossRef]
- Hong, J.; Wang, Z.; Yao, Y. Fault prognosis of battery system based on accurate voltage abnormity prognosis using long short-term memory neural networks. Appl. Energy 2019, 251, 113381. [Google Scholar] [CrossRef]
- Han, J.; Dongsuk, K.; Youngjin, P. Sensitivity analysis for assessing robustness of position- based predictive energy management strategy for fuel cell hybrid electric vehicle. World Electr. Veh. J. 2015, 7, 330–341. [Google Scholar] [CrossRef] [Green Version]
- Andaloro, L.; Micari, S.; Napoli, G.; Polimeni, A.; Antonucci, V. A Hybrid Electric Fuel Cell Minibus: Drive Test. World Electr. Veh. J. 2016, 8, 131–138. [Google Scholar] [CrossRef] [Green Version]
- Kim, N.; Moawad, A.; Vijayagopal, R.; Rousseau, A. Impact of Fuel Cell and Storage System Improvement on Fuel Consumption and Cost. World Electr. Veh. J. 2016, 8, 305–314. [Google Scholar] [CrossRef] [Green Version]
- Cullen, D.A.; Neyerlin, K.C.; Ahluwalia, R.K.; Mukundan, R.; More, K.L.; Borup, R.L.; Weber, A.Z.; Myers, D.J.; Kusoglu, A. New roads and challenges for fuel cells in heavy-duty transportation. Nat. Energy 2021, 6, 462–474. [Google Scholar] [CrossRef]
- Pei, P.; Chen, D.; Wu, Z.; Ren, P. Nonlinear methods for evaluating and online predicting the lifetime of fuel cells. Appl. Energy 2019, 254, 113730. [Google Scholar] [CrossRef]
- Szałek, A.; Pielecha, I.; Cieslik, W. Fuel Cell Electric Vehicle (FCEV) Energy Flow Analysis in Real Driving Conditions (RDC). Energies 2021, 14, 5018. [Google Scholar] [CrossRef]
- Pielecha, I.; Cieślik, W.; Szałek, A. The use of electric drive in urban driving conditions using a hydrogen powered vehicle-Toyota Mirai. Combust. Engines 2018, 57, 51–58. [Google Scholar] [CrossRef]
- Maodong, F.; Mingjie, C.; Qingchun, L.; Zhenhua, J. Hydrogen Consumption Measurement Research Platform for Fuel Cell Vehicles. In Proceedings of the International Conference on Electrical and Control Engineering, Wuhan, China, 25–27 June 2010; IEEE: Piscataway, NJ, USA, 2010; pp. 1142–1145. [Google Scholar]
- Ahluwalia, R.K.; Wang, X.; Rousseau, A.; Kumar, R. Fuel economy of hydrogen fuel cell vehicles. J. Power Sources 2004, 130, 192–201. [Google Scholar] [CrossRef]
- Offer, G.J.; Contestabile, M.; Howey, D.A.; Clague, R.; Brandon, N.P. Techno-economic and behavioural analysis of battery electric, hydrogen fuel cell and hybrid vehicles in a future sustainable road transport system in the UK. Energy Policy 2011, 39, 1939–1950. [Google Scholar] [CrossRef] [Green Version]
- Lai, X.; Ling, L.; Liang, W.; Wang, B. Test Platform Development for Fuel Cell Vehicle’s Hydrogen Management System. TELKOMNIKA Indones. J. Electr. Eng. 2012, 10. [Google Scholar] [CrossRef]
- Tian, Y.; Zhang, Y.F.; Jin, Z.H.; Wang, K.L.; Nie, S.F.; Lu, Q.C. Development of Hydrogen Consumption Test Platform for Fuel Cell Vehicles. Adv. Mater. Res. 2013, 602–604, 1031–1035. [Google Scholar] [CrossRef]
- Guo, T. Research on the Measurement Method of Fuel Cell Vehicle Driving Range. Power Technol. 2021, 45, 848–850+931. [Google Scholar]
- Lim, J.-S.; Lee, H.-W.; Hong, Y.-S.; Lee, K.-B.; Yong, G.-J.; Kwon, H.-B. Development on Fuel Economy Test Method for Hydrogen Fuel Cell Vehicles. Trans. Korean Hydrog. New Energy Soc. 2010, 21, 207–213. [Google Scholar]
- Hou, Y.; Zhuang, M.; Wan, G. A study on a semi-empirical dynamic model for hydrogen consumption of a fuel cell engine. Automot. Eng. 2007, 29, 942–945. [Google Scholar]
- Pino, F.J.; Marcos, D.; Bordons, C.; Rosa, F. Car air-conditioning considerations on hydrogen consumption in fuel cell and driving limitations. Int. J. Hydrog. 2015, 40, 11696–11703. [Google Scholar] [CrossRef]
- Hou, Y.; Shen, C.; Hao, D.; Liu, Y.; Wang, H. A dynamic model for hydrogen consumption of fuel cell stacks considering the effects of hydrogen purge operation. Renew. Energy 2014, 62, 672–678. [Google Scholar] [CrossRef]
- Montero-Sousa, J.A.; Aláiz-Moretón, H.; Quintián, H.; González-Ayuso, T.; Novais, P.; Calvo-Rolle, J.L. Hydrogen consumption prediction of a fuel cell based system with a hybrid intelligent approach. Energy 2020, 205, 117986. [Google Scholar] [CrossRef]
- Li, Y.; Pei, P.; Wu, Z.; Ren, P.; Jia, X.; Chen, D.; Huang, S. Approaches to avoid flooding in association with pressure drop in proton exchange membrane fuel cells. Appl. Energy 2018, 224, 42–51. [Google Scholar] [CrossRef]
- Chen, D.; Pan, L.; Pei, P.; Huang, S.; Ren, P.; Song, X. Carbon-coated oxygen vacancies-rich Co3O4 nanoarrays grow on nickel foam as efficient bifunctional electrocatalysts for rechargeable zinc-air batteries. Energy 2021, 224, 120142. [Google Scholar] [CrossRef]
- Duan, Z.; Zhang, L.; Feng, L.; Yu, S.; Jiang, Z.; Xu, X.; Hong, J. Research on Economic and Operating Characteristics of Fuel Cell Cars Based on Real Vehicle Tests. Energies 2021, 14, 7856. [Google Scholar] [CrossRef]

| Test Vehicle Model | Hydrogen Storage Pressure | Hydrogen Storage Volume | Hydrogen Storage | Driving Range (NEDC) | Fuel Cell Power (kW) |
|---|---|---|---|---|---|
| Test vehicle A | 70 Mpa | 122.4 L | 5.0 kg/599.8 MJ | 650 km | 114 |
| Test vehicle B | 70 Mpa | 156.6 L | 6.33 kg/759.3 MJ | 800 km | 95 |
| Model | Loading Convention | Coefficient A | Coefficient B | Coefficient C | |
|---|---|---|---|---|---|
| Test vehicle A | DYNO | 1930 kg | 8.50 N | 0 N/(km/h) | 0.05770 N/(km/h)2 |
| Test vehicle B | ROAD | 2030.3 kg | 156.85 N | 1.3640 N/(km/h) | 0.03630 N/(km/h)2 |
| DYNO | 2030.3 kg | −30.46 N | 1.7424 N/(km/h) | 0.03290 N/(km/h)2 | |
| Cycles | Cycle Mileage (km) | Actual Hydrogen Consumption (g) | Actual Hydrogen Consumption per Hundred Kilometers (kg/100 km) | Relative Difference Rate % |
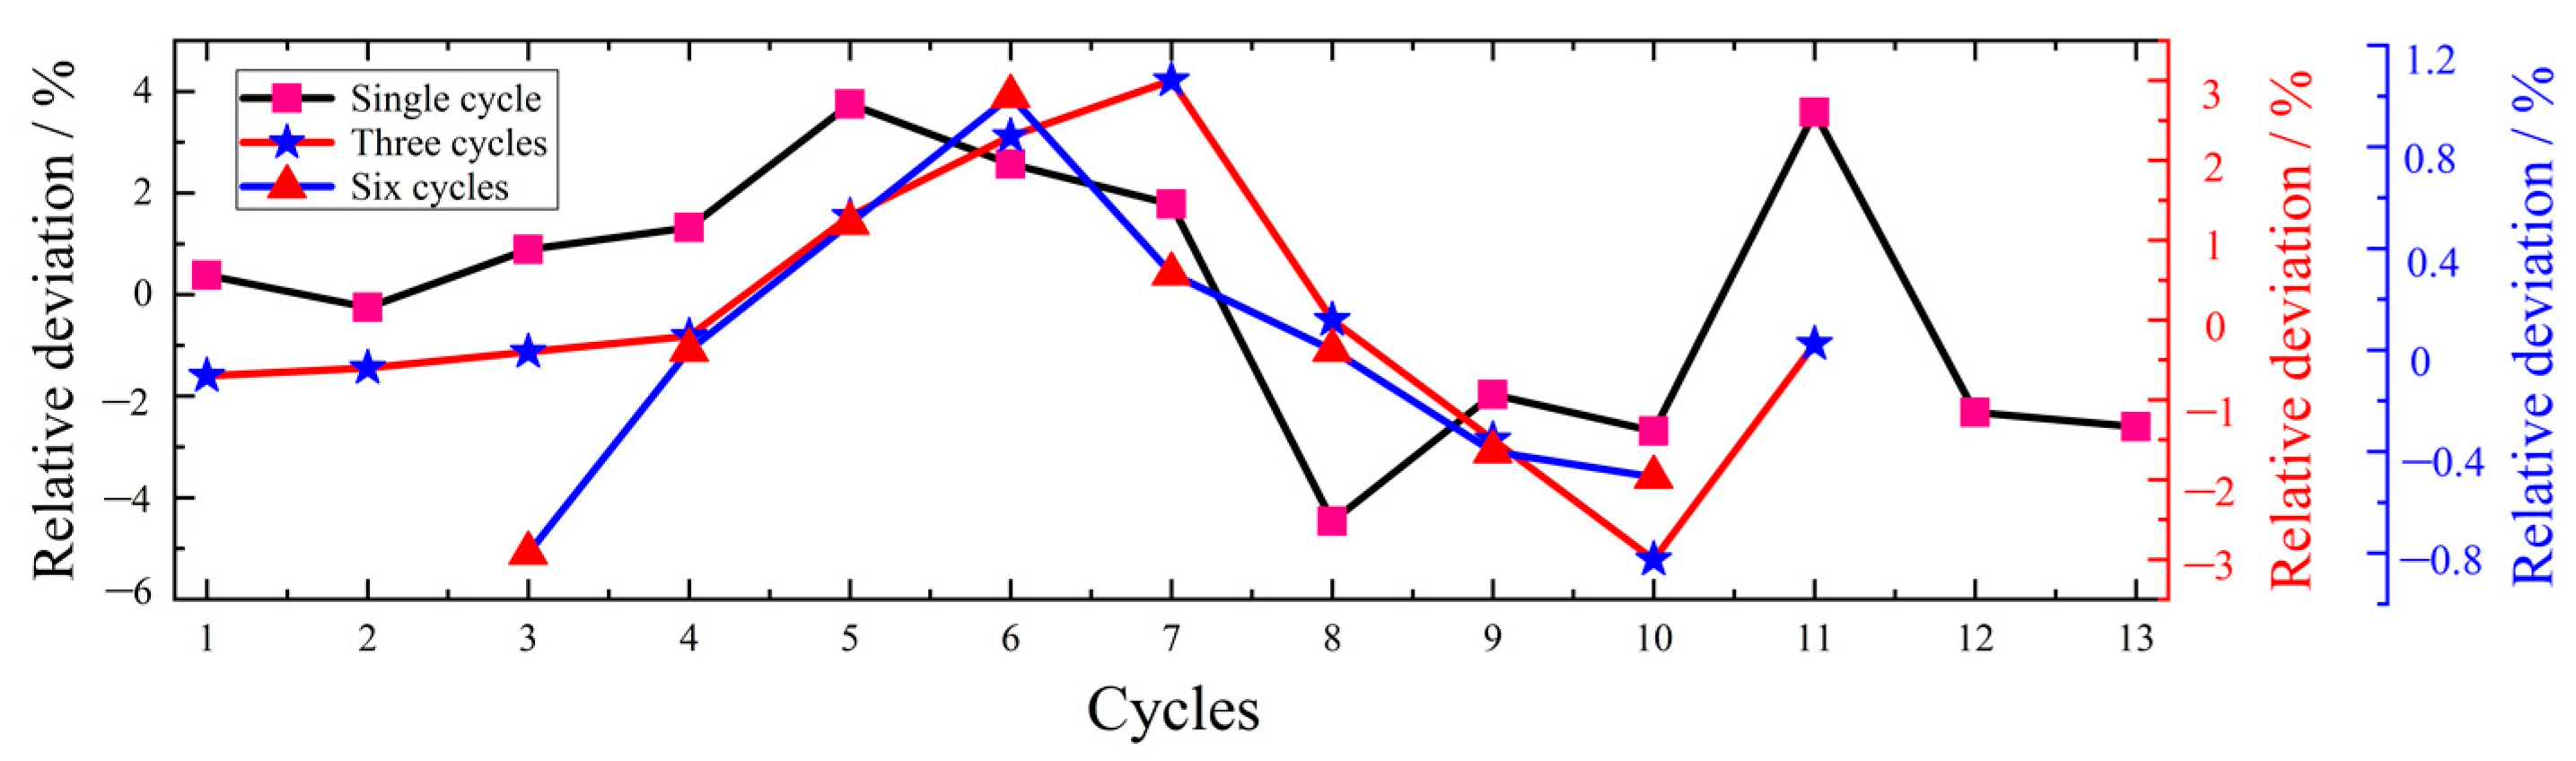
| 1 | 14.6 | 141.7 | 0.9702 | 0.38 |
| 2 | 14.4 | 140.8 | 0.9775 | −0.25 |
| 3 | 14.5 | 142.4 | 0.9819 | 0.89 |
| 4 | 14.5 | 143.0 | 0.9860 | 1.32 |
| 5 | 14.4 | 146.4 | 1.0167 | 3.75 |
| 6 | 14.6 | 144.7 | 0.9911 | 2.57 |
| 7 | 14.3 | 143.6 | 1.0042 | 1.78 |
| 8 | 14.4 | 134.8 | 0.9361 | −4.46 |
| 9 | 14.4 | 138.3 | 0.9604 | −1.97 |
| 10 | 14.4 | 137.3 | 0.9535 | −2.69 |
| 11 | 14.4 | 146.2 | 1.0146 | 3.59 |
| 12 | 14.4 | 137.8 | 0.9569 | −2.32 |
| 13 | 14.4 | 137.5 | 0.9545 | −2.60 |
| Average value | 14.4 | 141.1 | 0.9772 | —— |
| Cycles | Cycle Mileage (km) | Actual Hydrogen Consumption (g) | Actual Hydrogen Consumption per Hundred Kilometers (kg/100 km) | Relative Difference Rate % |
| 1~3 | 43.5 | 423.1 | 0.973 | −0.7 |
| 2~4 | 43.4 | 422.5 | 0.974 | −0.6 |
| 3~5 | 43.4 | 423.1 | 0.975 | −0.4 |
| 4~6 | 43.5 | 424.9 | 0.977 | −0.2 |
| 5~7 | 43.3 | 429.6 | 0.992 | 1.3 |
| 6~8 | 43.3 | 433.5 | 1.001 | 2.3 |
| 7~9 | 43.1 | 434.7 | 1.009 | 3.0 |
| 8~10 | 43.2 | 423.1 | 0.979 | 0.0 |
| 9~11 | 43.2 | 416.7 | 0.965 | −1.5 |
| 10~12 | 43.2 | 410.4 | 0.950 | −3.0 |
| 11~13 | 43.2 | 421.7 | 0.976 | −0.3 |
| Average value | 43.3 | 423.9 | 0.9791 | —— |
| Cycles | Cycle Mileage (km) | Actual Hydrogen Consumption (g) | Actual Hydrogen Consumption per Hundred Kilometers (kg/100 km) | Relative Difference Rate % |
| 1~6 | 87.0 | 848.0 | 0.9747 | −0.8 |
| 2~7 | 86.7 | 852.1 | 0.9828 | 0.0 |
| 3~8 | 86.7 | 856.6 | 0.9880 | 0.5 |
| 4~9 | 86.6 | 859.6 | 0.9926 | 1.0 |
| 5~10 | 86.5 | 852.7 | 0.9858 | 0.3 |
| 6~11 | 86.5 | 850.2 | 0.9829 | 0.0 |
| 7~12 | 86.3 | 845.1 | 0.9793 | −0.4 |
| 8~13 | 86.4 | 844.8 | 0.9778 | −0.5 |
| Average value | 86.6 | 851.1 | 0.9830 | —— |
| Cycles | Cycle Mileage (km) | Actual Hydrogen Consumption (g) | Actual Hydrogen Consumption per Hundred Kilometers (kg/100 km) | Relative Difference Rate % |
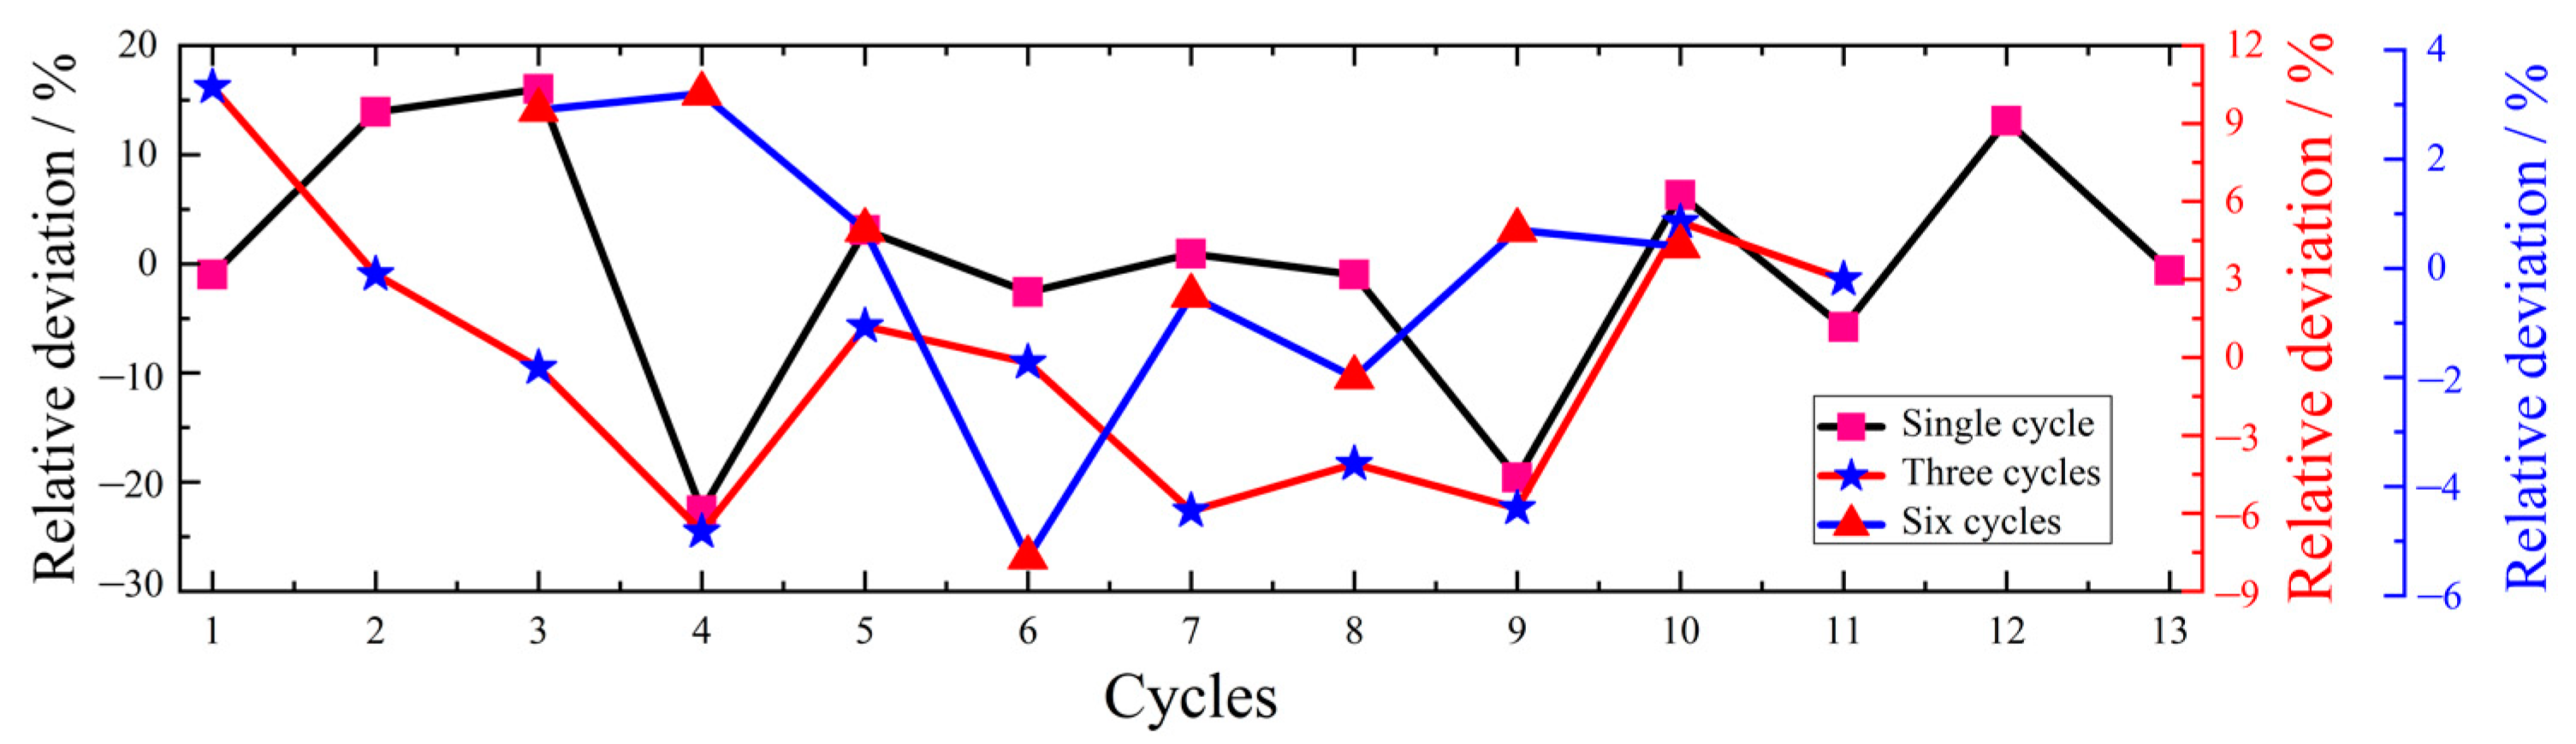
| 1 | 14.5 | 118.8 | 0.8193 | −1.0 |
| 2 | 14.4 | 135.7 | 0.9424 | 13.9 |
| 3 | 14.3 | 137.3 | 0.9601 | 16.0 |
| 4 | 14.3 | 91.6 | 0.6406 | −22.6 |
| 5 | 14.4 | 122.9 | 0.8535 | 3.1 |
| 6 | 14.3 | 115.3 | 0.8063 | −2.6 |
| 7 | 14.5 | 121.1 | 0.8352 | 0.9 |
| 8 | 14.4 | 118.0 | 0.8194 | −1.0 |
| 9 | 14.4 | 95.8 | 0.6653 | −19.6 |
| 10 | 14.2 | 124.8 | 0.8796 | 6.3 |
| 11 | 14.5 | 113.0 | 0.7793 | −5.8 |
| 12 | 14.5 | 135.7 | 0.9359 | 13.1 |
| 13 | 14.2 | 116.8 | 0.8225 | −0.6 |
| Average value | 14.2 | 119.0 | 0.8277 | —— |
| Cycles | Cycle Mileage (km) | Actual Hydrogen Consumption (g) | Actual Hydrogen Consumption per Hundred Kilometers (kg/100 km) | Relative Difference Rate % |
| 1~3 | 43.2 | 391.8 | 0.907 | 10.4 |
| 2~4 | 43.0 | 364.6 | 0.848 | 3.2 |
| 3~5 | 43.0 | 351.8 | 0.818 | −0.4 |
| 4~6 | 43.0 | 329.8 | 0.767 | −6.7 |
| 5~7 | 43.2 | 359.3 | 0.832 | 1.2 |
| 6~8 | 43.2 | 354.4 | 0.820 | −0.2 |
| 7~9 | 43.3 | 334.9 | 0.773 | −5.9 |
| 8~10 | 43.0 | 338.7 | 0.788 | −4.1 |
| 9~11 | 43.1 | 333.7 | 0.774 | −5.8 |
| 10~12 | 43.2 | 373.6 | 0.865 | 5.2 |
| 11~13 | 43.2 | 365.5 | 0.846 | 3.0 |
| Average value | 43.1 | 354.4 | 0.8217 | —— |
| Cycles | Cycle Mileage (km) | Actual Hydrogen Consumption (g) | Actual Hydrogen Consumption per Hundred Kilometers (kg/100 km) | Relative Difference Rate % |
| 1~6 | 86.2 | 721.6 | 0.8371 | 2.9 |
| 2~7 | 86.2 | 723.9 | 0.8398 | 3.2 |
| 3~8 | 86.2 | 706.2 | 0.8193 | 0.7 |
| 4~9 | 86.3 | 664.7 | 0.7702 | −5.3 |
| 5~10 | 86.2 | 698.0 | 0.8097 | −0.5 |
| 6~11 | 86.3 | 688.1 | 0.7973 | −2.0 |
| 7~12 | 86.5 | 708.5 | 0.8191 | 0.7 |
| 8~13 | 86.2 | 704.2 | 0.8169 | 0.4 |
| Average value | 86.3 | 701.9 | 0.8137 | —— |
| Serial Number | Cycle Condition | Hydrogen Consumption (g) | Vehicle Mileage (km) | Hydrogen Consumption per Hundred Kilometers (kg/100 km) | Driving Range (Calculated Value) (km) | Difference Rate % |
|---|---|---|---|---|---|---|
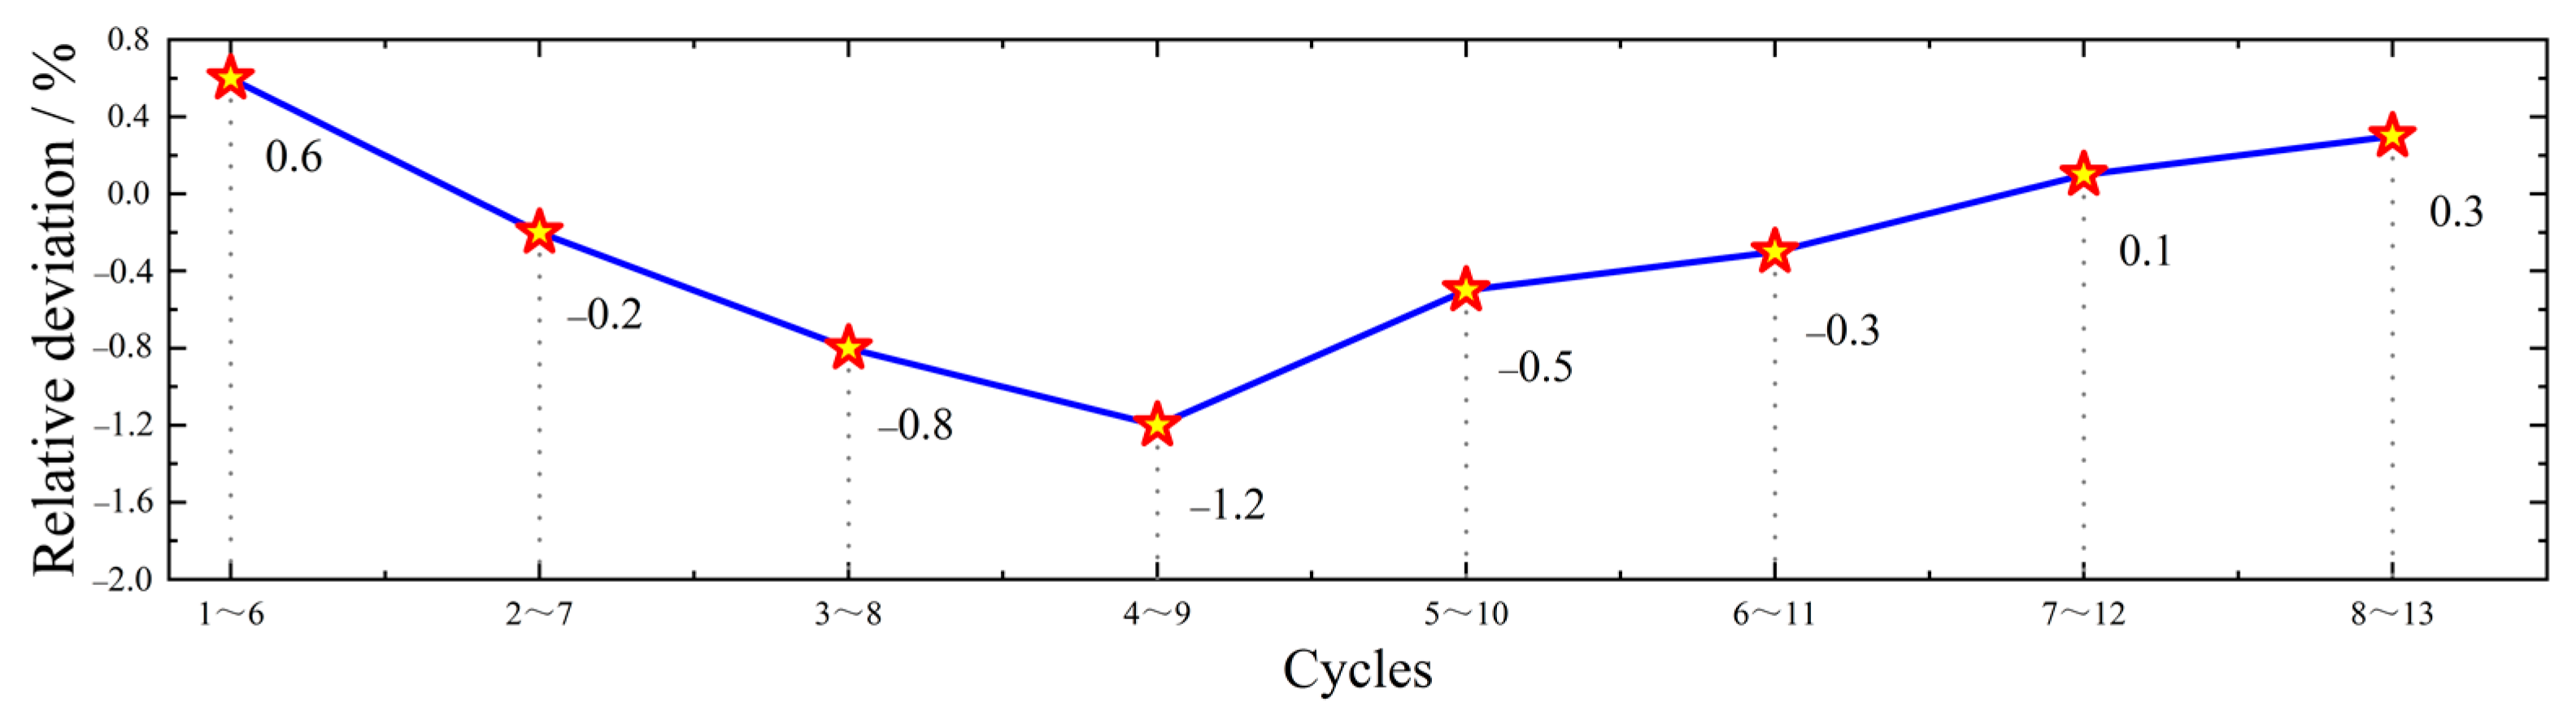
| 1 | 1~6 | 848.0 | 87.0 | 0.975 | 513 | 0.6 |
| 2 | 2~7 | 852.1 | 86.7 | 0.983 | 509 | −0.2 |
| 3 | 3~8 | 856.6 | 86.7 | 0.988 | 506 | −0.8 |
| 4 | 4~9 | 859.6 | 86.6 | 0.993 | 504 | −1.2 |
| 5 | 5~10 | 852.7 | 86.5 | 0.986 | 507 | −0.5 |
| 6 | 6~11 | 850.2 | 86.5 | 0.983 | 509 | −0.3 |
| 7 | 7~12 | 845.1 | 86.3 | 0.979 | 511 | 0.1 |
| 8 | 8~13 | 844.8 | 86.4 | 0.978 | 511 | 0.3 |
| Serial Number | Cycle Condition | Hydrogen Consumption (g) | Vehicle Mileage (km) | Hydrogen Consumption per Hundred Kilometers (kg/100 km) | Driving Range (Calculated Value) (km) | Difference Rate % |
|---|---|---|---|---|---|---|
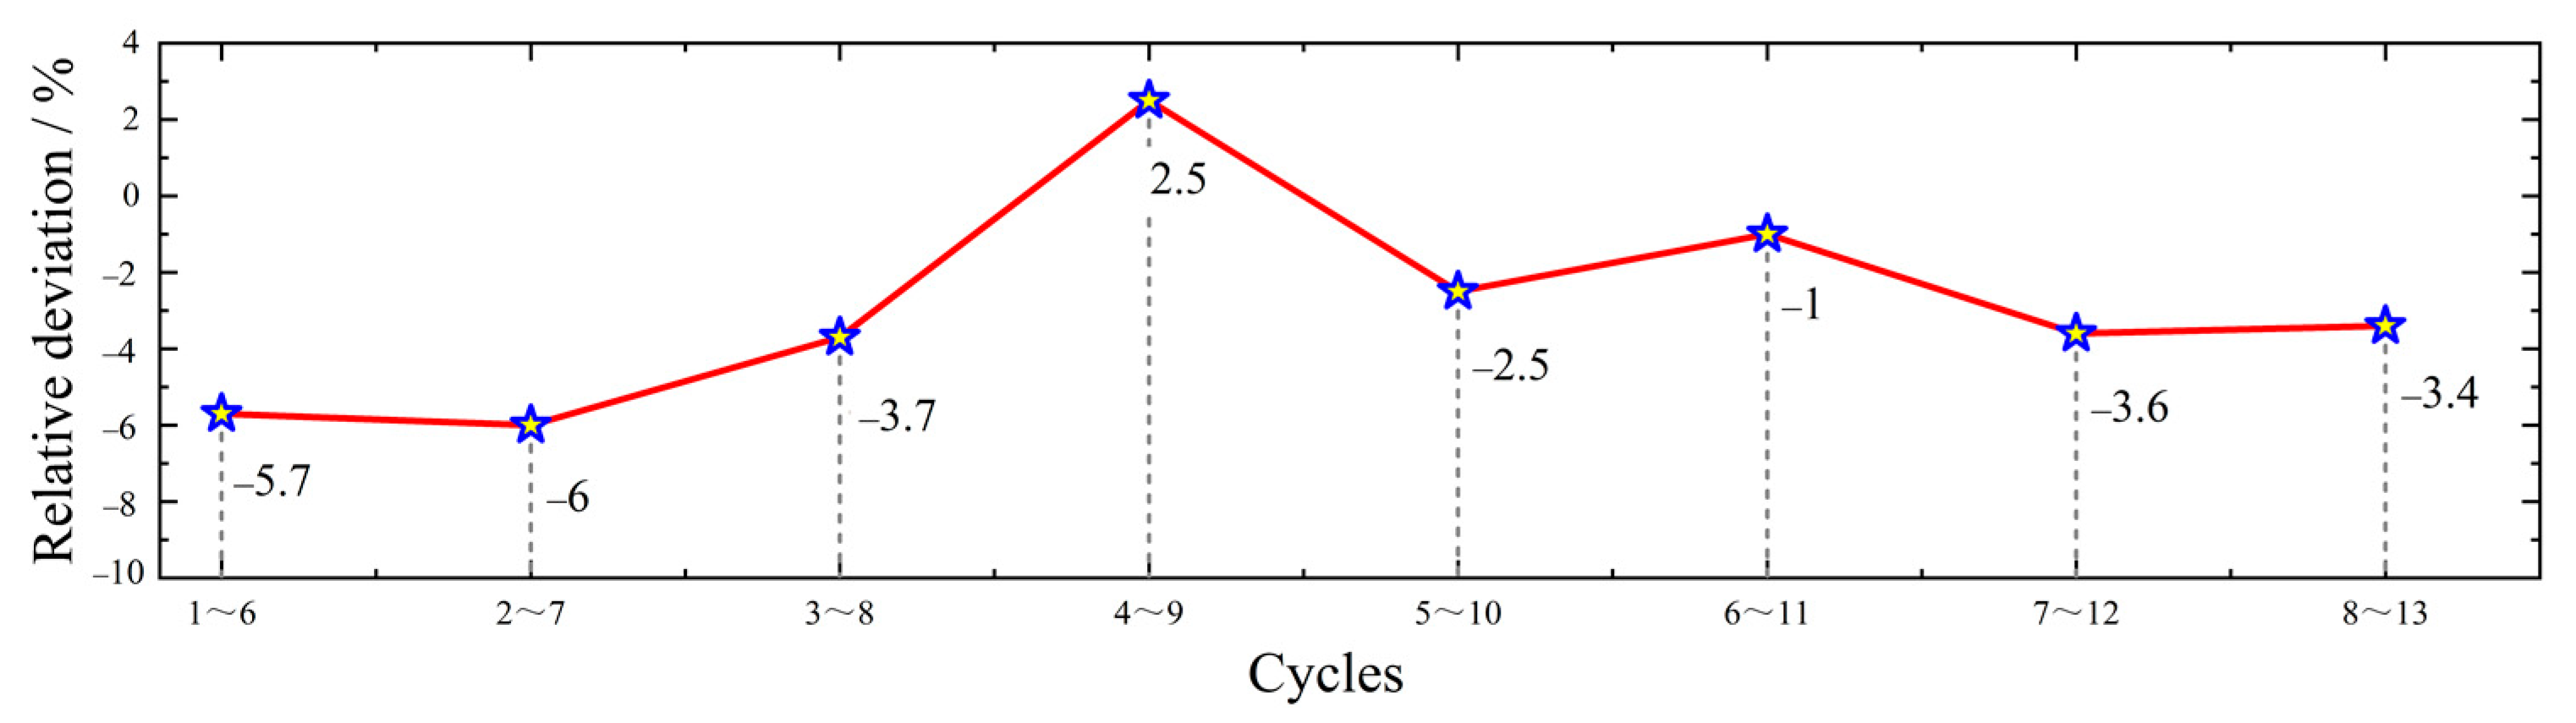
| 1 | 1~6 | 721.6 | 86.2 | 0.837 | 756 | −5.7 |
| 2 | 2~7 | 723.9 | 86.2 | 0.840 | 754 | −6.0 |
| 3 | 3~8 | 706.2 | 86.2 | 0.819 | 773 | −3.7 |
| 4 | 4~9 | 664.7 | 86.3 | 0.770 | 822 | 2.5 |
| 5 | 5~10 | 698.0 | 86.2 | 0.810 | 782 | −2.5 |
| 6 | 6~11 | 688.1 | 86.3 | 0.797 | 794 | −1.0 |
| 7 | 7~12 | 708.5 | 86.5 | 0.819 | 773 | −3.6 |
| 8 | 8~13 | 704.2 | 86.2 | 0.817 | 775 | −3.4 |
| Main Parameters | With Braking Energy Recovery | Without Braking Energy Recovery |
|---|---|---|
| Initial driving range | 612.4 km | 476.6 km |
| Final driving range | 463.3 km | 287.8 km |
| Battery SOC | 57% | 51% |
Publisher’s Note: MDPI stays neutral with regard to jurisdictional claims in published maps and institutional affiliations. |
© 2021 by the authors. Licensee MDPI, Basel, Switzerland. This article is an open access article distributed under the terms and conditions of the Creative Commons Attribution (CC BY) license (https://creativecommons.org/licenses/by/4.0/).
Share and Cite
Duan, Z.; Mei, N.; Feng, L.; Yu, S.; Jiang, Z.; Chen, D.; Xu, X.; Hong, J. Research on Hydrogen Consumption and Driving Range of Hydrogen Fuel Cell Vehicle under the CLTC-P Condition. World Electr. Veh. J. 2022, 13, 9. https://doi.org/10.3390/wevj13010009
Duan Z, Mei N, Feng L, Yu S, Jiang Z, Chen D, Xu X, Hong J. Research on Hydrogen Consumption and Driving Range of Hydrogen Fuel Cell Vehicle under the CLTC-P Condition. World Electric Vehicle Journal. 2022; 13(1):9. https://doi.org/10.3390/wevj13010009
Chicago/Turabian StyleDuan, Zhijie, Nan Mei, Lili Feng, Shuguang Yu, Zengyou Jiang, Dongfang Chen, Xiaoming Xu, and Jichao Hong. 2022. "Research on Hydrogen Consumption and Driving Range of Hydrogen Fuel Cell Vehicle under the CLTC-P Condition" World Electric Vehicle Journal 13, no. 1: 9. https://doi.org/10.3390/wevj13010009
APA StyleDuan, Z., Mei, N., Feng, L., Yu, S., Jiang, Z., Chen, D., Xu, X., & Hong, J. (2022). Research on Hydrogen Consumption and Driving Range of Hydrogen Fuel Cell Vehicle under the CLTC-P Condition. World Electric Vehicle Journal, 13(1), 9. https://doi.org/10.3390/wevj13010009