Abstract
In electrified vehicle applications, understanding the battery characteristics is of great importance as it is the state-of-art principal energy source. The key battery parameters can be identified by one of the robust and nondestructive characterization techniques, such as electrochemical impedance spectroscopy (EIS). However, relaxing the battery cell before performing the EIS method is crucial for the characterization results to be standardized. In this study, the three most common and commercially available lithium-ion technologies (NMC/graphite, LFP/graphite, NCA/LTO) are investigated at 15–45 °C temperature, in the range of 20–80% state of charge (SoC) and in fresh and aged state of health (SoH) conditions. The analysis shows that the duration of the relaxation time before impedance measurement has an impact on the battery’s nonlinear behavior. A rest time of 2 h can be proposed, irrespective of battery health condition, considering neutral technology-based impedance measurement. An impedance growth in ohmic and charge transfer characteristics was found, due to aging, and the effect of rest periods was also analyzed from an electrochemical standpoint. This experimental data was fitted to develop an empirical model, which can predict the nonlinear dynamics of lithium technologies with a 4–8% relative error for longer rest time.
1. Introduction
Lithium-ion batteries (LiBs) as the preferred energy storage system are becoming more popular in stationary, transport, and consumer electronics products. Now, globally, the highest number of projects are running on electrochemical storage with more than 3 GW of installed capacity [1]. Besides, Navigant expects around 14 GW grid-scale battery capacity by 2023 among which Li-ion has the largest share [2]. However, different lithium chemistries are still facing key constraints in terms of performance, cost, and reliability to expand the application range in both stationary and transport applications. Thus, the understanding of battery behavior is of great importance to improve battery performance and its continuous development. Electrochemical impedance spectroscopy (EIS) is an elegant nondestructive technology with which to characterize LiBs and a wide variety of electrochemical systems [3].
Lithium-based batteries are a classic example of electrochemical systems that follow rocking chair methodology during the charge and discharge process [3]. EIS has been regularly used for lithium batteries on a multiscale level from material characterization [4] to battery cell aging [5,6,7,8] and multilevel from half-cell electrode [9,10,11] to battery full cell state of function estimations, i.e., state of charge (SoC), state of health (SoH) [12,13] and battery modeling [14,15]. The impedance measurement has a direct output on battery power capabilities which is a key performance-limiting factor in automotive applications [16,17]. The lithium intercalation/de-intercalation phenomena inside a battery cell during charge/discharge is a complicated electrochemical process that defines the power output by considering key factors such as electrolyte conductivity, solid electrolyte interface (SEI) growth, charge transfer between electrolyte and electrode, etc., [18]. EIS can provide insight into all these internal affairs separately by excitation through current/voltage signal amplitude on the frequency domain [19]. The frequency spectrum can be analyzed by simulating it with simple equivalent circuit models (ECM) which is a common approach for extracting the battery impedance contributions. The level of complexity may vary by choosing many circuit elements and cell constructions.
Moreover, regardless of parameter extraction, estimation/modeling (SoC, SoH) or aging (capacity, impedance fade), very little effort has been made to consider the relaxation impact on impedance measurements. EIS is quite a sensitive tool, and the applied voltage amplitude could receive a misleading spectrum if the cell is not in the equilibrium state. Besides, cell aging, ambient temperature, and SoC are other considerable parameters on relaxation duration that result in the different voltage plateaus affecting battery impedance directly [19]. When the current load is terminated then the double-layer capacitance, concentration gradients disturbance, and SoC local equalization occur, along with the withdrawal of the polarization effect [20]. These effects are also dependent on the battery state functions and ambient parameters, along with the different characteristics of commercially available lithium technologies. Researchers have investigated the effects of current load interruption from minutes to hours before impedance spectroscopy (IS) to reach equilibrium states, irrespective of battery condition [12,13] [21,22,23,24,25]. However, no clear explanation is given to standardizing the rest period and its impact on measurement output. Barai et al. [26] investigated different types of cell impedance results at fixed SoC and temperature by neglecting the ohmic resistance change due to a lack of operational involvement. Based on their experiments, a 4 h rest time is suggested so that the resistances and capacitance fall within the range of experimental error. Frank et al. [22] improved the consideration by considering a wider range of temperatures and SoCs and proposed a mind model. Still, the impact of aging on impedance parameters is neglected which seriously downgrades battery performance over time as ohmic resistance growth takes control [6]. In [27], the authors considered IS on detailed SoC range and temperature, including different aging states, to show the experimental results. However, the rest period effect was analyzed again at certain SoC and temperatures, not explaining the effect corresponding to the electrochemical perspective. In this research work, the authors have tried to fill the gaps in the literature. The novelty of the work can be stated below.
- Both high energy and high-power battery chemistries are considered along with the different aging (pristine and aged) states. To the best of the authors’ knowledge, such studies on the most common technologies have not been performed before. Moreover, investigation of aged cells is also a rare study that has been included in this work. All the batteries that are aged, used similar cycling conditions for more than 2 years. Impedance measurements are done following an in-house developed methodology for another 6 months.
- Variable (low to high) temperatures and SoC ranges are considered for the study of the impedance change, covering a wide range of experimental conditions.
- From no relaxation to ten different rest periods (up to 5 h) are employed.
- The relaxation impact on the ohmic impedance is modeled and a standard technology-neutral rest time is proposed that is a unique approach to avoid individual technology-specific study.
Hence, the study would draw attention to the research community working in battery material characterization, energy storage device characterization that can improve the material development process, impedance characterization technique, and fitting modeling methods.
In the next sections of this paper, impedance spectroscopy theory is briefly discussed in Section 2, referring to the rest time impact. The cells aging history, IS experimental setup, and methodology is explained in Section 3 with the necessary published materials. Section 4 includes extracted battery parameters from the frequency spectrum and relaxation effect analysis from the perspective of electrochemical phenomena. Finally, Section 5 validates the investigation with the empirical fitting results and in Section 6, key findings and prospective future work are outlined.
2. Electrochemical Impedance Spectroscopy
2.1. Battery Impedance (Theory)
Li-ion cells are characterized at the beginning of life (BoL) with a certain open circuit voltage behavior, capacity during charge and discharge, and impedance, which define the performance in terms of energy and power at a certain temperature and C-rate. These characteristics are highly affected by aging (calendar/cycling), temperature, and loading profiles (charging/discharging) which can deviate significantly from the nominal values.
The internal impedance of the Li-ion cells is defined as the opposition to the current flow, arising from the material composition and their interactions. It is categorized as ionic, the electrical and interfacial resistances which, respectively, arise from the electrolyte conductivity, the ion mobility, and the area of the electrodes, then the resistivity of the active materials, the current collectors, the tabs, the electrolyte, and their interaction, between the electrolyte and the electrodes to the current collectors and the conductive additives. Electrical resistance occurs quite fast at a current passage and can be seen in the range of kHz, whereas ionic and interfacial occur more slowly, typically in the range of a hundred to mHz.
This total impedance is responsible for driving the operating terminal voltage of the battery cells away from the open circuit voltage (OCV), by generating overpotentials at fast and slow instances. As for the former, ohmic resistance within the electrolyte, the electrodes, tabs, and their interfaces, varies with the material properties and is responsible for the fast overpotential in the range of milliseconds and it is not dependent on the current rate or the relaxation time. The charge transfer resistance within the medium is also generated and at the same time, a double-layer capacitance will be created at the solid and the liquid interface. With certain anode materials, the SEI formation will contribute to a certain resistance value. On the other hand, slower time constant phenomena, such as the concentration polarization, create a diffusion resistance which can be seen in the liquid and on the electrodes. All these resistances deviate the operating voltage from the OCV and degrade the performance of the battery cells. These resistances are influenced by temperature, current (amplitude and duration), and aging, which in turn define the performance of the cells over their lifetime.
When the current is removed from the battery cells, in the first instance, the ohmic, the charge transfer, and the discharge of the double-layer capacitor are responsible for the overpotential, while the diffusion of the ions and their redistribution within the electrolyte generate the diffusion overpotential until the concentration reaches equilibrium. The effect of the relaxation time on different time instances on the resistance values will be assessed in this work by the EIS method.
2.2. EIS Experimental Method
The EIS generates the impedance spectrum over a wide frequency range, typically from kHz to mHz. The Potentiostat method is applied here as the changes occurring in the battery energy storage system are not as fast as in other electrochemical systems. The aforementioned impedance can be seen within this frequency range, at various SoCs and conditions, as shown in Figure 1.
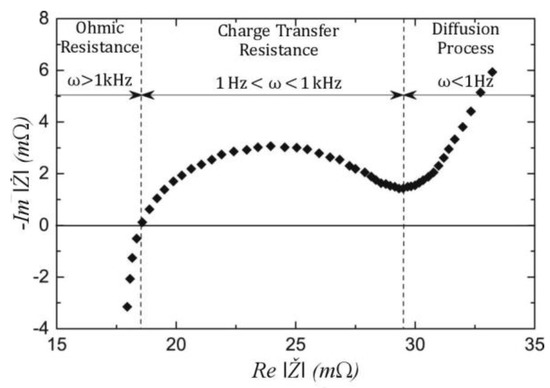
Figure 1.
EIS impedance spectrum of a Li-ion cell (reproduced from ref [28]).
Electrical (ohmic) resistance is obtained at the intersection of the real to the imaginary axis, whereas the semicircle is associated with the SEI, the double-layer capacitance, and the charge transfer resistance. In this case, the SEI has a larger impact, another semicircle will be created at higher frequencies, which represents the SEI. At the lowest frequencies, usually below 1 mHz, the concentration resistance can be obtained due to the diffusion in the liquid and the solids. The general form to obtain the impedance at any frequency is:
Here, Ž is the impedance value in the function of potential E and current I. Equation (1) is represented as a complex number where φ is the phase difference due to the absolute value of the impedance |Z|. Further on, the absolute value can be divided into the real and imaginary parts and create the Nyquist plot illustrated in Figure 1.
2.3. EIS Modeling
In the literature, different modeling methods [29] can be found which include theoretical quantitative models (white box), qualitative models with experiments (black box), and experimental quantitative models. White box modeling is more related to solving differential equations, conducting temperature, and aging-related behavior to extract parameters such as electrolyte conductivity, porosity, etc. Black-box modeling is based on purely mathematical models. The models simulate the electrical behavior without any information on the physical properties of the battery. If the correct model is assumed with the correct order, the equivalent circuits can be a quantitative model. There is a high probability that the model can be over-or under-modeled. To obtain a model with an optimal reproduction of the cell characteristics, the basic structure of a battery must be known. In experimental qualitative models, the approach starts from modeling the cell from symmetric cells, then half cells, slowly moving towards full cell models. This approach is followed by different groups, one such example is odd random phase electrochemical impedance spectroscopy ORP-EIS [30]. Another approach is to determine the equivalent circuit using the DRT or density function of the distribution of relaxation times [31]. This method helps in identifying the number of RC circuits in the measured impedance spectrum. In this work, the black box modeling method is used, which has been employed a great deal in literature. This is quite a popular method while quantifying the aging of lithium-ion batteries and developing EIS-based aging models even though all physical phenomena are not considered. The advantages of this method are simplicity and reproducibility.
Moreover, several model types exist to characterize the generated impedance spectrum shown in Figure 1. Typically, the ECM approach is adopted, where electrical parameters describe the overall impedance. To do so, resistors and either capacitor or constant phase elements can be used in various topologies based on the Randles’ equivalent circuit [32] to resemble the electrochemical reactions and the corresponding impedance of the battery cells in the frequency domain. In [33], the authors studied LFP power loss by proposing a temperature-dependent model with three constant phase element (CPE) parallel branches with a series connected to the Warburg element to capture and analyze the fast and slow time constants. As stated in [34], the Warburg element is a special case of CPE, when the diffusion angle is seen in the Nyquist plot equals 45°, which is also found in this work and adopted.
3. Experimental Study
For this study, the three most common Li-ion technologies were used to identify the optimal no-load period before EIS characterization. All these pouch-shaped cells are manufactured by EIG and commercially available. Table 1 states the basic battery specifications provided by the manufacturer. On the other hand, Figure 2 shows the battery performance comparison which are the main indicators towards designing a battery pack.

Table 1.
Battery cells specifications.
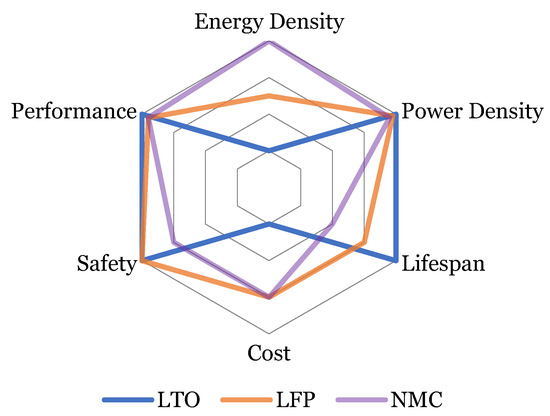
Figure 2.
Comparison of the different investigated cell aspects.
All the batteries that were investigated, were aged through lifetime tests, and thus had different states of health (SoH). The aging conditions were selected carefully to ensure result compatibility. Table 2 lists the cycling degradation conditions, such as depth of discharge (DoD) cycling, temperature, charge−discharge rates, etc. The performed aging tests were part of the investigation from the IWT-BATTLE project [35] where the batteries were aged by a more than 2-year long test campaign [36]. The degradation trend for these aged batteries (Figure 3) was chemistry dependent at 45 °C temperature and performed various full equivalent cycle numbers (FECs). A full equivalent cycle is considered to be the amount of one full charge ampere-hour throughput, based on the nominal current.
Table 2.
Cell aging inventory.
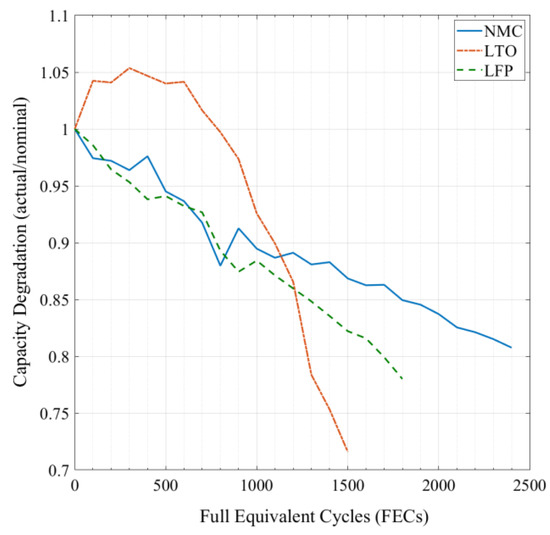
Figure 3.
Capacity degradation of aged cells under similar test conditions.
Before starting the EIS characterization investigation, all the cells were characterized to identify the current battery SoH. The characterization was done at room temperature, which included two capacity tests with a standard C/3 and C/5 charge−discharge rate, respectively, a pulse power test at different states of charge (SoCs), and a quasi-open circuit voltage (qOCV) test with C/30 rate. The C-rate refers to the cell datasheet nominal current value provided by the manufacturer.
The electrochemical impedance spectroscopy test on characterized cells was conducted with Biologic’s MPG-205 device. The equipment can perform EIS measurement in the frequency range from 10 μHz to 20 kHz and each of the eight channels can provide a maximum of 5 A to charge−discharge the battery cell. All the test temperatures were ensured by a controlled temperature environment using climate chambers. Figure 4 graphically represents the measurement procedure performed for more than 6 months. The impedance tests were done, and the results were processed, using the commercially available Biologic’s EC-lab software yielding a fitting error of less than 3% that is considered acceptable.
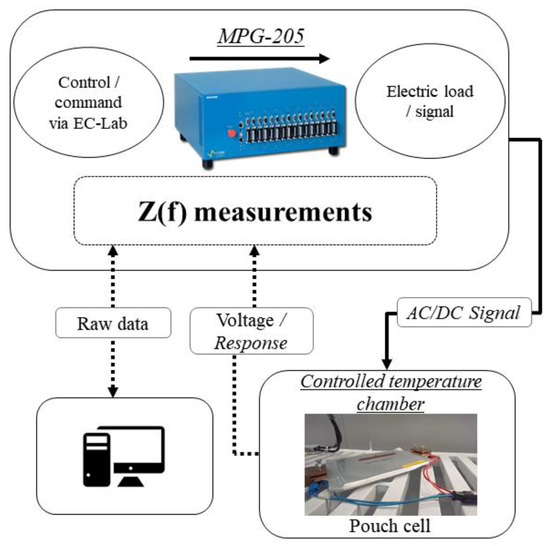
Figure 4.
EIS measurement flowchart of this research.
The variation of the parameters. such as the state of health, state of charge, temperature, relaxation time along with cell chemistry and capacity, were studied to achieve the purpose of this research. The whole test procedure, which was followed, can be explained as the following steps.
Step 1. The battery cell was fully charged with a constant-current constant-voltage (CCCV) process with a C/5 rate considering the actual C/5 capacity value of the cell. A rest period of 30 min was imposed to stabilize ion movement.
Step 2. The cell was discharged to specific SoC points (80%, 50%, 20%) taking actual capacity into account.
Step 3. Ten different relaxation times ranging from 1 min to 5 h, were ensured after reaching every SoC before doing a Potentiostatic EIS measurement. The voltage amplitude was kept at 4.3 mV to avoid distortion by imposing an AC signal in the range of 10 kHz to 5 mHz frequency.
Step 4. The measurement was done for three different temperature values of 15 °C, 25 °C, and 45 °C, which correspond to the typical battery operating condition temperatures.
The reason for choosing these temperatures and three SoCs was to minimize the aging impact during testing with stressful conditions at high/low temperatures and SoC levels. The cells were re-tested at 25 °C to check the capacity variation after the completion of tests at various temperatures and there was not much difference found in the capacity values obtained at the beginning of the test compared to the final validation results.
4. Results and Discussion
4.1. Equivalent Circuit Selection and Test Conditions
The Nyquist plot for a lithium-ion battery generally consists of two semicircles which represent the cathode and anode. The anode semicircle is seen at higher frequencies whereas the cathode semicircle is seen at middle frequencies. These semicircles are generally dependent on the charge transfer reactions occurring at the anode and cathode, considering the electrode material (uniform coating/mixture, morphology) and surface characteristics (potential distribution, roughness, etc.) [37]. At higher frequencies, an inductive behavior is seen, which is due to the connection cables used to connect the cells to the tester. In contrast, at the lower frequencies, one can observe a tail that can be a straight line as well which represents the diffusion process at the anode and cathode in the lithium-ion battery. Normally an equivalent circuit is chosen to fit the impedance spectra to extract the parameters. The circuit is selected based on simplicity with a better representation of the internal parameters of the battery and ease to use in battery management systems [38]. As mentioned before, the two semicircles are expected to represent the anode and cathode, but this is not what is observed in commercial cells, the impedances of anode and cathode electrodes are not distinguished clearly. This could be attributed to the chemical effects occurring at almost the same time-constants on both the electrodes [39]. Only one semicircle is found in most of the SoC levels and temperatures, except at certain low-temperature conditions when coupled with low SoC levels. Hence, the semicircle is considered to represent the charge transfer processes occurring at electrode−electrolyte interphase [29]. In both the Randles’ circuits in Figure 5, L1 represents the inductance that comes from the cables and connections to the cell. R0 represents the ohmic resistance (R0) which is the value obtained from the point where the impedance spectra cut the real axis in the Nyquist plot and it is the only parameter that can be obtained directly from the impedance spectrum. It represents the conductivity of the electrolyte therefore the resistance offered for lithium-ion transport as well as the intrinsic resistance, including the contact resistance and the resistance within the active materials [40,41]. R1 (only in the bottom circuit) represents charge transfer resistance (Rct) for the processes occurring on both the anode and cathode electrodes, similarly it is a combination of Li+ dissolution and resistance to the Li+ traveling through the SEI and into the active material, Q1 represents the capacitances of the anode and cathode electrodes. The capacitance is modeled through a CPE with a dispersion constant (the semicircle is modeled by a CPE as its center-point is not on the X-axis of the impedance spectrum [42]). Q represents the Warburg impedance which is the impedance at lower frequencies related to mass transport modeled through CPE as the slope is not 45° [43].
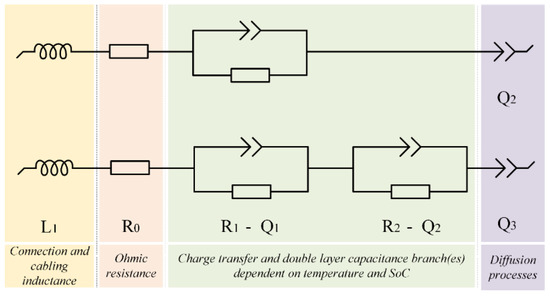
Figure 5.
The chosen circuits for modeling the impedance behavior.
The bottom circuit was used at lower SoC levels (<20% SoC) at 15 °C because there was a two-semicircle formation. A similar approach of using a different equivalent circuit for low-temperature conditions has been recorded in [9]. Even though the resistances and capacitances were split (for anode and cathode charge transfer resistance processes) to represent both the semicircles, the values were very small; hence when the parameters were plotted, a single value for resistance and capacitance representing both the electrodes was obtained by summing up the values. In [29] it was proven that one RC circuit was the best to simulate charge transfer resistances for different factors, such as state of charge, state of health, and temperature, and an additional RC circuit could represent the range of diffusion processes. Here in this research, RQ circuits were used instead of RC circuits. Such an approach to fitting has already been mentioned in different works of literature [21,43]. To fit the spectrum using the chosen circuit, a fitting method of simplex and randomize was applied together.
Figure 6 shows an example of the observed impedance curve at different relaxation times for the new NMC cell at 15 °C for 50% SoC. From the graph, one can see that the ohmic resistance (R0) variation with time was minimal and that of charge transfer resistance (Rct) was more significant, comparatively. When two semicircles were obtained at low temperature/SoC conditions, the values extracted were very small, thus, when the parameters were plotted, a single value for resistance, and capacitance representing the sum of R1 and R2 values.
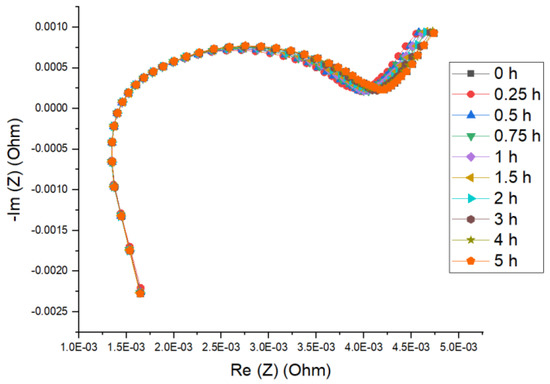
Figure 6.
Nyquist plot for fresh NMC cell at various relaxation times (50% SoC at 15 °C).
4.2. Impedance Measurement of NMC Cells
Figure 7 shows the extracted values of ohmic resistances through the equivalent circuit model for new and aged NMC cells respectively at various temperatures and SoCs. The key difference found between both cells was the scale at which the resistances were observed for new and aged cells. The new cell ohmic resistances were in the range of 1.27 to 1.46 mΩ at different conditions (SoC, temperature, and relaxation time) whereas, for aged cells, the ranges were 3.03 to 3.9 mΩ.
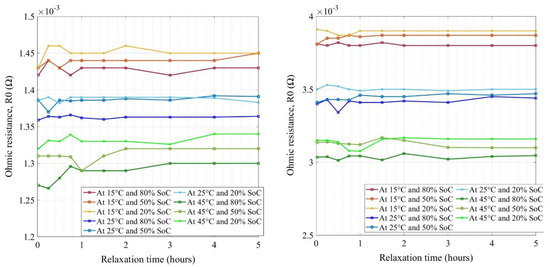
Figure 7.
Ohmic resistances for new (left) and aged (right) NMC cells.
Therefore, this is a clear indication that the electrolyte has degraded (loss of conductivity) in the aged cells, which is the key contributor of impedance increase while aging towards the end of life (EoL) [11]. There were no indications of other parasitic reactions as the evolution of resistances with an increase in relaxation time showed good agreement with no significant increase or decrease in values [44]. Lower temperature and lower SoC seemed to have high resistance values, where the reason for this behavior could be due to the increase of the electrolyte conductivity and ion kinetics at a higher temperature and vice versa at a lower temperature [45]. In Figure 7, the grouping was quite narrow for different temperatures and SoCs whereas it was spread for the aged cell. The impedance values did not evolve after 1 h of relaxation time and stabilized quite well after 2 h of rest for both the cells. Further, the cells’ impedance did not decay or evolve much after 2 h of relaxation.
Figure 8 presents the extracted values of charge transfer resistance (Rct) for new and aged cells at various conditions. The Y-axis of the figures is not the same in both figures. Rct represents the resistance offered to the lithium-ion solvation on the electrodes (anode and cathode) and its migration through the SEI layer on the anode [46,47,48,49,50,51]. The striking difference observed between both new and aged cells was the growth scale at which the resistances increased in impedance values by factors of 2 to 2.5 times, due to aging. The new cell’s charge transfer resistances were in the range of 0.1 to 3.3 mΩ at different conditions (SoC, temperature, and relaxation time) whereas, for aged cells, the ranges were 0.48 to 7.5 mΩ. Therefore, this was an indication that the electrode surface had changed (in composition or thickness) which was mostly attributed to the SEI layer increase on the anode and the concentration gradients at the electrode−electrolyte interfaces [52]. There was an evolution of resistances with an increase in relaxation time seen in the figure at lower temperatures and low SoCs. The values did not evolve with an increase in relaxation time after 1 h and settle down well after 2 h rest for both the cells except at lower temperatures where the impedance values were still increasing. Further studies in terms of increasing relaxation times to more than 5 h are necessary to analyze the relaxation phenomenon at lower temperatures (lower than 15 °C).
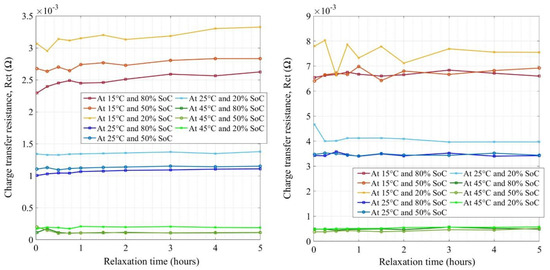
Figure 8.
The charge transfer resistances for new (left) and aged (right) NMC cells.
Finally, the impedance curves for new and aged NMC cells at different temperatures and SoCs after 2 h of relaxation are shown in Figure 9 (note the scales). From this comparison, one can observe that the two semicircles in aged cells converged to one at 20% SoC with an increase in temperature. One other key aspect is how the values or semicircles came closer together at high temperatures and moved away at lower temperatures which may refer to the higher and clearer impedance values at 15 °C.
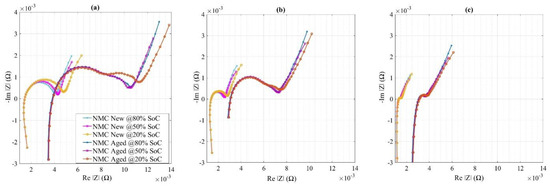
Figure 9.
Nyquist plots for new and aged NMC cells at (a) 15 °C, (b) 25 °C, and (c) 45 °C.
4.3. Impedance Measurement of LTO Cells
The ohmic resistances for new and aged LTO cells are shown in Figure 10. It should be noted the Y-axis is not the same in both figures. For this specific cell type, R0 values seemed to increase by increasing SoC but staying in the range of 1.15–1.6 mΩ. At the BoL stage, lower ohmic contribution at 15 °C compared to other temperatures was found to be smaller than the other temperatures which was surprising and may require further investigation; however, in general, the temperature and the SoC dependency were unclear. While aging, ohmic resistances showed similar dependency and the values increased by a maximum of 18%. Lower impedance values of LTO cells may have referred to no SEI growth on the anode surface [53] which was the opposite for the NMC cells, comparatively. Irrespective of the SoH, LTO cells supported a rest period of 2 h after which the noise in the ohmic resistance values fluctuated within a considerable limit. However, the R0 values at 45 °C kept rising with a slow steepness, which may have happened due to the excitation of ion-kinetics at the higher temperature. Hence, the impact of the relaxation period, in this case, needs to be investigated further with longer rest periods.
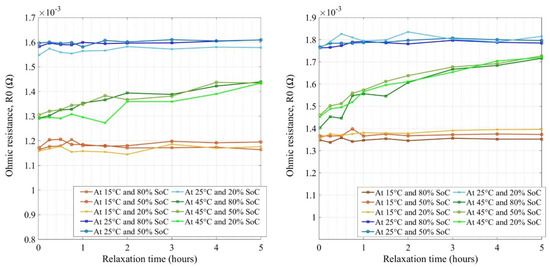
Figure 10.
Ohmic resistances for new (left) and aged (right) LTO cells.
Figure 11 (note the scales) compares the charge transfer resistance (Rct) for the new and old LTO cells. Here, once again, no clear temperature dependency was observed. The plotted curves clearly showed the difference of charge transfer values in terms of SoC, especially at 20% storage SoC. This may have been caused by higher ion-exchange resistance in the reference anode surface [54]. The aged LTO cells showed varying charge transfer impedance by rest period which became stable after 2 h of relaxation except the values at 45 °C. The impedance values also increased by up to 23%, compared to the BoL stage due to aging.
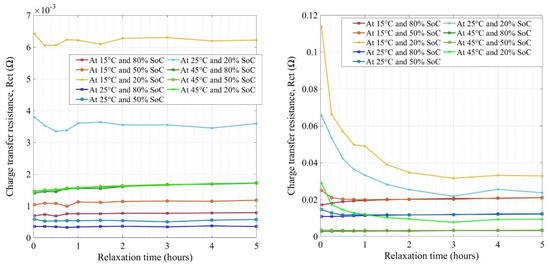
Figure 11.
Charge transfer resistance for new (left) and aged (right) LTO cells.
Finally, the Nyquist curves for new and aged LTO cells are shown in Figure 12, based on 2 h of relaxation and at low to high temperatures. In Figure 12, the semicircles were squeezed towards the low temperatures especially in the aged samples, meaning that the EoL charge transfer resistance showed temperature dependency. Both at BoL and EoL, the LTO cells showed no tendency of changing ohmic resistance significantly. In general, the investigated LTO cells showed higher charge transfer resistance variation towards low SoC and at low temperature.
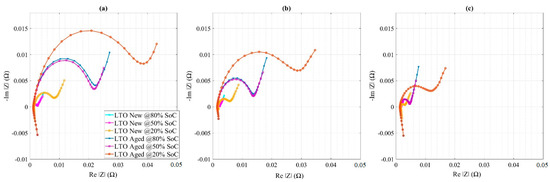
Figure 12.
Nyquist plots for new and aged LTO cells at (a) 15 °C, (b) 25 °C, and (c) 45 °C.
4.4. Impedance Measurement of LFP Cells
The new and aged LFP cells’ ohmic resistances are illustrated in Figure 13. It should be noted that the Y-axis is not the same in both figures. The values ranged from 2.45 mΩ to 2.85 mΩ at BoL, between which at room temperature the impedances were found to be the best, comparatively, while for the aged condition, the LFP cell impedances increased in the range of 2.6 mΩ to 3.3 mΩ. Although the ohmic part of the resistances at BoL showed no significant SoC dependency [31], only the temperature influence was clear. While at EoL, R0 values showed SoC influence as well as the temperature effect. By aging, the impedance values became separated further from each other by SoC and the values increased at low temperatures. This means that at low temperatures, due to electrolyte decomposition and SEI growth in the anode graphite surface, the ohmic impedance growth develops further [33]. In [54], the authors have also elucidated lithium plating as one of the main aging contributors on the anode, where the effects were observable compared to the new cell. While aging, the R0 values increase by a maximum of 33% for 25 °C and 11% for 15 °C, however, no significant change was observed for 45 °C. Further investigation at 45 °C and/or better modeling methodology may verify the LFP characteristics at high temperatures. New and aged LFP cells show steady ohmic resistance irrespective of the relaxation period. However, a 2 h rest period could be considered, as sustainable impedance growth could be observed after that.
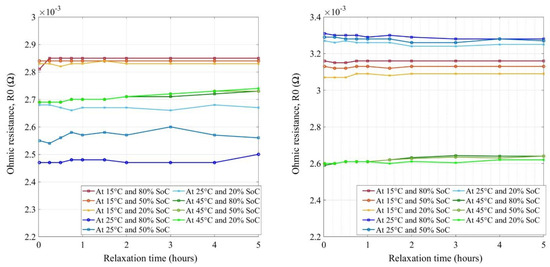
Figure 13.
Ohmic resistances for new (left) and aged (right) LFP cells.
The charge transfer resistance (Rct) is shown in Figure 14 (note the scales) for new and aged LFP cells. The cells show SoC dependency at BoL charge transfer resistance, while during aging, SoC dependency becomes clearer. At both BoL and EoL, high-temperature impedances were lower referring to higher kinetics in Li-ion transfer at 45 °C. Charge transfer resistances increased by decreasing temperature and decreasing SoC, which was very similar to the NMC cells, proving that the graphite anode was the key contributor. SEI growth on the anode surface during aging may have further increased the impedance values which were in the range of 0.33 mΩ to 5 mΩ. The relaxation in impedance measurement showed no significant influence on the Rct measurement, irrespective of SoH, however, a 2 h rest time should be considered again as the optimal period where a stable impedance value can be expected.
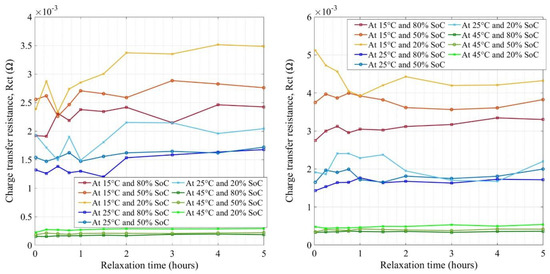
Figure 14.
Charge transfer resistance for new (left) and aged (right) LFP cells.
The temperature-dependent Nyquist plots with a 2 h rest period are depicted in Figure 15 where the curves showed similar behavior at high temperatures and were expanded by decreasing temperature. At lower temperatures, two semicircles could be seen but they remained very close to each other, both for new and aged cells. The separated semicircles in LFP at low temperature may refer to the additional processes happening in the LFP, which is considered by selecting two RQ circuits in modeling.
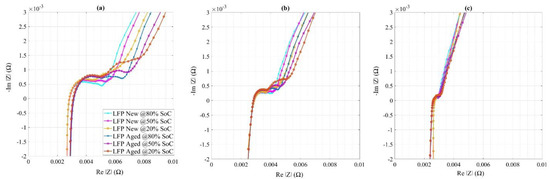
Figure 15.
Nyquist plots for new and aged LFP cells at (a) 15 °C, (b) 25 °C, and (c) 45 °C.
5. Model Development and Validation
5.1. Fitting Polynomial Model
To predict the impedance for different relaxation times, a simple fitting model was developed in this research. For this, the ohmic resistance of the investigated cell chemistries at room temperature was fitted with a second-order polynomial equation using Matlab Curve Fitting Toolbox. The reason behind selecting ohmic contribution was due to the clear impedance growth during aging, while fitting the charge transfer resistance was a challenging task, considering the different battery technologies and temperature-dependent ambiguous values. The equations can be expressed as follows.
Ohmic resistance, R0 (t, SoC) = a × t2 + b × t + g × (SoC)
In Equation (2), t is the relaxation time; a, b and g are the fixed coefficients recorded in Table 3 for low, medium, and high SoC. The proposed fitted empirical model would be able to estimate the ohmic resistance for different rest times before performing EIS characterization. Unfortunately, no clear trend of the charge transfer resistances at different SoC was found due to the random distribution of the values of different lithium technologies.
Table 3.
Fitting coefficient of Equation (2).
5.2. Validation
To validate the model, the same three new (partially aged due to calendar) Li-ion cells belong to each cell technology, were characterized at 25 °C with short to longer rest periods before impedance spectroscopy in the range of 1 to 20 h. The same test procedure was followed, as explained in Section 3. The extracted ohmic contributions modeled by a single RQ circuit showed in Figure 5, were then compared with a simple empirical fitting model.
The EIS measurement considering short to longer rest times shown in Figure 16 had a good agreement with the model output. When compared, NMC showed the best-fitted results with a maximum of 4% relative error to the measured impedance. LTO and LFP results had a moderate fit with 6% and 8% relative error, respectively. The higher fitting error for LTO and LFP technologies may refer to the selection of fitting equations in this case. Further improvement can be achieved if the nonlinearity of distorted data can be modeled in these two technologies. Modeling of the charge transfer contribution and validation with longer rest periods at different temperatures would also make the model robust, reducing the limitations. However, this model can be used to identify the rest period impact on the impedance change for the studied lithium batteries at room temperature and can be used as a useful tool to characterize the battery cells of common Lithium technologies.
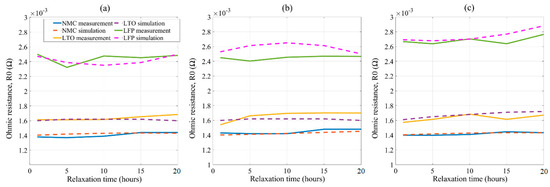
Figure 16.
Validation results of ohmic contributions at (a) 80% SoC, (b) 50% SoC, and (c) 20% SoC.
5.3. Limitations and Potential Study
The research work of investigating the relaxation impact on the most common battery technologies’ impedance measurement includes a lot of experimental work to cover short to long rest periods. However, more technologies and a wider range of rest times could be studied to understand the effect. All the performed experiments do not provide a complete insight into the understanding of the actual conditions of the electrodes inside the cell but provide guidance to employ impedance measurement. For such information, half-cell characterizations through distributed relaxation time (DRT) will help in the precise interpretation of the impedance spectra which is beyond the scope of this work [55,56] but could be extended in the next study. Further, this study is only limited to the modeling of the ohmic impedance, thus, fitting the charge transfer and diffusion contributions could fulfill the investigation. The measurement sensitivity of commercial cells of other types is another topic that could be covered.
6. Conclusions
In this study, the variation of cell impedance as a function of the relaxation period after removing an electrical load was investigated for NMC, LTO, and LFP Li-ion technologies. The EIS characterization was performed on these commercial cells at new and aged conditions, at different temperatures, and SoCs with varieties of relaxation periods. It has been observed that the pure ohmic resistance change with different relaxation times was not significant, irrespective of the cells’ SoH. However, a clear dependency of impedance parameters on temperature and SoC was found. While aging, NMC experienced the highest impedance growth and LTO, the least. The main reason for this could be attributed to electrolyte degradation in aged cells and the SEI layer increase on the anode [57].
It has also been observed that 2 h relaxation is enough for the cell to stabilize before performing the EIS, except for the LTO at 45 °C where a longer rest period is foreseen to obtain a stable measurement. These tests do not provide complete insight towards understanding the actual conditions of electrodes inside the cell but provide guidance to employ impedance measurement. For such information, half-cell characterizations through distributed relaxation time (DRT) will help in the precise interpretation of the impedance spectra which is beyond the scope of this work [55,56] but could be extended in the next study.
Finally, the ohmic contribution of the investigated technologies was fitted to develop a simple empirical model to estimate impedance parameters at different pause times. Validation results showed that the fitting could provide a good estimation with a maximum of 4%, 6%, and 8% relative error for NMC, LTO, and LFP technologies, respectively. With further investigation at other temperatures and by optimizing ECM selection, obtained errors can be minimized. These results can provide a guideline for impedance characterization for common lithium batteries. Besides, following the battery 2030+ roadmap [58], this model showcases that a chemistry-neutral approach can be achieved by optimizing the model functions in the future.
Author Contributions
Conceptualization, methodology, software, validation, formal analysis, investigation, data curation, writing—original draft preparation, M.S.H.; conceptualization, R.G.; methodology, data curation, T.K.; writing—review and editing, J.J., J.V.M., and M.B.; supervision, M.B. All authors have read and agreed to the published version of the manuscript.
Funding
This research was funded by Vrije Universiteit Brussel.
Data Availability Statement
The data generated in this study cannot be shared.
Acknowledgments
The cells used in this research are acquired from the BATTLE project which was funded by the Flemish Agency for Innovation by Science and Technology Directorate (IWT130019). Further, the authors acknowledge ‘Flanders Make’ for their support to the MOBI research group.
Conflicts of Interest
The authors declare no conflict of interest.
References
- Ahmed, R.; El Sayed, M.; Arasaratnam, I.; Tjong, J.; Habibi, S. Reduced-Order Electrochemical Model Parameters Identification and State of Charge Estimation for Healthy and Aged Li-Ion Batteries—Part II: Aged Battery Model and State of Charge Estimation. IEEE J. Emerg. Sel. Top. Power Electron. 2014, 2, 678–690. [Google Scholar] [CrossRef]
- Andre, D.; Meiler, M.; Steiner, K.; Walz, H.; Soczka-Guth, T.; Sauer, D. Characterization of high-power lithium-ion batteries by electrochemical impedance spectroscopy. II: Modelling. J. Power Sources 2011, 196, 5349–5356. [Google Scholar] [CrossRef]
- Barai, A.; Chouchelamane, G.H.; Guo, Y.; McGordon, A.; Jennings, P. A study on the impact of lithium-ion cell relaxation on electrochemical impedance spectroscopy. J. Power Sources 2015, 280, 74–80. [Google Scholar] [CrossRef]
- Evgenij, B.; Macdonald, J.R. Impedance Spectroscopy: Theory, Experiment, and Applications. Impedance Spectroscopy: Theory, Experiment, and Applications; John Wiley & Sons, Inc.: Hoboken, NJ, USA, 2005. [Google Scholar] [CrossRef]
- BATTLE—IWT SB Project. 2014. Available online: http://etec.vub.ac.be/battle/index.php (accessed on 20 April 2021).
- Berecibar, M.; Gandiaga, I.; Villarreal, I.; Omar, N.; Van Mierlo, J.; van den Bossche, P. Critical review of state of health estimation methods of Li-ion batteries for real applications. Renew. Sustain. Energy Rev. 2016, 56, 572–587. [Google Scholar] [CrossRef]
- Braun, P.V.; Cho, J.; Pikul, J.H.; King, W.P.; Zhang, H. High power rechargeable batteries. Curr. Opin. Solid State Mater. Sci. 2012, 16, 186–198. [Google Scholar] [CrossRef]
- Cho, H.-M.; Choi, W.-S.; Go, J.-Y.; Bae, S.-E.; Shin, H.-C. A study on time-dependent low temperature power performance of a lithium-ion battery. J. Power Sources 2012, 198, 273–280. [Google Scholar] [CrossRef]
- Costard, J.; Ender, M.; Weiss, M.; Ivers-Tiffée, E. Three-Electrode Setups for Lithium-Ion Batteries. J. Electrochem. Soc. 2017, 164, A80–A87. [Google Scholar] [CrossRef]
- Robert, D.; Fichtner, M.; Otuszewski, T.; Punckt, C.; Tarascon, J.; Vegge, T.; Dominko, R.; Edström, K.; Fichtner, M.; Punckt, C. BATTERY 2030+ Roadmap 1. 2020. Available online: https://battery2030.eu/ (accessed on 20 April 2021).
- Samadani, E.; Farhad, S.; Scott, W.; Mastali, M.; Gimenez, L.E.; Fowler, M.; Fraser, R.A. Empirical Modeling of Lithium-ion Batteries Based on Electrochemical Impedance Spectroscopy Tests. Electrochim. Acta 2015, 160, 169–177. [Google Scholar] [CrossRef]
- Ecker, M.; Nieto, N.; Käbitz, S.; Schmalstieg, J.; Blanke, H.; Warnecke, A.; Sauer, D.U. Calendar and cycle life study of Li(NiMnCo)O2-based 18650 lithium-ion batteries. J. Power Sources 2014, 248, 839–851. [Google Scholar] [CrossRef]
- Eddahech, A.; Briat, O.; Bertrand, N.; Delétage, J.-Y.; Vinassa, J.-M. Behavior and state-of-health monitoring of Li-ion batteries using impedance spectroscopy and recurrent neural networks. Int. J. Electr. Power Energy Syst. 2012, 42, 487–494. [Google Scholar] [CrossRef]
- Kindermann, F.M.; Noel, A.; Erhard, S.V.; Jossen, A. Long-term equalization effects in Li-ion batteries due to local state of charge inhomogeneities and their impact on impedance measurements. Electrochim. Acta 2015, 185, 107–116. [Google Scholar] [CrossRef]
- Farmann, A.; Waag, W.; Marongiu, A.; Sauer, D.U. Critical review of on-board capacity estimation techniques for lithium-ion batteries in electric and hybrid electric vehicles. J. Power Sources 2015, 281, 114–130. [Google Scholar] [CrossRef]
- Farmann, A.; Waag, W.; Sauer, D.U. Application-specific electrical characterization of high power batteries with lithium titanate anodes for electric vehicles. Energy 2016, 112, 294–306. [Google Scholar] [CrossRef]
- Fleischer, C.; Waag, W.; Heyn, H.-M.; Sauer, D.U. On-line adaptive battery impedance parameter and state estimation considering physical principles in reduced order equivalent circuit battery models. J. Power Sources 2014, 260, 276–291. [Google Scholar] [CrossRef]
- Fu, R.; Choe, S.-Y.; Agubra, V.; Fergus, J. Development of a physics-based degradation model for lithium ion polymer batteries considering side reactions. J. Power Sources 2015, 278, 506–521. [Google Scholar] [CrossRef]
- Fuller, T.F.; Doyle, M.; Newman, J. Relaxation Phenomena in Lithium-Ion-Insertion Cells. J. Electrochem. Soc. 1994, 141, 982–990. [Google Scholar] [CrossRef]
- Gopalakrishnan, R.; Li, Y.; Smekens, J.; Barhoum, A.; Van Assche, G.; Omar, N.; Van Mierlo, J. Electrochemical impedance spectroscopy characterization and parameterization of lithium nickel manganese cobalt oxide pouch cells: Dependency analysis of temperature and state of charge. Ionics 2018, 25, 111–123. [Google Scholar] [CrossRef]
- Gordon, I.J.; Grugeon, S.; Takenouti, H.; Tribollet, B.; Armand, M.; Davoisne, C.; Débart, A.; Laruelle, S. Electrochemical Impedance Spectroscopy response study of a commercial graphite-based negative electrode for Li-ion batteries as function of the cell state of charge and ageing. Electrochim. Acta 2017, 223, 63–73. [Google Scholar] [CrossRef]
- He, H.; Xiong, R.; Fan, J. Evaluation of Lithium-Ion Battery Equivalent Circuit Models for State of Charge Estimation by an Experimental Approach. Energies 2011, 4, 582–598. [Google Scholar] [CrossRef]
- Hosen, S.; Karimi, D.; Kalogiannis, T.; Pirooz, A.; Jaguemont, J.; Berecibar, M.; Van Mierlo, J. Electro-aging model development of nickel-manganese-cobalt lithium-ion technology validated with light and heavy-duty real-life profiles. J. Energy Storage 2020, 28, 101265. [Google Scholar] [CrossRef]
- Ivers-Tiffée, E.; Weber, A. Evaluation of electrochemical impedance spectra by the distribution of relaxation times. J. Ceram. Soc. Jpn. 2017, 125, 193–201. [Google Scholar] [CrossRef]
- Leng, F.; Tan, C.M.; Pecht, M. Effect of Temperature on the Aging rate of Li Ion Battery Operating above Room Temperature. Sci. Rep. 2015, 5, 12967. [Google Scholar] [CrossRef] [PubMed]
- Ran, L.; Junfeng, W.; Haiying, W.; Gechen, L. Prediction of State of Charge of Lithium-Ion Rechargeable Battery with Electrochemical Impedance Spectroscopy Theory. In Proceedings of the 2010 5th IEEE Conference on Industrial Electronics and Applications, ICIEA, Taichung, Taiwan, 15–17 June 2010. [Google Scholar] [CrossRef]
- Li, S.E.; Wang, B.; Peng, H.; Hu, X. An electrochemistry-based impedance model for lithium-ion batteries. J. Power Sources 2014, 258, 9–18. [Google Scholar] [CrossRef]
- Li, X.; Ahmadi, M.; Collins, L.; Kalinin, S.V. Deconvolving distribution of relaxation times, resistances and inductance from electrochemical impedance spectroscopy via statistical model selection: Exploiting structural-sparsity regularization and data-driven parameter tuning. Electrochim. Acta 2019, 313, 570–583. [Google Scholar] [CrossRef]
- Lohmann, N.; Weßkamp, P.; Haußmann, P.; Melbert, J.; Musch, T. Electrochemical impedance spectroscopy for lithium-ion cells: Test equipment and procedures for aging and fast characterization in time and frequency domain. J. Power Sources 2015, 273, 613–623. [Google Scholar] [CrossRef]
- Luka, Z. Evaluation of Model and Dispersion Parameters and Their Effects on the Formation of Constant-Phase Ele-ments in Equivalent Circuits. J. Electroanal. Chem. 1999, 464, 68–75. [Google Scholar]
- Ma, S.; Jiang, M.; Tao, P.; Song, C.; Wu, J.; Wang, J.; Deng, T.; Shang, W. Temperature effect and thermal impact in lithium-ion batteries: A review. Prog. Nat. Sci. 2018, 28, 653–666. [Google Scholar] [CrossRef]
- Maheshwari, A.; Heck, M.; Santarelli, M. Cycle aging studies of lithium nickel manganese cobalt oxide-based batteries using electrochemical impedance spectroscopy. Electrochim. Acta 2018, 273, 335–348. [Google Scholar] [CrossRef]
- Orazem, M.E.; Tribollet, B. Electrical Circuits. In Electrochemical Impedance Spectroscopy; Wiley: Hoboken, NJ, USA, 2008. [Google Scholar] [CrossRef]
- Momma, T.; Matsunaga, M.; Mukoyama, D.; Osaka, T. Ac impedance analysis of lithium ion battery under temperature control. J. Power Sources 2012, 216, 304–307. [Google Scholar] [CrossRef]
- Murbach, M.D.; Schwartz, D.T. Analysis of Li-Ion Battery Electrochemical Impedance Spectroscopy Data: An Easy-to-Implement Approach for Physics-Based Parameter Estimation Using an Open-Source Tool. J. Electrochem. Soc. 2018, 165, A297–A304. [Google Scholar] [CrossRef]
- Noh, H.-J.; Youn, S.; Yoon, C.S.; Sun, Y.-K. Comparison of the structural and electrochemical properties of layered Li[NixCoyMnz]O2 (x = 1/3, 0.5, 0.6, 0.7, 0.8 and 0.85) cathode material for lithium-ion batteries. J. Power Sources 2013, 233, 121–130. [Google Scholar] [CrossRef]
- Nyman, A.; Zavalis, T.G.; Elger, R.; Behm, M.; Lindbergh, G. Analysis of the Polarization in a Li-Ion Battery Cell by Numerical Simulations. J. Electrochem. Soc. 2010, 157, A1236–A1252. [Google Scholar] [CrossRef]
- Olofsson, Y.; Groot, J.; Katrašnik, T.; Tavčar, G. Impedance Spectroscopy Characterisation of Automotive NMC/Graphite Li-Ion Cells Aged with Realistic PHEV Load Profile Quantification of Cell Properties vs. Temperature at Different Stages of Ageing; IEEE International Electric Vehicle Conference (IEVC): Florence, Italy, 2014. [Google Scholar] [CrossRef]
- Osaka, T.; Mukoyama, D.; Nara, H. Review—Development of Diagnostic Process for Commercially Available Batteries, Especially Lithium Ion Battery, by Electrochemical Impedance Spectroscopy. J. Electrochem. Soc. 2015, 162, A2529–A2537. [Google Scholar] [CrossRef]
- Ovejas, V.J.; Cuadras, A. Impedance Characterization of an LCO-NMC/Graphite Cell: Ohmic Conduction, SEI Transport and Charge-Transfer Phenomenon. Batteries 2018, 4, 43. [Google Scholar] [CrossRef]
- Palacín, M.R. Understanding ageing in Li-ion batteries: A chemical issue. Chem. Soc. Rev. 2018, 47, 4924–4933. [Google Scholar] [CrossRef] [PubMed]
- Petzl, M.; Danzer, M.A. Nondestructive detection, characterization, and quantification of lithium plating in commercial lithium-ion batteries. J. Power Sources 2014, 254, 80–87. [Google Scholar] [CrossRef]
- Paul, R.; Bonomi, D. Growing The Battery Storage Market 2018: Exploring Four Key Issues. Energy Storage World Forum, no. January. 2018. Available online: http://www.egedec.com/sites/default/files/documents/eswf_whitepaper_-_growing_the_battery_storage_market.pdf (accessed on 15 May 2021).
- Schmidt, J.P.; Chrobak, T.; Ender, M.; Illig, J.; Klotz, D.; Ivers-Tiffée, E. Studies on LiFePO4 as cathode material using impedance spectroscopy. J. Power Sources 2011, 196, 5342–5348. [Google Scholar] [CrossRef]
- Schmitt, J.; Maheshwari, A.; Heck, M.; Lux, S.; Vetter, M. Impedance change and capacity fade of lithium nickel manganese cobalt oxide-based batteries during calendar aging. J. Power Sources 2017, 353, 183–194. [Google Scholar] [CrossRef]
- Schweikert, N.; Heinzmann, R.; Eichhöfer, A.; Hahn, H.; Indris, S. Electrochemical impedance spectroscopy of Li4Ti5O12 and LiCoO2 based half-cells and Li4Ti5O12/LiCoO2 cells: Internal interfaces and influence of state-of-charge and cycle number. Solid State Ionics 2012, 226, 15–23. [Google Scholar] [CrossRef]
- Scrosati, B. History of lithium batteries. J. Solid State Electrochem. 2011, 15, 1623–1630. [Google Scholar] [CrossRef]
- Stroe, D.I.; Swierczynski, M.; Stan, A.I.; Knap, V.; Teodorescu, R.; Andreasen, S.J. Diagnosis of Lithium-Ion Batteries State-of-Health Based on Electrochemical Impedance Spectroscopy Technique; IEEE Energy Conversion Congress and Exposition (ECCE): Pittsburgh, PA, USA, 2014; pp. 4576–4582. [Google Scholar]
- De Sutter, L.; Firouz, Y.; De Hoog, J.; Omar, N.; Van Mierlo, J. Battery aging assessment and parametric study of lithium-ion batteries by means of a fractional differential model. Electrochim. Acta 2019, 305, 24–36. [Google Scholar] [CrossRef]
- US DOE Global Energy Storage Database. 2020. Available online: https://www.sandia.gov/ess-ssl/global-energy-storage-database-home/ (accessed on 20 April 2021).
- Vetter, J.; Novák, P.; Wagner, M.; Veit, C.; Möller, K.-C.; Besenhard, J.; Winter, M.; Wohlfahrt-Mehrens, M.; Vogler, C.; Hammouche, A. Ageing mechanisms in lithium-ion batteries. J. Power Sources 2005, 147, 269–281. [Google Scholar] [CrossRef]
- Vyroubal, P.; Kazda, T. Equivalent circuit model parameters extraction for lithium ion batteries using electrochemical impedance spectroscopy. J. Energy Storage 2018, 15, 23–31. [Google Scholar] [CrossRef]
- Waag, W.; Fleischer, C.; Sauer, D.U. Critical review of the methods for monitoring of lithium-ion batteries in electric and hybrid vehicles. J. Power Sources 2014, 258, 321–339. [Google Scholar] [CrossRef]
- Waag, W.; Käbitz, S.; Sauer, D.U. Experimental investigation of the lithium-ion battery impedance characteristic at various conditions and aging states and its influence on the application. Appl. Energy 2013, 102, 885–897. [Google Scholar] [CrossRef]
- Waldmann, T.; Wilka, M.; Kasper, M.; Fleischhammer, M.; Wohlfahrt-Mehrens, M. Temperature dependent ageing mechanisms in Lithium-ion batteries—A Post-Mortem study. J. Power Sources 2014, 262, 129–135. [Google Scholar] [CrossRef]
- Xie, Y.; Li, J.; Yuan, C. Mathematical modeling of the electrochemical impedance spectroscopy in lithium ion battery cycling. Electrochim. Acta 2014, 127, 266–275. [Google Scholar] [CrossRef]
- Zhu, X.; Macía, L.F.; Jaguemont, J.; De Hoog, J.; Nikolian, A.; Omar, N.; Hubin, A. Electrochemical impedance study of commercial LiNi0.80Co0.15Al0.05O2 electrodes as a function of state of charge and aging. Electrochim. Acta 2018, 287, 10–20. [Google Scholar] [CrossRef]
- Zhu, Y.-R.; Xie, Y.; Zhu, R.-S.; Shu, J.; Jiang, L.-J.; Qiao, H.-B.; Yi, T.-F. Kinetic study on LiFePO4-positive electrode material of lithium-ion battery. Ionics 2011, 17, 437–441. [Google Scholar] [CrossRef]
Publisher’s Note: MDPI stays neutral with regard to jurisdictional claims in published maps and institutional affiliations. |
© 2021 by the authors. Licensee MDPI, Basel, Switzerland. This article is an open access article distributed under the terms and conditions of the Creative Commons Attribution (CC BY) license (https://creativecommons.org/licenses/by/4.0/).