Abstract
For identifying new improvement potentials for electric traction motors, accurate models are needed. In this paper, a geometry-based 2D lumped parameter thermal network model for different electric traction motor and cooling concepts is studied and validated. In the second section, the design and functionality of the thermal model is explained. In the third section, the best fit of the literature correlations for describing the different heat transfer mechanisms was identified and a parameter study of the heat transfer coefficients was carried out and discussed. In the last section, the model is validated with measurement results from six different electric traction motors and drives units. For validation measurement results of stationary operating points, peak operating points and drive cycles are used. Based on the validation results, a model error of less than 10% is achieved for the most motor components in the different cooling concepts and traction motor designs. Inaccuracies and deviations are discussed and suggestions for improvement are made.
1. Introduction
For many years, thermal models for electric motors have been used to calculate thermal behavior and lifetime expectancy of electric motors [1]. The growing market of electric powertrains for future passenger vehicles leads to a higher interest in predicting the thermal behavior of these developed electric traction motors. The thermal behavior in high power density electric motors is the main limiting factor for the maximum torque and power of the motor [2,3]. Furthermore, a higher motor efficiency and lower energy consumption can be archived with better cooling systems. This directly affects the range of the electric vehicle and the needed battery capacity, which directly affects the costs of the powertrain/vehicle. Therefore, improved cooling systems are required for many reasons in electric traction motors [4,5,6].
In the early development stages, many new designs are often tested to find an overall improved motor design. For fast early-stage development processes, lumped parameter thermal networks (LPTNs) are recommended because their can deliver fast and accurate results [1]. The quality of these results depends on the electromagnetic and geometric design of the motor and, therefore, on the heat transfer characteristics based on the geometric motor design.
In the previous work, an extensive review on the thermal heat transfer behaviors of electric traction motors was carried out [7]. In this paper, the proposed geometry-based LPTN with the reviewed heat transfer coefficient (HTC) correlations will be validated.
For validating the LPTN and the used HTC models a few different electric motors with different characteristics in their cooling systems are used. The model is validated by measurements of different stationary and peak operating points and drive cycles.
2. Thermal Model for Electric Traction Motors
The LPTN is an often-used approach for calculating the thermal behavior of electrical machines, e.g., electric vehicle traction motors. The concept of LPTNs is well studied and explained in the literature [8,9].
The flexible LPTN is designed in a way that different cooling concepts and combinations of these concepts can be simulated. Table 1 lists the cooling concepts that can be calculated with the model. An overview of the useable HTC correlations for the listed phenomena can be found in the literature [7].

Table 1.
Cooling concepts in the thermal motor model.
Up to four individual cooling concepts can be combined in one concept and simulated at once. The heat transfer coefficient of each cooling concept is calculated by equations from the literature. The empirical convective heat transfer correlations for the different motor parts and cooling concepts are taken from an earlier published paper [1]. The cooling concepts which are not active in a specific motor concept are deactivated by setting the thermal resistance to infinity, that no heat flow passes the node. An example of the LPTN model with an activated rotor shaft cooling is shown (Figure 1).
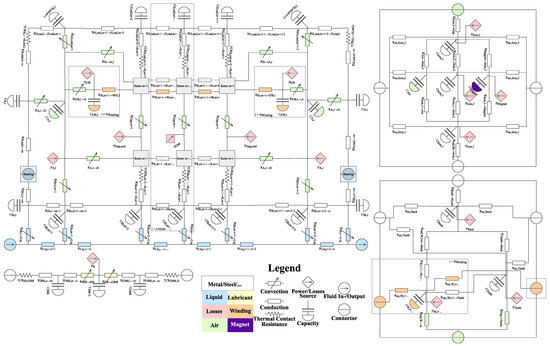
Figure 1.
LPTN model with a direct cooled rotor shaft.
The model does not used a thermo-electromagnetic coupled simulation. The electromagnetic losses were externally calculated by FEA analysis for specific boundary conditions (e.g., motor current, frequency and magnet/copper temperature). The calculated losses were used as inputs for the electromagnetic heat source nodes in the model. The mechanical losses based on the motor geometry and fluid properties (e.g., air gap friction or oil friction losses) are calculated inside the model. The model is developed to simulate and optimize the thermal design of existing and new traction motor configurations (Figure 2).
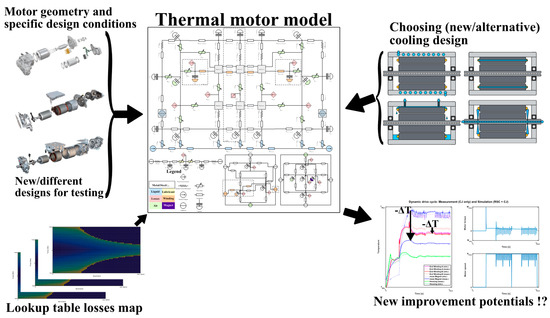
Figure 2.
Optimization process with the thermal model.
3. Validation of the Thermal Model
For optimizing the thermal design of new and existing traction motors the model quality must be sufficiently accurate. The model is designed for different traction motor types of permanent magnet synchronous motors (PMSM) and induction motors (IM) and therefore the accuracy of the model could be limited in some cases, because the LPTN model is developed in the best general approach for different electric motors.
For validating the developed model measurement data from two different electric traction motors were used to compare simulated temperature and measured temperature. In the first step measurement data from stationary operating points of two different machines were used to identify the best HTC set for the thermal model. In the second step a parameter study of the critical HTCs is carried out. In the last section thermal model is compared with measurement data from six different electric traction motors.
3.1. Identification of the Best Heat Transfer Correlation Set
For thermal models of electric machines different HTC formulas from the literature exists. The review of these formulas was done before [1]. In this paper the developed model will be review and tested on different electric traction motors.
For identifying the best HTCs for the thermal model correlations for the different motor parts were chosen from the literature (Table 2).

Table 2.
Number of reviewed HTC correlations from the literature.
The electromagnetic losses for the LPTN were calculated with different FEA tools (JMAG, Chuo-ku, Tokyo, Japan; ANSYS Maxwell, Canonsburg, Pennsylvania, United States of America) for specific material temperatures and phase currents and voltages. The mechanic losses can be calculated by different formulas from the literature [7].
For identifying the best parameter set the minimal sum of all time steps of the gradient weighted temperature differences were used:
This factor was calculated for all motor parts where the temperature was measured. To improve the quality of the results, the factors were determined for several measurements and then averaged. In Table 3, the best HTC correlation sets for the used IMs and PMSMs are shown.

Table 3.
Best fitting HTC correlations.
3.2. Parameter Studies of the Critical Heat Transfer Paths
In this subsection the most important heat transfer paths in these electric traction motors where reviewed by parametric studies. This will help to understand the heat paths through each different traction motor design. This understanding helps to identify potentials for cooling optimization.
Each of the selected HTC is varied from 25% to 200% of its original value (100% = calculated HTC from correlation for the specific operating point). The mutual influence of the heat transfer parameters on the temperature of the different motor components is analyzed (Figure 3 and Figure 4). Therefore, the percentage temperature chances, compared to the original value, over the varied HTCs are used:
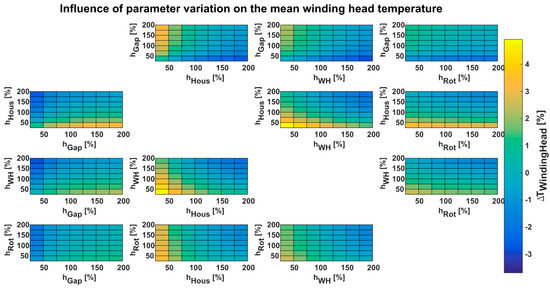
Figure 3.
HTC parametric study of the IM.
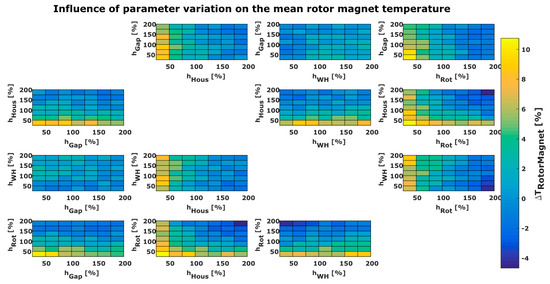
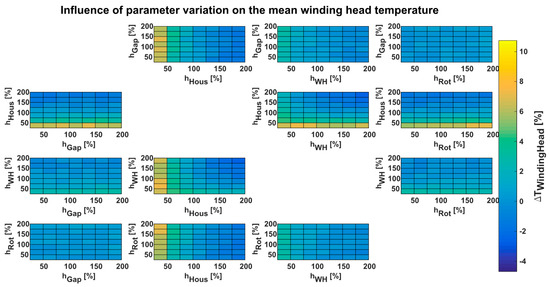
Figure 4.
HTC parametric study of the PMSM.
The results of the IM parameter study show that the winding temperature is increased by increased air gap HTC in the same amount as an increased housing HTC reduces the winding temperature. It seems to be interesting that the stator winding temperature decrease is equally dependent on the housing HTC and winding head HTC. This can be explained by the axial stator iron surface which can dissipate heat to the air as the winding head dissipates the heat from the stator windings, too. The same effect can be found when comparing the rotor and the housing HTCs. If the air gap HTC is constant, the HTC of the housing lowers the winding temperature more than the HTCs of the rotor and short circuit rings lowers the winding temperature. Even with higher absolute rotor temperatures, the windings will be cooled more intense by increasing the heat transfer of the further away housing compared to the near rotor. Even more interesting is that the increased rotor HTC increases the temperature of the air inside the motor housing and, therefore, the heat transfer from the winding heads into the air is reduced. The same effect can be observed with the winding heads of the PMSM, where the decrease in the winding head temperature with increased winding head HTC does not decrease the winding temperature further.
As expected, the rotor temperature decreases by increased rotor or air gap HTCs. An increased winding head HTC can cause higher rotor magnet temperatures, since the heat transfer from the rotor into the air is greatly reduced due to mutual influence of the rotor and winding head HTCs.
The parameter study shows that the housing HTC seem to have a great influence on each motor component, which is thermal critical (magnets and windings) for the retrievable maximum motor output. Even when the windings can be cooled by the thermal coupling to motor cooling jacket, an increased HTC of the motor housing can decrease the temperature. For the rotor components, this effect has been expected, because the rotor cooling, when no active rotor cooling is used, mostly happens by indirectly convective cooling. This shows that an increased heat transfer from the air to the motor housing could be helpful to reduce the temperature in the active motor components.
To summarize the results of the parameter study, it can be said that the heat transfer behavior in traction machines is very complex and the mutual influence of different heat paths cannot always be clearly identified, because the influence depends on the motor design and the dissipated heat losses in the specific design.
When the motor is designed without direct cooled motor components, it could be helpful to increase the heat transfer through the motor housing sides to decrease active component temperatures. For example, instead of using cooling jacket channels only inside the radial motor housing, cooling channels could be implemented inside the axial motor housings, too.
3.3. Validation with Measurement Data from Different Electrical Machines
In this subsection the thermal behavior of electric machines with different cooling systems will be reviewed and simulated with the developed thermal traction motor model. The different motors used for model validation are listed in Table 4.

Table 4.
Different electric traction motor designs.
For the different motors different numbers of stationary operating points, peak operating points and drive cycles were analyzed for validating the thermal model.
3.3.1. Simulation Process, Measurement System and Errors
The boundary conditions of the measurement environment are set the same in the simulation (f.e. air temperature, cooling fluid inlet temperature). The motor operating conditions (motor torque, motor speed, motor current and motor voltage) in each time step are taken as input values. The losses for each time step are interpolated from the values of the look-up tables closest to the motor conditions in this time step. Afterwards the thermal values are calculated and the next iteration step starts
For stationary motor parts thermocouples with an accuracy of are used. The different telemetric measurement systems have an accuracy of . Further is has to be mentioned that the telemetry sensor of some motor components fails in some measuring points. In Figure 5, some points of measurement failure can be seen in the graphs on the right side (measured short-circuit and shaft temperature failed sometimes or often). The thermocouples show no measurement errors or failures (Figure 5, left side).
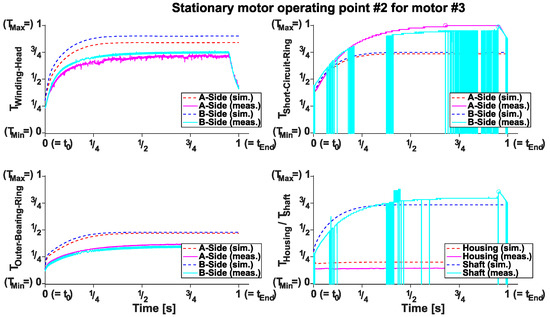
Figure 5.
IM stationary operating point with telemetry sensor errors.
In such cases the maximum temperature (without the sensor error) is used as measured stationary reference temperature (marked with a circle) for model validation. Only the measured values without sensor errors were used to determine the mean relative error so that the result is not falsified by wrong relative error values.
3.3.2. Stationary Operating Points
For analyzing the stationary operating points the relative temperature errors and the standard deviations are shown only for the measured temperatures of each specific motor. Each motor has a different number of temperature sensors, therefore not every motor part can be reviewed for each motor concept. For calculating the stationary behavior, the stationary temperatures are calculated as follows:
The relative errors (RE) of each motor component will be calculated by:
In Figure 6, two examples of simulation vs. measurement for motor #2 and #3 are shown.
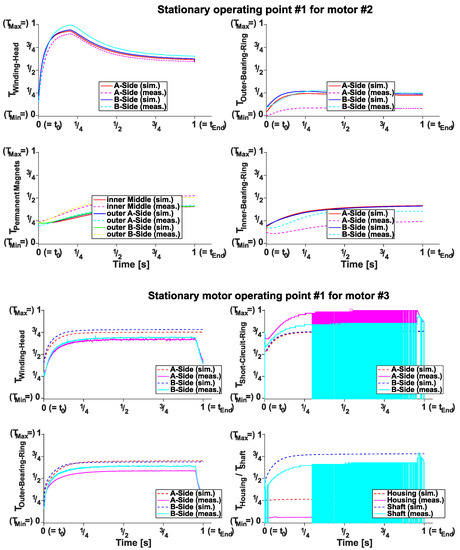
Figure 6.
Simulation and measurement of stationary operating points of motor #2 and #3.
As shown in the figure the heating up process of each motor component is simulated quite accurate, but the measured temperature wont reached exactly.
In Table 5, the mean relative errors for the different motor concepts, for whole drive units (DUs) and stand-alone electric traction motors (ETMs), are shown.

Table 5.
Mean relative errors for stationary operating points of different electric traction motors and drive units.
The results show that for the most motor designs the temperature prediction for the different motor parts is in an error range of . The highest errors can be found in the bearings and sometimes in some rotor components. An example for a the error reason can be found in the motor #5 where the cooling system shows a big gradient in heat transfer behavior over the perimeter of the motor, because the thermal model does not predict local heat transfer differences over the motor perimeter. In this cooling concept the motor is oil flushed from a top-side oil inlet pipe and the oil does not cool the stator over the full perimeter and the oil film breaks up. These temperature gradients have a spread of up to 40° K as seen in the following measurement result (Figure 7).
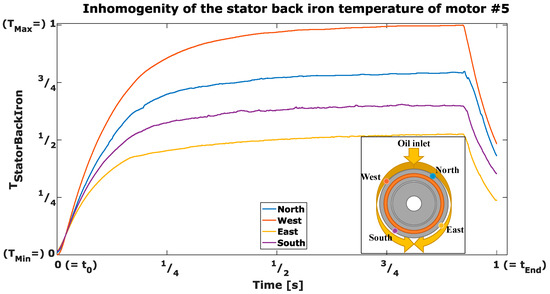
Figure 7.
Inhomogeneity of the stator back iron temperature of motor #5.
The measurement results for motors # 2, # 2b and # 3 also show temperature inhomogeneity over the circumference of the motor. This problem cannot be solved with this presented 2D thermal model, because the losses in the heat source nodes are distributed symmetrically. Possible different production influences over the motor circumference are therefore only insufficiently represented by the LPTN.
3.3.3. Peak Operating Points
The peak power operating points for 30 s/60 s for four of the machines are reviewed here, too (Table 6). Some motors are designed for 60 s peak operating time, while others are designed only for boosting. Therefore, the length of the peak operating point varies. The relative errors of each motor component will be calculated by:

Table 6.
Mean relative errors for peak operating points of different electric traction motors and drive units.
As mentioned in the subsection before, the relative errors in the bearings and some rotor parts show the highest values.
3.3.4. Dynamic Drive Cycles
In Figure 8, three examples of drive cycles are shown. An acceleration drive cycle and a motor cool down of motor #3 and a high speed drive cycle of motor #2. The mean relative errors for each component are shown, too.
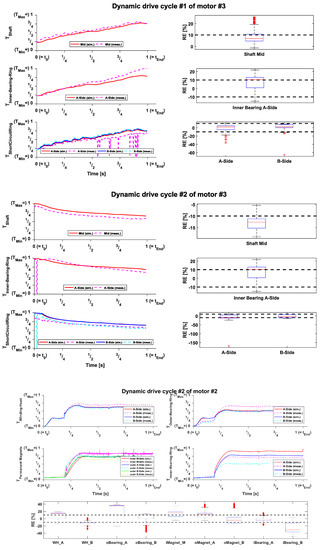
Figure 8.
Drive cycle simulation vs. measurement of motor #2 and #3.
The results of the dynamic drive cycles show that the model can predict the thermal drive cycle behavior in a quite good accuracy, even when there are still relative errors in the temperature predictions. These relative errors are lower in most cases, compared to the stationary and peak operating points. The results shows that the model is useable in early stage thermal behavior prediction. For increased prediction results the losses need to be calculated in the model or coupled with the thermal modeling instead of taking fixed look up tables.
4. Conclusions
The experimental results show that the model can predict the motor temperatures of the different motor in an acceptable range of . It is assumed that the power losses maps are sufficiently exact.
The main influences in the most motor designs is the transmission side and the thermal influence of the transmission on the thermal behavior of the motor. For example, the inner bearing, the transmission-side housing and the shaft show the highest error rates in the developed model.
The results show that the developed model can be used for early stages in the development process of the different electric machines and for example fast drive cycle thermal simulations.
For increasing the accuracy of the thermal model, the losses analysis could be coupled directly with the thermal model, instead of taking losses maps as look up tables. This would reduce the errors in the temperature-dependent parts of the losses, which are not described by the look up tables currently. Furthermore, the boundary conditions of the transmissions side could be improved by developing a thermal transmission model for calculating the mutual influence of electric traction motor and transmission.
The model will later be used to fit the nodes of a simplified online LPTN model for the different motor designs.
Further research in the direct thermal influence of the transmission and transmission shaft would be useful to improve the thermal model. This could further improve the thermal calculation of the rotating motor parts (shaft, rotor and bearings).
Author Contributions
Conceptualization, P.-O.G. and T.A.K.; validation, P.-O.G.; formal analysis, P.-O.G.; writing—original draft preparation, P.-O.G.; writing—review and editing, P.-O.G. and T.A.K.; visualization, P.-O.G. All authors have read and agreed to the published version of the manuscript.
Funding
Publishing fees supported by Funding Programme Open Access Publishing of Hamburg University of Technology (TUHH).
Conflicts of Interest
The authors declare no conflict of interest.
Nomenclature
| Symbols | |
| G | Geometrical factor |
| h | Heat transfer coefficient |
| Nu | Nusselt number |
| Pr | Prandtl number |
| Re | Reynolds number |
| t | Time |
| T | Temperature |
| Greek symbols | |
| Temperature change [%] | |
| Temperature difference [°C] | |
| Air gap ratio | |
| Temperature | |
| Subscripts | |
| 0 | Start time |
| 0, 1, 2,..., n | Index |
| A | Air |
| eff | effective |
| end | End time of measurement |
| Gap | Air gap |
| i | Index |
| i | inner |
| max | Maximum |
| min | Minimum |
| meas | measured |
| o | outer |
| R | Rotor |
| Rer | Rotor end ring |
| sim | simulated |
| Sh | Shaft |
| St | Stator |
| stat | stationary |
Abbreviations
| DU | Drive unit |
| ETM | Electric traction motor |
| Gap | Rotor stator air gap |
| Hous | Housing |
| HTC | Heat transfer coefficient |
| IM | Induction motor |
| LPTN | Lumped parameter thermal network |
| PMSM | Permanent magnet synchronous motor |
| RE | Relative error |
| Rot | Rotor |
| WH | Winding head (=end winding) |
References
- Bilgin, B.; Liang, J.; Terzic, M.V.; Dong, J.; Rodriguez, R.; Trickett, E.; Emadi, A. Modeling and Analysis of Electric Motors: State-of-the-Art Review. IEEE Trans. Transp. Electrific. 2019, 5, 602–617. [Google Scholar] [CrossRef]
- Gundabattini, E.; Kuppan, R.; Solomon, D.G.; Kalam, A.; Kothari, D.P.; Abu Bakar, R. A review on methods of finding losses and cooling methods to increase efficiency of electric machines. Ain. Shams. Eng. J. 2020. [Google Scholar] [CrossRef]
- Engelhardt, T.; Lange, J.; Oechslen, S.; Heitmann, A. Maximierung der Leistungsdichte elektrischer Maschinen durch elektromagnetische und thermische Maßnahmen. In Elektrische Antriebstechnologie für Hybrid und Elektrofahrzeuge; Schäfer, H., Ed.; Expert Verlag GmbH: Würzburg, Germany, 2019; pp. 13–24. ISBN 978-3-8169-8483-2. [Google Scholar]
- Grunditz, E.A.; Thiringer, T.; Saadat, N. Acceleration, Drive Cycle Efficiency, and Cost Tradeoffs for Scaled Electric Vehicle Drive System. IEEE Trans. Ind. Appl. 2020, 56, 3020–3033. [Google Scholar] [CrossRef]
- Hombitzer, M.; Franck, D.; von Pfingsten, G.; Hameyer, K. Permanentmagneterregter Traktionsantrieb für ein Elektrofahrzeug: Bauraum, Wirkungsgrad und Kosten–das Auslegungsdreieck. In Elektrische Antriebstechnologie für Hybrid-und Elektrofahrzeuge; Expert Verlag: Renningen, Germany, 2014; ISBN 978-3-8169-3239-0. [Google Scholar]
- Li, B.; Kuo, H.; Wang, X.; Chen, Y.; Wang, Y.; Gerada, D.; Worall, S.; Stone, I.; Yan, Y. Thermal Management of Electrified Propulsion System for Low-Carbon Vehicles. Automot. Innov. 2020, 3, 299–316. [Google Scholar] [CrossRef]
- Gronwald, P.; Kern, T.A. Traction motor cooling systems, a literature review and comparative study. IEEE Trans. Transp. Electrif. 2021. [Google Scholar] [CrossRef]
- Kylander, G. Thermal Modelling of Small Cage Induction Motors; Chalmers University of Technology: Göteborg, Sweden, 1995; ISBN 9171970614. [Google Scholar]
- Meksi, O.; Roberts, D.; Turner, D.R. Lumped parameter thermal model for electrical machines of TEFC design. IEE Proc. B Electr. Power Appl. 1991, 138, 205–218. [Google Scholar] [CrossRef]
- Tovar-Barranco, A.; Lopez-de-Heredia, A.; Villar, I.; Briz, F. Modeling of End-Space Convection Heat-Transfer for Internal and External Rotor PMSMs with Fractional-Slot Concentrated Windings. IEEE Trans. Ind. Electron. 2020, 1. [Google Scholar] [CrossRef]
- Boglietti, A.; Cavagnino, A. Analysis of the Endwinding Cooling Effects in TEFC Induction Motors. IEEE Trans. Ind. Appl. 2007, 43, 1214–1222. [Google Scholar] [CrossRef]
- Boutarfa, R.; Harmand, S. Local convective heat transfer for laminar and turbulent flow in a rotor-stator system. Exp. Fluids 2005, 38, 209–221. [Google Scholar] [CrossRef]
- Chen, Q.; Shao, H.; Huang, J.; Sun, H.; Xie, J. Analysis of Temperature Field and Water Cooling of Outer Rotor In-Wheel Motor for Electric Vehicle. IEEE Access 2019, 7, 140142–140151. [Google Scholar] [CrossRef]
- Cezário, C.; Verardi, M.; Borges, S.; Silva, J.; Antônio, A.; Oliveira, M. Transient Thermal Analysis of an induction Electric Motor. In Proceedings of the International Congress of Mechanical Engineering, Ouro Preto, Brazil, 6–11 November 2005. [Google Scholar]
- Kumar, R.R.; Singh, S.K.; Srivastava, R.K.; Saket, R.K. The thermal analysis of five-phase pmsg for small-scale wind power application. Int. J. Mech. Prod. Eng. Res. Dev. 2018, 8, 667–680. [Google Scholar]
- Cuiping, L.; Yulong, P.; Ronggan, N.; Shukang, C. Analysis of 3D Static Temperature Field of Water Cooling Induction Motor in Mini Electric Vehicle. In Proceedings of the 2011 International Conference on Electrical Machines and Systems, Beijing, China, 20–23 August 2011. [Google Scholar]
- Huang, Z.; Fang, J.; Liu, X.; Han, B. Loss Calculation and Thermal Analysis of Rotors Supported by Active Magnetic Bearings for High-Speed Permanent-Magnet Electrical Machines. IEEE Trans. Ind. Electron. 2016, 63, 2027–2035. [Google Scholar] [CrossRef]
- Jelden, H.; Lück, P.; Kruse, G.; Tousen, J. Der elektrische Antriebsbaukasten von Volkswagen. In Fahrerassistenzsysteme und Effiziente Antriebe; Siebenpfeiffer, W., Ed.; Springer Fachmedien Wiesbaden: Wiesbaden, Germany, 2015; pp. 84–93. ISBN 978-3-658-08161-4. [Google Scholar]
- Jelden, H.; Lück, P.; Kruse, G.; Tousen, J. The Electric Powertrain Matrix from Volkswagen. MTZ Worldw. 2014, 75, 4–9. [Google Scholar] [CrossRef]
- Blumenröder, K.; Bennewitz, K.; Lück, P.; Tousen, J.; Estorf, M. Der neue Modulare E-Antriebs-Baukasten von Volkswagen: Volkswagen’s new modular e-drive kit. In Proceedings of the 40th Internationales Wiener Motorensymposium, Vienna, Austria, 15–17 May 2019; Gerlinger, B., Lenz, P., Eds.; VDI Verlag: Düsseldorf, Germany, 2019. [Google Scholar]
- Helbing, C.; Bennewitz, K.; Lück, P.; Tousen, J.; Peter, J. Der Antriebsstrang des ID.CROZZ–Volkswagen erweitert das Portfolio des MEB: The powertrain of the ID.CROZZ–Volkswagen expands the portfolio of the MEB. In Proceedings of the 41th Internationales Wiener Motorensymposium, Vienna, Austria, 22–24 April 2020; Gerlinger, B., Lenz, P., Eds.; VDI Verlag: Düsseldorf, Germany, 2020. [Google Scholar]
Publisher’s Note: MDPI stays neutral with regard to jurisdictional claims in published maps and institutional affiliations. |
© 2021 by the authors. Licensee MDPI, Basel, Switzerland. This article is an open access article distributed under the terms and conditions of the Creative Commons Attribution (CC BY) license (https://creativecommons.org/licenses/by/4.0/).


