Abstract
Dimensional chains are the basis for testing the feasibility of vehicle architectures in the early development phase since they allow for parametrical vehicle modeling. Parametrical modeling is employed in the early development of the vehicle in order to enable the estimation of the space available for powertrain components. For battery electric vehicles (BEVs), new dimensional chains have increased relevance because of the geometrical interdependencies between the traction battery and the passenger compartment. The passenger compartment and traction battery share the same position in the vehicle, i.e., between the axles, which leads to a conflict between these two components. Furthermore, the passenger compartment dimensions are needed to size components like heating, ventilation, and air conditioning (HVAC), the energy consumption of which in turn influences the required battery capacity. In order to describe these interdependencies, we identify a set of dimensional chains and derive a passenger compartment volume estimation model that can be employed in the early development phase of the vehicle design. We further analyze the single elements of the dimensional chain and present typical values for each element.
1. Introduction
The new European Union (EU) CO2 regulations [1] are forcing manufacturers to gradually introduce electric vehicles into their fleet. This powertrain electrification is a long-term strategy that allows manufacturers to comply with the imposed EU emissions standards.
The architecture design of battery electric vehicles (BEVs) represents a challenging task for manufacturers. It takes place during the early development phase, when engineers have to define the outer dimensions and the characteristics of the vehicle [2] (p. 10). The importance of this step can be explained using the Pareto principle. Eighty percent of the vehicle will have already been defined during about 20% of the development time [3]. Therefore, the results of this phase are crucial for the further concept development steps. The central component of BEV-architectures is the traction battery, which usually represents the largest and heaviest component of the electric powertrain. In most of the existing electric vehicles, the battery is placed between the front and rear axle [4]. This position corresponds to that of the passenger compartment, thus creating an interdependency between passenger compartment and battery.
Multiple approaches exist in the literature for modeling the passenger compartment and the battery space. The modeling of the passenger compartment’s dimensions is intensely researched by Müller [5] and Raabe [6]. Both authors focus on modeling dimensions and geometrical interdependencies within the passenger compartment, but only consider combustion engine vehicles. Mau et al. [7,8] present a list of parametric models, which can also be applied to estimate the passenger compartment dimensions. Nevertheless, these models do not consider the presence of a traction battery. Kuchenbuch et al. study the interdependencies between driver’s seat configuration and battery installation space for BEVs [9] (p. 82). The author focuses on the derivation of driver’s comfort angles and position but does not present a set of dimensional chains to fully describe the passenger compartment. Similar methodology can also be found in [10]. Felgenhauer models the seating position of the driver in order to derive the available space at the vehicle front [2] (pp. 51–52). He only considers the first seat row and not the entire compartment because his model focuses on the front part of the vehicle. Tzivanopoulos et al. model how future vehicle requirements and innovations impact the vehicle interior [11] (pp. 669–682). He describes the passenger compartment and the ergonomic interdependencies of the interior layout [11] (p. 673). Nevertheless, the author does not consider the traction battery and focuses on other types of innovations, such as steer-by-wire. Stefaniak et al. [12,13] create a digital mock-up (DMU) for the derivation of battery installation space for electric vehicles. Starting from the main dimensions of the vehicles, the DMU derives the possible installation space of the battery and optimizes its cell orientation. The DMU does not model the volume of the passenger compartment, and many passenger compartment measures appear to be required as inputs.
None of the aforementioned authors offers a complete overview of the interdependencies between the battery and the passenger compartment. Some authors model the compartment precisely but do not consider the battery. Others consider the battery but do not fully model the passenger compartment dimensions and volume. All the models presented are difficult to reuse since the authors only briefly show their own methods without providing all the values which are required to use the models. The aim of this paper is to study the interdependencies between the passenger compartment and the battery space, to model the volume of the compartment itself, and to derive each geometrical interdependency on the basis of real vehicle data evaluation. We further provide all of the results from our analysis, thus allowing the methods presented in this paper to be reused. We will use these results in future research in order to model the effects of the passenger compartment volume on the heating, ventilation, and air conditioning (HVAC) power and to further model the corresponding required battery capacity for the HVAC components. This step has not been considered by any of the authors cited above.
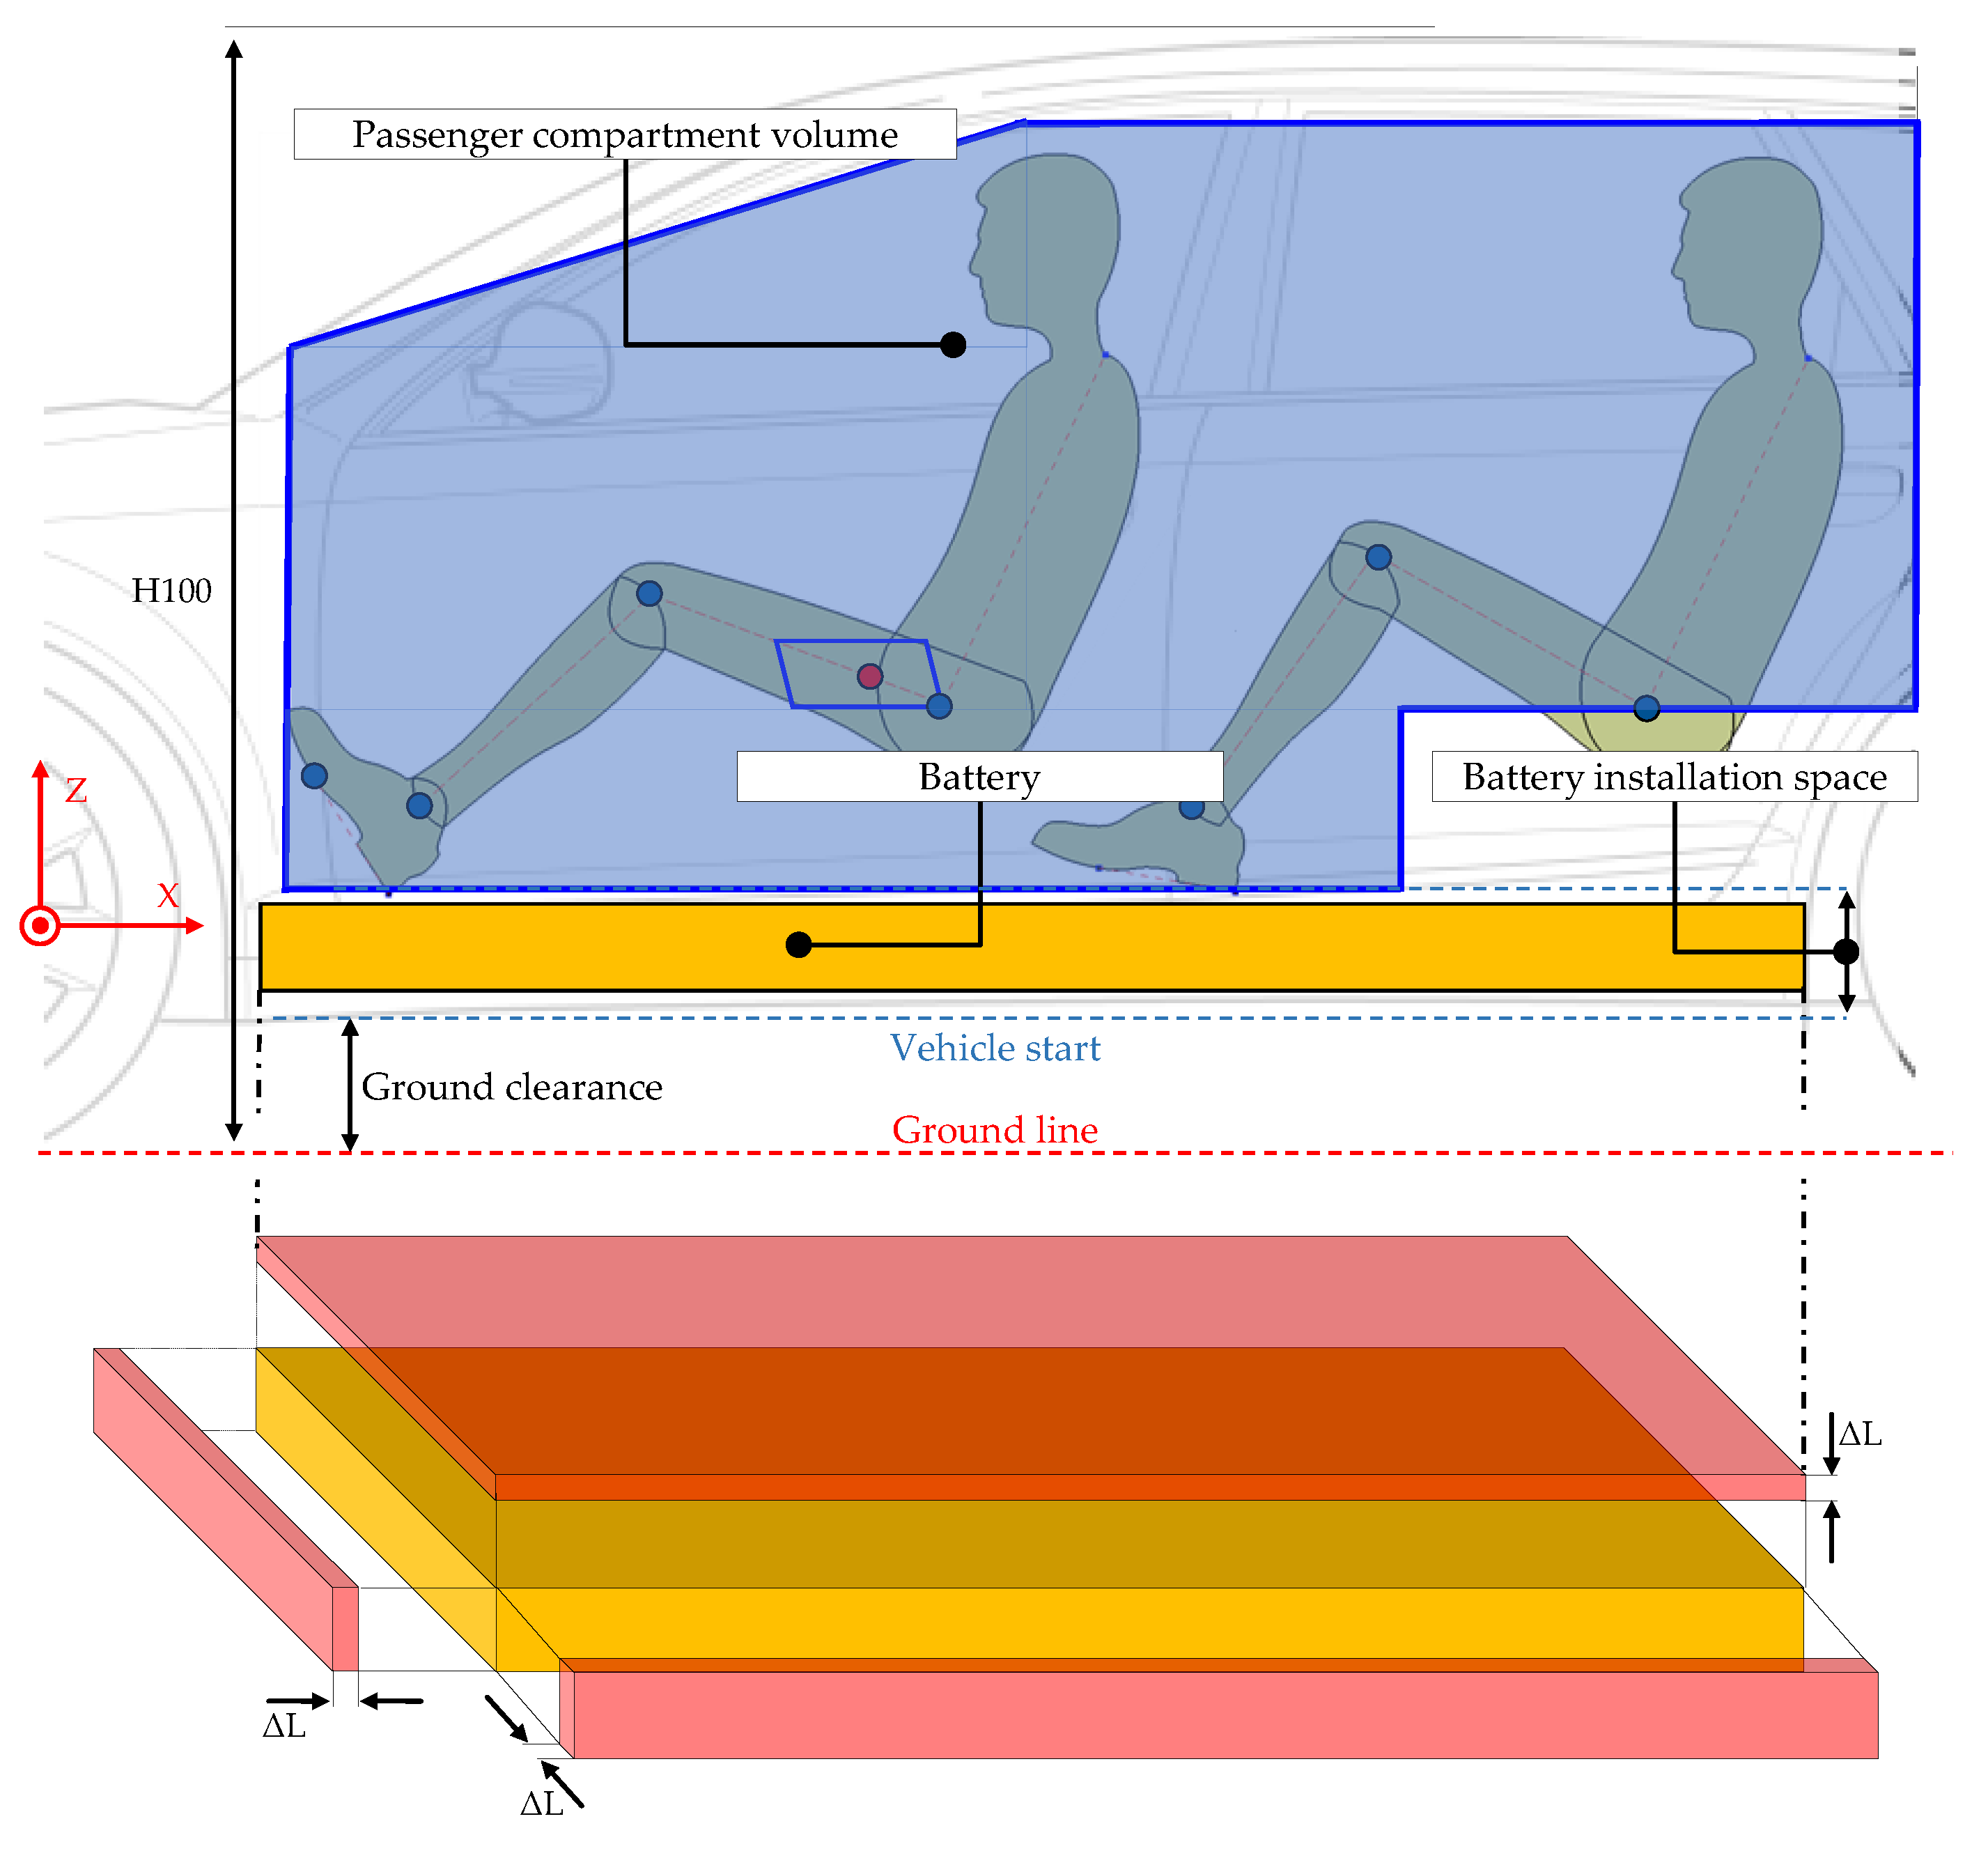
To define the aforementioned interdependency between passenger compartment and battery, we start from the vehicle external dimensions. The vehicle external dimensions are employed as input in various parametrical models for the early vehicle development design [2] (p. 26), [14] (p. 68), and [15]. The total vehicle height (H100, Figure 1) belongs to the main vehicle’s external dimensions. The driver’s required space is derived using dimensional concept measures, as will be shown in the following sections. The vehicle’s ground clearance (Figure 1) can be modeled using existing standards and norms [16,17,18]. Subsequently, subtracting the driver required space and the ground clearance from the H100, it is possible to derive the available battery space in Z-direction (Figure 1). Let us suppose that an increase of the driver headroom ΔL is required, for example, due to higher comfort requirements. In order to maintain the required vehicle’s height, the headroom increment ΔL results in an equal loss of battery space in the Z-direction. A loss ΔL in the Z-direction causes a greater volume loss (and consequently installable battery capacity loss) than an equal loss in the X- or Y-direction (Figure 1), so we will focus mainly on the Z-direction. Furthermore, the increased headroom ΔL leads to a higher passenger compartment volume. This volume increase causes secondary effects such as higher energy consumption by the HVAC system. BEVs are particularly affected by the HVAC system because the latter can reduce range dramatically at low and high temperatures [19] (p. 7). In order to achieve the same required range, the battery capacity has to be enlarged, thus increasing its volume. This creates a conflict between required battery space and required passenger compartment space. To quantify the secondary volume effects caused by the passenger compartment on the battery (and vice versa), the relevant geometrical relationships between these two components need to be identified.
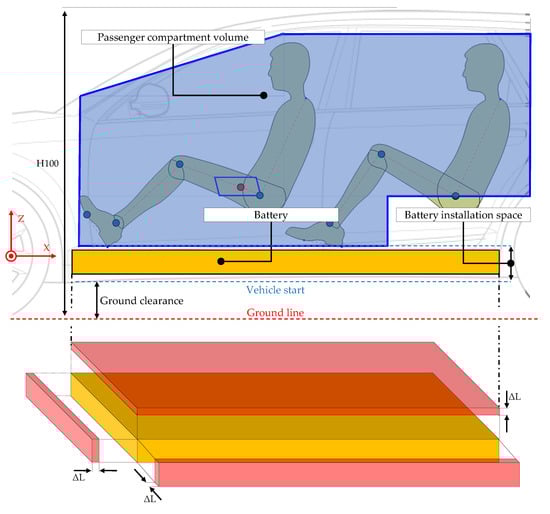
Figure 1.
Geometrical correlation between passenger compartment and battery for the Z-direction.
This paper opens with a description of the relevant standards and methods for defining the passenger compartment layout. We then present the identified dimensional chains (in the X-, Y-, and Z-directions) that describe the passenger compartment. Whereas the X- and Y-chains are needed for the passenger compartment volume estimation, the Z-chain is relevant to both the compartment volume estimation and the description of its geometric dependence with the battery. Given the dimensional chains in the Z-direction, we derive a method for quantifying the battery space starting from a given vehicle height. We subsequently implement a model for estimating the passenger compartment volume combining all the identified chains. We will use these results in future publications to model the effects of passenger compartment volume on the HVAC and then link the HVAC power demand to the required battery capacity, thus quantifying all of the secondary effects between the passenger compartment and battery.
2. Materials and Methods
A vehicle architecture is defined by its main features of dimensional concept, topology, components, and dimensional chains [20]. For the scope of this paper, the relevant features are dimensional concept and dimensional chains.
The dimensional concept represents one of the first steps of the vehicle architecture design. It consists of two main tasks [20]:
- Modeling of internal and external vehicle dimensions. Examples include the main vehicle dimensions like overhang, wheelbase, as well as passenger compartment dimensions such as driver’s headroom [21] (pp. 3–4).
- Modeling of legal requirements. Examples include the driver’s field of vision [22] (p. 38) or the vehicle’s ground clearance.
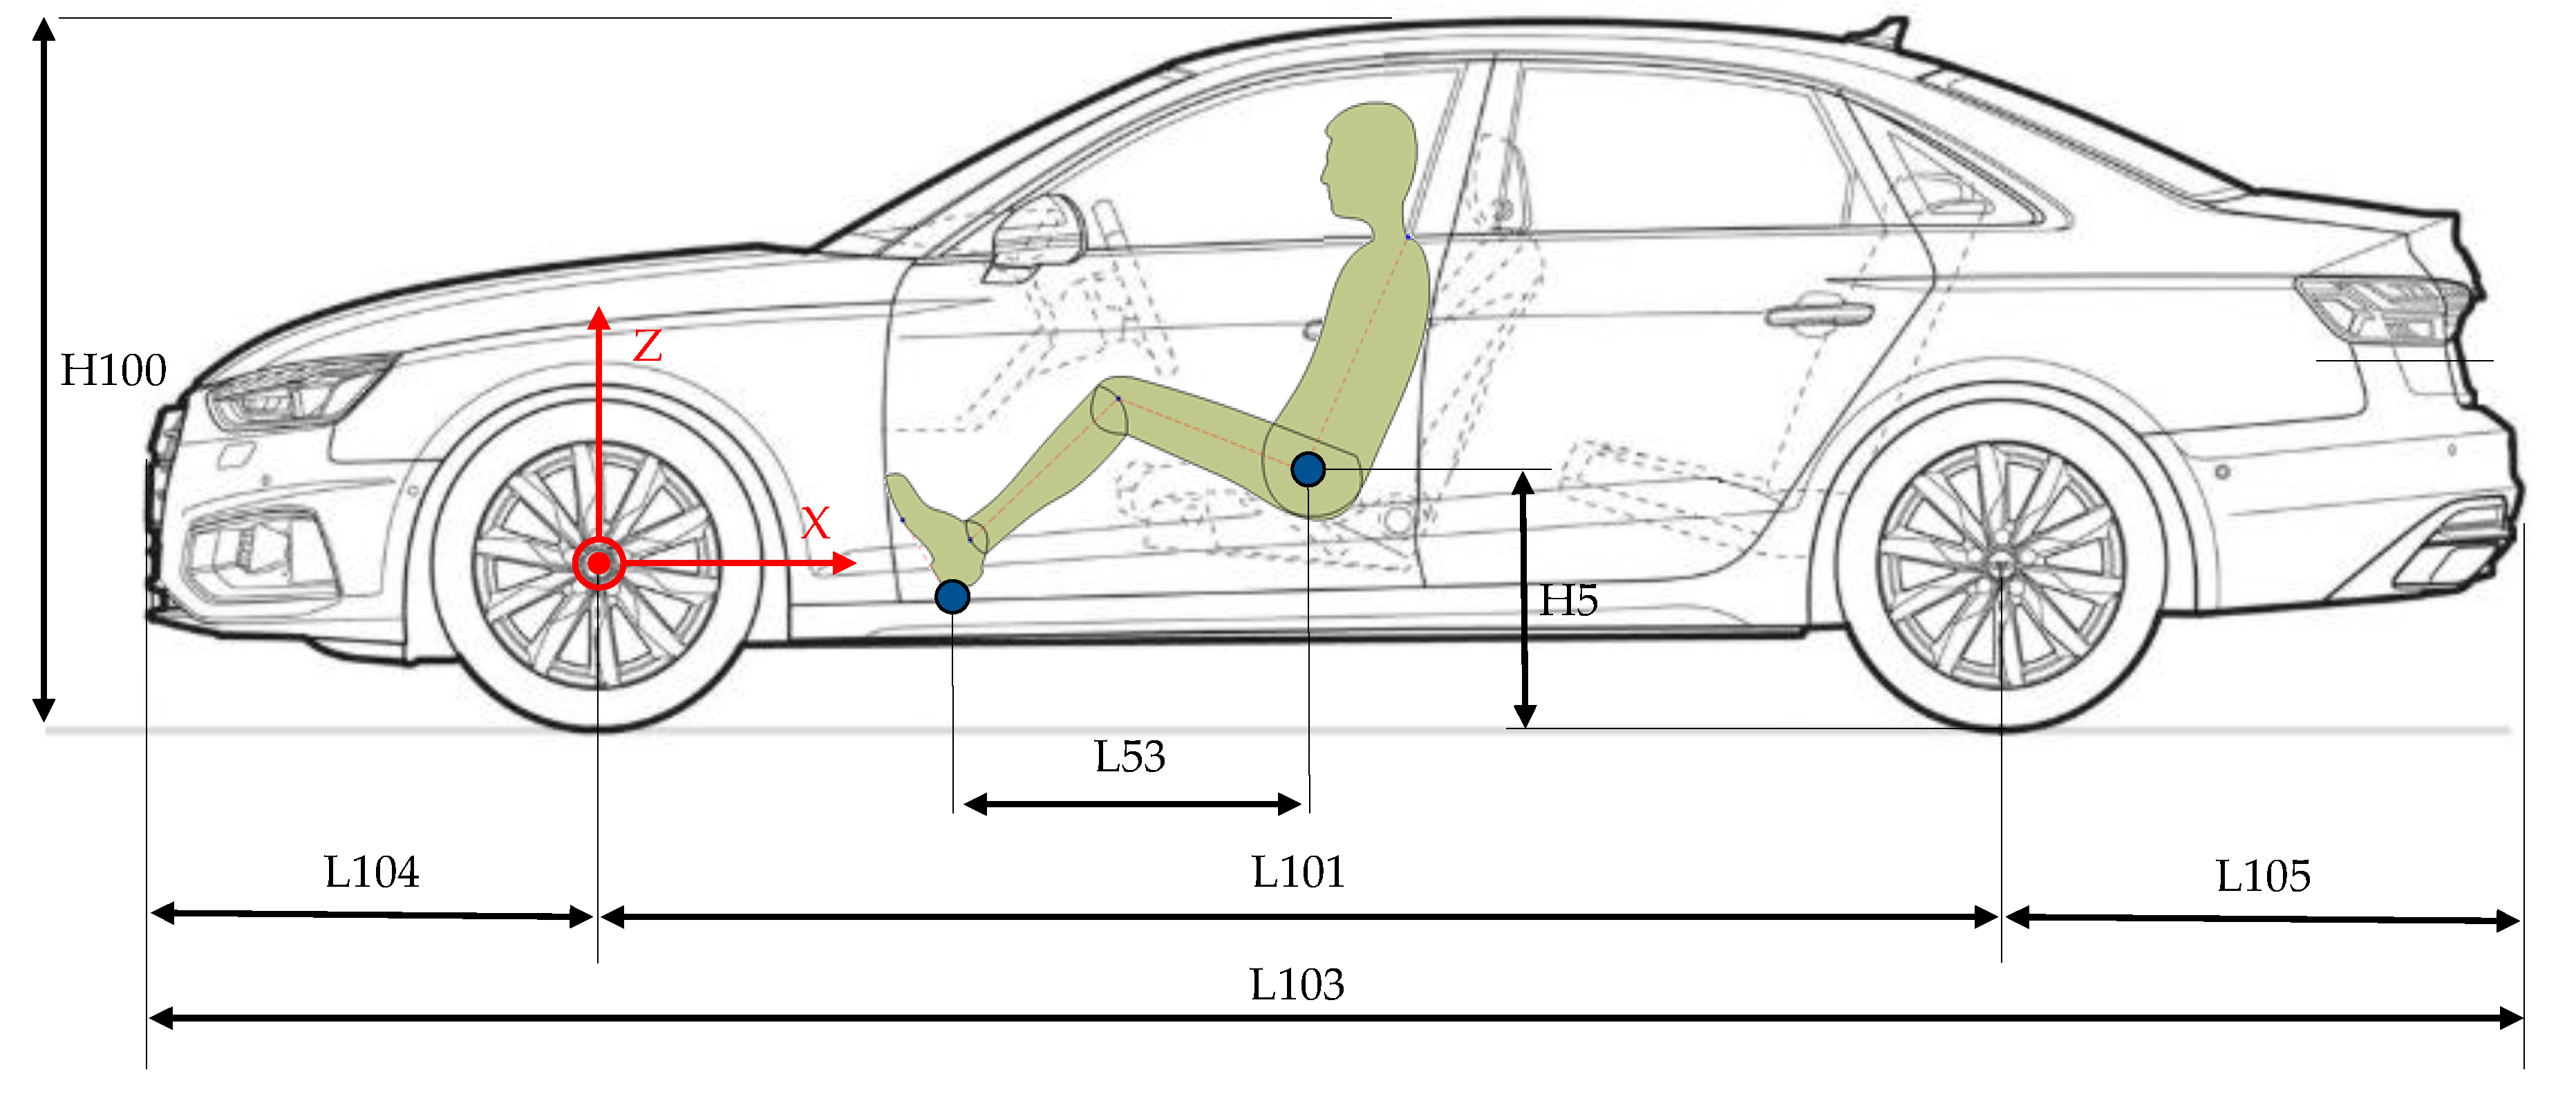
Figure 2 shows an illustrative representation of some dimensional concept measures. Various standards exist for the dimensional concept definition. In this paper, we use the standards defined by the Society of Automotive Engineers (SAE). A comprehensive description of each dimension shown in this paper can be found in the following standards SAE J1100 [23], SAE J826 [24], and SAE J4002 [25].
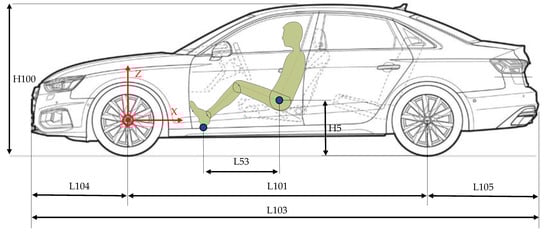
Figure 2.
Some of the most important measures for the dimensional concept [26].
The use of dimensional chains for the definition of the dimensional concept is widespread [27] (p. 3). To link the dimensional concept’s measures, dimensional chains employ geometrical relationships. Equation (1) shows a simplified example of a geometrical relationship between the dimensional concept’s measures of Figure 2. Using this elementary relationship, it is possible to derive the vehicle’s total length (L103) from its overhangs (L105 and L104) and wheelbase (L101).
L103 = L104 + L101 + L105
2.1. Database and Conventions Employed
For the derivation of the dimensional chains, we employ the a2mac1 database [28]. The information contained in the database includes general vehicle data (external and internal dimensions) and component data (components dimensions, weights, and volumes). Despite the goal of creating a model for BEVs, the database mainly contains internal combustion engine vehicles (ICEVs) because the number of electric vehicles on the market is still low. This factor represents no falsification for the model since most of the dimensional concept measures do not change between BEVs and ICEVs.
Following the data collection, we categorize it according to two main variables, which are the vehicle frame-form and the coupling between the first and second row of seats.
Regarding the frame-form (or body style) vehicles can be categorized in groups such as hatchback, sedan, van, and sport-utility-vehicles (SUV) [29] (p. 143). The relevant body styles in the scope of this paper are hatchbacks, sedans, and SUVs since the collected data does not provide enough vehicles for the other categories.
The coupling [24] (p. 12) defines the legroom between the first and the second row of seats in X-direction. Its classification takes place according to the interference between the backside of the front seat and the leg of the manikin in the second row of seats [24] (p. 17). There are three possibilities:
- Short coupling: Interference between the leg of the manikin in the second row of seats and the front seat.
- Standard coupling: Ankle angle (A46, Figure 3) of the manikin in the second row of seats smaller than 130°. No interference with the front seat.
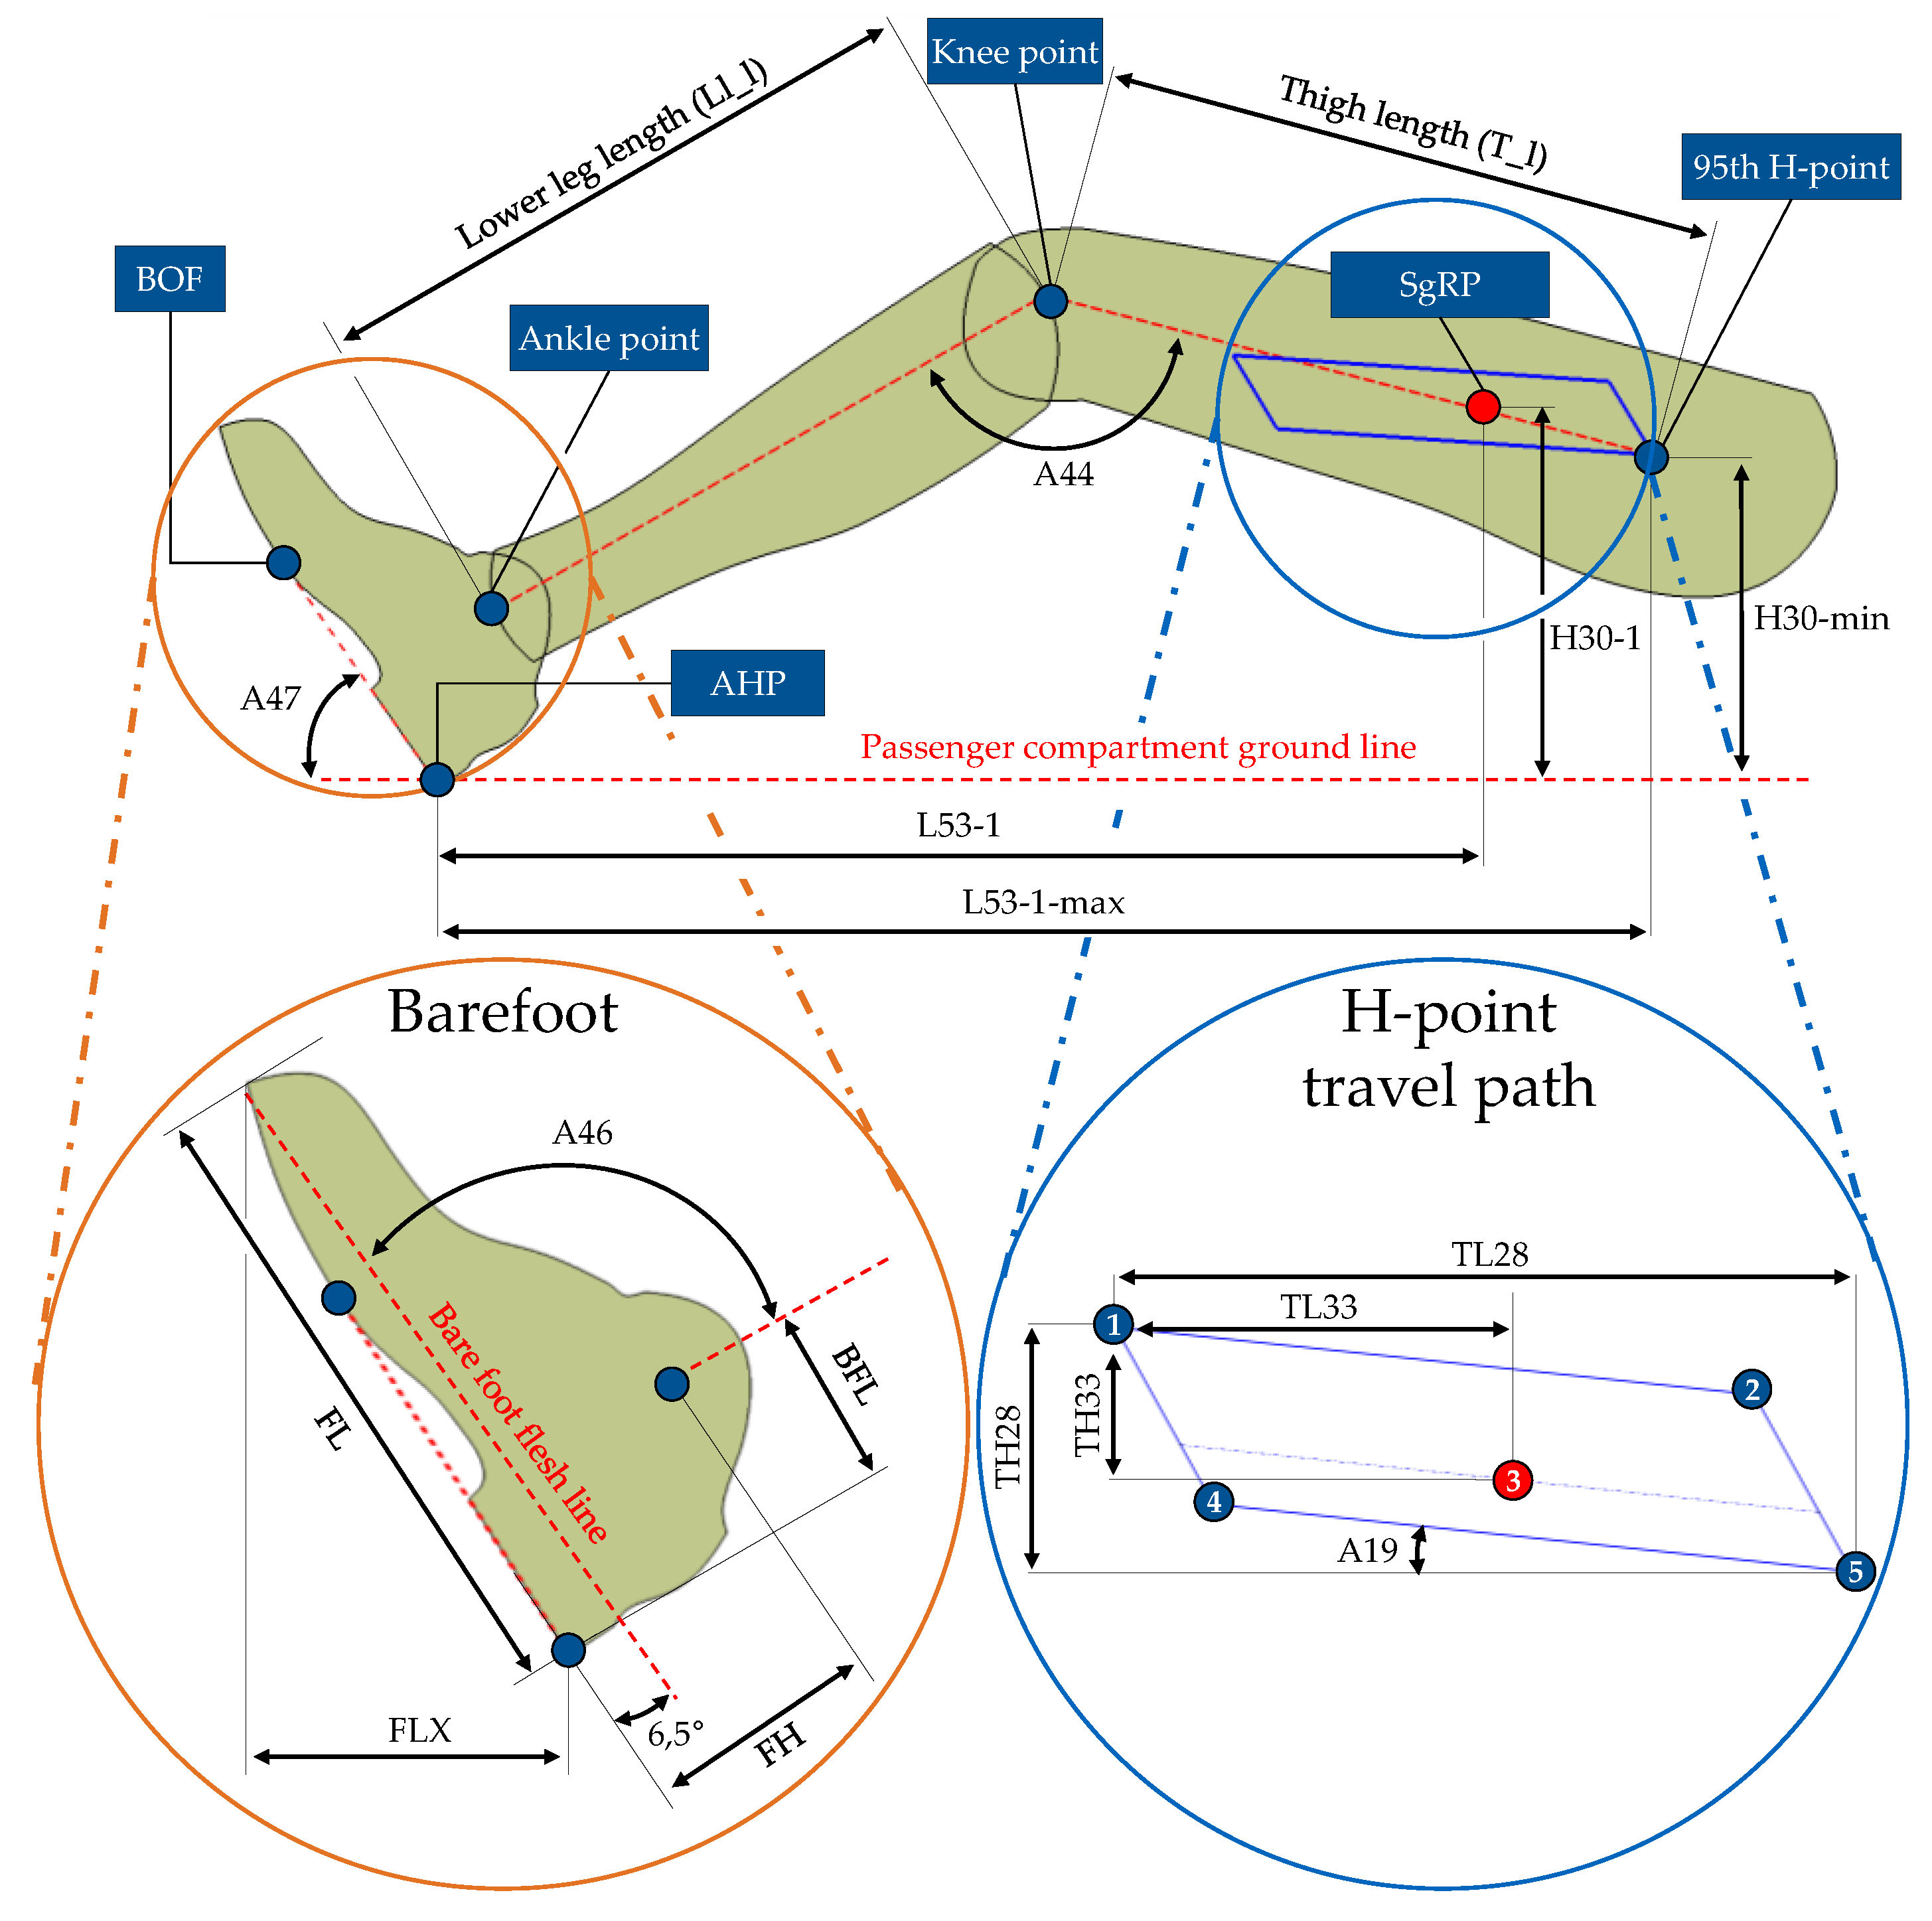
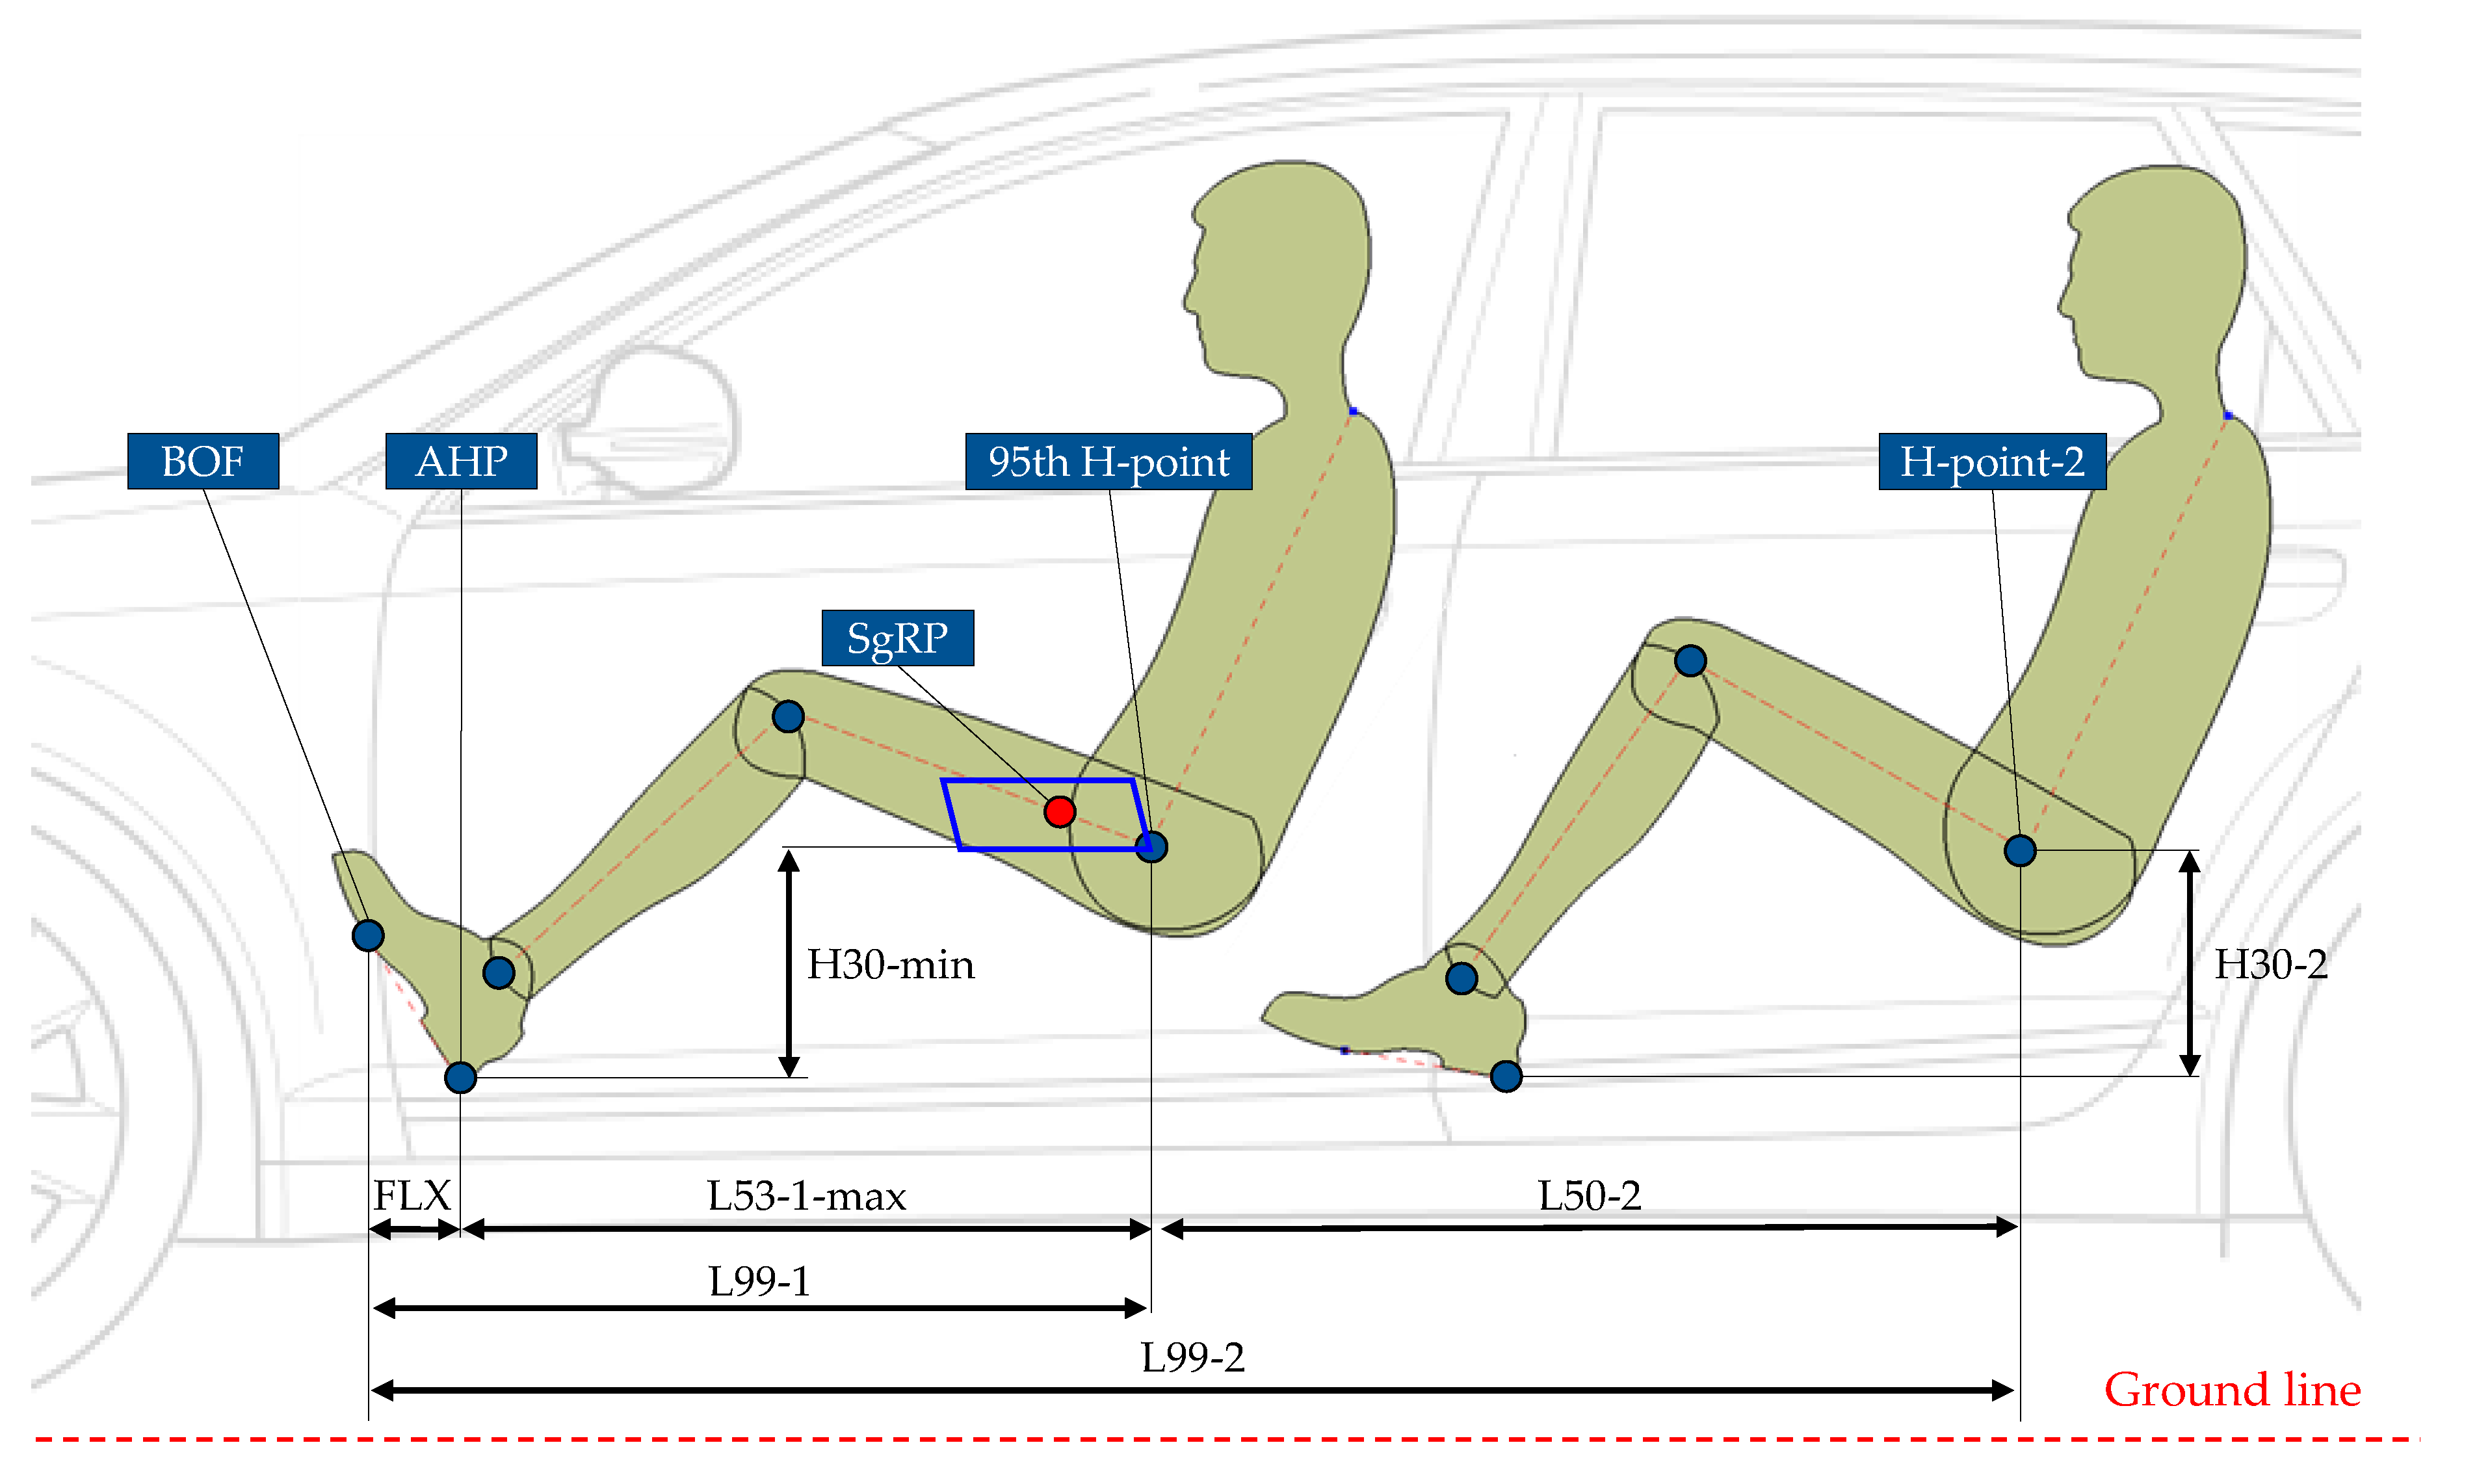
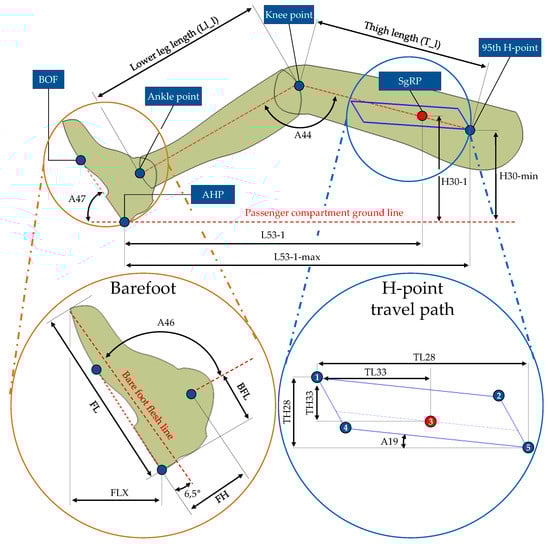 Figure 3. Main dimensions and angles for the description of the driver’s legroom.
 - Long coupling: Ankle angle (A46, Figure 3) of the manikin in the second row of seats bigger than 130°. No interference with the front seat.
Following data collection and categorization, we generate a database containing 121 vehicles. The dimensional chains presented in the following sections are categorized according to the chain’s main direction. For the definition of the main directions, we use the reference system shown in Figure 2.
2.2. Dimensional Chain in the X-Direction
The dimensional chain in the X-direction describes the passenger compartment’s length. To implement this chain, it is necessary to identify the reference points that describe the driver’s legroom. These points are: the accelerator heel point (AHP), the ball of the foot (BOF), and the hip point (H-point) [23] (p. 22). Figure 3 shows the aforementioned reference points and the main dimensions of the driver’s leg and foot. Regarding the position of the reference points, we consider the AHP and BOF to be fixed since they are defined by the accelerator pedal in its unpressed state. On the other hand, the H-point position can vary according to the seat position. The latter can be adjusted both in the X- and the Z-direction, which causes a corresponding shift of the H-point. The area that describes all the possible positions of the H-point is the H-point travel path (Figure 3). To better understand the H-point travel path, we have to discuss its correlation with the leg and foot dimensions.
Regarding the dimensions of the driver’s leg and foot, different manikin sizes exist and are defined by the SAE [24] (p. 9). These sizes are employed in order to describe various population groups. The common sizes are the 95th percentile male manikin and the 5th percentile female manikin [30] (p. 360). These standards mean that the male manikin is bigger than 95% of the male population, while the female manikin is smaller than 5% of the female population. The upper edge of the travel path connecting points 1 and 2 (Figure 3) is the 5th percentile line and is used to position the female manikin. The male manikin is usually placed on the lower edge connecting points 4 and 5 (Figure 3) on the 95th percentile line. The H-point travel path has to be positioned so that there is at least one point on the 5th percentile line where the female manikin is able to reach the pedals, and one point on the 95th percentile line where the male manikin has enough legroom to sit in the car. In so doing, the H-point travel path ensures that all people smaller than the 95th percentile manikin and bigger than the 5th percentile manikin can be accommodated in the vehicle and can reach the pedals. Point 3 in Figure 3 is the Seating Reference Point (SgRP). The SgRP is usually employed as a design point by the manufacturers. This point does not have a fixed standardized position inside of the travel path, and like the dimensions of the travel path, its position is usually manufacturer-dependent. Point 5 is the rearmost, lowest point of the path (95th H-point) and represents the limit for positioning the 95th percentile manikin.
Using these reference points, we can define the required dimension to describe the driver’s legroom. In the scope of this paper, we use H30-1, which defines the vertical distance between AHP and the SgRP projected on the Z-direction, and L53-1, which defines the distance between the BOF and SgRP projected on the X-direction. Referring to these measures at the 95th H-point results in the lowest feasible H30 (H30-min, Figure 3) and the maximal feasible L53-1 (L53-1-max, Figure 3). To uniquely define leg and foot position, we also need the ankle angle (A46), the pedal plane angle (A47), and the knee angle (A44). In Figure 3, the represented knee angle corresponds to the angle which results from positioning the 95th percentile driver’s leg at the 95th H-point.
The modeling of the driver’s legroom requires choosing a manikin size as well as a H-point among all possible points inside of the travel. We use the 95th percentile manikin size positioned at the 95th H-point as shown in Figure 3. Therefore, the measures used in the next steps are the L53-max and the H30-min. Choosing this point for the modeling allows us to position the seat travel path to guarantee that the 95th percentile manikin fits into the passenger compartment.
After choosing an H-point position and a manikin size, the relationships between L53-1-max and the other measures have to be identified. These are purely geometrical interdependencies, and given the correct number of parameters, it is possible to exactly calculate L53-1-max. Based on the angles in Figure 3, we define the angles A and B using Equations (2) and (3).
A = (180° − (A46 − 6.5°) − A47)
B = (A46 − 6.5° − A44 + A47)
Subsequently, we can express the L53-1-max as in Equation (4). In this equation, the lower leg length is abbreviated as Ll-l, the thigh length as T-l, the barefoot height as FH, and the distance between ankle point and AHP as BFL.
L53-1-max = cos(180° − A47 − atan(FH/BFL)) × (FH2 + BFL2)0.5 + Ll-l × cos(A) + T-l × cos(B)
To reduce the number of inputs, the ankle angle (A46) can be set to 87° according to [25] (p. 30). Furthermore, it is possible to approximate the pedal angle A47 with the H30-min. The equation which describes this interdependency is presented in [25] (p. 16).
The L53-1-max does not consider the foot dimensions. The required foot space in X-direction depends on the foot plane angle and the length of the foot itself. The foot length (FL in Figure 3) has a fixed value of 203 mm [24] (p. 7), so we can express its projection in the X-direction, FLX, as follows:
FLX = 203 × cos(A47)
Subsequently, combining Equations (4) and (5), we derive the SAE measure L99-1, which defines the total legroom for the driver:
L99-1 = L53-1-max + FLX
To derive the total passenger compartment length, it is necessary to also consider the second row of seats. We employ the L50-2 measure for this purpose. The L50-2 is the distance between the H-points of the first and the second row of seats projected in the X-direction. Regarding the second row, the seats are usually not adjustable, which means that there is no H-point travel path and only one possible H-point. Equation (7) shows how to derive the total passenger compartment length (L99-2).
L99-2 = L50-2 + L99-1
L99-2 defines the distance between the BOF of the driver and the H-point of the second row of seats projected in the X-direction. In case a third row is present, the passenger compartment length (L99-3) can be calculated while adding the L50-3 measure (which defines the distance between the second and third rows) to L99-2 (not shown in Figure 4).
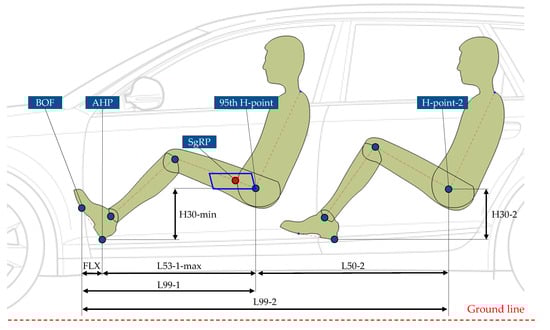
Figure 4.
Overview of the dimensional chain in the X-direction [26].
2.3. Dimensional Chain in the Y-Direction
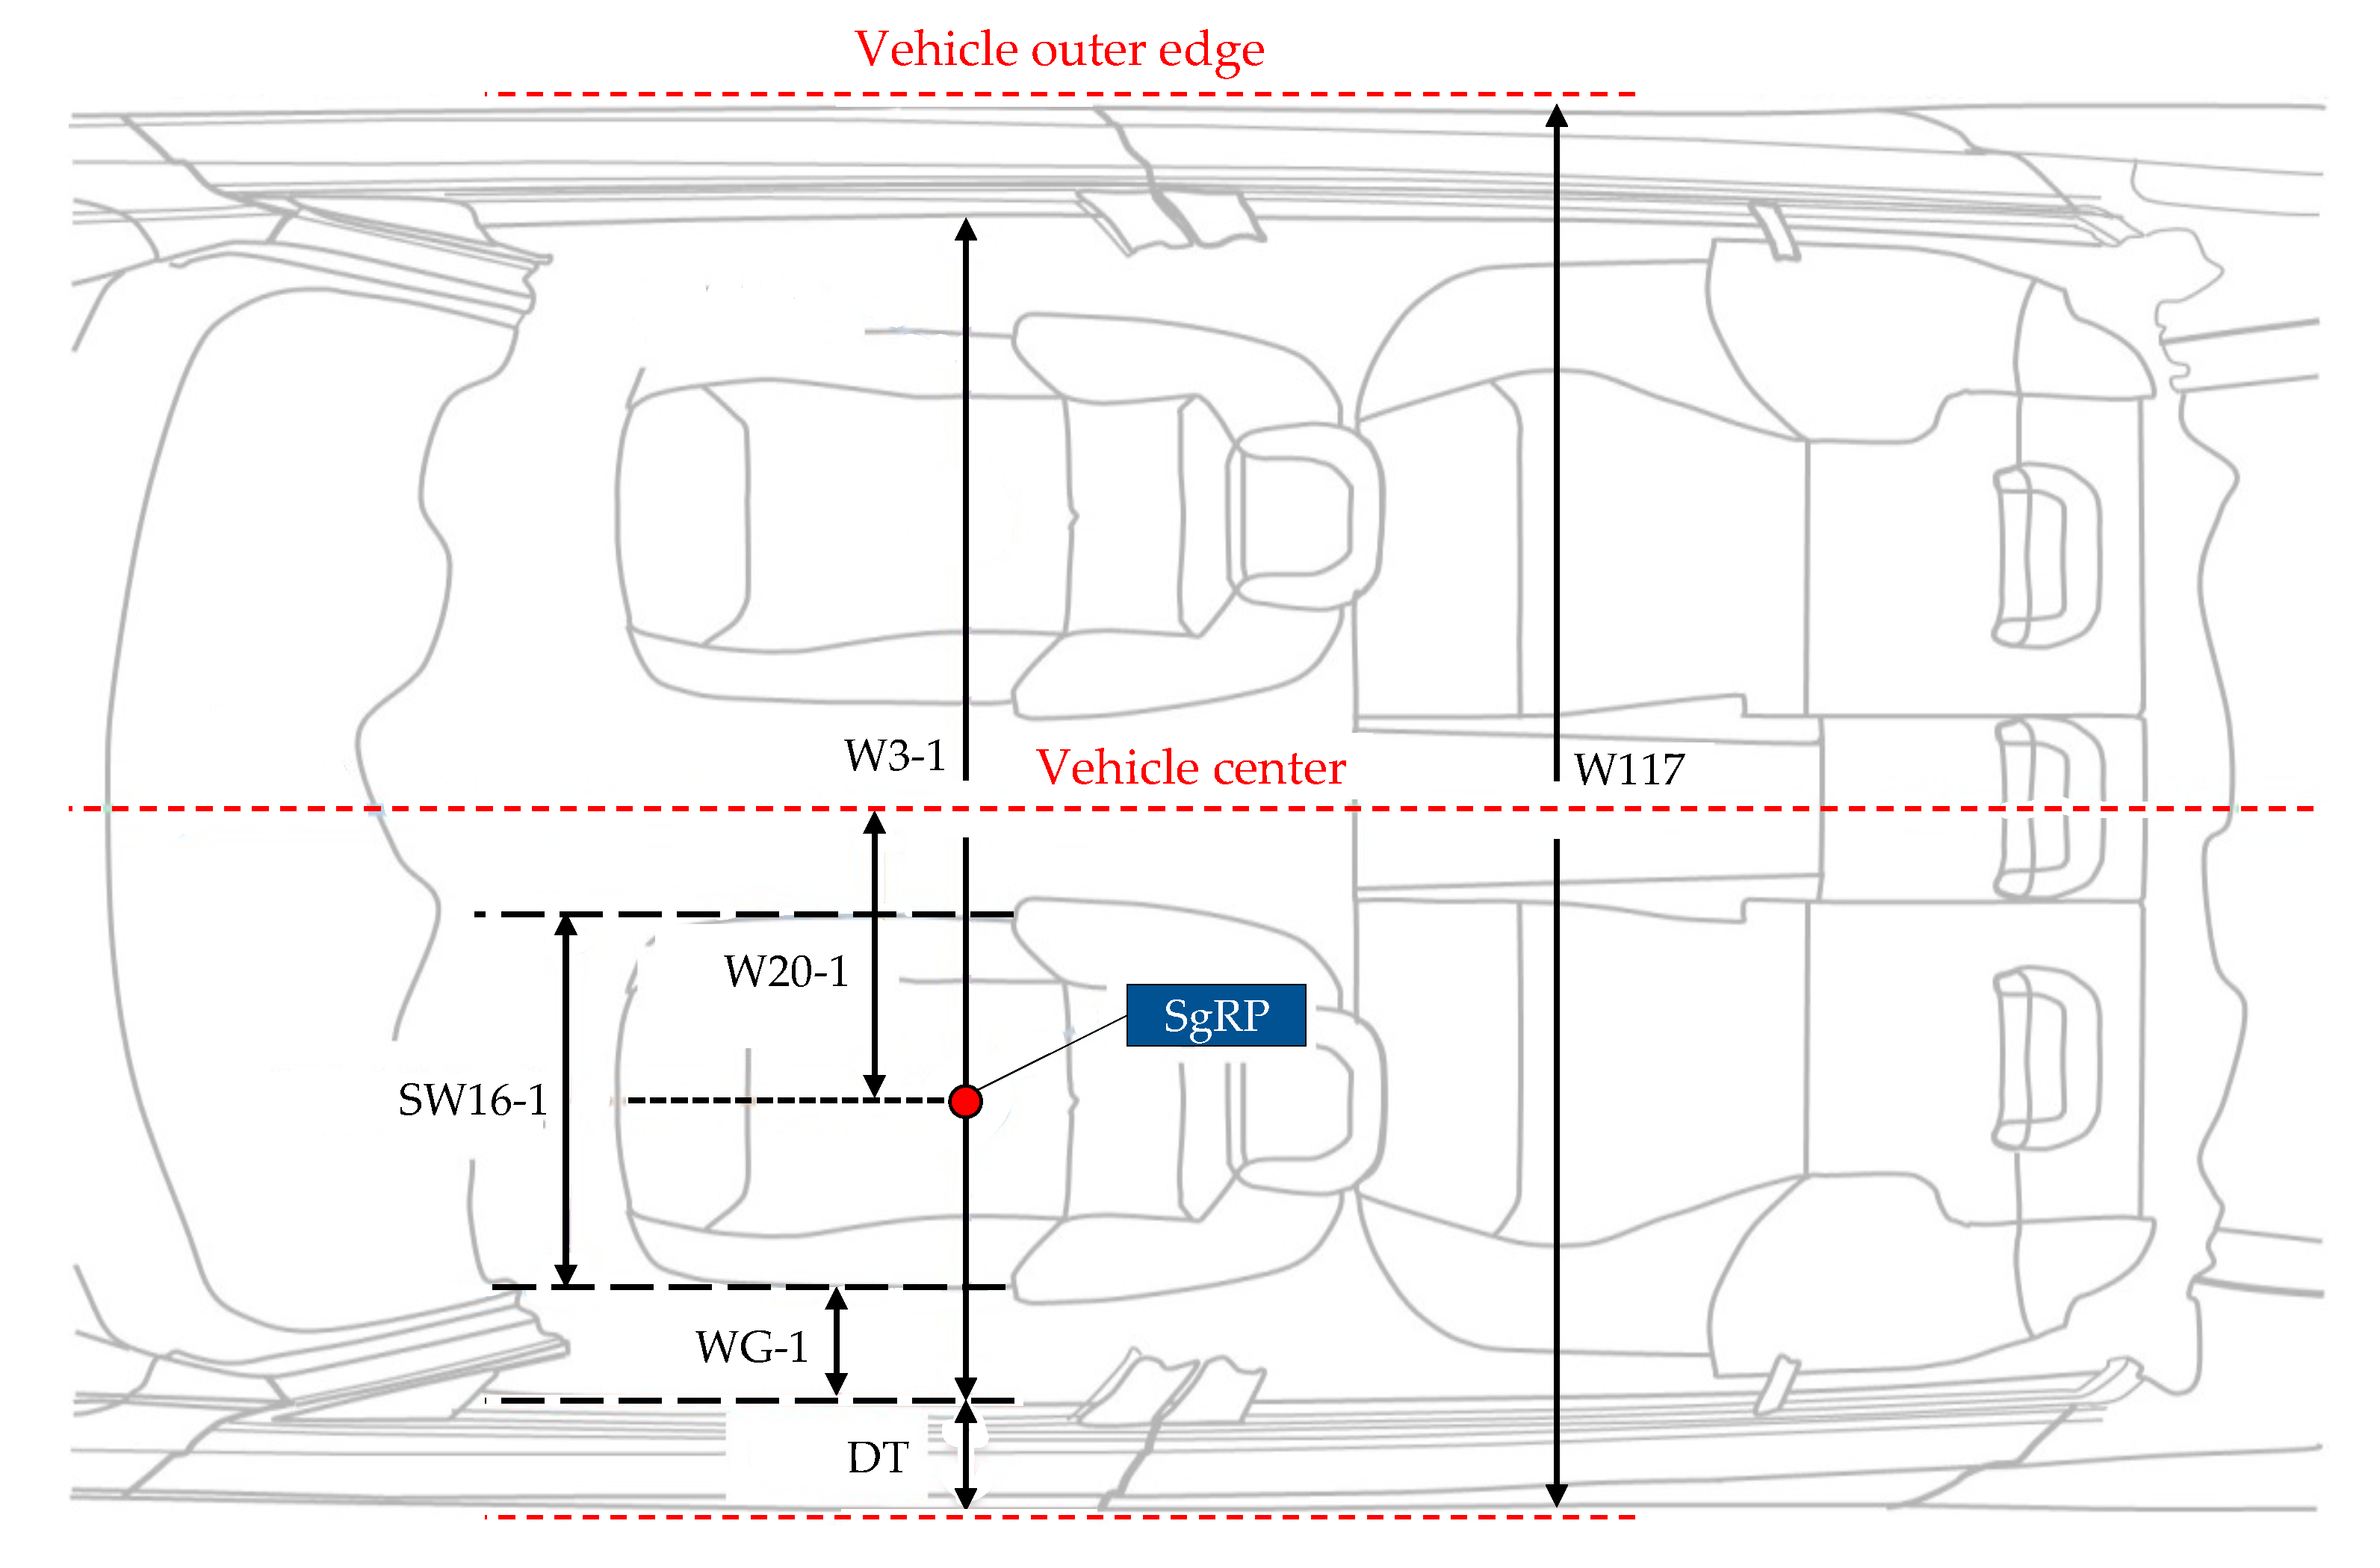
The dimensional chain in the Y-direction describes the passenger compartment’s width measured at the first row of seats. For the sake of simplicity, the width of the first and second rows are considered to be identical. All the presented measures are defined at the SgRP position. For the definition of this chain, we use the method presented in [7] (p. 597). Figure 5 shows the elements of the chain.
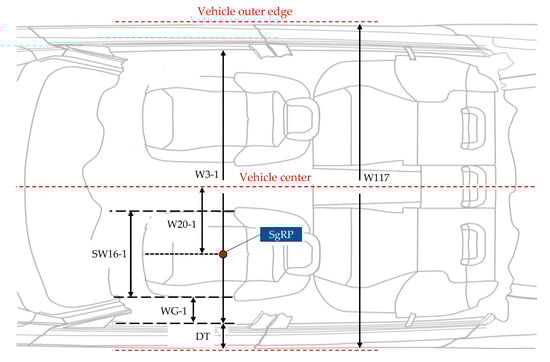
Figure 5.
Overview of the dimensional chain in the Y-direction, based on [7] (p. 597).
The W20-1 measure defines the distance between the SgRP and the center of the vehicle. For ICEVs, W20-1 varies according to the engine installation and topology. For example, in vehicles with a longitudinal engine installation and a rear or all-wheel drive, the gearbox has to be placed in the vehicle tunnel, which leads to a greater W20-1 than in a vehicle with transverse engine and a front-wheel-drive.
In the case of BEVs, the gearboxes are much smaller, and the electric machine always has a transverse installation [2] (p. 48), which means that there is no dependency between the tunnel dimensions and the engine or gearbox position. On the other hand, the traction battery can influence the tunnel dimensions. This occurs for a few BEVs and plug-in-hybrid vehicles where the battery is fully or partially integrated into the tunnel. Regarding the former case, one example is the Volvo XC90 plug-in hybrid [31] (p. 4), which has a 9.2 kWh battery installed entirely within the tunnel [31] (p. 2). The latter case applies to electrified vehicles with a T-shaped battery, e.g., the GM EV1 [32], the BMW i8 [33], and the Rimac Concept One [34]. In these vehicles, the battery is mounted in the tunnel and under the second row of seats. This strategy permits a form of integration which does not influence the total vehicle height. Nevertheless, the usable space is lower than with a rectangular battery shape. Furthermore, since the battery tunnel extends through the entire passenger compartment, it can represent an obstruction for a fifth passenger in the second row of seats. In fact, all of the three vehicles referred to above have either two or four seats. It has been shown in previous research [4] (p. 3) that, with respect to purpose design vehicles, most manufacturers (Audi, BMW, Polestar, Tesla, Volkswagen) utilize a rectangular battery placed in the vehicle underbody. Cases in which the battery is placed in the tunnel are unusual for purpose design vehicles and will not be further considered in the scope of this paper.
The width of the seat is defined using the SW16-1 measure, and the distance between the seat and door is defined using the WG-1 measure [7] (p. 597). Adding the door thickness (DT) at the SgRP height, it is possible to derive the vehicle width W117 at the first row of seats, as in (8).
W117 = 2 × (W20-1 + WG-1 + DT) + SW16-1
Since the focus of this paper is defining the passenger compartment size, the SAE W3-1 standard is more adequate than the W117. This is defined as in (9).
W3-1 = W117 − 2 × DT
2.4. Dimensional Chain in the Z-Direction
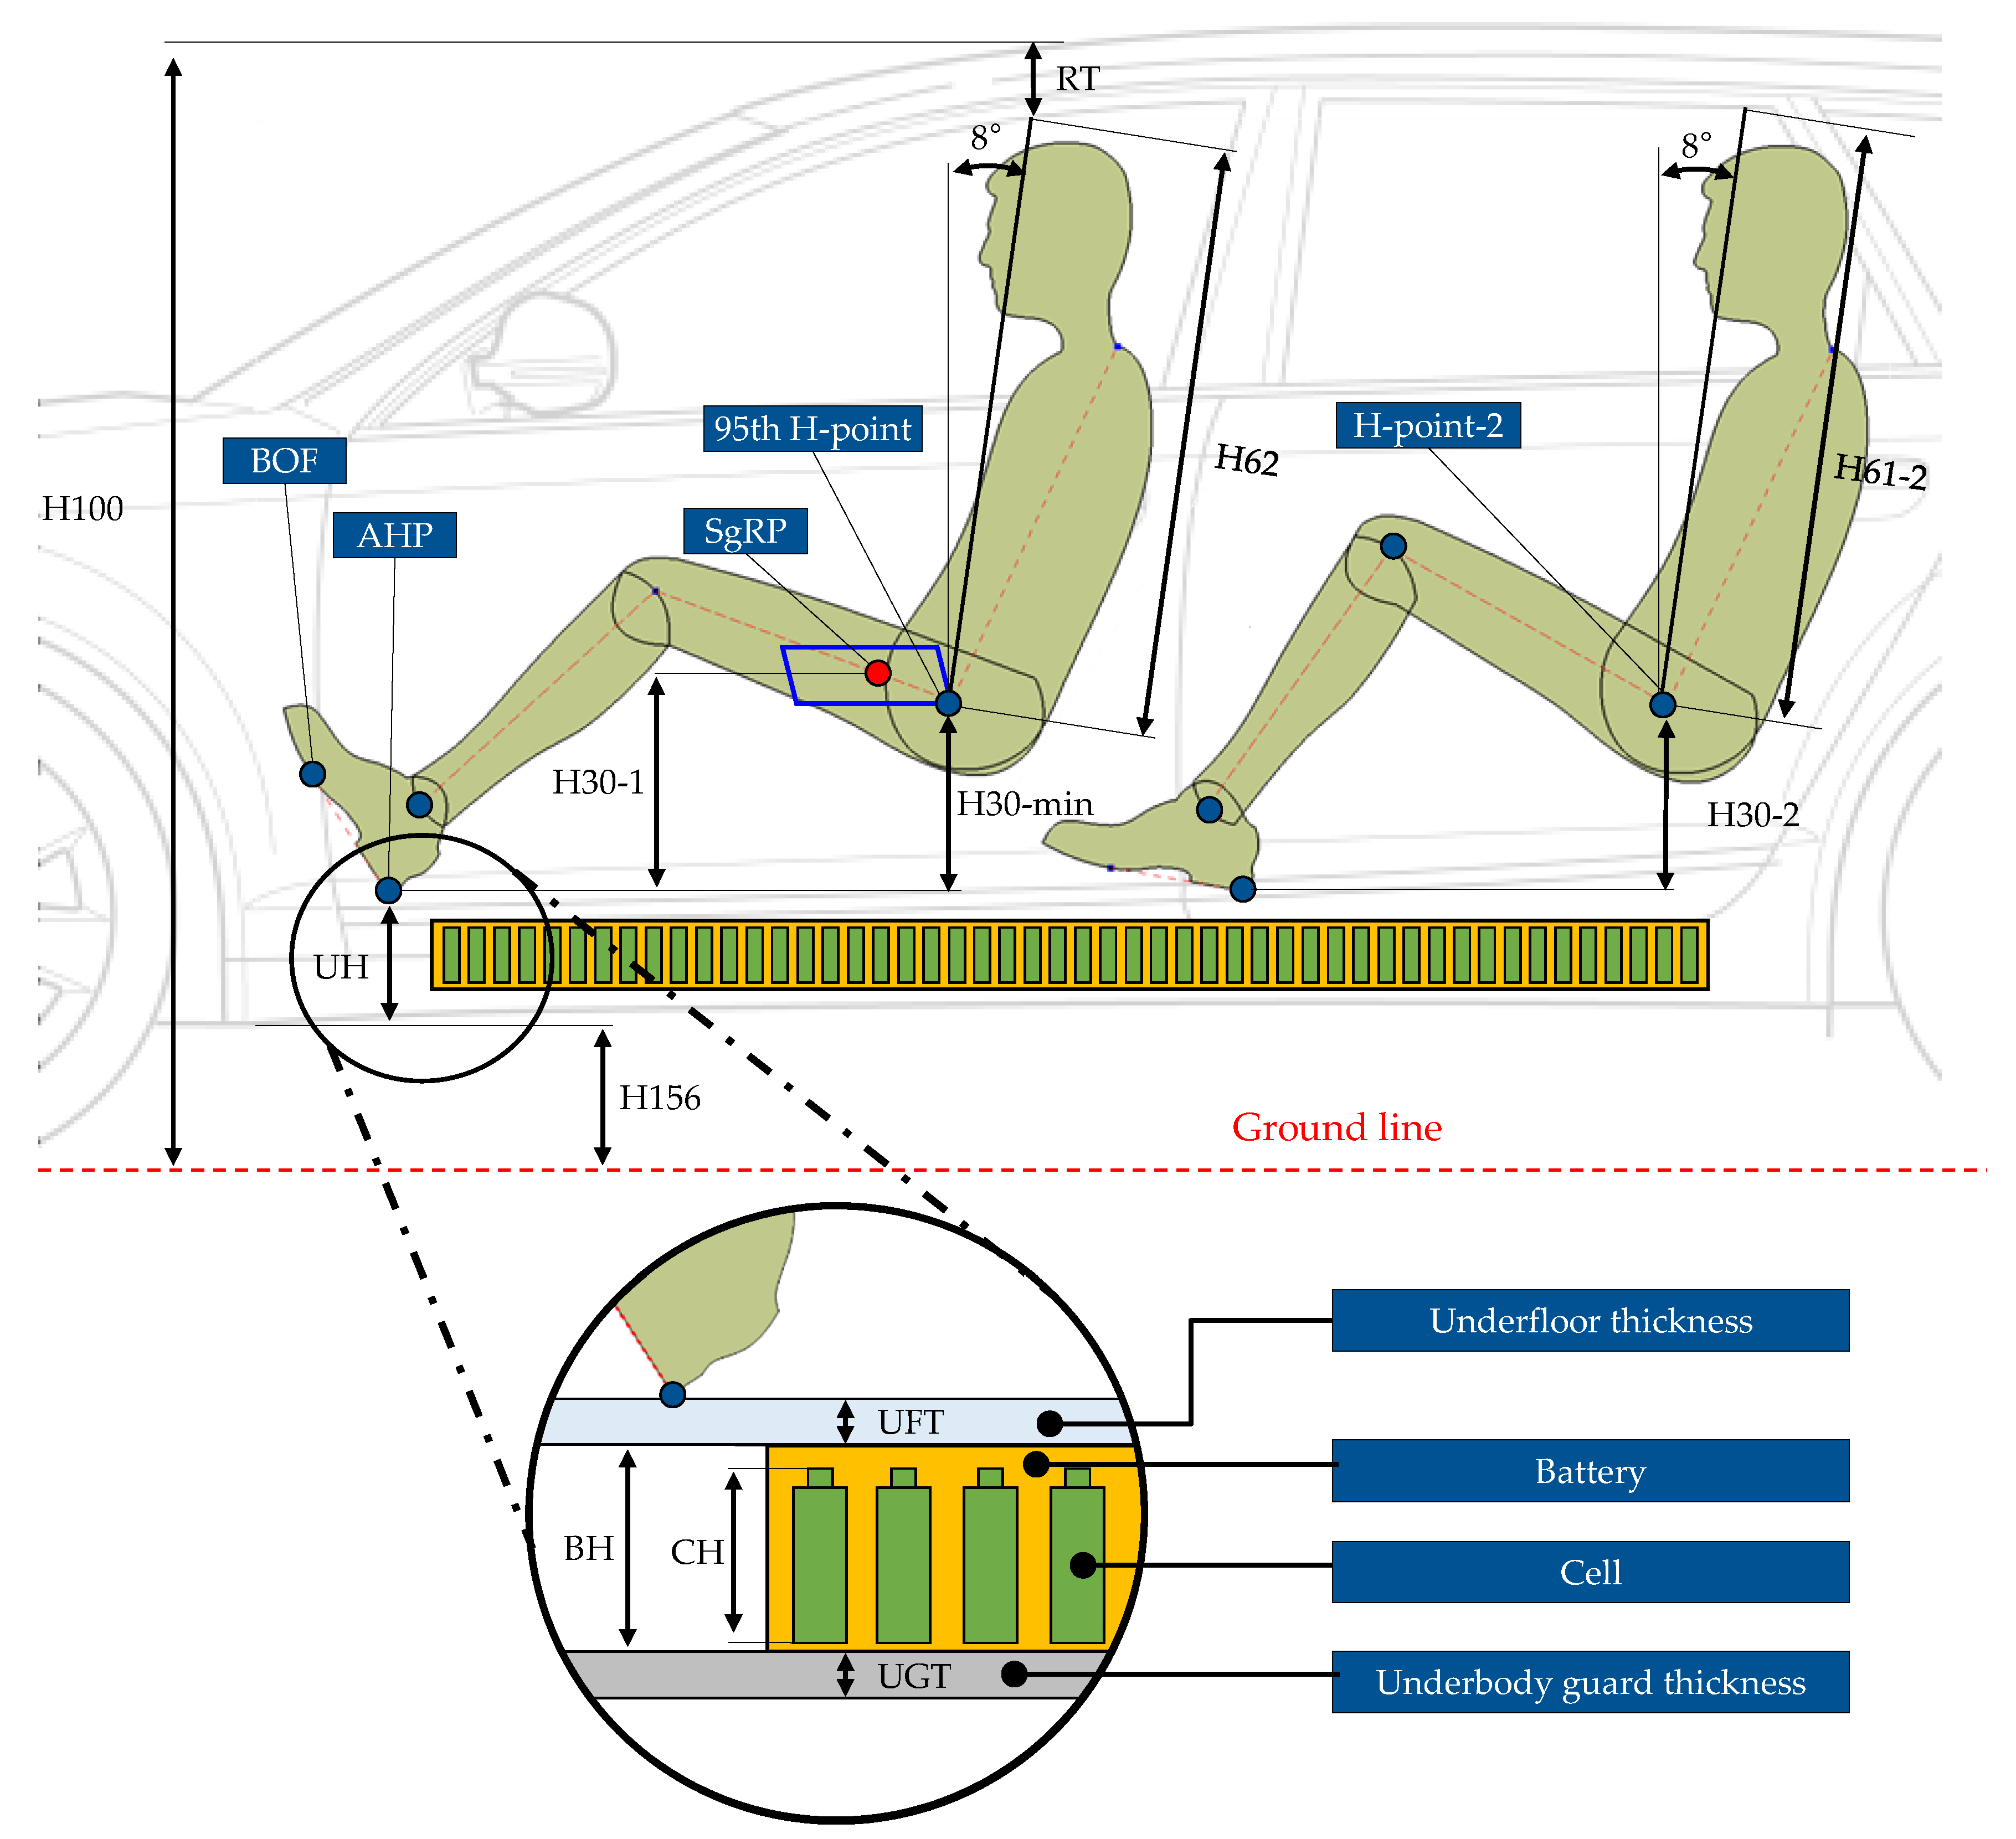
These dimensional chains describe the passenger compartment’s height. These chains are particularly important for describing the interaction with the traction battery. We identify two dimensional chains, one for the first row of seats and one for the second. For the sake of simplicity, we consider both the total vehicle height and the heel point height to be identical in both seat rows. Figure 6 further illustrates the elements of the chain.

Figure 6.
Overview of the dimensional chains in the Z-direction [26].
The ground clearance between the axes (H156) is defined by various guidelines. Examples for off-road vehicles include the light-duty truck (LDT) guideline [17] (pp. 85–87) in the US or the M1G standard in the EU [16]. These guidelines do not apply to non-off-road vehicles. In the latter case, there is no guideline either in Europe or in the U.S. Nevertheless, ground clearance standards do exist which apply to all passenger cars, e.g., the Australian [35] and South Korean standards [36].
The underbody height (UH) varies according to the manufacturer and the installed cell geometry. BEVs normally have a higher UH as ICEVs due to the required space for the traction battery. Given the cell height (CH), it is possible to derive the required UH using Equation (10), in which UFT is the underfloor thickness, UGT is the underbody guard thickness, and PFZ the cell packaging factor in the Z-direction. The latter represents the ratio between the CH and the battery height (BH). The PFZ has to be derived empirically based on the evaluation of existing vehicles. One approach for the derivation of packaging factors can be found in [37] (p. 65).
UH = UFT + UGT + CH/PFZ
The height of the driver’s AHP results in the addition of UH and H156. Using this point, we can derive the position of the 95th H-point. For this purpose, we need to calculate H30-min. H30-1 at the SgRP is provided in most of the sources (including a2mac1), which means that H30-min has to be derived from H30-1. This can be done by using the simplified H-point travel path presented in Figure 3, as in Equation (11).
H30-min = H30-1 − (TH28 − TH33)
We then add the maximum effective headroom H62 to H30-min. H62 denotes the driver’s required space including the torso, head, and headroom (Figure 6). The size of the driver’s body parts is fixed and standardized [24] (p. 9). H62 is defined along a line inclined by 8° from the Z-axis [23] (p. 52). Finally, adding the roof thickness (RT), the total vehicle height H100 can be calculated as in (12).
H100 = H156 + UH + H30-min + H62 × cos(8°) + RT
For the second row of seats, the SAE only defines an effective headroom (H61-2, Figure 6) and not a maximum effective headroom (H62). Furthermore, as this row usually does not have adjustable seats, no distinction between H30 and H30-min has to be made. Therefore, the H30 for this seat row is simply defined as H30-2. This simplifies the derivation of the total vehicle height for the second row of seats, as shown in (13).
H100 = H156 + H68 + H30-2 + H61-1 × cos(8°) + RT
2.5. Definition of Passenger Compartment Volume
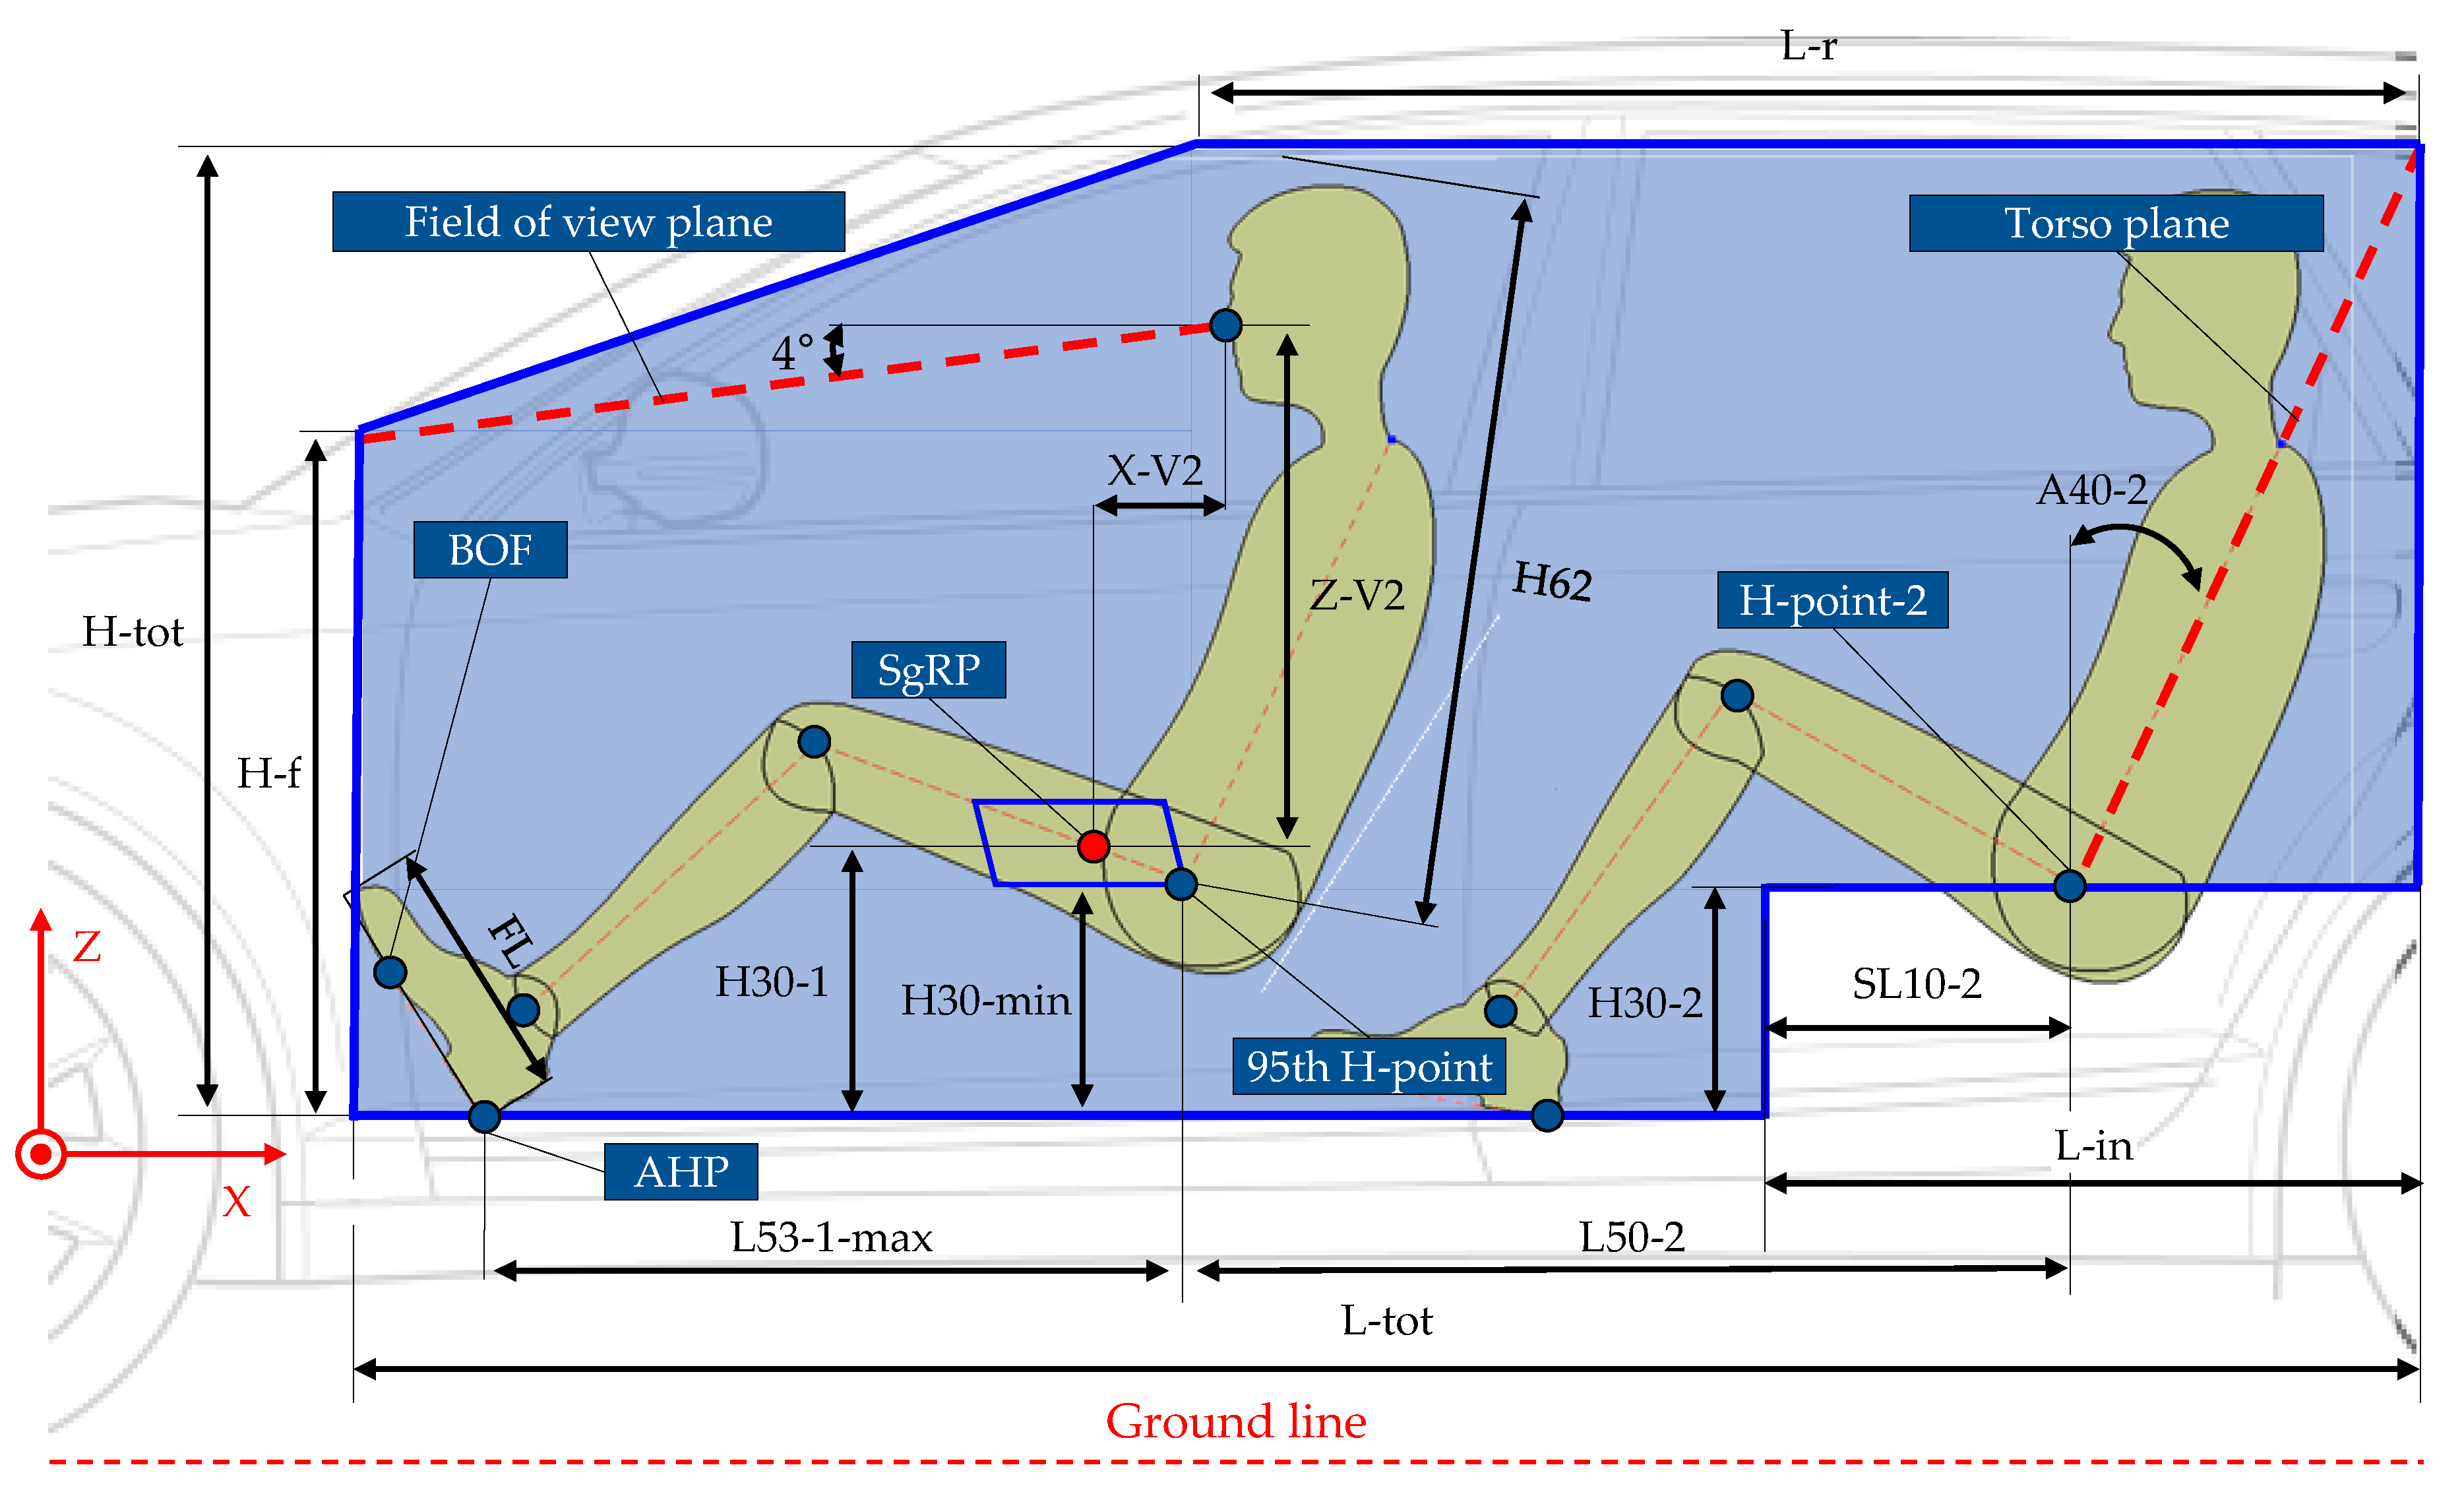
Finally, combining the previously presented dimensional chains, we derive an estimation model for the passenger compartment volume (Figure 7). In this case, a 2D-representation is sufficient because the dimension in the Y-direction is kept constant at the W3-1 value described in Equation (9).

Figure 7.
Definition of the passenger compartment volume [26].
To model the volume limits at the front windshield we use the field of vision defined by the United Nations Economic Commission for Europe (UNECE). In the regulation R 125 [22], the UNECE defines the terms and conditions for the driver’s field of vision. This regulation defines the position in the X- (X-V2) and Z-directions (Z-V2) of the V2-point relative to the SgRP position [22] (p. 43). The V2-point describes the position of the driver’s eyes. As shown in Figure 7, in order to guarantee the driver’s field of vision, it is required that there is no obstruction in the field of vision plane which starts from V2 and is inclined at a 4° angle with respect to the horizontal plane [22] (p. 43). This regulation is ideal for modeling the vertical position of the windshield. Equation (14) defines the front height of the volume (H-f) using the position of the V2-point, the foot length (FL), and other measures, which were presented earlier hereinabove.
H-f = H30-1 + Z-V2 − [(X-V2 + L53-1-max + FL × cos(A47)) × tan(4°)],
Equation (15) derives the total passenger compartment height (H-tot).
H-tot = H30-min + H62 × cos(8°)
Regarding the compartment length, there are three components: the rear length (L-r), the length of the second row incision (L-in), and the total length (L-tot).
L-r starts from the 95th H-point for the driver and extends until the torso plane of the second row of seats. The torso plane goes through the H-point of the second seat row and is inclined with respect to the Z-axis at an angle, which corresponds to the torso angle of this row of seats (A40-2). We use a typical value of 25° for the modeling of A40-2. Equation (16) depicts the formula for the derivation of L-r.
L-r = L50-2 + (H-tot − H30-2) × tan(A40-2)
The L-in is defined in order to model the space beneath the second row of seats. In some vehicles, like the Audi e-tron, this space is used to install a second battery level [38] (p. 19), thus achieving a higher battery capacity. For the definition of L-in we use the effective cushion depth at the second seat row SL10-2, which defines the distance between the H-point and the front end of the cushion [23] (p. 60). Using the measures introduced in the previous section, L-in is calculated as:
L-in = SL10-2 + [(H-tot – H30-2) × tan(A40-2)],
Subsequently, using the previously calculated L-r, the L-tot is derived as:
L-tot = FL × cos(A47) + L53-1-max + L-r,
Finally, the passenger compartment volume is set up via the components defined above:
V-tot = W3-1 × [((L-tot − L-in) × H-f) + (L-in × (H-tot − H30-2))
+ (L-r × (H-tot − H-f)) + 0.5 × ((L-tot − L-r) × (H-tot − H-f))]
+ (L-r × (H-tot − H-f)) + 0.5 × ((L-tot − L-r) × (H-tot − H-f))]
3. Results
In this section, we present the results of our research. We conduct an evaluation of the individual chain components, describing their typical values or deriving linear regressions for their modeling. In addition, we show how to model the space for the battery in the Z-direction and conduct a validation of the passenger compartment’s volume model.
3.1. Results for the Dimensional Chain in X
Table 1 further illustrates the values derived for the measures of the dimensional chain in the X-direction. The table lists the categorization applied to each measure, the number of samples (NoS), the resulting mean value (µ), the standard deviation (σ), and the coefficient of variation (CoV). For the derivation of L53-1-max as in Equation (4), the manikin dimensions and the angles A46 and A44 are required. The manikin dimensions are documented in the SAE standards, so they are not listed in the table. Regarding the ankle angle A46, the data analysis shows that the recommended value of 87° [25] (p. 30) corresponds to the values shown by the vehicles in our database. For the knee angle A44, the data analysis shows a variation of between 120° and 135°; the database mean value is shown in Table 1.

Table 1.
Overview of the empirical values for the dimensional chain in the X-direction.
For the derivation of L99-2, we divided the vehicles according to their coupling, thus deriving three different categories for the L50-2 measure (Table 1). The long coupling case only occurs in one vehicle and is therefore negligible. Either standard or short coupling occurs in all of the remaining vehicles.
Table 1 also presents the horizontal components (TL28 and TL33) of the H-point travel path. As mentioned earlier each manufacturer defines their own travel path dimensions. For the modeling, we therefore derive an average travel path based on all of the travel paths in the database. The given values of TL28 and TL33 can be used to model a realistic H-point travel path.
Using a constant value, we calculate the effective cushion depth of the second seat row SL10-2, which is required for the volume calculation. The data analysis showed that a distinction between frame-form is not statistically relevant, so we then considered all vehicles together.
The L53-1-max value is not listed in the table because it can be calculated using Equation (4). To test the correctness of the formula, we validate it using our database. To do so, we first collect all of the actual L53-1-max and H30-min values for each vehicle contained in the database. Subsequently, we use the actual values of H30-min as an input for Equation (4), thus deriving a calculated value of L53-1-max for each vehicle. To use Equation (4), we also need the values for A47 and A46. We model A47 using the method presented in [25] (p. 16) and model A46 using the constant value presented in Table 1. Finally, we compare the calculated values for L53-1-max with the actual values. To quantify the deviation between the calculated and the actual values we use the mean absolute error (MAE) and the normalized absolute error (nMAE). The MAE of the calculated values with respect to the actual values is 25.9 mm. The actual values for L53-1-max are in the range from 800 mm and 1000 mm, so a MAE of 25 mm is relatively low. The corresponding nMAE is 2.7%, so the calculated values have a mean deviation of 2.7% from the actual values.
This deviation is caused by the fact that different vehicles have also different A44 and A46 values. Our evaluation still shows that it is possible to model the legroom of the driver using only one input, i.e., the H30-1, and with a relatively low error.
3.2. Results for the Dimensional Chain in Y
To evaluate the W20-1 measure we test its correlation with W117 and the engine installation. As explained earlier in Section 2.3, we expect a dependency based on the engine installation. Therefore, we divide the database into ICEV with a longitudinal engine, ICEV with a transverse engine and front wheel drive, and BEVs. For the BEVs, we only consider purpose design vehicles. Table 2 shows the resulting linear regressions. The linear regressions describing the ICEV with a transverse engine shows parameters differing from the longitudinal engine case, which confirms the influence of the engine installation. Furthermore, the parameters for the BEV regression are similar to the ICEV transverse case. This result confirms that the W20-1 for BEVs can be modeled similarly to ICEVs with a transverse engine. We also evaluate the W20-1 mean values for the three cases, which are further illustrated in Table 3. The difference between transverse and longitudinal as well as the similarity between transverse and the BEV case is evident in this evaluation as well.
Table 2.
Derived linear regressions showing the correlation between W20 and engine installation.
Table 3.
Overview of the empirical values for the dimensional chain in the Y-direction.
Regarding the seat width SW16-1, we test different variables to find a correlation between vehicle width and seat width. The evaluation does not show any statistically relevant correlation. Therefore we derive a constant value for the seat width (Table 3). The derived value, 506.0 mm, is close to the 500 mm minimum hip clearance suggested by [39] (p. 6).
All vehicles must respect minimal requirements regarding shoulder and elbow room. For this reason, all vehicles have a similar WG-1, as confirmed by the relatively low standard deviation shown in Table 3.
For the DT, we try to evaluate the correlation with W117. The results show a statistical correlation between the two values evaluated using 98 vehicles. Although the corresponding R2 is not particularly high (53%), the correlation in Equation (20) can be used to derive a realistic door thickness.
DT = −100.89 mm + 0.17 × W117
Otherwise, it is also possible to use the constant value presented in Table 3.
3.3. Results for the Dimensional Chain in Z
Table 4 further illustrates the values for the measures of the dimensional chain in the Z-direction. Regarding H156, we distinguish between SUVs and non-SUVs vehicles. We assume that all of the SUVs vehicles have either an LDT or a M1G certification. According to [16] (pp. 62–63), [17], (p. 85), one of the minimum requirements for the M1G and LDT classes is having a ground clearance of at least 200 mm between the front and the rear axle. The data evaluation shows that almost all SUVs (except for four vehicles) have a value higher than 200 mm, which confirms our supposition. The ground clearance value of non-SUVs is lower than the one for SUVs. According to the South Korean Standard, all vehicles must have at least 120 mm of ground clearance [36] (p. 6). This is the case for all non-SUV vehicles, and the resulting mean value is listed in Table 4.
Table 4.
Overview of the empirical values for the dimensional chain in the Z-direction.
The mean value of the UFT is evaluated using only BEVs and further illustrated in Table 4. Regarding the UGT, we are unable to derive any value with our database. We expect that the range and the mean value will be similar to the UFT. Regarding the PFZ, the cell type has to be taken into account. Therefore, we analyze the existing BEVs and derive typical values for the PFZ. Table 5 shows an overview of various vehicles and cell types. The package factors presented thereby only apply to the Z-direction, and model the effective space loss for the cell due to the presence of other components, e.g., the battery cover cooling plate, electrical wires; or module covers.
Table 5.
Typical PFZ values for various vehicles and cell types.
To model the H30-1 at the SgRP, we divide the vehicles according to their frame-form and generate three different constant values. We use the same categories as for H30-2, thus deriving three values. The values for the H-point travel path in the Z-direction (TH28, TH33) are also shown in Table 4. Together with the values presented in Section 3.1, it is possible to fully define the dimensions of the H-point travel path. Combining H30-1, TH28, and TH33 it is possible to derive H30-min, as shown in Equation (11).
Regarding the effective and the maximum effective headroom (H61-2 and H62), we divide the data using the same criteria as for H30-1. The second seat row is always positioned higher than the first, as shown from the difference between the mean values for H30-1 and H30-2. Because the height of the vehicle at the first and second row of seats is similar, this results in a smaller headroom for the second row, as confirmed by the difference between H61-2 and H62. For the roof thickness (RT), we suggest the value proposed by [40] (pp. 60–61).
As a final result for the dimensional chain in the Z-direction, we derive the formula describing the maximum installable cell height starting from a given H100, as shown in Equation (21). The values for the formula can be implemented using the results of Table 4 and Table 5.
CH = (H100 − H156 − H30-min − H62 × cos(8°) − RT − UGT − UFT) × PFZ
The maximum cell height is proportional to the capacity of the battery itself. Therefore, Equation (21) makes it possible to verify the influence of different passenger compartment values on the battery space and the installable capacity.
3.4. Results for the Volume
To test the effectiveness of the volume estimation model, we follow the same procedure applied to L53-1-max. Therefore, we collect all of the required parameters for Equations (14)–(19) from the database and calculate the real volume for each vehicle in the database.
To derive the calculated volume for each vehicle, we define four cases with different inputs. These are further illustrated in Table 6. In the first case, we use general inputs, i.e., H30-1 and W20-1. Furthermore, the inputs frame-form (hatchback/SUV/sedan) and coupling (standard/short) are used to select the corresponding constant values from Table 1, Table 3, and Table 4. For case 2, we also add the H30-2 value as an input in order to better model the second row of seats. For case 3, we add the L50-2 value to the inputs so that the coupling is no longer required as an input. Finally, for case 4, we also add the H62 value in order to exactly model the driver’s space in the Z-direction.
Table 6.
Overview of the evaluated scenario and the corresponding inputs.
As already done for L53-1-max, we derive a calculated volume for each case and each vehicle. Subsequently, we compare the calculated volumes with the real volumes and quantify the deviation with MAE and nMAE. The evaluation shows that, although case 1 requires a low number of general inputs, it still has a MAE of 158 L, which corresponds to a nMAE of only 4.7%. For the other cases, as the number of inputs increases, MAE and nMAE are also gradually lower.
This validation shows that, given a low number of inputs, it is still possible to achieve a satisfactory volume estimation.
4. Discussion and Conclusions
The novelty of this paper is the presentation of a complete set of dimensional chains for the passenger compartment and the simultaneous modeling of its interdependency with the battery space. The presented models are all evaluated using real vehicle data, and the authors provide all of the derived dimensional chain values. The latter approach permits usage of the method presented herein for other tools and purposes.
With regard to the modeling, we first identify the essential dimensional chains for modeling the passenger compartment volume. We compare different standards and derive a set of equations for the X-, Y-, and Z-directions. With a particular focus on the Z-chain, we derive the geometrical interdependency between battery and passenger compartment. In the scope of this paper, we only focus on the battery because the interdependencies and dimensional chains of other components, e.g., the electric motor, have already been researched in [2]. Subsequently, by combining the dimensional chain we generate an empirical model for estimating the passenger compartment volume. The following model validation is comprised of two steps: derivation of the chain’s values, and validation of the chain’s precision.
For the derivation of the chain’s values, we employ our database and assign a typical value to each chain’s measure. Whenever possible, we compare the derived values with the values prescribed by the standards in order to ensure the accuracy of the values. The database contains mainly ICEVs. However, this does not falsify our model because most of the elements of the dimensional chains are similar between BEVs and ICEVs. The elements in which a certain difference between ICEVs and BEVs is to be expected, e.g., underbody height (UH) and W20-1, are assessed separately by considering only BEVs. In addition, the database is implemented in the form of a dynamic database, as presented in [20] (p. 6), thus permitting the data to be continuously updated. By way of this implementation, it is possible to add new BEVs to the database and automatically update the models, thus ensuring that the dimensional chains are always up-to-date.
Regarding the model evaluation step, the L53-max model shows a low nMAE when implemented using only one simple input, the H30-min. The L53-max value accounts for more than half of the passenger compartment length and is therefore relevant to the volume estimation. The accuracy observed with just one required input enables utilization during early vehicle development. The volume estimation model has a low nMAE, and is therefore, also suitable for use in the early development phase. As shown in Table 6, the user can decide which input variables to use, which gives the model a high degree of flexibility.
In the upcoming investigation, we will use the volume derived from the volume estimation model as an input for an HVAC model. The HVAC model will be derived from a given passenger compartment volume, the required power for heating, ventilation, and air conditioning. We will then model the correlation between HVAC power demand and battery capacity requirements, thus correlating increases of HVAC power demand in corresponding increases battery required capacity, and, therefore, battery required space. In this way, we will be able to describe the effects of an increase or decrease in passenger compartment volume on the battery both geometrically (through the dimensional chains presented in this paper) and physically (through new HVAC requirements).
Author Contributions
As first author, L.N. defined the approach for the development of the presented method and identified the described dimensional chains. S.M. supported during his bachelor thesis with the creation and evaluation of the database. F.S. and A.K. supported by the definition of the concept and proofread the paper. M.L. made an essential contribution to the conception of the research project. He revised the paper critically for important intellectual content. M.L. gave final approval of the version to be published and agrees to all aspects of the work. As a guarantor, he accepts responsibility for the overall integrity of the paper. All authors have read and agreed to the published version of the manuscript.
Funding
This work was funded by the AUDI AG and the Technical University of Munich.
Acknowledgments
The authors would like to thank the colleagues of the AUDI AG in the persons of Alois Stauber, Martin Arbesmeier, and Maximilian Heinrich, who supported during the concept development. The authors would like to thank A2Mac1 EURL, in the person of Pir Ivedi, for the access to the A2Mac1 automotive benchmarking database.
Conflicts of Interest
The authors declare no conflicts of interest and the funders had no role in the design of the study; in the collection, analyses, or interpretation of data; in the writing of the manuscript, or in the decision to publish the results.
References
- ICCT. CO2 Emission Standards for Passenger Cars and Light-Commercial Vehicles in the European Union. Available online: https://theicct.org/publications/ldv-co2-stds-eu-2030-update-jan2019 (accessed on 20 August 2019).
- Felgenhauer, M. Automated Development of Modular Systems for the Vehicle Front of Passenger Cars. Ph.D. Thesis, Institute of Automotive Technology, Technical University of Munich, Munich, Germany, 2019. [Google Scholar]
- Raabe, R.; Maier, T.; Meyer-Eberling, J. Methodische Gestaltung von abgesicherten Maßkonzepten und parametrischen Package-Vorgabemodellen in der frühen Phase der Fahrzeugkonzeptauslegung. In Proceedings of the 4. Grazer Symposium Virtuelles Fahrzeug, Graz, Austria, 12–13 May 2011. [Google Scholar]
- Nicoletti, L.; Ostermann, F.; Heinrich, M.; Stauber, A.; Lin, X.; Lienkamp, M. Topology Analysis of Electric Vehicles, with a Focus on the Traction Battery. Forschung im Ingenieurwesen 2020, submitted, unpublished. [Google Scholar]
- Müller, A. Systematische und nutzerzentrierte Generierung des Pkw-Maßkonzepts als Grundlage des Interior- und Exteriordesign. Ph.D. Thesis, Institut für Konstruktionstechnik und Technisches Design, Universität Stuttgart, Stuttgart, Germany, 2000. [Google Scholar]
- Raabe, R. Ein rechnergestützes Werkzeug zur Generierung konsistener Pkw-Maßkonzepte und parametrischer Designvorgabe. Ph.D. Thesis, Universität Stuttgart, Stuttgart, Germany, 2013. [Google Scholar]
- Mau, R.J.; Venhovens, P.J. Development of a consistent continuum of the dimensional parameters of a vehicle for optimization and simulation. Proc. Inst. Mech. Eng. Part D J. Automob. Eng. 2014, 228, 591–603. [Google Scholar] [CrossRef]
- Mau, R.J.; Venhovens, P.J. Parametric vehicle mass estimation for optimisation. Int. J. Veh. Des. 2016, 72, 1. [Google Scholar] [CrossRef]
- Kuchenbuch, K.; Stieg, J.; Vietor, T. Individual concepts for electric vehicles: Interaction between battery package and vehicle concept. Volkswagen Konzernforschung—Volkswagen Group Research Wolfsburg. 2012. Available online: https://www.researchgate.net/publication/281968885_Individual_concepts_for_electric_vehicles_Interaction_between_battery_package_and_vehicle_concept (accessed on 7 February 2020).
- Fuchs, J.; Lienkamp, M. Technologies and Architectures for Electrified Vehicles. ATZ Worldw. 2013, 115, 4–10. [Google Scholar] [CrossRef]
- Tzivanopoulos, T.; Stieg, J.; Krasteva, P.; Vietor, T. Analysis of new freedoms in future vehicle interiors. In Proceedings, 14. Internationales Stuttgarter Symposium; Bargende, M., Reuss, H.-C., Wiedemann, J., Eds.; Springer Fachmedien Wiesbaden: Wiesbaden, Germany, 2014; pp. 1475–1488. [Google Scholar]
- Stefaniak, T.; Maiwald, D. Ermittlung nutzbarer Bauräume für Energiespeicher auf Hochvoltebene in Elektrofahrzeugen mit dezentralisierten Antriebssträngen. In 13. Magdeburger Maschinenbau-Tage; Otto-von-Guericke-Universität Magdeburg, Otto von Guericke University Library: Magdeburg, Germany, 2017; Available online: https://www.researchgate.net/publication/320196213_Ermittlung_nutzbarer_Bauraume_fur_Energiespeicher_auf_Hochvoltebene_in_Elektrofahrzeugen_mit_dezentralisierten_Antriebsstrangen (accessed on 18 November 2019).
- Stefaniak, T.; Maiwald, D.; Püschel, G. Durch Maßkonzept und Algorithmen zur optimierten Fahrzeugbatterie. Konstruktion Zeitschrift für Produktentwicklung und Ingenieur-Werkstoffe 2018, 4, 67. [Google Scholar]
- Hahn, J. Eigenschaftsbasierte Fahrzeugkonzeption: Eine Methodik in der frühen Konzeptphase. Ph.D. Thesis, Institut für Maschinenkonstruktion, Otto-von-Guericke Universität, Magdeburg, Germany, 2017. Available online: https://ebookcentral.proquest.com/lib/gbv/detail.action?docID=5143843 (accessed on 10 January 2019).
- Felgenhauer, M.; Nicoletti, L.; Schockenhoff, F.; Angerer, C.; Lienkamp, M. Empiric Weight Model for the Early Phase of Vehicle Architecture Design. In Proceedings of the 14th International Conference on Ecological Vehicles and Renewable Energies (EVER), Nice, France, 17–19 October 2019. [Google Scholar]
- DIRECTIVE 2007/46/EC OF THE EUROPEAN PARLIAMENT AND OF THE COUNCIL of 5 September 2007 Establishing a Framework for the Approval of Motor Vehicles and Their Trailers, and of Systems, Components and Separate Technical Units Intended for Such Vehicles: 2007/46/EC. 2007. Available online: http://data.europa.eu/eli/dir/2007/46/oj (accessed on 15 November 2019).
- Federal government of the United States, Code of Federal Regulations, Section § 523.5—Light truck, 49 CFR 523.5. 1998. Available online: https://www.govinfo.gov/content/pkg/CFR-2007-title49-vol6/pdf/CFR-2007-title49-vol6-sec523-5.pdf (accessed on 8 May 2020).
- Federal Government of the United States, Code of Federal Regulations, Section § 523.2—Definitions, 49 CFR 523.2. 2018. Available online: https://www.govinfo.gov/content/pkg/CFR-2011-title49-vol6/pdf/CFR-2011-title49-vol6-sec523-2.pdf (accessed on 8 May 2020).
- Haug, J. Ganzheitliches Thermomanagement im E-Fahrzeug: Untersuchung eines Kältekreismoduls zum Heizen und Kühlen der Fahrgastzelle eines E-Fahrzeugs. Available online: https://www.tib.eu/en/search/id/TIBKAT%3A865960186/ (accessed on 1 February 2019).
- Nicoletti, L.; Schmid, W.; Lienkamp, M. Databased Architecture Modeling for electric Vehicles. In Proceedings of the Fifteenth International Conference on Ecological Vehicles and Renewable Energies (EVER), Nice, France, 10–12 September 2020. accepted. [Google Scholar]
- SAE J1052—Motor Vehicle Driver and Passenger Head Position. 2010. Available online: https://www.sae.org/standards/content/j1052_201009/ (accessed on 9 May 2020).
- Regulation No 125 of the Economic Commission for Europe of the United Nations (UN/ECE)—Uniform Provisions Concerning the Approval of Motor Vehicles with Regard to the Forward Field of Vision of the Motor Vehicle Driver: ECE R125. 2010. Available online: http://data.europa.eu/eli/reg/2010/125(2)/oj (accessed on 15 November 2019).
- SAE J1100—Motor Vehicle Dimensions, J1100. Available online: https://saemobilus.sae.org/content/J1100_200911/ (accessed on 8 May 2020).
- SAE J826—Devices for Use in Defining and Measuring Vehicle Seating Accommodation, J826. Available online: https://saemobilus.sae.org/content/J826_201511/ (accessed on 8 May 2020).
- SAE J4002—H-Point Machine (Hpm-Ii) Specifications and Procedure for H-Point Determination—Auditing Vehicle Seats, J4002. Available online: https://saemobilus.sae.org/content/J4002_201001/ (accessed on 8 May 2020).
- Audi, A.G. Ein Statement für Sportlichkeit. Die Audi A4 Limousine. Available online: https://www.audi.de/de/brand/de/neuwagen/a4/a4-limousine.html (accessed on 1 February 2019).
- Felgenhauer, M.; Schöpe, F.; Bayerlein, M.; Lienkamp, M. Derivation, analysis and comparison of geometric requirements for various vehicle drivetrains using dimensional chains. In DS, 87, 4, Design Methods and Tools; Maier, A., Kim, H., Oehmen, J., Salustri, F., Škec, S., Kokkolaras, M., Eds.; Curran Associates Inc.: Red Hook, NY, USA, 2018. [Google Scholar]
- a2mac1. Home—A2Mac1—Automotive Benchmarking. Available online: https://portal.a2mac1.com/?redirect=http%3A%2F%2Fwww.a2mac1.com%2F%3Ffromredirect (accessed on 29 January 2020).
- Pischinger, S.; Seiffert, U. Vieweg Handbuch Kraftfahrzeugtechnik, 8th ed.; Springer Vieweg: Wiesbaden, Germany, 2016. [Google Scholar]
- Bubb, H. Automobilergonomie; Springer Vieweg: Wiesbaden, Germany, 2015; Available online: http://search.ebscohost.com/login.aspx?direct=true&scope=site&db=nlebk&AN=959251 (accessed on 15 March 2019).
- Westerhoff, M. Technik im Alltag: Volvo XC90 T8 Twin Engine. Available online: https://www.springerprofessional.de/plug-in-hybrid/hybridtechnik/technik-im-alltag-volvo-xc90-t8-twin-engine/10558034 (accessed on 24 March 2020).
- Baxter, J.; Carter, P.; Erekson, T.; Todd, R. UltraCapacitor Power for a Drag Racecar; SAE Technical Paper Series; SAE International: Warrendale, PA, USA, 2004. [Google Scholar] [CrossRef]
- Sven Eisenkrämer, M.Z. Der BMW i8 Plug-in-Hybrid-Sportwagen. Available online: https://www.springerprofessional.de/sportwagen/fahrzeugtechnik/testbericht-der-bmw-i8-plug-in-hybrid-sportwagen/16279112?searchResult=1.test%20plug%20hybrid%20sportwagen%20bmw%20i8&searchBackButton=true (accessed on 5 May 2020).
- Automobili, R. Concept_One|Rimac Automobili. Available online: https://www.rimac-automobili.com/en/hypercars/concept_one/ (accessed on 5 May 2020).
- Vehicle Configuration and Dimensions, Australian Design Rule 43/04. 2006. Available online: https://www.legislation.gov.au/Details/F2006L01430 (accessed on 15 August 2019).
- KMVSS—Regulations for Performance and Safety Standards of Motor Vehicle and Vehicle Parts, Molit Ord. 252. Available online: https://ec.europa.eu/growth/tools-databases/tbt/en/search/?tbtaction=search.detail&Country_ID=KOR&num=710&dspLang=en&basdatedeb=&basdatefin=&baspays=KOR&basnotifnum=710&basnotifnum2=&bastypepays=ANY&baskeywords= (accessed on 8 May 2020).
- Wiedemann, E. Ableitung von Elektrofahrzeugkonzepten aus Eigenschaftszielen. Ph.D. Thesis, Institute of Automotive Technology, Technical University of Munich, Munich, Germany, 2014. Available online: https://ebookcentral.proquest.com/lib/gbv/detail.action?docID=5022290 (accessed on 13 June 2019).
- Doerr, J.; Ardey, N.; Mendl, G.; Fröhlich, G.; Straßer, R.; Laudenbach, T. The new full electric drivetrain of the Audi e-tron. In Proceedings, Der Antrieb von Morgen 2019; Liebl, J., Ed.; Springer Fachmedien Wiesbaden: Wiesbaden, Germany, 2019; pp. 13–37. Available online: https://www.springerprofessional.de/the-new-full-electric-drivetrain-of-the-audi-e-tron/16768836?searchResult=5.audi%20e-tron&searchBackButton=true (accessed on 12 March 2020).
- Reed, M.P.; Schneider, L.W.; Ricci, L.L. Survey of Auto Seat Design; Technical Report; University of Michigan: Michigan, Germany, 1994. [Google Scholar]
- Krohn, A. Designing Geometric Substitute Models for Automated Concept Development. Master’s Thesis, Institute of Automotive Technology, Technical University of Munich, Munich, Germany, 2017. [Google Scholar]
© 2020 by the authors. Licensee MDPI, Basel, Switzerland. This article is an open access article distributed under the terms and conditions of the Creative Commons Attribution (CC BY) license (http://creativecommons.org/licenses/by/4.0/).