Article

An Efficient Internet-Wide Scan Approach Based on Location Awareness

1
Key Laboratory of Computing Power Network and Information Security, Ministry of Education, Shandong Computer Science Center (National Supercomputer Center in Jinan), Qilu University of Technology (Shandong Academy of Sciences), Jinan 250103, China
2
Shandong Provincial Key Laboratory of Computing Power Internet and Service Computing, Shandong Fundamental Research Center for Computer Science, Jinan 250001, China
3
Faculty of Computer Science and Technology, Qilu University of Technology (Shandong Academy of Sciences), Jinan 250103, China
*
Authors to whom correspondence should be addressed.
Future Internet 2025, 17(8), 330; https://doi.org/10.3390/fi17080330
Submission received: 3 July 2025 / Revised: 17 July 2025 / Accepted: 23 July 2025 / Published: 24 July 2025

Abstract

With increasing network security threats, Internet-wide scanning has become a key technique for identifying network vulnerabilities. However, traditional scanning methods tend to ignore the impact of geographic factors on scanning efficiency. In this study, we experimentally find that the geographic location of the scanner has a significant impact on scanning efficiency. Based on this finding, we propose a large-scale network scanning method based on geographic location awareness. The method divides scanners into multiple scanner clusters based on their geographic locations and designs a similarity matrix based on the average scanning time to quantify the scanning efficiency between two geographic locations. To avoid wasting scanning resources, we implement a load-balancing mechanism between scanner clusters and between nodes within each cluster. Experimental validation in a real network environment shows that the proposed method can effectively improve the scanning efficiency while ensuring the coverage.

1. Introduction

With the rapid development of the Internet, the number of active devices worldwide has exceeded billions, including servers, routers, personal computers, smartphones, and IoT devices. As a result, network security issues have also increased, such as hacker attacks, malware attacks, and data breaches, causing significant losses to businesses and individuals. In order to address these threats, the Internet-wide scanning technology came into being. This technology detects active hosts by sending network requests, helping researchers, security teams, and government agencies understand device distribution, identify security vulnerabilities, and take measures [1]. Studies on the Internet-wide scanning technology have received extensive attention both domestically and internationally. The research scope has evolved from improving the efficiency of scanning IP addresses [2] to exploring port scans [3,4] and has further extended from the exploration of the IPv4 address space [2,3] to the successful exploration of the IPv6 address space [5,6]. Many researchers have begun focusing on the issue of scan coverage, leveraging fast scanning tools like Zmap [7] and Nmap [8]. The goal is to ensure high scan rates while further improving the scan coverage. However, existing scanning tools and technologies still have several limitations, such as low efficiency. Traditional network address scanning tools typically use a sequential scanning method, resulting in slower speeds and an inability to complete large-scale network scans in a short period. Additionally, they lack accuracy. Current scanning tools may produce false positives and false negatives while identifying device types, operating systems, and services, leading to inaccurate scanning results.
Through extensive experiments, the study found that the geographic location of the scanning source significantly affects both the scanning speed and accuracy. Due to the existence of “geographic proximity”, when scanning domestic IP addresses, the scan origin generally exhibits higher coverage and faster speed compared to scanning IP addresses from other countries. This phenomenon can be attributed to the local network topology and routing strategies, which make local scans more efficient in accessing and identifying local hosts. In contrast, cross-border scans may be hindered by international link latency, firewall restrictions, and network policies [7]. Therefore, relying on a single geographic location cannot cover the entire IP address space and may result in losing partial coverage. For instance, in Japan, around 1% of HTTP hosts are only accessible domestically, which means that scanning nodes deployed in other countries cannot reach these hosts [9]. To discover as many live hosts as possible and overcome “geographic proximity”, it is necessary to adopt more accurate and comprehensive methods for further research.
The paper analyses the impact of geographic location on scanning through experiments. We found that the reasonable distribution of tasks based on geographic location can improve scanning efficiency effectively. Therefore, we propose an efficient scanning method based on a location-aware detection approach. Below, we present the contributions of this paper:
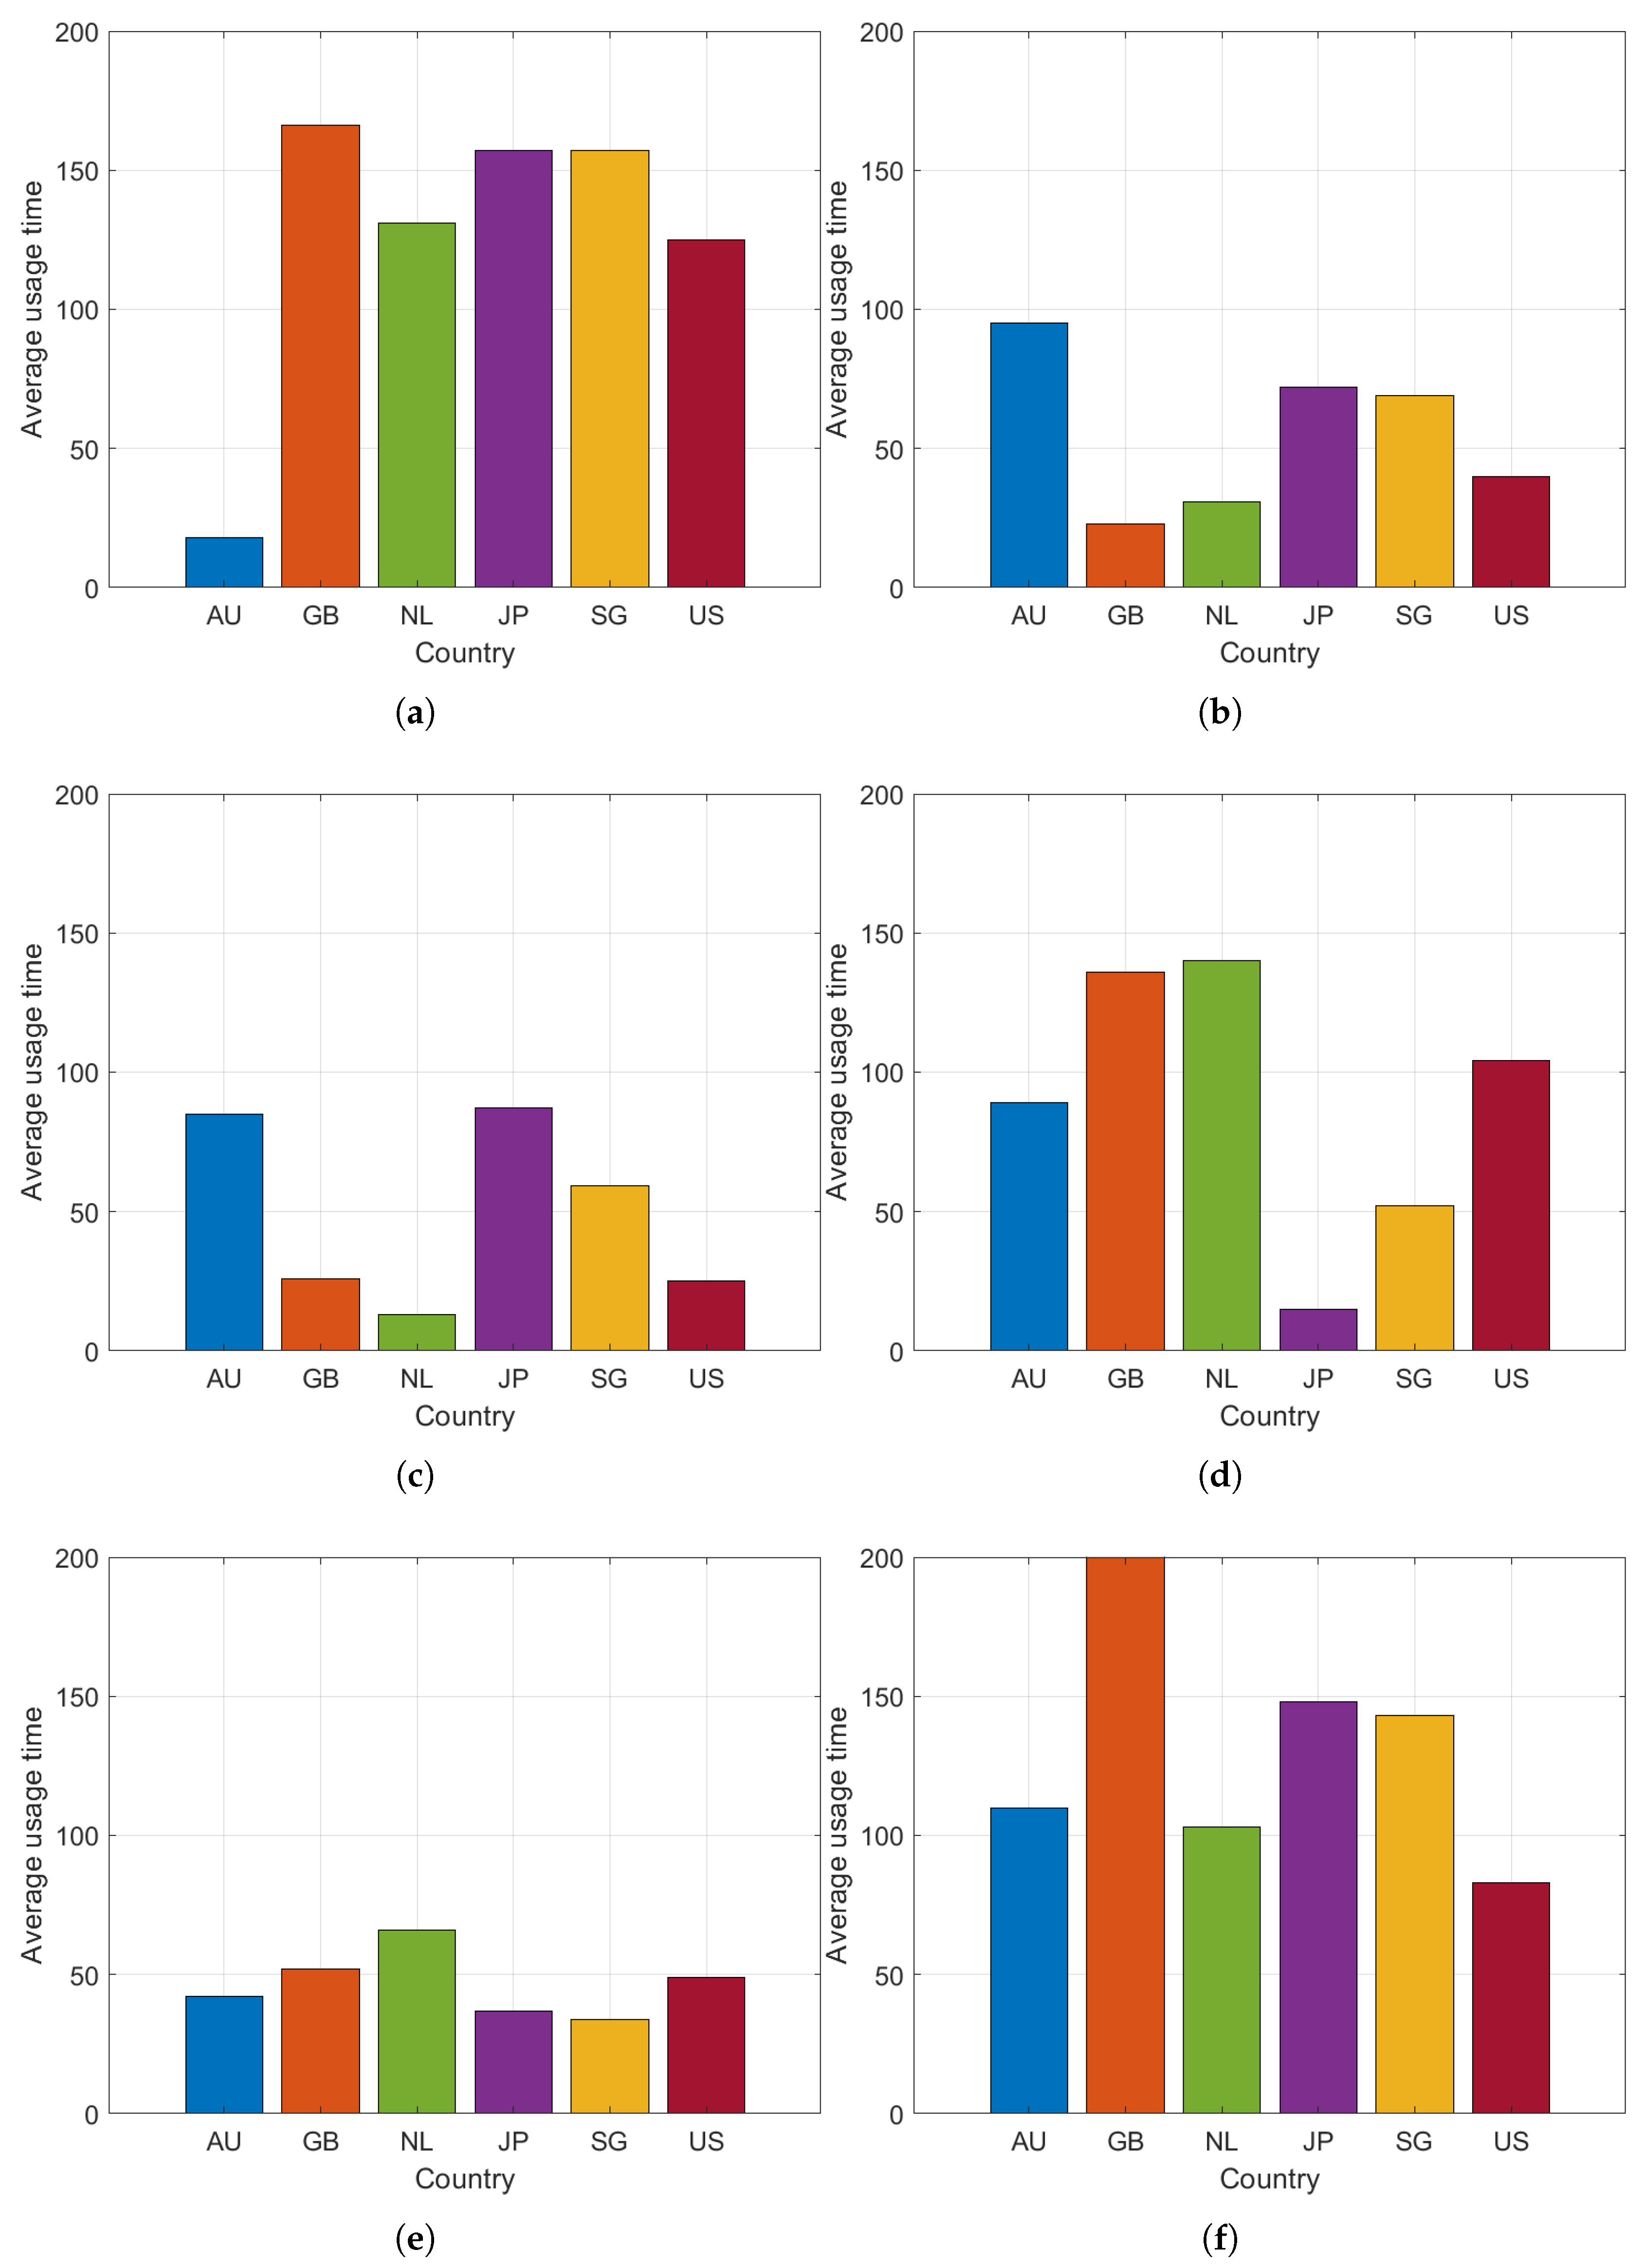
  • Through experiments, we introduced the concept of being location-aware. Specifically, scanning nodes in a particular country are more efficient when scanning their own country’s IP addresses compared to scanning IP addresses from other countries. This phenomenon indicates that geographical proximity has a significant positive impact on network scanning efficiency.
  • We propose a novel location-aware method that overcomes the limitations of geographical factors to achieve efficient network scanning. Using this method, we can more accurately identify live IP addresses across the entire network, significantly improving the detection scanning and accuracy of network resources.
  • We conducted experimental analysis in real-world network environments. Compared to existing methods, our scanning efficiency is more effective, thus demonstrating the validity of the proposed method.

2. Related Works

As mentioned above, this paper focuses on the geographical location of scanning node deployment. Currently, there are multiple studies in various aspects of Internet-wide scanning aimed at improving scanning speed. Based on the research content, works related to our study can be categorised into two types:
The first category is customised algorithm research targeting specific challenges in network probing. For example, Shikhar Verma et al. [10] proposed a method using environmental recognition algorithms to classify WLAN environments into different states, thereby improving scanning performance. F. Tang et al. [11] proposed a NAT traversal system based on reverse proxies for scanning ports behind NAT. This addresses the port scanning issue for devices with private IP addresses behind NAT by adaptively adjusting scanning frequency to balance network performance and security. Gong et al. [12] introduced a dynamic weighting method based on centroid calculation to build a baseline model for Internet port scanning, aiming to detect abnormal behaviors in the network by analysing changes in scanning traffic. L. Yanyan et al. [13] employed a Bayesian optimisation method to improve port scanning techniques in router port testing. The Bayesian optimisation-based port scanning technique constructs and updates a Bayesian optimisation model to select the optimal scanning strategy, thus improving the efficiency and accuracy of router port testing.
The second category of research focuses on the influence of various factors during the scanning process on the scanning results. For example, Padmanabhan et al. [14] conducted a longitudinal study over nine years using ten PlanetLab nodes distributed in different geographical locations to explore the impact of weather conditions on host downtime. They used multiple vantage points for redundancy but did not analyse the differences between vantage points. However, they recognised that hosts might not respond to all origins and correlated the probability of these drop events with various factors. In [15], it was noted that, apart from Germany, Brazil, and Australia, a large portion of affected networks were in China. This work indicated that packet loss on the path to China was abnormally high and unstable. In [16], the study investigated how the network used for Internet-wide scanning affects the results. It was found that a single scanning node’s single-probe scan could detect around 96% of HTTP(S) and 84% of SSH hosts worldwide. This is more than double the loss initially estimated by Durumeric et al. Moreover, the issue was not just due to uniform random packet loss. Host inaccessibility was caused by both temporary and long-term network problems.
Overall, existing scanning methods have achieved good results from different perspectives. However, there is currently a lack of effective multi-node cooperative scanning methods for large-scale network scanning. In this paper, we propose a location-aware scanning method, which applies geographic location to Internet-wide scanning. It is a multi-node collaborative approach that can effectively address large-scale network scanning.

3. Considered Scenario and Motivation

In this section, we will discuss the scenarios and motivations behind Internet-wide scanning.

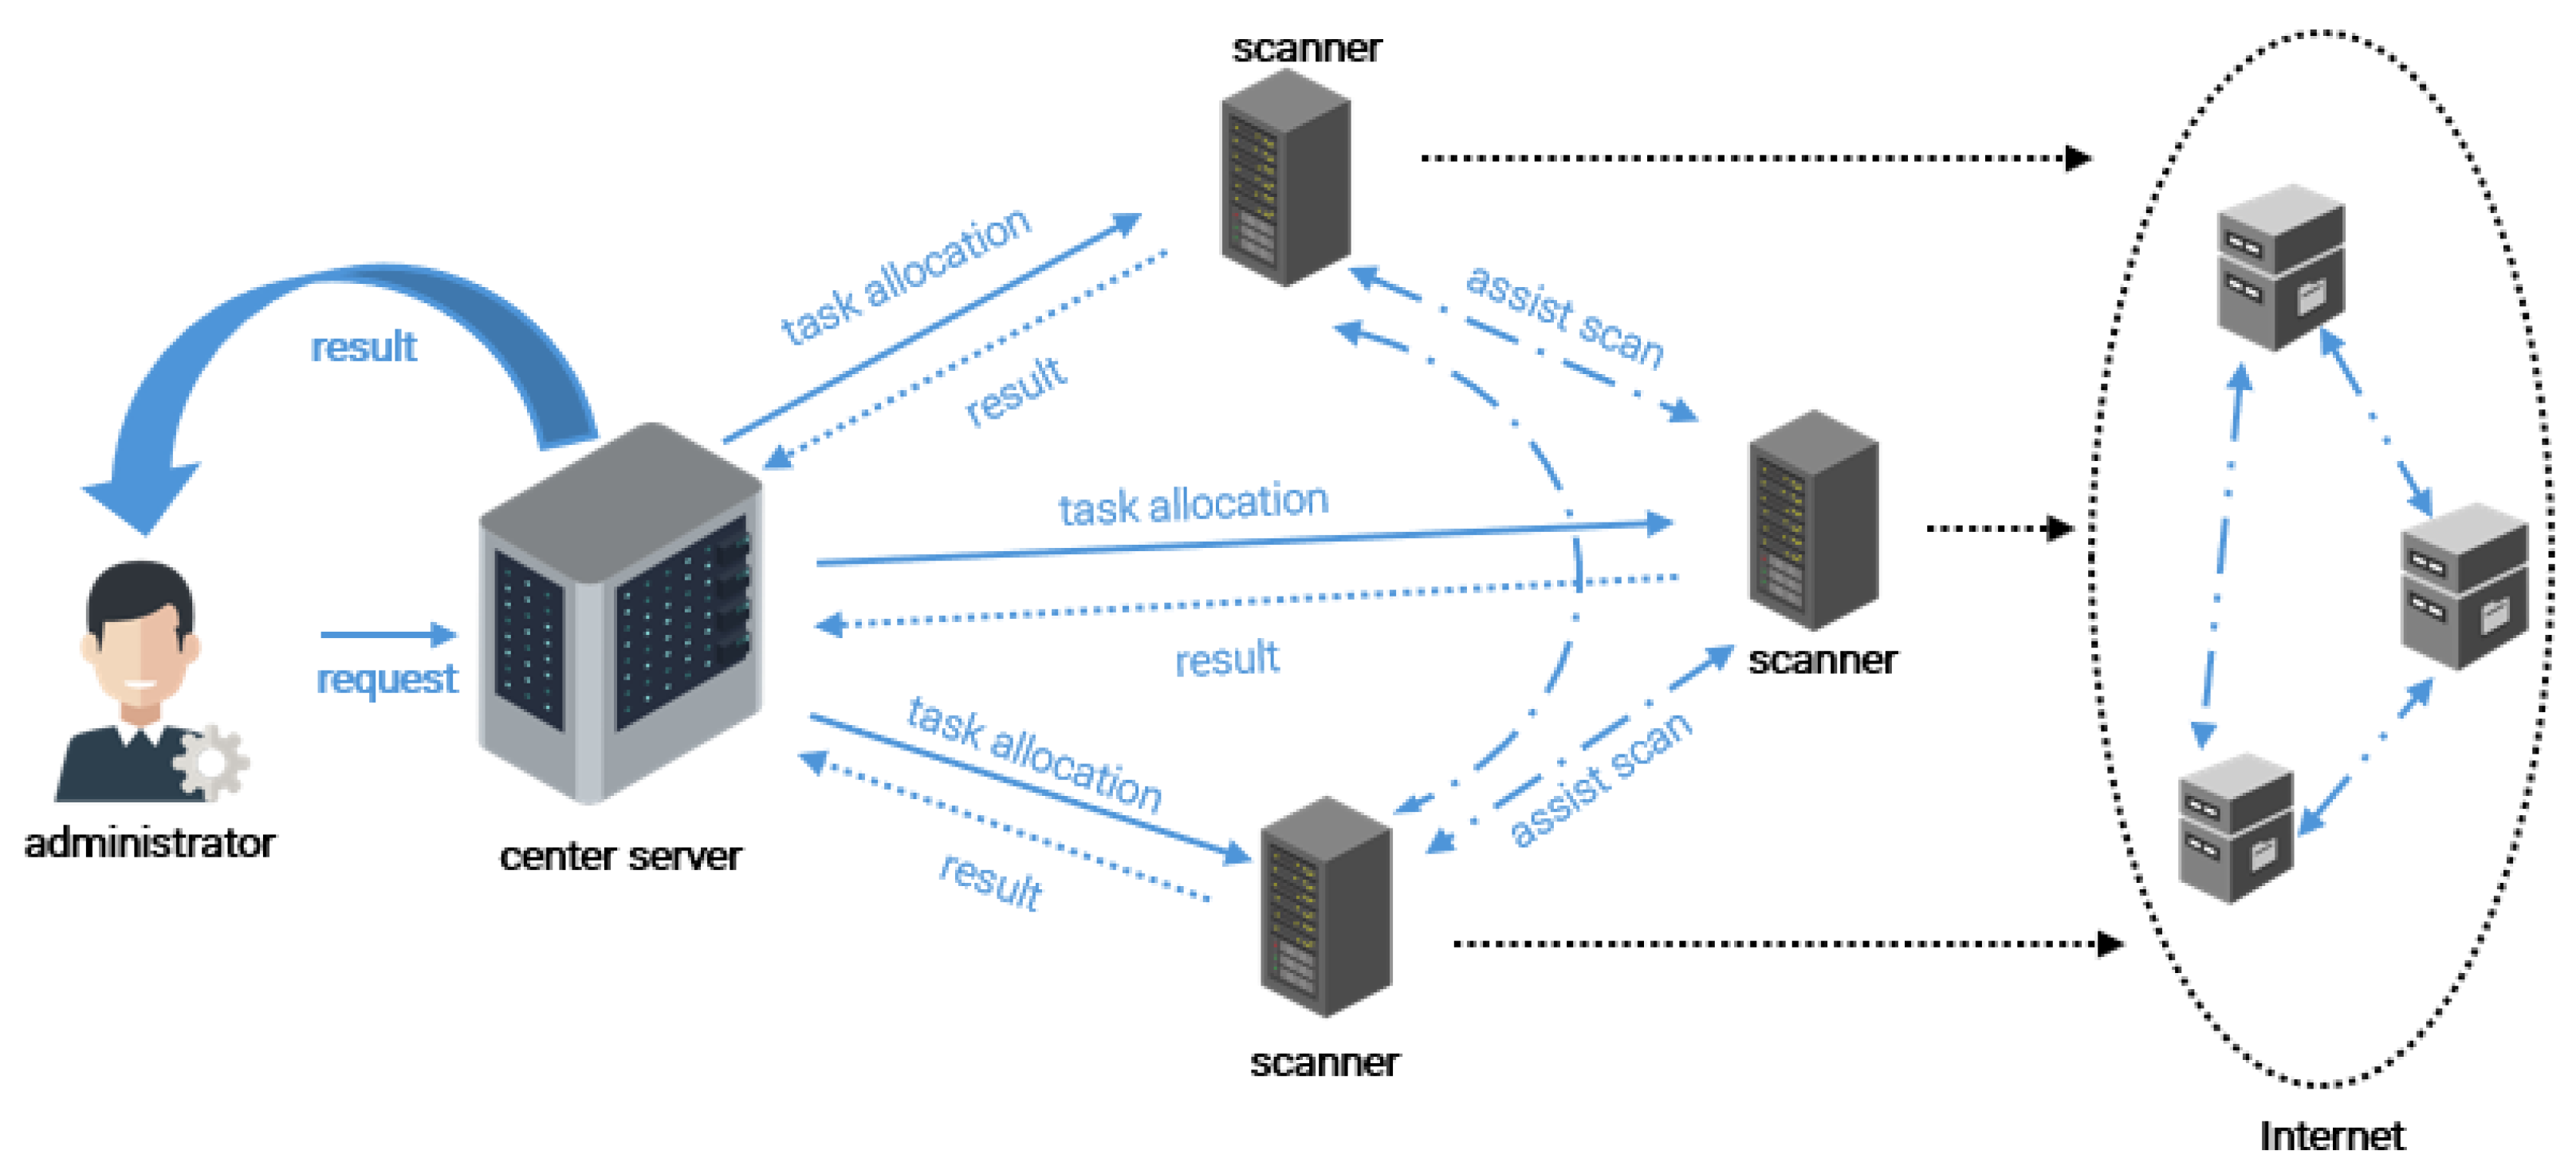
3.1. Considered Scenario
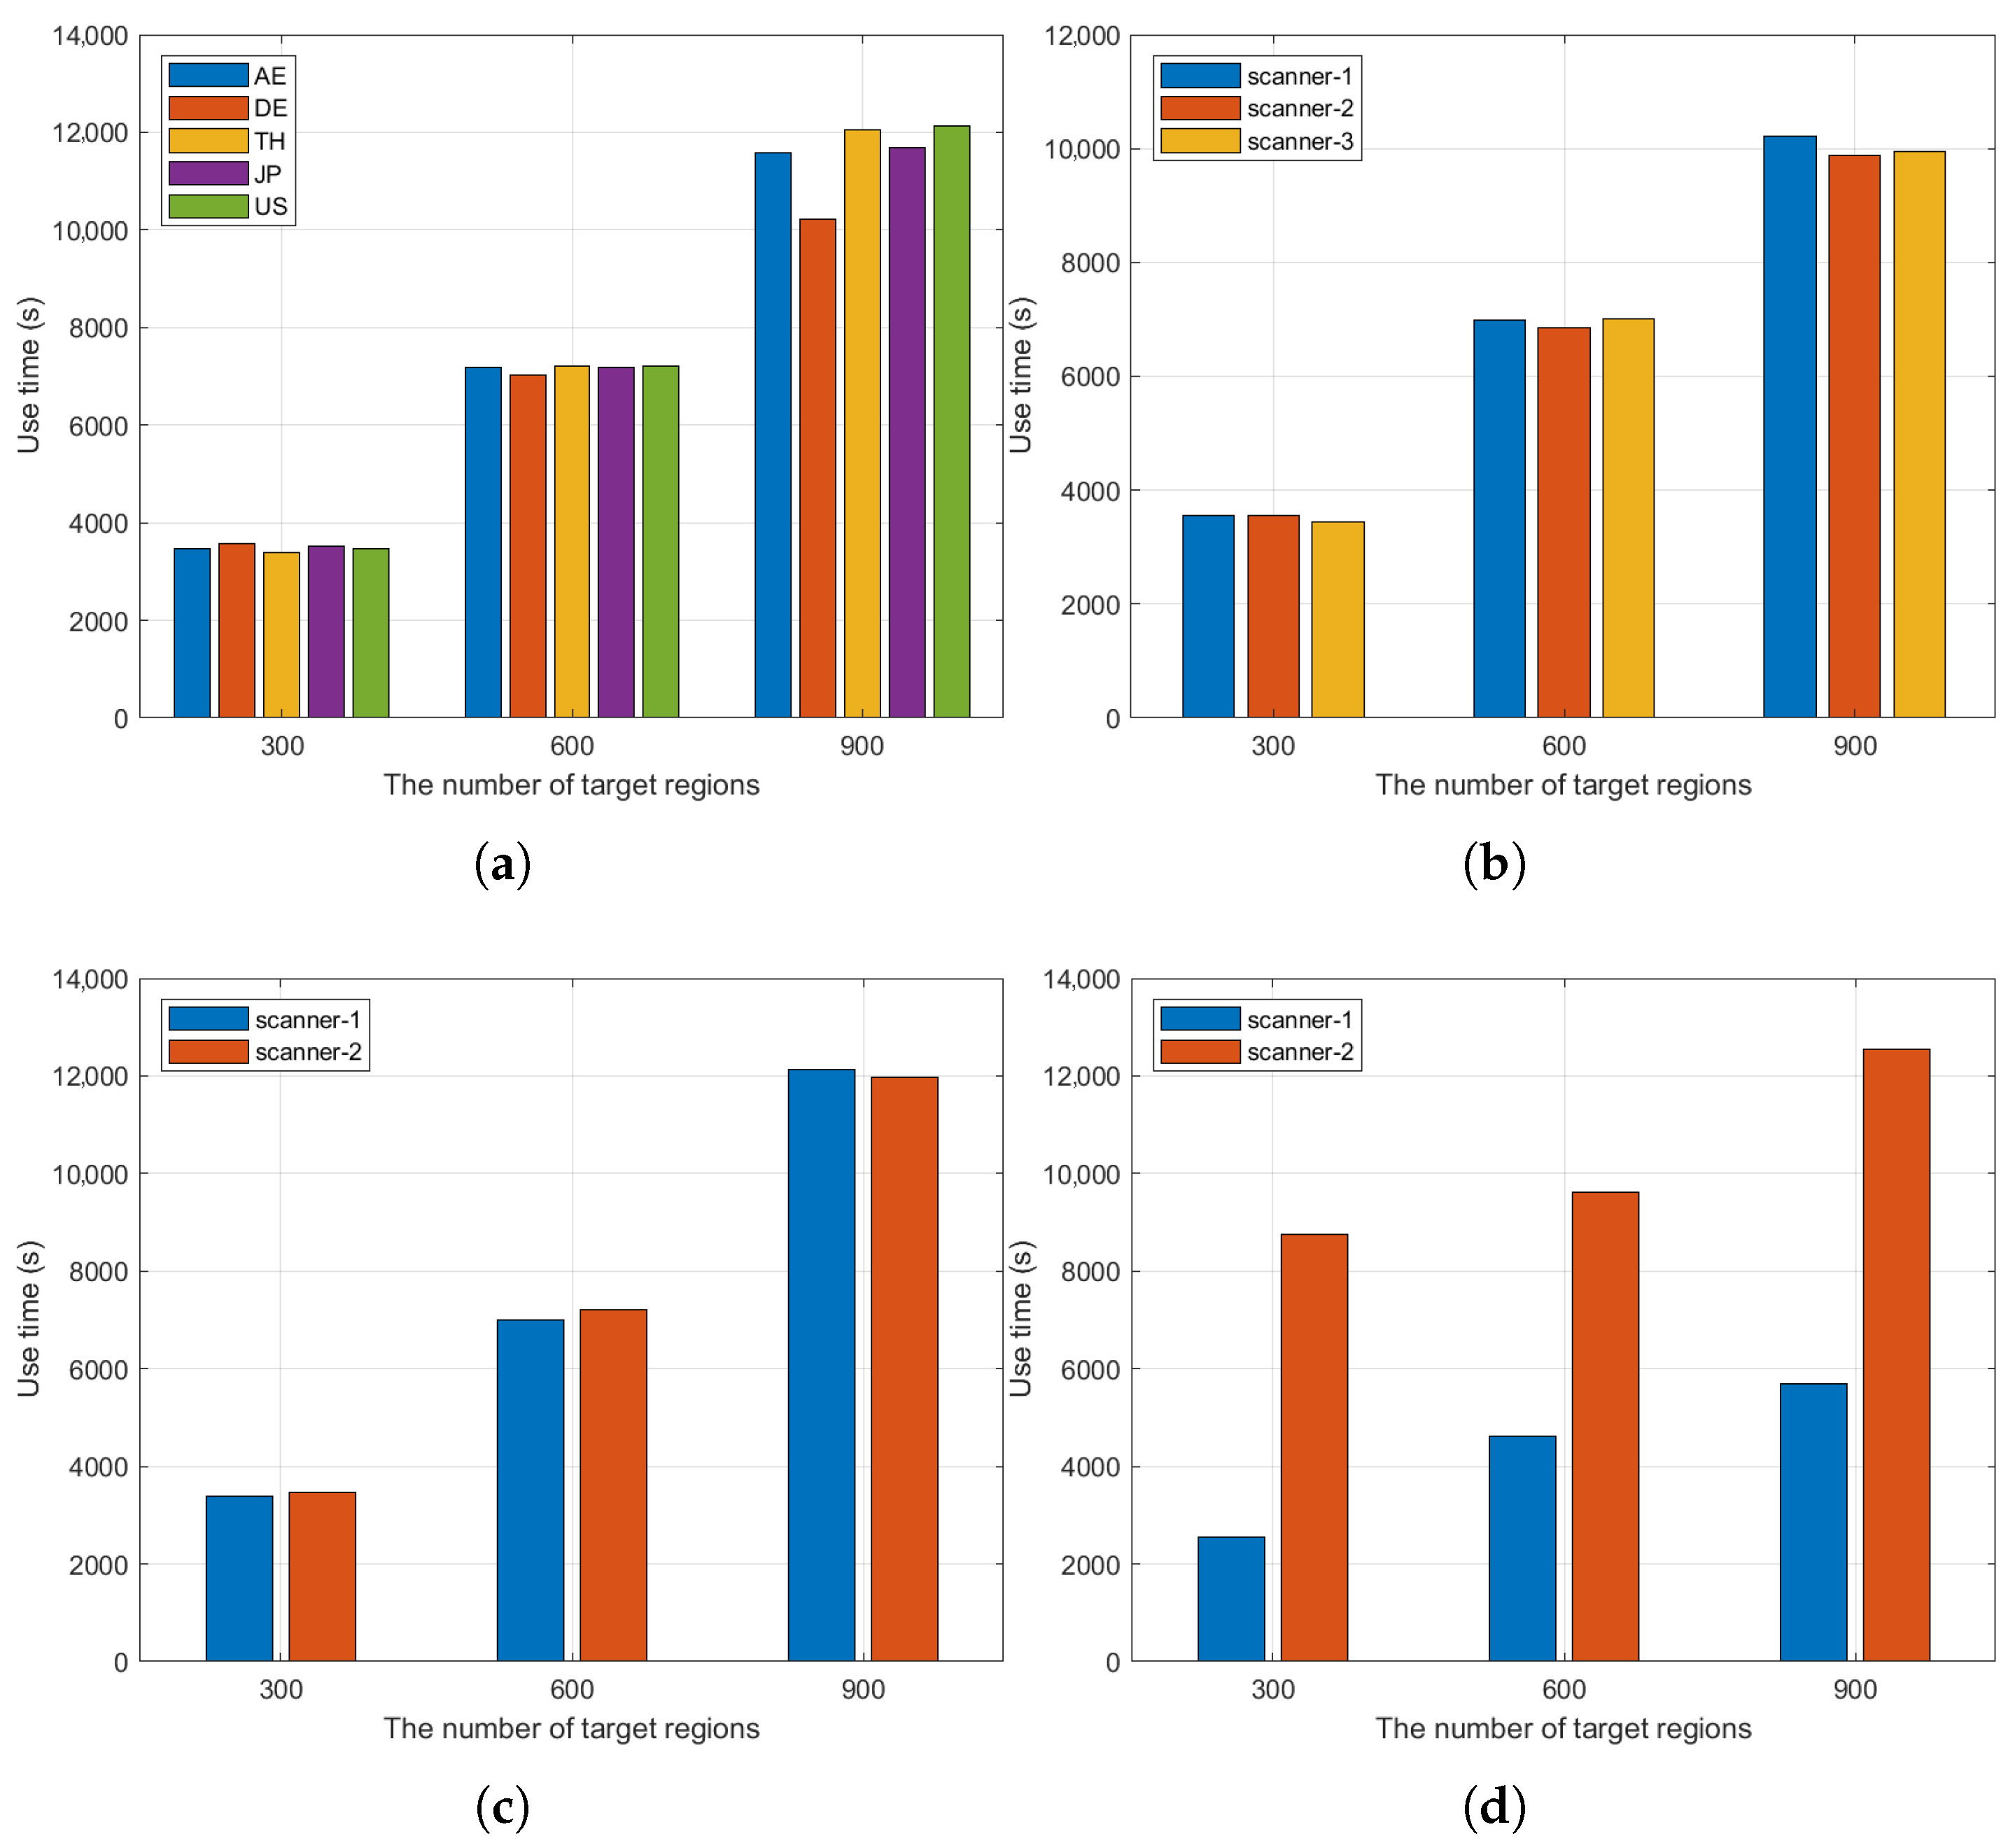
In this study, we focus on Internet-wide scanning. In an Internet environment, devices typically rely on the TCP/IP protocol for data transmission. The TCP/IP protocol is the foundation of modern network communication and is widely used for communication between various devices. As shown in Figure 1, network administrators often use specialised network scanning tools, such as Nmap, Zmap, and Masscan, to perform vulnerability scanning and security assessments in order to identify potential security risks and vulnerabilities in a timely manner.
Currently, there are various scanning methods available, one of which is TCP Connect Scan (full open scan). This paper primarily investigates the TCP Connect Scan method, which simulates a normal TCP connection process by sending an SYN packet to the target port. The status of the port is determined based on the received SYN-ACK or RST response. If an SYN-ACK response is received, the target port is open; if an RST response is received, the target port is closed. Additionally, there is a “filtered” status, which indicates that the state of the target port cannot be determined, as the probe packet may have been intercepted by a firewall, network device, or network congestion, preventing a response. In other words, the probe packet fails to receive the expected response (such as SYN-ACK or RST), leading to a timeout in the scanning tool’s waiting period. This situation directly affects the performance of the scan.

3.2. Motivation

Distributed scanning frameworks such as DNmap and Scantron usually adopt a random task assignment strategy when performing large-scale network scanning tasks. This means that the central server receives a task and randomly selects a scanner to perform the corresponding scanning task. Although this strategy is more common in distributed systems, it has significant drawbacks, especially in terms of scanning efficiency. Experimental data shows that scanners usually perform more efficiently when scanning IP addresses in their home countries, while they are significantly less efficient when scanning IP addresses in other countries. This conclusion is fully verified in the experiments of this study, and this finding provides a strong basis for improving the task scheduling mechanism.
The experimental results in Figure 2 clearly demonstrate the effectiveness of the location-aware model and further reveal the differences in scanning efficiency of scanning sources from different countries through visualisation charts. Different colours in the bar chart represent different countries (AU, GB, NL, JP, SG, US), while the horizontal coordinate is the target country and the vertical coordinate is the time required for scanning. As can be seen from the graph, the difference in scanning time between scanners from different sources when scanning the same target country is very significant. For example, in the task of scanning AU (Australia), scanners located in AU’s home country took significantly less time than scanners from other countries, while scanners from GB (UK) took the longest time to complete the task. The reason behind this phenomenon is not entirely determined by physical distance. Although geographically AU was farther away from GB than other scanning sources, this factor did not fully explain the scanning time differences. For example, even though SG (Singapore) is physically closer to AU than NL (the Netherlands), US (United States), and JP (Japan), the scanning time of the SG scanner is longer than that of the scanners in these countries. This suggests that the scanning efficiency of a scanner is not only related to the physical distance but also closely related to the ease of network access between different countries. Specifically, JP’s scanner is much smoother than SG’s scanner in scanning AU’s IP address, which may be related to factors such as the speed of cross-country data transfer.
Therefore, how to achieve efficient task allocation and ensure load balancing among scanners while taking advantage of geographical location has become a major challenge to be solved, and the next section will delve into the scanning node task scheduling mechanism. Note that the geographic location we refer to is not the physical distance but the network connection distance; some countries are physically closer, but the physical connection goes through multiple routes and firewalls and therefore has a higher latency, so the geographic location refers to the network routing location, not the real physical location. In addition, we recognise that differences in network routing within countries are not always negligible. However, in our experimental setup, we found that the scanning performance of major cities within the same country is essentially the same.

4. Proposed Approach

In this section, we first model the overall scan time based on the above-mentioned issues and then analyse the factors affecting scan efficiency according to the model, in order to propose a task scheduling method.

4.1. Delay Model

We consider that the overall scan rate is affected by the scan rate of the slowest scanning node. Therefore, the completion time of a scanning node can be predicted based on its remaining tasks and scanning rate. Since task scheduling is dynamic, when a scanning task needs to be matched with a scanning node, we need to jointly predict the completion time of the scanning node by taking into account the node i’s currently stored task volume ( TS i ), the task volume that node i is going to receive ( TR i ), and the execution speed of node i ( V i ). In order to accurately quantify and analyse the impact of these factors, we introduce a mathematical model that establishes a mathematical relationship that reveals the joint impact of these factors on the total time used for scanning ( T ) as in Equation (1):
T = max TS i + TR i V i

4.2. Overview of Proposed Approach

Our goal is to reduce the total time used for scanning ( T ). In Equation (1), we have already improved the scanning node’s execution speed ( V i ) by reasonably distributing scanning tasks based on the geographic location of each scanning node. However, solely relying on geographic location to distribute tasks can lead to an imbalance in the residual task volume ( TS i ) and the upcoming task volume ( TR i ) for each scanning node, which in turn affects the overall scanning time. Therefore, in order to improve the efficiency of the original allocation method, a good task scheduling method is needed [17]. To ensure that each scanner performs the tasks it is good at and to prevent wastage of scanner resources, we adopt a load-balanced task scheduling method combined with a location-aware method to form a location-aware efficient scanning algorithm; see Algorithm 1 for details.
The method as a whole is divided into two phases: from step 1 to step 5 is the preprocessing phase before scanning, and from step 6 to step 12 is the load-balancing phase within the cluster. In the pre-scanning preprocessing phase, the main preparation work before scanning is completed. Specifically, steps 1 to 3 consist of clustering the scanners based on their geographical locations. Each clustering represents a geographic region, and the system will combine the historical task execution in the region to summarise the time delay and provide a guiding basis for subsequent task allocation. Subsequently, in Steps 4 and 5, we regionally cut the network-wide scanning tasks based on the above geographic clustering results, so that the tasks can be more efficiently matched to the corresponding scanner clusters.
In the load-balancing phase, the focus is on task scheduling and load balancing within the cluster. The core idea of this phase is to allow scanners with currently free resources to undertake tasks in the regions they are good at as much as possible during the task allocation process to improve the overall scanning efficiency [18]. Among them, Step 9 is the key of this phase. In Step 9, the procedure will first distribute each subtask to the corresponding scanner cluster, and then the cluster head node in the scanner cluster will distribute the IP address to all scanners in the cluster as evenly as possible. Repeat steps 8 and 9 until the subtask queue is empty. In step 12, all the scanner clusters are monitored, and when a scanner cluster completes a task and is idle, it proactively communicates with the scanners in the cluster that have not yet completed a task and have a close time delay and assists them in completing the remaining tasks if the task has not yet been completed, thus achieving overall work balancing.
In particular, in order to support the above scheduling and collaboration mechanisms, all scanners in our approach must have the ability to share task state and communicate. Therefore, in this system, scanners are not just nodes that simply deploy scanning tools; they also construct information interaction mechanisms among themselves to ensure efficient task assignment and collaborative execution. In the next subsection, we elaborate on our approach.
Algorithm 1: Efficient Scanning Algorithms for Location Awareness
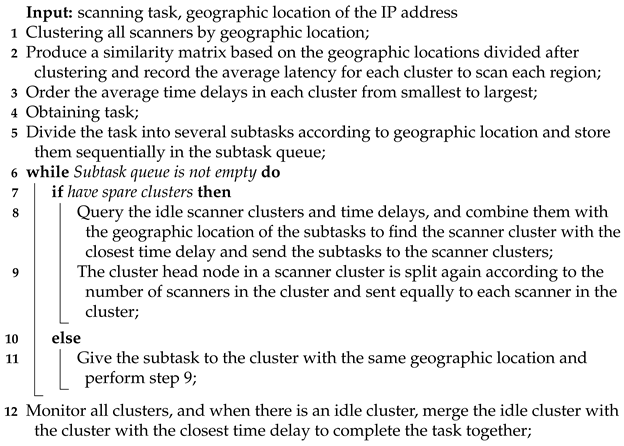
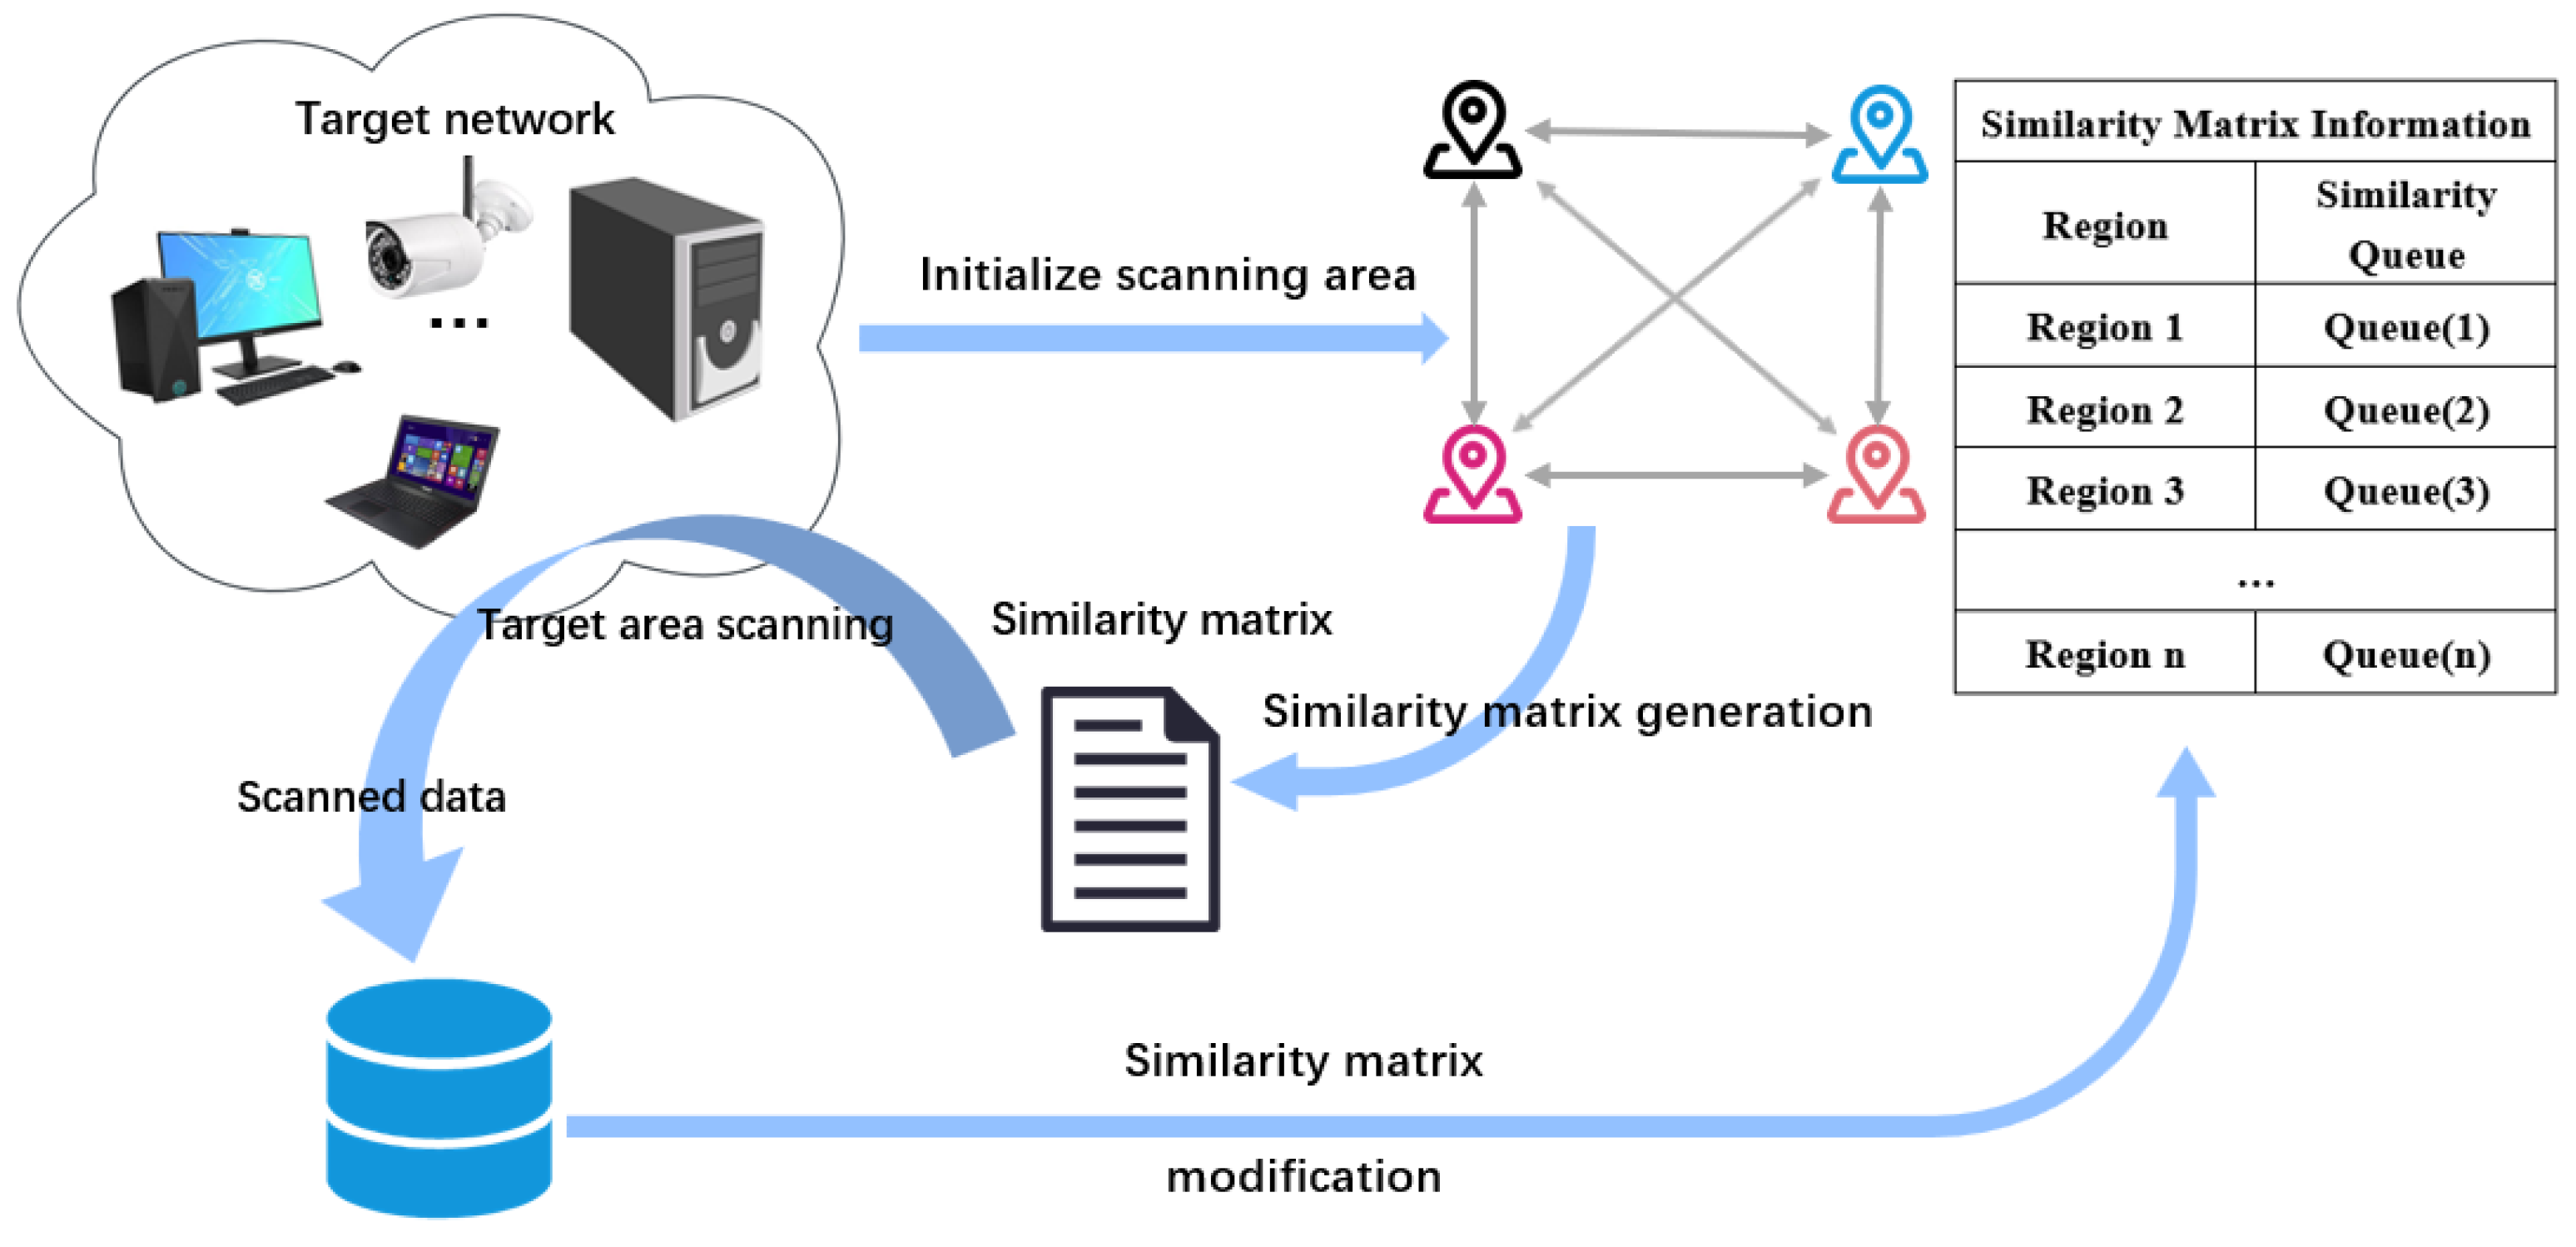
Futureinternet 17 00330 i001

4.3. Approach

The method has two main objectives. One is to allow each scanning node to perform tasks according to its expertise based on its geographical location. The second is to ensure load balancing among the scanning nodes. As mentioned above, to achieve these two goals, we divide the method into two parts: clustering and grouping of scanner clusters and load balancing within and between clusters. In clustering and grouping of scanner nodes, the main factor is the geographical location of the scanners. However, due to the large number of countries in the world, we need to implement global IP address scanning at a limited number of scanning origin locations. Therefore, we need to introduce a similarity matrix ( S m , n ) to quantify the scanning similarity between regions, where M is the number of geographic locations of scanners and N is the number of countries in the world. The similarity of each region in the initial similarity matrix can be derived from the time delay of the historical scan data. In order to solve the problem of inaccurate similarity due to long actual scanning delay, the similarity matrix is updated periodically based on the average value of the scanning results, and the process is shown in Figure 3. The similarity between each country ( S i , j ) can be expressed by using the total number of IP addresses scanned from country i to country j ( N i , j ) versus the total time required for country i to scan country j ( T i , j ). Specifically, see the following equation:
S i , j = N i , j T i , j
When the average scanning time is smaller, the similarity between the two countries increases. When a scanning task arrives, in order to allow each scanner cluster to scan IP addresses from the same country it is located in, the task is first divided into multiple subtasks based on the countries where the IP addresses are located. The most suitable scanner cluster is then selected by querying the similarity matrix for each subtask’s corresponding country. However, task allocation solely based on geographic location can lead to load imbalance among scanning nodes. To address this issue, we adopt a three-layer load-balancing mechanism.
The first layer is task matching with scanner clusters. When a scanning task arrives, the central server divides the task into several subtasks based on geographic location. When assigning tasks to scanner clusters, the priority is given to those clusters with high similarity and low load. Specifically, based on the similarity matrix, the server checks the workload of scanner clusters in descending order of similarity to the geographic location of the task. If the workload of a particular cluster is below a predefined threshold, the task is assigned to that cluster. By considering both similarity and workload when assigning scanning tasks, this mechanism avoids situations where some servers are idle while others are overloaded due to an excessive task volume from one country.
The second layer is collaborative scanning between scanner clusters, as shown in Figure 4. During task execution, some scanner clusters may have faster scanning speeds than others, leading to the possibility of idle clusters. When a scanner cluster is idle, it will check the workload status of other clusters in sequence according to the similarity matrix. If another cluster is busy, the scanning nodes of both clusters will merge to jointly execute the task. This process will be repeated whenever an idle cluster is found, until all clusters are in a busy state, thereby improving the scanning efficiency of the busy clusters. The third layer is load balancing among scanning nodes within a cluster, as shown in Figure 5. To achieve load balancing within a cluster, we construct a task queue that stores and distributes scanning tasks. If the task queue is not empty, scanning nodes within the cluster will sequentially fetch tasks from the queue. If the task queue is empty, the cluster will engage in the collaborative scanning process from the second layer. With this three-layer execution mechanism, each scanning node is assigned tasks with high similarity while ensuring that both scanner clusters and individual scanning nodes within a cluster achieve load balancing, ultimately increasing the overall scanning efficiency.

5. Experiments

In this section, we validate the previously proposed location-aware scanning approach in terms of scanning efficiency, load-balancing aspects between scanner clusters and between scanners, and scanning coverage. In order to demonstrate the effectiveness of our approach more intuitively, we compare and analyse our proposed method with the current frequently used random scanning methods.

5.1. Experimental Setup

In our lab, we use global server resources deployed on AliCloud’s international platform covering multiple countries and regions, totalling over 500 lightweight servers, each of which can maintain direct communication with each other. These servers cover more than 50 countries with well-developed networks, such as the United States, China, the United Kingdom, France, Japan, and so on. Each country covers 5 major cities, with 2 servers in each city. Considering the variability of different geographical regions, we have chosen several countries with large geographical differences as the scanning origins of our experiments, namely TH, JP, DE, US, and AU. These countries not only are geographically dispersed but also have large variations in terms of network infrastructures, bandwidths, and latencies. As mentioned in the previous section, we mainly use Nmap as the main research tool, and hence Nmap is chosen as the scanning tool. In the algorithm, it is mentioned that we need to geolocate IP addresses; therefore, in the scanning dataset, we use IP2Location [19] as the IP geolocation database. In the execution part of the algorithm, it is divided into two parts in total; the first part is the pre-scanning procedure; therefore, we need to cluster the scanners of the five countries first and then select 30 network segments of each country from the IP2Location database as the initial task. In Figure 6a, we show part of the scanning data, with rows representing the target countries and columns representing the starting countries. Each value represents the average scanning time. In Figure 6b, we show the storage structure of the list. The lighter colours are the target geographic locations, and the darker colours are the geographic locations where the scanners are located. When there is a task to be assigned, the programme will first look for the lighter-coloured location and then sequentially look for the darker-coloured location to find a scanner that can be assigned.

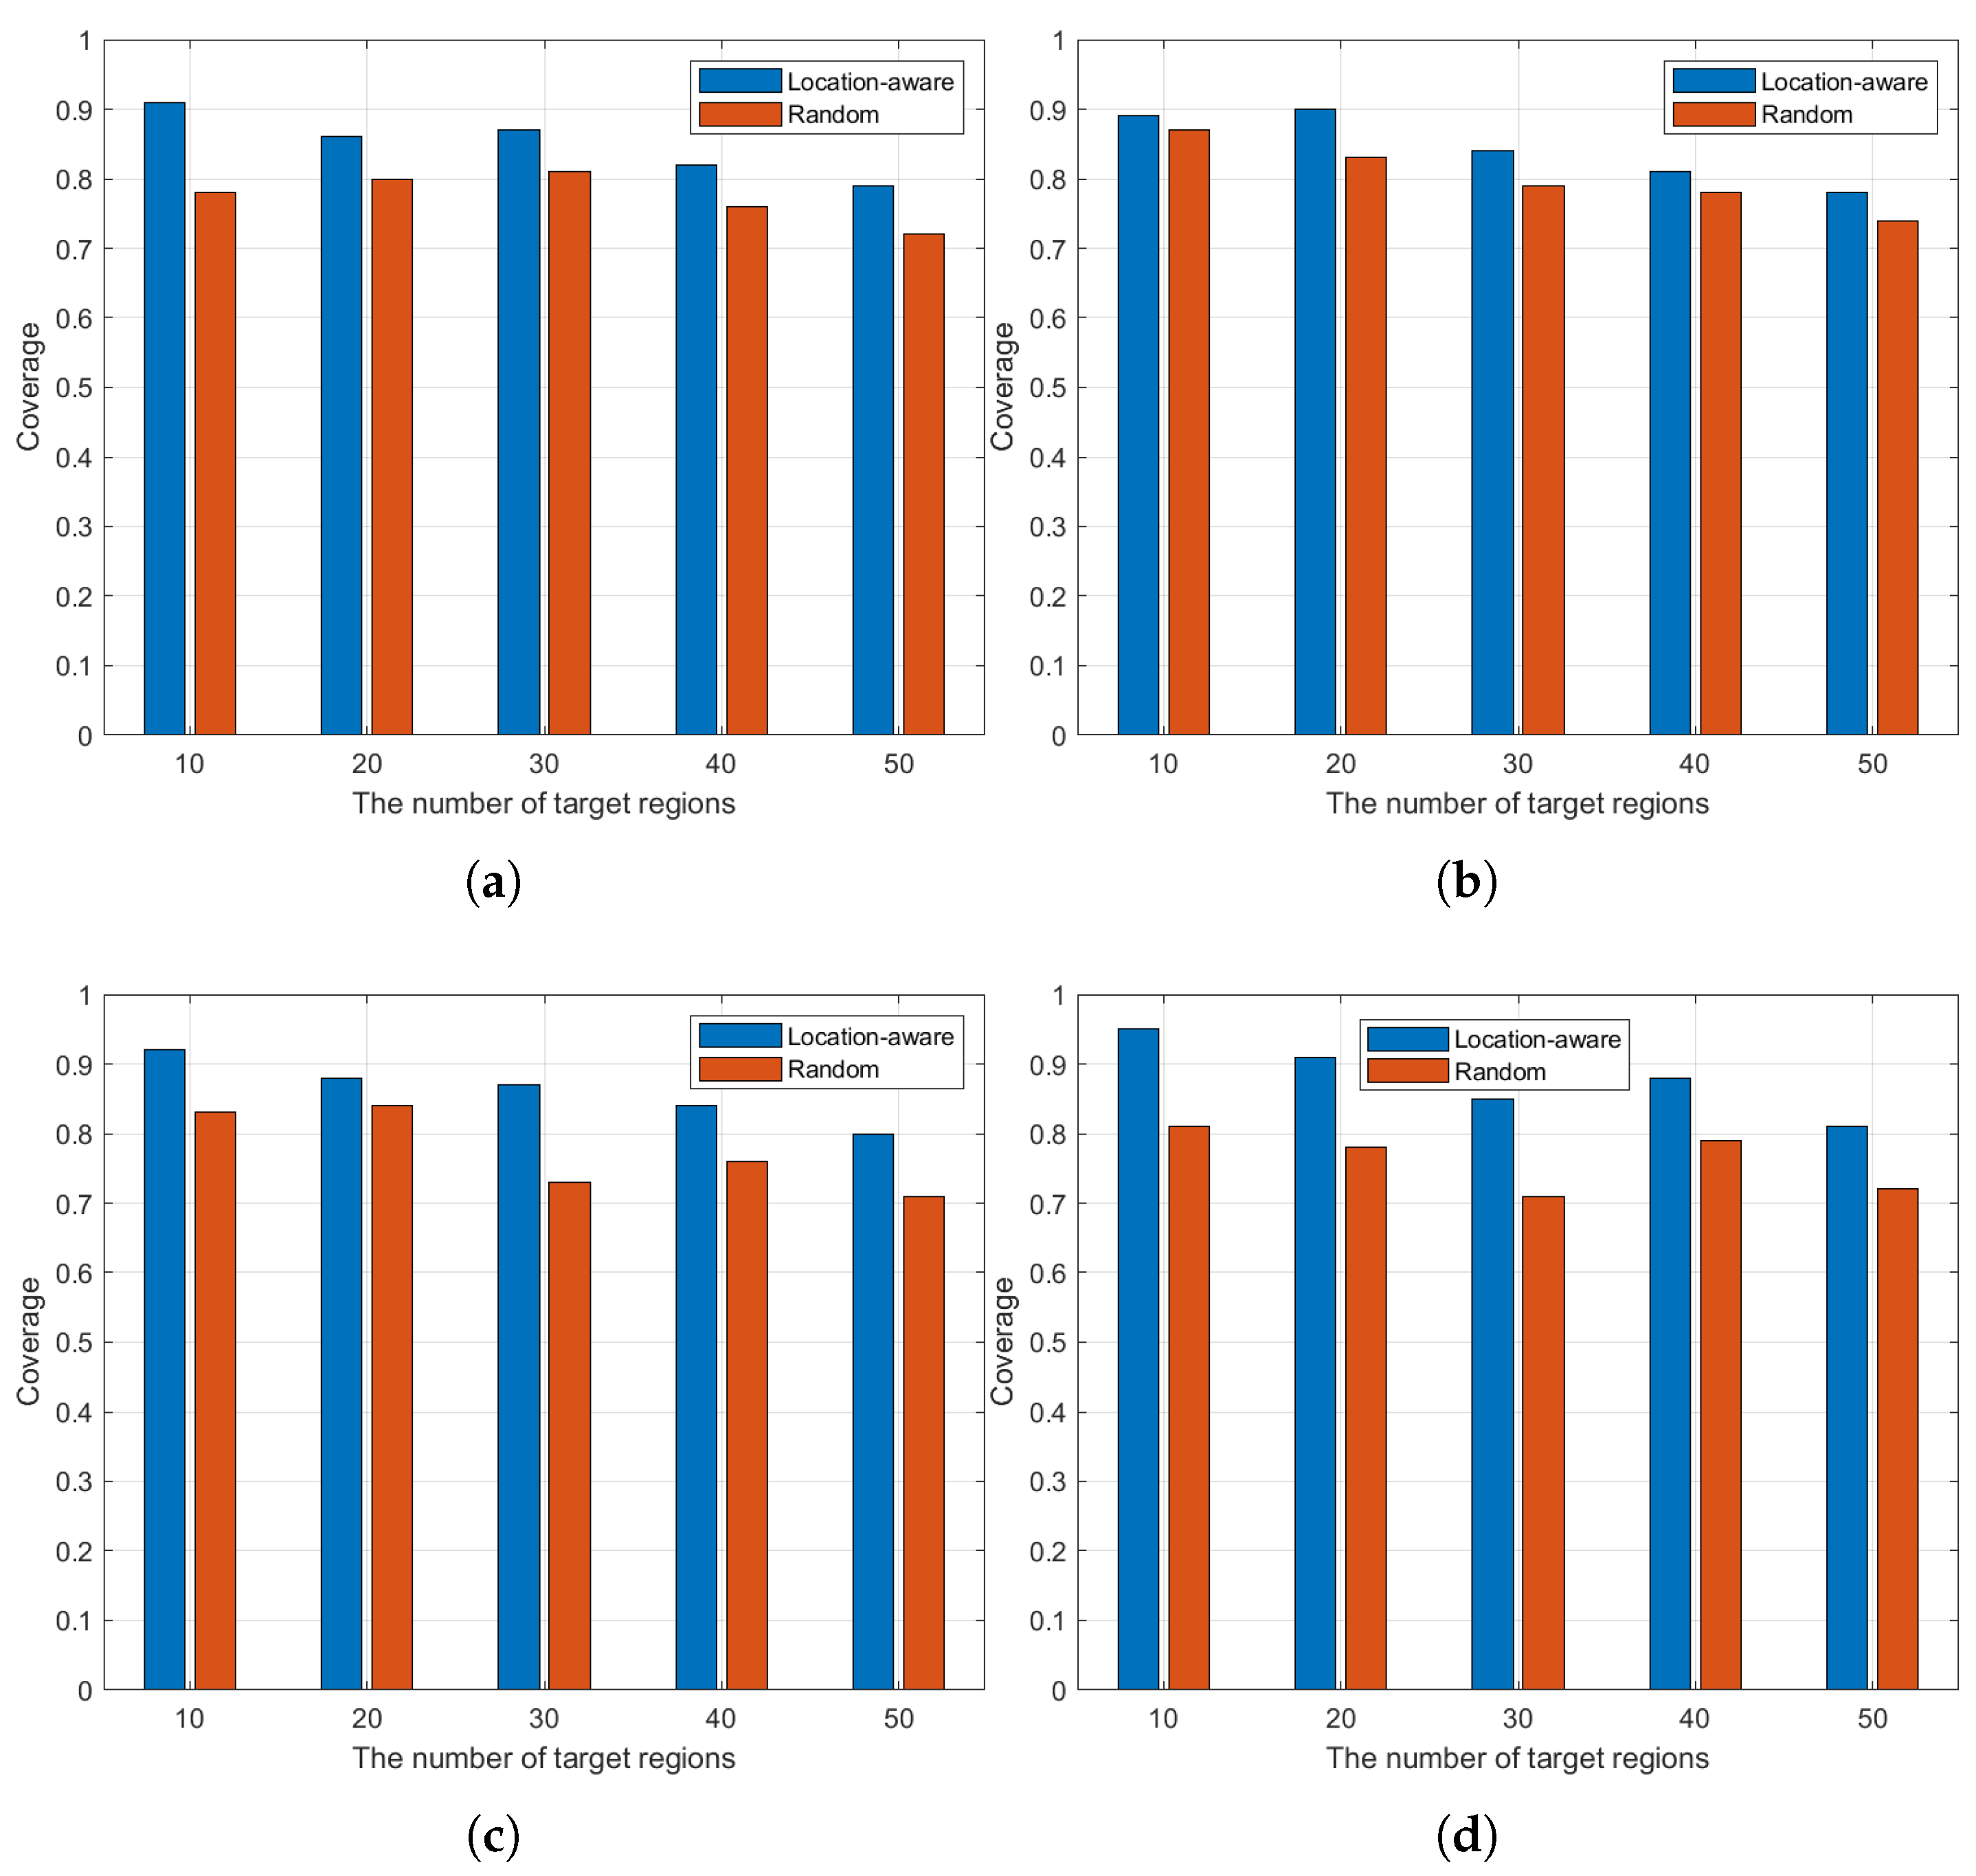
5.2. Experiments Analysis

(1) Efficiency Evaluation: Efficiency evaluation is the central starting point of our study and is evaluated by scanning the average usage time of network segments for individual IP addresses. Each network segment is 24 network bits, and the selection of each network segment is randomised. This design is able to better simulate the uncertainty of a realistic network environment. During the experiment, to ensure the reliability of the data and the stability of the experimental results, we designed three independent experiments and selected a different IP address for scanning in each experiment. This not only helps to eliminate the chance factors in the experiments but also enhances the universality and representativeness of the experimental results. Figure 7 shows the results of the scanning time evaluation based on the location-aware model with the random-scanning method under different numbers of IP network segments. As can be seen from the figure, Figure 7a to Figure 7d represent the situation when different numbers of scanner clusters are used, respectively. In these figures, the horizontal axis represents the number of IP network segments scanned, and the vertical axis represents the average scanning time. In order to clearly distinguish between the different scanning methods, different colours are used for the bar charts, where one type of colour indicates the location-aware scanning method and the other type represents the random scanning method. With this comparative data, we can draw several key conclusions.
Firstly, it is obvious from the data of each subgraph that the average scanning time of the location-aware scanning method is always lower than that of the random scanning method. Even in the case of a large number of network segments, the location-aware model still exhibits high scanning efficiency. This is because the location-aware model is able to perform reasonable task allocation based on the geographical location of network segments, which reduces the scanning delay and improves the scanning efficiency. Comparatively, the random scanning approach lacks such optimisation, resulting in the assignment of tasks showing disorder, causing the scanner to perform a large number of inept tasks, which in turn increases the average time of scanning.
However, it is worth noting that the average scanning time of the location-aware scanning method shows a gradual increase as the number of network segments increases. The reason for this phenomenon is that the number of scanner clusters is limited. As the number of IP network segments to be scanned increases, the location-aware model is faced with more tasks, and the amount of tasks that the cluster is not good at increases, which leads to an increase in scanning time. For the random scanning approach, the average usage time is significantly higher than the location-aware approach. This is mainly due to the unstructured nature of the random scanning approach. Random scanning does not have a clear task assignment rule, resulting in a large number of scanner clusters acquiring tasks that they are not good at, so that each task is executed until it times out. This makes the overall time consumption of the random scanning method much higher. In contrast, the location-aware approach reduces the time spent waiting for a timeout due to the inability to obtain a response from the target host for a long period of time by optimising the task allocation and thus is able to show a superior performance in most cases.
Finally, as a whole, the average scanning time of the location-aware scanning method instead shows a gradual decrease as the number of scanner clusters increases. This result is intriguing and further validates our hypothesis that increasing the number of scanner clusters can effectively improve the efficiency of location-aware models. When the number of scanner clusters is increased, the burden of each cluster is shared, and each cluster is allowed to perform the tasks it is good at with high probability, improving the overall scanning speed. The emergence of this phenomenon further proves the correctness of our view that the location-aware scanning method can effectively reduce the scanning time and thus improve the scanning efficiency with reasonable task allocation and optimised task scheduling.
In summary, by analysing these experimental data, we can conclude that the location-aware scanning approach excels in reducing the scanning time, especially when the number of network segments is large, and can significantly improve the efficiency and reduce the unnecessary waste of time. Therefore, the application of location-aware models in large-scale network scanning tasks has significant advantages.
(2) Load-balancing validation: In the above method, we introduced a load-balancing scheme to address the differences in scanning efficiency among different clusters. In order to verify the effectiveness of the method, we have recorded the scanning time of each scanner cluster and scanning node in detail, and the specific data is shown in Figure 8. The criterion for verifying load balancing is that if the difference in scanning time between different scanner clusters is large, the load is considered to be unbalanced; conversely, if the time difference is small, the load is considered to be balanced. In Figure 8a, the x-axis represents the number of target network segments being scanned, and the y-axis represents the time spent on scanning. We can observe that the difference in scanning time between each scanner cluster is small, which indicates that the load between clusters has reached a relatively balanced state through the load-balancing method. Furthermore, to verify the load balancing among the scanning nodes, we deploy three scanners in the DE cluster and two scanners in the US cluster, as shown in Figure 8b,c. We observe that there is no significant difference in the scanning time of each scanning node within the cluster, either in the DE cluster or the US cluster. To further demonstrate the advantages of load balancing, we show the time used by the shortest as well as the longest time-consuming scanners in the random scanning method, as detailed in Figure 8d. The variability between the shortest elapsed time and the longest elapsed time of this random scanning method can be seen in Figure 8d to be particularly significant. The reason why this occurs is that randomness tends to assign tasks in a discrete manner, causing some scanners to receive tasks that are mostly inept and some scanners to receive tasks that are mostly inept. This would make a significant difference in the time it takes the scanners to complete. Therefore, this result in Figure 8d further confirms the effectiveness of the load-balancing approach, showing that by reasonably allocating scanning tasks, we can effectively avoid node overloading and thus improve the overall scanning efficiency.
(3) Coverage evaluation: In the field of Internet scope scanning, the core criteria for evaluating the strengths and weaknesses of a scanning method include scanning efficiency and coverage. We have already verified the effectiveness of our method in terms of scanning efficiency, so we focus on analysing its performance in terms of coverage rate. Coverage ratio is usually defined as the ratio of the number of target IP addresses successfully hit during the scanning process to all potential target addresses, which reflects the comprehensiveness and actual effectiveness of the scanning task in the target space. Figure 9a, Figure 9b, Figure 9c, and Figure 9d demonstrate the coverage ratio of our proposed method compared with the random scanning method under different configurations with the numbers of scanner clusters of 5, 10, 20, and 30, respectively. From each sub-figure, it can be seen that the coverage of our method shows an increasing and then decreasing trend as the number of scanned regions increases. This phenomenon is attributed to the fact that when the scanned regions become more numerous, the limited scanner clusters are more likely to be allocated to regions that are not good at scanning, resulting in the overall scanning effectiveness being affected. Taken together, with a fixed number of scanning regions, the coverage rate tends to increase as the number of scanner clusters increases, indicating that more scanner clusters can bring higher resource scheduling flexibility and better scanning coverage results.
(4) Ethics: Our method distributes tasks randomly, which prevents both the execution of tasks in a single region for a long period of time and the blocking of the network in a region by performing a large number of scans over a long period of time. During the course of the experiment, our similarity matrix gradually levelled off thereafter, except for a large number of data replacements in about five rounds of the initial update. Since our similarity matrix is calculated based on the average time delay, this phenomenon can prove that our method does not bring a big impact on the network environment during the scanning process.

6. Conclusions

In this study, we first experimentally analysed and found that when network scanning was performed using scanning sources from different countries, there was a significant difference in the time required for the scanning task, even though the target network was located in the same country. This phenomenon suggests that geographical location has a significant impact on scanning efficiency, especially in network scanning on a global scale. Differences in network environments in different countries can affect the accessibility of different countries, which in turn affects the efficiency of scanning. Therefore, we address this problem by proposing a geolocation-based scanning method that aims to improve scanning efficiency. Specifically, the method divides the scanner clusters using geographic locations and constructs a similarity matrix and then schedules the scanning tasks in an ordered manner based on this similarity matrix, by which it can realise the fastest scanning method to scan all the regions of the globe within a limited scanning area. However, simply relying on geographic location to distribute tasks still cannot completely solve the scanning efficiency problem, especially in large-scale network environments. To further optimise the scanning efficiency, we propose a load-balancing approach. This approach not only balances the load among different scanner clusters but also optimises the workload distribution of scanning nodes within the same cluster. By dynamically adjusting the task volume of each scanning node, we are able to avoid the idle state of some scanners, which leads to the waste of scanning resources. This improves the overall scanning efficiency. In the experimental part, we demonstrate the effectiveness of the proposed model and algorithm in improving scanning efficiency by validating them in a real network environment. By comparing with traditional scanning methods, our location-aware scanning method improves the scanning efficiency while ensuring the scanning coverage. It especially performs well in multinational network environments. This result suggests that geographic location factors play an important role in improving network scanning efficiency.

7. Limitations and Future Work

Although the location-aware scanning-based approach proposed in this study has achieved good results in improving scanning efficiency, there are still some limitations. First, the geographic location of IP addresses may be inaccurate or not updated in time, which affects the effectiveness of task assignment. Second, the metrics constructed based on average scanning time cannot fully reflect the dynamic changes of the network. Further validation of its generality under a wider range of network conditions is still needed in the future.
Based on our results, there are several future research directions worth exploring. First, although our current approach uses average scan time as a location-based clustering metric, the accuracy of task matching can be further improved by incorporating more granular metrics such as packet loss, jitter, or hop count. Second, we could extend the geo-aware framework to support adaptive scanning strategies in dynamic network environments. Thirdly, integrating deep learning models to predict scanning results or optimise cluster configurations in real time is a promising direction. Finally, conducting further experiments on more diverse network infrastructures will help to generalise our approach.

Author Contributions

Conceptualization, W.S. and H.H.; methodology, H.H.; software, H.S.; validation, W.S. and Q.G.; formal analysis, W.S. and H.S.; investigation, H.S.; resources, H.H.; data curation, Q.G.; writing—original draft preparation, W.S.; writing—review and editing, H.H.; visualization, W.S.; supervision, H.S.; project administration, H.S.; funding acquisition, H.S. All authors have read and agreed to the published version of the manuscript.

Funding

This research was funded by the Shandong Provincial Natural Science Foundation under Grant No. ZR2023LZH011, No. ZR2022LZH015; the National Natural Science Foundation of China (NSFC) via grant 62401304; project ZR2022QF040 supported by Shandong Provincial Natural Science Foundation; the Young Talent of Lifting Engineering for Science and Technology in Shandong, China via SDAST2025QTA077; and the QLU Talent Research Project under grant 2023RCKY138.

Data Availability Statement

The raw data supporting the conclusions of this article will be made available by the authors on request.

Acknowledgments

During the preparation of this study, the author used Nmap 7.95 for the purposes of provision of scanning services. The authors have reviewed and edited the output and take full responsibility for the content of this publication.

Conflicts of Interest

The authors declare no conflicts of interest.

References

  1. Mazurczyk, W.; Caviglione, L. Cyber reconnaissance techniques. Commun. ACM 2021, 64, 86–95. [Google Scholar] [CrossRef]
  2. Hashida, H.; Kawamoto, Y.; Kato, N. Efficient delay-based internet-wide scanning method for IoT devices in wireless LAN. IEEE Internet Things J. 2020, 7, 1364–1374. [Google Scholar] [CrossRef]
  3. Song, G.; He, L.; Zhao, T.; Luo, Y.; Wu, Y.; Fan, L.; Li, C.; Wang, Z.; Yang, J. Which doors are open: Reinforcement learning-based internet-wide port scanning. In Proceedings of the 2023 IEEE/ACM 31st International Symposium on Quality of Service (IWQoS), Orlando, FL, USA, 19–21 June 2023; pp. 1–10. [Google Scholar] [CrossRef]
  4. Verma, S.; Kawamoto, Y.; Kato, N. A smart internet-wide port scan approach for improving IoT security under dynamic WLAN environments. IEEE Internet Things J. 2022, 9, 11951–11961. [Google Scholar] [CrossRef]
  5. Hou, B.; Cai, Z.; Wu, K.; Su, J.; Xiong, Y. 6Hit: A reinforcement learning-based approach to target generation for internet-wide IPv6 scanning. In Proceedings of the IEEE INFOCOM 2021—IEEE Conference on Computer Communications, Vancouver, BC, Canada, 10–13 May 2021; pp. 1–10. [Google Scholar] [CrossRef]
  6. Hou, B.; Cai, Z.; Wu, K.; Yang, T.; Zhou, T. 6Scan: A high-efficiency dynamic internet-wide IPv6 scanner with regional encoding. IEEE/ACM Trans. Netw. 2023, 31, 1870–1885. [Google Scholar] [CrossRef]
  7. Durumeric, Z. ZMap: The Internet Scanner. Available online: https://github.com/zmap/zmap (accessed on 26 July 2019).
  8. NMAP.ORG. Available online: https://nmap.org/ (accessed on 26 July 2019).
  9. Wan, G.; Izhikevich, L.; Adrian, D.; Yoshioka, K.; Holz, R.; Rossow, C.; Durumeric, Z. On the origin of scanning: The impact of location on internet-wide scans. In Proceedings of the ACM Internet Measurement Conference (IMC ’20), New York, NY, USA, 27–29 October 2020; pp. 662–679. [Google Scholar] [CrossRef]
  10. Verma, S.; Kawamoto, Y.; Kato, N. A novel IoT-aware WLAN environment identification for efficient internet-wide port scan. In Proceedings of the 2020 IEEE Global Communications Conference (GLOBECOM), Taipei, Taiwan, 7–11 December 2020; pp. 1–6. [Google Scholar] [CrossRef]
  11. Tang, F.; Kawamoto, Y.; Kato, N.; Yano, K.; Suzuki, Y. Probe delay-based adaptive port scanning for IoT devices with private IP address behind NAT. IEEE Netw. 2020, 34, 195–201. [Google Scholar] [CrossRef]
  12. Gong, Q.; Gu, C. A baseline modeling algorithm for internet port scanning radiation flows. In Proceedings of the 2021 IEEE 6th International Conference on Signal and Image Processing (ICSIP), Nanjing, China, 22–24 October 2021; pp. 1255–1259. [Google Scholar] [CrossRef]
  13. Yanyan, L.; Shanhou, H. Application of Bayesian optimization in router port testing: An improved port scanning technique. In Proceedings of the 2023 IEEE 5th International Conference on Power, Intelligent Computing and Systems (ICPICS), Shenyang, China, 14–16 July 2023; pp. 98–103. [Google Scholar] [CrossRef]
  14. Padmanabhan, R.; Schulman, A.; Levin, D.; Spring, N. Residential links under the weather. In ACM SIGCOMM, Proceedsings of the SIGCOMM ’19: ACM Special Interest Group on Data Communication, Beijing, China, 19–23 August 2019; Association for Computing Machinery: New York, NY, USA, 2019. [Google Scholar]
  15. Zhu, P.; Man, K.; Wang, Z.; Ensafi, R.; Halderman, J.A.; Duan, H. Characterizing transnational internet performance and the great bottleneck of China. In ACM Sigmetrics, Proceedsings of the SIGMETRICS ’20: Abstracts of the 2020 SIGMETRICS/Performance Joint International Conference on Measurement and Modeling of Computer Systems, Boston, MA, USA, 8–12 June 2020; Association for Computing Machinery: New York, NY, USA, 2020. [Google Scholar]
  16. Pearce, P.; Jones, B.; Li, F.; Ensafi, R.; Feamster, N.; Weaver, N.; Paxson, V. Global measurement of DNS manipulation. In USENIX Security Symposium, Proceedsings of the SEC’17: Proceedings of the 26th USENIX Conference on Security Symposium, Vancouver, BC, Canada, 16–18 August 2017; Association for Computing Machinery: New York, NY, USA, 2017. [Google Scholar]
  17. Hao, H.; Xu, C.; Zhang, W.; Yang, S.; Muntean, G.-M. Task-driven priority-aware computation offloading using deep reinforcement learning. IEEE Trans. Wirel. Commun. 2025. early access. [Google Scholar] [CrossRef]
  18. Hao, H.; Xu, C.; Zhang, W.; Yang, S.; Muntean, G.-M. Joint task offloading, resource allocation, and trajectory design for multi-UAV cooperative edge computing with task priority. IEEE Trans. Mob. Comput. 2024, 23, 8649–8663. [Google Scholar] [CrossRef]
  19. IP2Location. IP2Location API Open Platform. Available online: https://www.ip2location.com/ (accessed on 26 July 2019).
Figure 1. Internet-wide scanning scenario.
Futureinternet 17 00330 g001
Figure 2. Verification of location-aware experiments: (a) AU time used for scanning target countries; (b) GB time used for scanning target countries; (c) NL time used for scanning target countries; (d) JP time used for scanning target countries; (e) SG time used for scanning target countries; (f) US time used for scanning target countries. Note: Horizontal axis indicates target country being scanned, and vertical axis is average time used to scan network segment.
Futureinternet 17 00330 g002
Figure 3. Similarity matrix update process. Note: In the similarity matrix information table, the ‘…’ means that the list of Regions and Queues continues to extend for an unlimited number of times.
Futureinternet 17 00330 g003
Figure 4. Load-balancing process between scanner clusters.
Futureinternet 17 00330 g004
Figure 5. The process of executing a task by scanners inside a cluster.
Futureinternet 17 00330 g005
Figure 6. Constructing the similarity matrix: (a) the average time for similarity matrix scanning; (b) storage structure of the similarity matrix. Note: In picture (b), the ‘…’ in the target region indicates the name of the other target region omitted, in the origin region the horizontal ‘…’ indicates the name of the omitted origin region in the queue, and the vertical ‘…’ indicates the omitted queue.
Futureinternet 17 00330 g006
Figure 7. Average scanning time of different numbers of IP network segments using location-aware model and random scanning approach: (a) average scan time for five scanner clusters; (b) average scan time for ten scanner clusters; (c) average scan time for twenty scanner clusters; (d) average scan time for thirty scanner clusters. Note: Horizontal axis indicates number of areas scanned, and vertical axis indicates average scanning time of scanner.
Futureinternet 17 00330 g007
Figure 8. Verification results for load balancing: (a) time used for cluster scanning; (b) time used for scanning nodes in cluster DE; (c) time used for scanning nodes in cluster DE; (d) time used for some scanners in random scanning methods. Note: All vertical axes indicate time taken to complete overall task, and horizontal axes indicate number of target areas scanned.
Futureinternet 17 00330 g008
Figure 9. Impact of scanner clusters and number of target areas in coverage: (a) scan coverage of five scanner clusters; (b) scan coverage of ten scanner clusters; (c) scan coverage of twenty scanner clusters; (d) scan coverage of thirty scanner clusters. Note: All vertical axes indicate number of areas scanned, and all horizontal axes indicate coverage.
Futureinternet 17 00330 g009
Disclaimer/Publisher’s Note: The statements, opinions and data contained in all publications are solely those of the individual author(s) and contributor(s) and not of MDPI and/or the editor(s). MDPI and/or the editor(s) disclaim responsibility for any injury to people or property resulting from any ideas, methods, instructions or products referred to in the content.

