Abstract
The performance of 5G/6G cellular systems operating in millimeter wave (mmWave, 30–100 GHz) and sub-terahertz (sub-THz, 100–300 GHz) bands is conventionally assessed by utilizing the static distributions of user locations. The rationale is that the use of the beam tracking procedure allows for keeping the beams of a base station (BS) and user equipment (UE) aligned at all times. However, by introducing 3GPP Reduced Capability (RedCap) UEs utilizing the Radio Resource Management (RRM) Relaxation procedure, this may no longer be the case, as UEs are allowed to skip synchronization signal blocks (SSB) to improve energy efficiency. Thus, to characterize the performance of such UEs, methods explicitly accounting for UE mobility are needed. In this paper, we will utilize the tools of the stochastic geometry and random walk theory to derive signal-to-noise ratio (SNR), spectral efficiency, and rate as an explicit function of time by accounting for mmWave/sub-THZ specifics, including realistic directional antenna radiation patterns and micro- and macro-mobilities causing dynamic antenna misalignment. Different from other studies in the field that consider time-averaged performance measures, these metrics are obtained as an explicit function of time. Our numerical results illustrate that the macro-mobility specifies the overall trend of the time-dependent spectral efficiency, while local dynamics at 1–3 s scales are mainly governed by micro-mobility. The difference between spectral efficiency corresponding to perfectly synchronized UE and BS antennas and time-dependent spectral efficiency in a completely desynchronized system is rather negligible for realistic cell coverages and stays within approximately 5–10% for a wide range of system parameters. These conclusions are not affected by the utilized antenna array at the BS side. However, accounting for realistic radiation patterns is critical for a time-dependent performance analysis of 5G/6G mmWave/sub-THz systems.
1. Introduction
The modern 5G and future 6G cellular systems operating in millimeter wave (mmWave, 30–100 GHz) and sub-terahertz bands (100–300 GHz), respectively, promise to offer an extraordinary capacity at the air interface [1,2]. This will potentially enable a plethora of new applications, ranging from xHDk video streaming to telemedicine, virtual, and augmented reality [3].
The use of extremely high frequencies in mmWave/sub-THz bands naturally requires large antenna arrays at both base station (BS) and user equipment (UE) sides having highly directional radiation patterns [4,5]. These antennas are likely to operate in a beamforming regime, extending the effective coverage of BSs. In such systems, to maintain the connectivity at all times, and efficiently conceal the impact of both the micro- and macro-mobility of users [6,7,8], these systems will rely on beam tracking functionality synchronizing the beam directions between UE and BS at fine-grained timescales [9]. Another challenging issue in mmWave/sub-THz systems is the human body blockage phenomenon that cannot be concealed by utilizing the standard physical layer techniques [10,11].
Despite the inherent mobility of users, the performance of 5G/6G mmWave/sub-THz systems with directional antennas and blockage has been conventionally assessed by utilizing the tools of stochastic geometry, explicitly assuming static locations of users and blockers [12,13,14]. The rationale is that these assumptions not only drastically simplify the analysis, but are well aligned with the way these systems operate the performance of beam alignment dynamically over time. Assuming the beam tracking capabilities, such models well represent the system’s “snapshot” at any arbitrarily chosen instant of time. The recently introduced 3GPP Reduced Capabilities (RedCap) type of UE aims at aggressive power savings [15], where one of the most efficient energy conservation mechanisms is radio resource management (RRM) relaxation. According to this functionality, UE is allowed to skip the beam alignment procedures performed by utilizing the synchronization signal blocks (SSB) for a certain amount of time [16].
Conventional mathematical modeling frameworks proposed in the literature (see [17] for an overview) cannot characterize the performance of such UEs, as they target time-averaged performance metrics. Thus, performance modeling of systems involving such types of UEs requires time-dependent models that are generally much more difficult to solve as compared to static models. As a result, the performance of RedCap UEs has been conventionally evaluated using time-consuming system-level simulations. In this paper, we fill the above-mentioned void.
The aim of this paper is to mathematically characterize time-dependent UE performance metrics in mmWave/sub-THz systems. To this end, by explicitly accounting for mmWave/sub-THz propagation, directional antenna radiation patterns, blockage, and mobility, we will utilize the tools of the stochastic geometry and random walks theory to build a general time-dependent performance evaluation framework. As metrics of interest, we will utilize spectral efficiency and signal-to-noise ratio (SNR) at a certain time instant t and derive them as an explicit function of the state of the UE at some initial time instant . In our numerical results, we will investigate the dependence of these metrics on the system parameters, including the number of antenna elements and mobility characteristics of a user.
The main contributions of our study are:
- A mathematical model allowing for the capture of performance metrics, including signal-to-noise (SNR), spectral efficiency, and rate as an explicit function of time for 5G/6G mmWave/sub-THz systems with directional antennas, and micro- and macro-mobility impairments;
- A qualitative analysis of time-dependent metrics, showing that macro-mobility effects are more pronounced at the large timescales specifying the overall trends in the considered metrics, while micro-mobility affects them at fine-grained timescales manifesting itself in local fluctuations;
- Observations that the difference between spectral efficiencies in a system with perfectly synchronized UE and BS antennas and the one with completely desynchronized antennas is rather small, amounting to 10% at most, implying that the communications can be performed without perfect synchronization between antennas at a slightly degraded quality.
The rest of the paper is organized as follows. In Section 2, we will discuss the related work. The system modeling utilized in this study is formalized in Section 3. We will solve this model for time-dependent spectral efficiency and SNR metrics in Section 4. Numerical results are illustrated in Section 5. Finally, conclusions are drawn in Section 6.
2. Related Work
An accurate analysis of time-dependent UE performance in 5G NR systems with blockage and micro-mobility patterns requires accurate antenna and mobility models. To this aim, in this section, we start reviewing the efforts spent so far for the time-dependent modeling of system characteristics and then proceed with the antenna and mobility models.
2.1. Time-Dependent Modeling
Performance analysis of 5G/6G mmWave/sub-THz cellular systems with directional antennas, blockage, and micro-mobility has been conventionally performed by assuming static locations of UE and blockers, see, e.g., [7,13,18,19]. The rationale is that this greatly simplifies that analysis using the tools of stochastic geometry. From the technology point of view, the assumption of the periodic beam tracking utilized in systems with directional antennas [20] with a rather short time between tracking events (up to 512 ms in 5G NR) makes the static analysis appropriate as neither micro- nor macro-mobility may lead to drastic beam misalignment over these intervals [21,22].
The beam tracking operation has been recently shown to drastically degrade the energy efficiency of UEs. Specifically, by performing the system-level analysis, the authors in [23,24] demonstrated that 5G UEs operating in the mmWave frequency band are much more energy inefficient as compared to LTE UEs and characterized by a significantly smaller UE lifetime. To this aim, the recently introduced RedCap UEs utilize the RRM Relaxation feature that allow them to skip beam tracking events for a much larger time as compared to the standard procedure defined for 5G NR UEs [25]. In [26], the authors proposed a pragmatic approach to activate the RRM Relaxation mechanism for RedCap UEs that considers different mobility patterns. To determine the stationarity of UEs, they applied grouping that is based on geographical location and beam characteristics. It was shown that the UE can reduce the energy consumption caused by unnecessary detection and measurement and be adjusted in a timely and flexible manner according to different situations. When such UEs are subject to micro- or macro-mobility, this may, however, lead to drastic performance degradation due to antenna misalignment between UE and BS. The choice of the optimal RRM relaxation period naturally requires models allowing for the prediction of time-dependent performance measures, including signal-to-noise ratio (SNR), spectral efficiency, and attained rate.
Time-dependent 5G/6G mmWave/NR systems performance has been conventionally evaluated by utilizing system-level simulation (SLS) studies. The rationale is that mathematical performance modeling requires not only the methods of stochastic geometry to estimate performance metrics, but also random walks theory [27]. The latter is utilized to track the current position of the UE with respect to the BS and thus explicitly defines the performance measures as a function of time. Joining the tools of stochastic geometry and random walk to specify a unified time-dependent framework for the performance evaluation of 5G/6G mmWave/sub-THz systems is a complex task. The only study we are aware of is [28], proposing new strategies for energy consumption and user aggregation based on a random walk mobility pattern. The result showed that it is possible to achieve up to a 16.1% and 20% energy reduction in the case of uniform and non-uniform distributions. However, that study is also performed by utilizing computer simulations. In addition to inherent dynamism, one also needs to account for mmWave/sub-THz specifics, including directional antennas and blockage. On top of this, the time-dependent metrics of interest also depend on the micro-mobility process that potentially also has quite complex characteristics, as discussed in [6]. As a result, no attempts to provide such frameworks have been made so far.
2.2. Antenna Models
The antenna model is one of the critical elements for time-dependent analysis. Usually, three types of models are utilized in the literature for directional mmWave/sub-THz systems. The first type is the so-called theoretical geometric cone or cone-plus-circle models that capture only the essentials of directional propagation [13]. Specifically, the code antenna model captures the main beam only and accepts only one parameter—half-power beamwidth (HPBW). Cone-plus-sphere extends this simple model to account for the loss of power to the side and back lobes. These models can be parameterized theoretically as discussed in detail in [17] or by utilizing the array parameters, including the power loss to the side and back lobes, k, the average gain over the main lobe, [29]
where N is the number of antenna elements and is the angle and where the gain of the radiation pattern decreases by 3 dB as compared to the array maximum. The HPBW is given by
where is the location of the array maximum. The location can be calculated as , where is the phase excitation difference affecting the physical orientation of the array. In our case, for . The 3 dB point is provided by
Note that this type of model does not capture the fine-grain changes in the antenna transmit and receive gains, reporting abrupt changes even in the case of cone-plus-sphere models. To account for smooth changes in the gains, the so-called pattern-based models can be used [30]. These models are defined by the actual antenna radiation pattern, expressing the gain in the transmit or receive direction by using a function , where is the elevation angle and is the azimuth angle. Since realistic antenna radiation patterns are not readily available, complex superposition-based models can be used to approximate them. One such model is specified in 3GPP TR 39.901.
The topic considered in our paper is also closely related to modeling wave propagation under the micro-mobility of antennas. In this context, ray-tracing models offer high accuracy. Specifically, in [31], the authors consider the extended Walfisch–Ikegami model (EWM) that is characterized by lower computational time with tolerable accuracy when compared to the deterministic ray optical models. Wave-guiding effects are not considered in this model, which generally occurs in urban canyons. This accuracy of the model is higher when the transmitters are located above the rooftop levels of the buildings. While it considers only the path loss, it still discriminates between line-of-sight (LoS) and non-line-of-sight (NLoS) cases.
The authors in [32] characterize the channel of a point-to-point communication link between unstable transmitters and receivers by taking into account the effects of transceiver vibrations, three-dimensional antenna pattern, path loss, and small-scale fading. They proposed an approximate Gaussian model based on the number of antenna elements for the standard array antenna pattern. By using this model, they derived the probability density function (pdf) and cumulative distribution functions (CDF) of the pointing error in the presence of unstable transmitters and receivers as a function of the antenna pattern.
The study in [33] provides a detailed overview of antenna arrays based on feeding techniques and considers reconfigurable arrays, while the study in [34] highlights the impact of misalignment and narrow beam bias on the quality of service in the sub-terahertz band.
2.3. User Mobility Models
User mobility models are crucial for time-dependent analysis, as they specify the rationale for beam misalignment. In general, we distinguish between user micro-mobility and macro-mobility models.
User macro-mobility has been a hot research topic over the last three decades in the context of cellular systems. Most of the utilized models are based on the random walks theory, describing the user movement either algorithmically or using closed-form stochastic equations. The most celebrated model is the random waypoint (RWP) mobility model that has been utilized already in the 1990s of the previous century [35]. This model assumes that the user moves in a certain compartment by randomly and uniformly selecting the waypoint and moving towards it at a randomly and uniformly chosen speed. For example, in [36], the authors explore this model to estimate the rate of handovers in heterogeneous networks. The research shows that the standard RWP model overestimates the rate of handover and the handover rate does not increase linearly with the number of users. Another well-known model is a random direction model (RDM, [37]). According to this model, a user chooses the directional randomly and uniformly in and then moves in a selected direction for exponentially distributed time at the constant speed v. In addition to these two simple models, there are more comprehensive ones accounting for large displacements in the mobility process, such as Levy flights and Brownian motion, with jumps and models capturing the dependence in the user trajectories; see [38] for an exhaustive review.
The important property of mobility models for applied mathematical modeling is the ability to characterize the distribution of the user location as a function of time. Unfortunately, such results are available for simple models only, such as Brownian motion. Such models are barely utilized in practice due to their inability to capture the main mobility characteristics of users. However, the performance comparison of mobility models by the authors in [39] demonstrated that performance metrics expressed as functions of models do not differ by more than 10%. This implies that even the simplest models such as Brownian motion can be utilized for a first-order performance assessment in mmWave/sub-THz cellular systems.
Micro-mobility refers to the spontaneous displacement and rotation of the UE in the hands of the user during an active connection. This effect was first characterized by sub-THz systems having extremely directional antenna radiation patterns in [40] and was observed in practice already for 5G mmWave systems [41]. In practice, small displacements barely affect the beam alignment, while rotations over the vertical (yaw) and transverse (pitch) axes have a drastic impact, as shown in [22].
To model micro-mobility, the authors in [22] utilized two independent Brownian motions over the respective rotation axes. The authors in [6] confirmed that for a large class of applications affecting user micro-mobility, the micro-mobility components over these axes are indeed independent. Further, in [42], based on the measurements reported in [6], the authors compared the accuracy of three models: a two-dimensional Markov chain model inherently capturing the dependence between mobility over the vertical and transverse axes, independent one-dimensional Markov models neglecting this dependence, and decomposed Brownian motion that also does not account for the above-mentioned dependence. They demonstrated that none of those models outperform their counterparts, implying that the simplest Brownian motion models can serve as a first-order approximation for the micro-mobility process.
3. System Model
In this section, we define the system model by specifying its parts. We start with the deployment model and then proceed with blockage, micro- and macro-mobility, propagation, and antenna models. Finally, we specify the metrics of interest.
3.1. Deployment
In this paper, we consider thatt AR/VR/XR applications are expected to be critical use-cases for NR RedCap UEs. These applications are characterized by constrained battery lifetime and thus require high energy efficiency and also have strict requirements for latency at the air interface. In most cases, a person with an AR/VR/XR device moves in space, which also imposes difficulties in maintaining the required quality of service (QoS). The traffic of these devices can be described as data streaming in a macro-mobility environment.
We consider a typical city square environment of squared form with side length L m with a BS located at ; see Figure 1. The system serves a number of AR/VR/XR users that utilize RedCap UEs. We consider a user initially located at the coordinates at time and concentrate on its time dynamics affecting its performance. The height of BS and UE are constant and considered to be and , respectively.
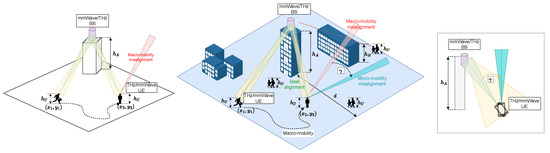
Figure 1.
The considered deployment for a time-dependent performance model with macro- and micro-mobility impairments.
3.2. Macro- and Micro-Mobility Models
In our study, we account for both macro- and micro-mobilities of UE. We represent macro-mobility by independent unbiased diffusion over the x- and y-axis confined in , where L is the compartment width and length. Recall that for one-dimensional confined diffusion, the time-dependence of the probability density function to find the Brownian particle at position x at time t, given that it was at position at time , is governed by Fick’s second law of diffusion and described by the Fokker–Planck equation [43].
with the initial condition ; D is the diffusion constant describing the rate of diffusion.
The only two parameters required to represent micro-mobility patterns are and —diffusion constants over the x- and y-axes. These can be estimated from the statistical data.
The micro-mobility refers to rapid rotations of UE in the hands of a user [40,44], leading to frequent antenna misalignment [22]. To capture this phenomenon, we utilize the model proposed in [22] and parameterize it using the statistical data reported in [6] for X-VR applications. Specifically, the model assumes that rotations along the transverse and normal axes are modeled using the independent Brownian motions governed by (4), with diffusion constants and . To reflect the micro-mobility effect on the UE side, we consider additional vertical and horizontal misalignment angles due to rotations of the UE in the user’s hands, and . These rotation processes impose the most impact on the connection properties [22]. In our model, by following [22], we assume the small displacements of the UE are negligible.
3.3. Propagation and Antenna Models
To represent losses in the mmWave band, we use the 3GPP “Street-Canyon” Urban Micro (UMi) path loss model [45], which is defined in a linear scale by
where is the carrier frequency measured in GHz, y is the distance measured in meters, for line-of-sight conditions.
The received signal strength can be written as
where is the emitted power, and are the BS and UE antenna gains, is the noise, and is the interference margin.
3.4. Antenna Model
The antenna model is critical for assessing the time-dependent UE performance. Thus, in this paper, we assume there are planar symmetric antenna arrays at both BS and UE.
Specifically, the antenna radiation patterns are first generated by following 3GPP TR 37.977 [46]. Accordingly, the antenna pattern is represented as a superposition of element patterns leading to the array factor in the following form
where
is the phase shift caused by the array placement, and
is the weighting factor, which determines the level of side lobes and the value of electrical down-tilt; are the total number of antenna elements in the horizontal and vertical planes.
A single element of the weighting factor can be computed as
where , ; and are the horizontal and vertical angular shifts; and are the distances between two antenna elements in the horizontal and vertical planes.
An illustration of the pattern for a antenna array is shown in Figure 2. Then, the main antenna lobe is assumed to be symmetric with respect to the antenna boresight axis. The antenna gain model is then provided by
where represents the maximum directivity along the boresight, and and are the directivity functions of the angular deviation from the boresight in horizontal and vertical directions, whereas .
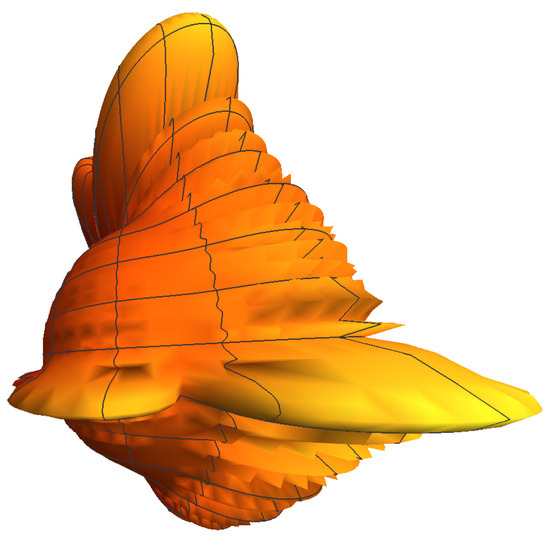
Figure 2.
Antenna radiation pattern example [46].
3.5. Metrics of Interest
In our study, we target three metrics: (i) signal-to-noise ratio (SNR), (ii) spectral efficiency, and (iii) attained rate. These metrics are derived as explicit functions of time by accounting for blockage and micro- and macro-mobilities of UE.
4. Characterizing Spectral Efficiency Dynamics
Observe that the RRM Relaxation algorithm allows UE and BS to skip synchronization cycles, potentially leading to beam misalignment, as well as change in the distance to the BS when UE moves. To characterize this effect, we determine the gains at the BS and UE, time t after the synchronization time instant, and .
4.1. Accounting for UE Macro-Mobility
Recall that we represent user mobility by two independent diffusions over the x- and y-axes confined within the deployment boundaries, . Assume that the BS is located at . By aligning the x-axis with the direction of the user, we observe that the initial coordinates of UE are . The illustration of the considered scenario is shown in Figure 3. Here, are the initial coordinates of the user at time , are the new coordinates at time t, , the angles and show the horizontal and vertical misalignments of the antenna radiation patterns induced by the macro-mobility of the user, and and are the distances to the BS at times and t, respectively.
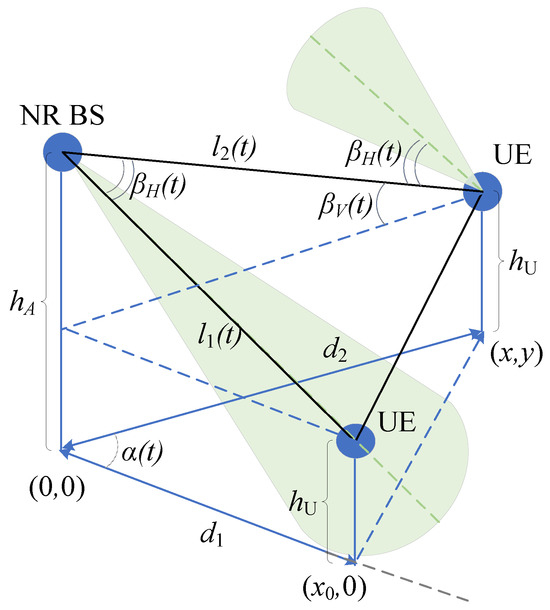
Figure 3.
Illustration of the beam misalignment due to macro-mobility.
To determine and , consider, first, the side view of the scenario; see Figure 4. Recall that statistical properties of a user diffusing in one-dimension and confined within the compartment are described by the Green’s function , representing the probability of finding a diffusing point at x at time t together with the initial conditions and boundary conditions
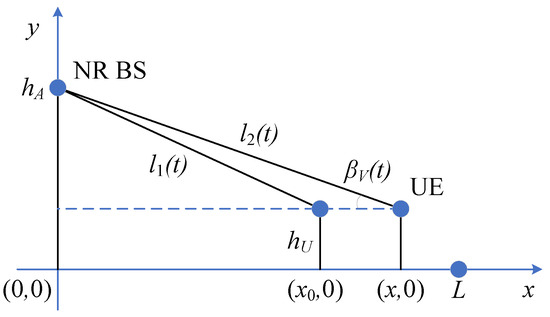
Figure 4.
Side view of the considered scenario.
The solution to the problem is obtained by separation of the variables and reported in different sources [47,48,49]. It can be written in terms of the infinite series as
where is the relaxation time.
The behavior of the density for different values of , t and , is shown in Figure 5. As one may observe, , implying that, eventually, the user is uniformly distributed over L. However, the behavior at shorter timescales heavily depends upon the initial position and on the diffusion constant D.
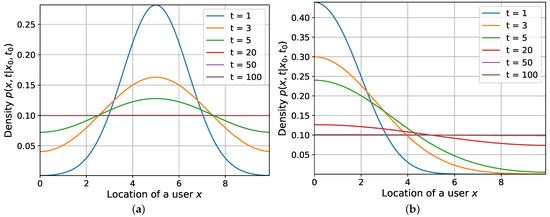
Figure 5.
Density for different , t, . (a) . (b) .
The first raw moment of (13) utilized further can be calculated as
We note that (14) provides the first moment of the location of the diffusing particle (in our interpretation, a moving user) as an explicit function of time. This moment is available from the literature for the mobility model we consider (see, e.g., [50]) and is instrumental for the proposed framework. Specifically, it facilitates further calculation of the time-dependent SNR, rate, and spectral efficiency metrics.
Let be a random variable, representing the location of the user at time t, given that it started at and time . By utilizing the geometry in Figure 4, we see that the distance to the BS, , and the angle, , at time t can be expressed as
implying that the the vertical misalignment angle is
To determine the horizontal angle at time t, consider now the top view of the scenario illustrated in Figure 6. Recall that we set by properly aligning the x-axis; see Figure 3. By denoting the y-axis location of the user by random variable , we see that
implying that the horizontal misalignment angle is
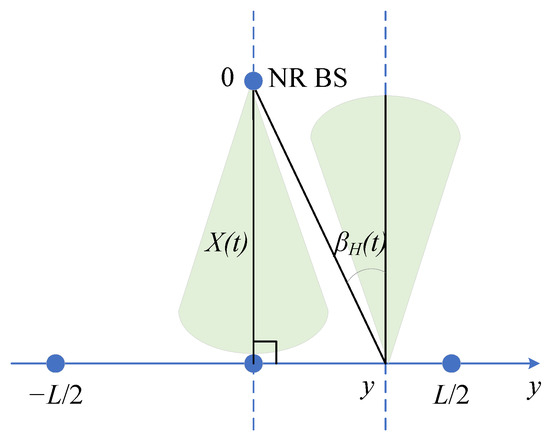
Figure 6.
Top view of the considered scenario.
4.2. Accounting for Micro-Mobility
As we consider UE with two physical antennas located on two opposite sides, the rotations associated with micro-mobility are confined in the range from to . Specifically, once the UE turns to angle from the initial orientation, which is the worst position in terms of the received antenna gain, it either proceeds to rotate in the backward direction or utilizes the other physical antenna. In both cases, the misalignment angle never exceeds the value of .
By following the approach considered in (13), the probability of finding a diffusing point at angle at time t together with the initial conditions and boundary conditions
can be derived as follows:
with the relaxation time , and is the diffusion constant for angular shifts. Please note that this expression is applicable to both horizontal and vertical planes.
4.3. Metrics of Interest
We now proceed characterizing the spectral efficiency at time instant t, i.e., that can be written as
where and are the BS and UE antenna gains at time t (see (11)), and is the path loss at t defined in (5). By substituting (18) and (16) into (11) and (5) further into (22), we arrive at (15), where and are the directivity functions at BS and UE, respectively, that can be found using the antenna radiation patterns at UE and BS and misalignment angles in (17) and (19).
Observe that in (15) is a random variable expressed as a function of several constants, including the initial coordinates of a user and two random variables and . Recall that the probability density function of a random variable Y, , expressed as a function of another random variable X with the pdf , is given by [51]
where is the i-th branch of the inverse.
One may extend (23) to the case of two random variables by replacing with the Jacobian of the transformation, while with the joint density of and can be expressed in multiplicative form due to the assumed independence of diffusions along the x- and y-planes. However, the complexity of the function in (15) prevents one from obtaining a useful expression for . To determine the mean value of , we will consider the Taylor series expansion of the spectral efficiency function around the means of and , . Recall that the second-order decomposition is as follows:
Assuming , we obtain
where the latter is due to independence between and .
5. Numerical Results
In this section, we present our numerical results by explicitly characterizing the metrics of interest as a function of time, different systems, and environmental characteristics. Specifically, we apply the time-dependent mathematical modeling outlined in Section 4 for the system model specified in Section 3. We start investigating the impact of the initial user location with respect to the BS, then proceed with the impact of micro- and macro-mobility parameters, and, finally, discuss the effect of different antenna radiation patterns. As a main performance metric, we utilize spectral efficiency. The default environmental and system parameters are provided in Table 1. When discussing the numerical results provided in different illustrations, we also provide specific parameters in the text.

Table 1.
The default system parameters.
Note that in this study, we consider a 28 GHz carrier frequency. However, the proposed approach is suitable for sub-6 GHz systems as long as they utilize the antenna arrays at the transmit and receive side. The only difference is the lower path loss at sub-6 GHz carrier frequencies.
5.1. The Impact of User Location and Deployment Dimensions
We start by analyzing the impact of the user location on the spectral efficiency of the system presented in Figure 7 for several values of , different duration, initial coordinate , mean displacement due to macro-mobility speed of approximately 0.8 m/s corresponding to the diffusion constant of , mean displacement due to micro-mobility of around 2 °/s corresponding to the diffusion constant of , compartment size m, and BS antenna elements. Note that due to , the initial coordinate characterized the distance between UE and BS.
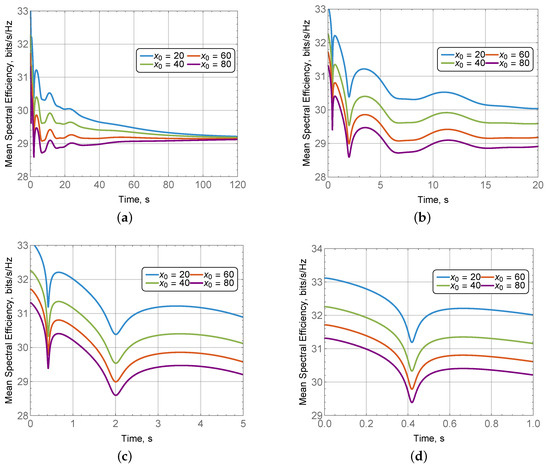
Figure 7.
Spectral efficiency as a function of the user location with respect to the BS. (a) Within 120 s. (b) Within 20 s. (c) Within 5 s. (d) Within 1 s.
By analyzing the presented results, one may observe that the mean time-dependent spectral efficiency does converge to the same values as time increases (see Figure 7a), confirming the correctness of the developed model. This time-averaged value can be obtained using conventional stochastic geometry methods for 5G/6G mmWave/THz system analysis [17]. Specifically, this time-averaged point corresponds to the expected distance from a user randomly moving inside the square of size to the BS. One of the critical observations is that the time-dependent spectral efficiency does not decrease drastically as one may expect. The rationale is two-fold. First of all, the considered dimensions of the compartment size are rather limited (i.e., m). Most importantly though is that the presented spectral efficiency represents the spatially averaged value over the macro- and micro-mobility range. In spite of the considered metric not capturing rapid random fluctuations, it demonstrates that the communications are feasible opportunistically at rather high spectral efficiency, even when UE and BS antennas are not perfectly synchronized at all times.
By taking a look at the fine-grained dynamics of the time-dependent spectral efficiency presented in Figure 7b–d for 20 s, 5 s, and 1 s, respectively, we observe that there are rapid fluctuations in the time-dependent spectral efficiency. These fluctuations are caused by the interplay between micro- and macro-mobilities and utilized antenna radiation patterns. Specifically, by observing Figure 7d, we notice that due to micro-mobility, the spectral efficiency quickly drops and eventually reaches a local minimum. This minimum corresponds to the first local minimum of the radiation pattern. As time goes on, the overall decreasing trend induced by the macro-mobility persists and several other local minima are reached. These conclusions are further illustrated in Figure 8, where we show the mean time-dependent beam misalignment as a function of the micro- and macro-mobility for corresponding mean displacement speeds of 2 °/s and m/s. Here, we see that the impact of micro-mobility is expectedly more dominant as compared to macro-mobility.
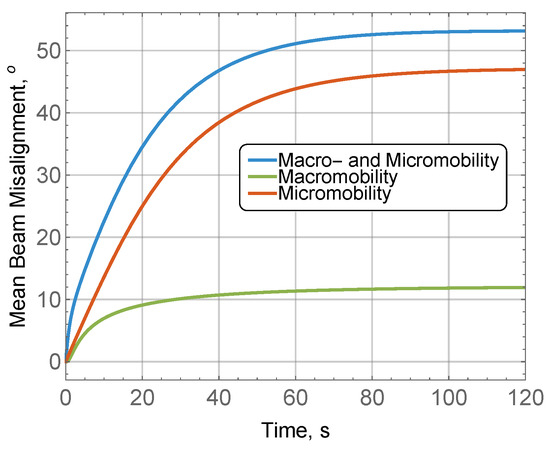
Figure 8.
Beam misalignment as a function of mobility.
Another important parameter is the deployment dimensions that we call compartment size in this work. The impact of this parameter on the time-varying spectral efficiency is demonstrated in Figure 9 for the mean macro-mobility displacement 0.8 m/s, mean displacement due to micro-mobility of around 2 °/s, compartment size of m, and BS antenna . Here, the initial distance from the BS was always chosen to be , and was set to zero. By analyzing the presented data, one may observe that the principal difference between the considered deployment dimensions is in the time- and spatially-averaged value serving as a convergence plateau for the considered metric. The absolute drop between the initial value of spectral efficiency corresponding to the perfect BS and UE antenna alignment and the average value is approximately the same and corresponds to around 3 bit/Hz/s.
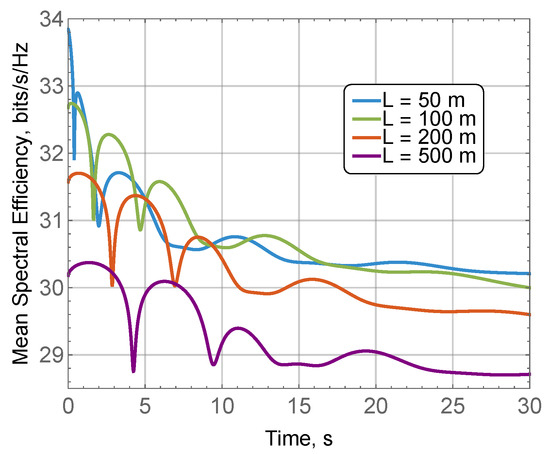
Figure 9.
Spectral efficiency as a function of deployment dimensions (compartment size).
5.2. The Impact of Macro- and Micro-Mobilities
The critical components accounted for in the proposed framework are micro- and macro-mobilities of UE. Specifically, different values of micro-mobility correspond to different typical applications, as demonstrated in [6]. On the other hand, different types of users, e.g., pedestrians, cyclists, and drivers, are characterized by different macro-mobility speeds. We now proceed to evaluate the impact of these two factors on the mean spectral efficiency.
We start with the impact of the micro-mobility on the mean spectral efficiency demonstrated in Figure 10 for different types of applications and initial positions of UE, mean displacement due to a micro-mobility of 2 °/s corresponding to the video application and 4 °/s representing VR application °/s (the corresponding diffusion constants are ), , mean displacement due to a macro-mobility of 0.8 m/s (), compartment size m, and BS antenna size of elements. By analyzing the presented results, we observe that the initial location of UE affects the quantitative values of the time-dependent spectral efficiency only. Additionally, as we also see, there is no principal difference between applications having different micro-mobilities, as curves corresponding to them exhibit nearly similar behavior. The variations for the VR applications are larger though. Thus, we conclude that the presence of micro-mobility induces local fluctuations whose magnitude and rate depend on the interplay between the UE antenna array and micro-mobility speed.
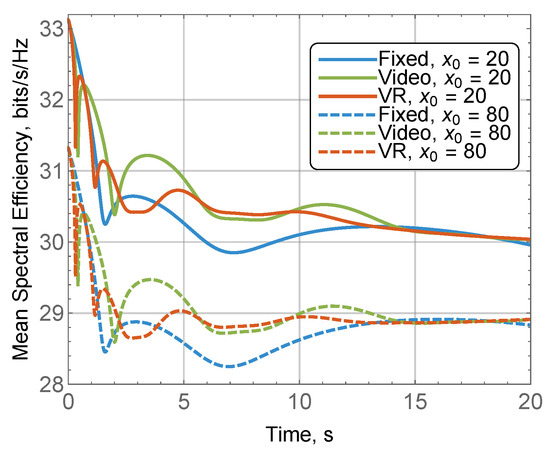
Figure 10.
Spectral efficiency as a function of micro-mobility.
Let us now investigate the impact of macro-mobility shown in Figure 11 for , , mean displacement due to macro-mobility varying between 0.8–2 m/s, mean displacement due to micro-mobility of 2 °/s, compartment size m, and BS antenna array of elements. Specifically, in Figure 11a, we show the time-dependent spectral efficiency, while in Figure 11b—the mean distance to the BS serving as a supporting illustration. By observing the presented results, we see that the impact of macro-mobility mainly manifests itself in different rates to the average spectral efficiency in a given deployment dimension. Specifically, the relatively fast mobility at 2 m/s, corresponding to the diffusion constant of , is characterized by a faster decline in the time-varying spectral efficiency as compared to the low speed of 0.8 m/s, corresponding to a diffusion constant of . This is explained by different mean time-dependent distances to the BS depicted in Figure 11b. For larger deployments, this difference can be substantially higher.
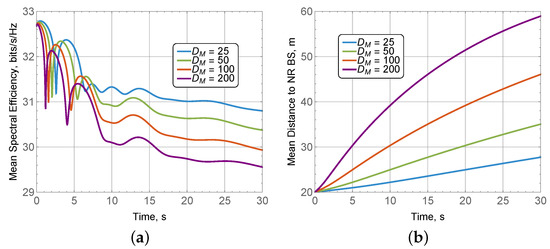
Figure 11.
Spectral efficiency as a function of macro-mobility. (a) Macro-mobility. (b) Mean distance to the BS.
5.3. The Impact of the BS Antenna
As we already highlighted, the time-dependent spectral efficiency is a function of the interplay between macro- and micro-mobility and antenna radiation pattern. We now proceed to investigate the impact of the latter on the considered metric.
Figure 12 shows the time-dependent spectral efficiency as a function of the antenna radiation pattern for three arrays , , and elements, , , user displacement due to macro-mobility speed of approximately 0.8 m/s, mean displacement due to micro-mobility of 2 °/s. By analyzing the demonstrated results, we see that, surprisingly, the BS antennas do not provide a significant impact on the time-dependent spectral efficiency. To understand the rationale for this behavior, we also need an illustration of the time-dependent antenna gain, , for considered BS antenna arrays shown in Figure 13. Here, we see that as time goes on, there is a significant drop in the antenna gain caused by misalignment, reducing it to the averaged values of around 25 dBi at equilibrium. Meanwhile, the drop is rather large compared to the perfectly aligned antennas. However, for the practical dimensions of the 5G/6G mmWave/sub-THz systems’ coverage considered in this paper (up to 200 m), this leads to rather high mean spectral efficiency at the expected distance from the BS. Thus, the additional gain caused by perfect antenna alignment does not contribute significantly to the spectral efficiency due to the use of the slowly increasing logarithmic function. As a result, we see no principal difference between different BS antenna arrays in Figure 12. We specifically note that for simplified antenna models utilized in, e.g., [13] that capture only the antenna gain over the HPBW assuming that there is no side and back lobes, the difference would be much more drastic. Therefore, the use of realistic antenna radiation patterns is critical for an accurate time-dependent spectral efficiency model.
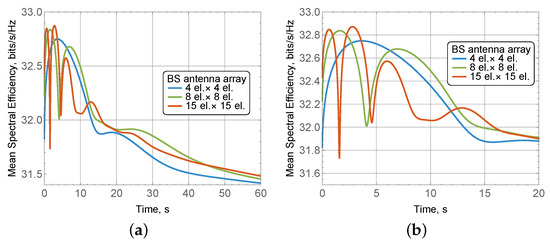
Figure 12.
Spectral efficiency as a function of antenna pattern at the BS. (a) Within 60 s. (b) Within 20 s.
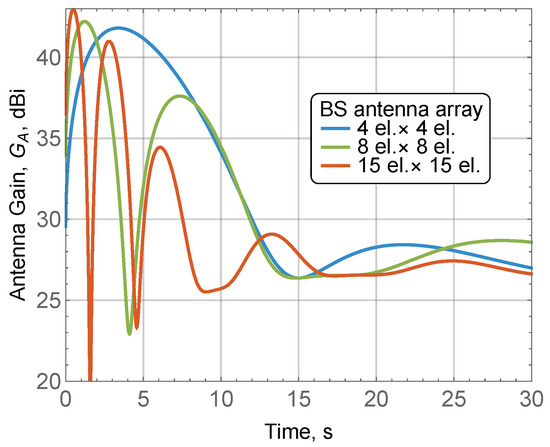
Figure 13.
Time-dependent gain as a function of the antenna type.
We also observe the second effect in Figure 12—antenna arrays having more elements, e.g., 15 × 15, are characterized by higher fluctuations. The rationale is that arrays with higher antenna elements are characterized by more pronounced side and back lobes as well as nulls. We see that it directly translates to the attained spectral efficiency.
6. Conclusions
Motivated by the new RedCap service proposed for 5G NR systems and new UE-side energy conservation mechanisms that allow for skipping synchronization cycles with the BS, in this paper, we developed a framework for the performance assessment of mean SNR, spectral efficiency, and rate attained at a wireless channel under both macro- and micro-mobilities. To this aim, we explicitly accounted for radio pattern parameters by utilizing a 3GPP standardized antenna model and characterized antenna misalignment caused by the simultaneous displacement of user and UE in the hands of a user over time.
Our numerical results indicate that the overall time-dependent trend in the investigated metrics is affected by the interplay between the BS antenna radiation pattern and macro- and micro-mobilities. Specifically, macro-mobility manifests itself in different divergence rates of the time-varying spectral efficiency to its mean value specifying the main trend in the considered metric, while the micro-mobility causes rapid fluctuations at much shorter scales, i.e., 1–3 s after the beam alignment. Quantitatively, the difference between spectral efficiency corresponding to perfectly synchronized UE and BS antennas and time-dependent spectral efficiency in a completely desynchronized system is negligible for small cell coverage and stays within approximately 5–10% for a wide range of system parameters. This implies that, opportunistically, the communications can be performed without perfect synchronization between antennas at a slightly degraded quality. The impact of the BS antenna radiation pattern of the time-dependent spectral efficiency is rather limited, resulting in up to 5% of a difference between and arrays. From the modeling perspective, we would like to note that the use of realistic antenna radiation patterns is critical for accurate analysis.
To the best of the authors’ knowledge, the proposed framework is the first one to allow the explicit evaluation of performance metrics of interest as a function of time. Specifically, it can be utilized in applied studies of 5G/6G mmWave/sub-THz systems when evaluating new algorithms and mechanisms whose performance explicitly depends on time. One of the application areas of the proposed framework is the power efficiency assessment of modern energy conservation mechanisms proposed for 5G NR systems, such as wake-up signal (WuS), Radio Resource Management (RRM) Relaxation, and discontinuous reception (DRX).
Author Contributions
Conceptualization and methodology, Y.G.; software, E.G. and V.B.; validation, K.S. and D.O.; formal analysis, D.O.; investigation, E.G. and E.M.; writing—original draft preparation, D.O.; writing—review and editing, V.B. and Y.G.; visualization, D.O. and E.M.; supervision, Y.G. and D.O.; funding acquisition, D.O. and K.S. All authors have read and agreed to the published version of the manuscript.
Funding
This paper has been supported by the Russian Science Foundation, project no. 23-79-10084.
Data Availability Statement
The data presented in this study are available in this article.
Conflicts of Interest
The authors declare no conflicts of interest.
Abbreviations
The following abbreviations are used in this manuscript:
| AR | Augmented Reality |
| BS | Base Station |
| HPBW | Half-power Beamwidth |
| mmWave | Milimeter Wave |
| NR | New Radio |
| QoS | Quality of Service |
| RDM | Random Direction Model |
| RedCap | Reduced Capability |
| RRM | Radio Resource Management |
| RWP | Random Waypoint |
| SLS | System-level Simulation |
| SNR | Signal-to-noise Ratio |
| SSB | Synchronization Signal Block |
| UE | User Equipment |
| UMi | Urban Micro |
| VR | Virtual Reality |
| XR | Extended Reality |
References
- Holma, H.; Toskala, A.; Nakamura, T. 5G Technology: 3GPP New Radio; John Wiley & Sons: Hoboken, NJ, USA, 2020. [Google Scholar]
- Jiang, W.; Han, B.; Habibi, M.A.; Schotten, H.D. The road towards 6G: A comprehensive survey. IEEE Open J. Commun. Soc. 2021, 2, 334–366. [Google Scholar] [CrossRef]
- Saad, W.; Bennis, M.; Chen, M. A vision of 6G wireless systems: Applications, trends, technologies, and open research problems. IEEE Netw. 2019, 34, 134–142. [Google Scholar] [CrossRef]
- Zhang, J.; Ge, X.; Li, Q.; Guizani, M.; Zhang, Y. 5G millimeter-wave antenna array: Design and challenges. IEEE Wirel. Commun. 2016, 24, 106–112. [Google Scholar] [CrossRef]
- Guo, Y.J.; Ziolkowski, R.W. Advanced Antenna Array Engineering for 6G and Beyond Wireless Communications; John Wiley & Sons: Hoboken, NJ, USA, 2021. [Google Scholar]
- Stepanov, N.; Moltchanov, D.; Begishev, V.; Turlikov, A.; Koucheryavy, Y. Statistical analysis and modeling of user micromobility for THz cellular communications. IEEE Trans. Veh. Technol. 2021, 71, 725–738. [Google Scholar] [CrossRef]
- Moltchanov, D.; Gaidamaka, Y.; Ostrikova, D.; Beschastnyi, V.; Koucheryavy, Y.; Samouylov, K. Ergodic Outage and Capacity of Terahertz Systems Under Micromobility and Blockage Impairments. IEEE Trans. Wirel. Commun. 2022, 21, 3024–3039. [Google Scholar] [CrossRef]
- Kwon, G.; Liu, Z.; Conti, A.; Park, H.; Win, M.Z. Integrated Localization and Communication for Efficient Millimeter Wave Networks. IEEE J. Sel. Areas Commun. 2023, 41, 3925–3941. [Google Scholar] [CrossRef]
- 3GPP TS 38.201 V18.0.0; NR; Physical Layer; General Description (Release 18). Available online: https://portal.3gpp.org/desktopmodules/Specifications/SpecificationDetails.aspx?specificationId=3211 (accessed on 28 March 2024).
- Singh, A.; Petrov, V.; Jornet, J.M. Utilization of Bessel Beams in Wideband Sub Terahertz Communication Systems to Mitigate Beamsplit Effects in the Near-field. In Proceedings of the ICASSP 2023-2023 IEEE International Conference on Acoustics, Speech and Signal Processing (ICASSP), Rhodes Island, Greece, 4–10 June 2023; IEEE: Piscataway, NJ, USA, 2023; pp. 1–5. [Google Scholar]
- Fascista, A.; Deutschmann, B.J.B.; Keskin, M.F.; Wilding, T.; Coluccia, A.; Witrisal, K.; Leitinger, E.; Seco-Granados, G.; Wymeersch, H. Uplink Joint Positioning and Synchronization in Cell-Free Deployments with Radio Stripes. In Proceedings of the 2023 IEEE International Conference on Communications Workshops (ICC Workshops), Dalian, China, 10–12 August 2023; pp. 1330–1336. [Google Scholar] [CrossRef]
- Haenggi, M. Stochastic Geometry for Wireless Networks; Cambridge University Press: Cambridge, UK, 2012. [Google Scholar]
- Petrov, V.; Komarov, M.; Moltchanov, D.; Jornet, J.M.; Koucheryavy, Y. Interference and SINR in millimeter wave and terahertz communication systems with blocking and directional antennas. IEEE Trans. Wirel. Commun. 2017, 16, 1791–1808. [Google Scholar] [CrossRef]
- Kovalchukov, R.; Moltchanov, D.; Samuylov, A.; Ometov, A.; Andreev, S.; Koucheryavy, Y.; Samouylov, K. Evaluating SIR in 3D millimeter-wave deployments: Direct modeling and feasible approximations. IEEE Trans. Wirel. Commun. 2018, 18, 879–896. [Google Scholar] [CrossRef]
- Veedu, S.N.K.; Mozaffari, M.; Höglund, A.; Yavuz, E.A.; Tirronen, T.; Bergman, J.; Wang, Y.P.E. Toward smaller and lower-cost 5G devices with longer battery life: An overview of 3GPP release 17 Redcap. IEEE Commun. Stand. Mag. 2022, 6, 84–90. [Google Scholar] [CrossRef]
- Tayyab, M.; Sofonias, H.; Jarvela, R.; Kolehmanen, N.; Gürsu, H.M. RRM relaxation in connected state for reduced capability (RedCap) NR UEs. In Proceedings of the 2021 17th International Symposium on Wireless Communication Systems (ISWCS), Berlin, Germany, 6–9 September 2021; IEEE: Piscataway, NJ, USA, 2021; pp. 1–6. [Google Scholar]
- Moltchanov, D.; Sopin, E.; Begishev, V.; Samuylov, A.; Koucheryavy, Y.; Samouylov, K. A tutorial on mathematical modeling of 5G/6G millimeter wave and terahertz cellular systems. IEEE Commun. Surv. Tutor. 2022, 24, 1072–1116. [Google Scholar] [CrossRef]
- Shafie, A.; Yang, N.; Durrani, S.; Zhou, X.; Han, C.; Juntti, M. Coverage analysis for 3D terahertz communication systems. IEEE J. Sel. Areas Commun. 2021, 39, 1817–1832. [Google Scholar] [CrossRef]
- Sayehvand, J.; Tabassum, H. Interference and coverage analysis in coexisting RF and dense terahertz wireless networks. IEEE Wirel. Commun. Lett. 2020, 9, 1738–1742. [Google Scholar] [CrossRef]
- Giordani, M.; Polese, M.; Roy, A.; Castor, D.; Zorzi, M. A tutorial on beam management for 3GPP NR at mmWave frequencies. IEEE Commun. Surv. Tutor. 2018, 21, 173–196. [Google Scholar] [CrossRef]
- Liu, J.; Au, K.; Maaref, A.; Luo, J.; Baligh, H.; Tong, H.; Chassaigne, A.; Lorca, J. Initial access, mobility, and user-centric multi-beam operation in 5G new radio. IEEE Commun. Mag. 2018, 56, 35–41. [Google Scholar] [CrossRef]
- Petrov, V.; Moltchanov, D.; Koucheryavy, Y.; Jornet, J.M. Capacity and outage of terahertz communications with user micro-mobility and beam misalignment. IEEE Trans. Veh. Technol. 2020, 69, 6822–6827. [Google Scholar] [CrossRef]
- Ostrikova, D.; Beschastnyi, V.; Moltchanov, D.; Gaidamaka, Y.; Koucheryavy, Y.; Samouylov, K. System-Level Analysis of Energy and Performance Trade-offs in mmWave 5G NR Systems. IEEE Trans. Wirel. Commun. 2023, 22, 7304–7318. [Google Scholar] [CrossRef]
- Beschastnyi, V.; Ostrikova, D.; Moltchanov, D.; Gaidamaka, Y.; Koucheryavy, Y.; Samouylov, K. Balancing latency and energy efficiency in mmWave 5G NR systems with multiconnectivity. IEEE Commun. Lett. 2022, 26, 1952–1956. [Google Scholar] [CrossRef]
- 3GPP TR 38.213 V17.5.0; NR; Physical Layer Procedures for Control. Available online: https://portal.3gpp.org/desktopmodules/Specifications/SpecificationDetails.aspx?specificationId=3215 (accessed on 28 March 2024).
- Li, H.; He, Q.; Zhang, X.; Sun, C. Radio Resource Management Measurement Relaxation on Reduced Capability New Radio Devices. In Proceedings of the 2022 IEEE 4th International Conference on Power, Intelligent Computing and Systems (ICPICS), Shenyang, China, 29–31 July 2022; IEEE: Piscataway, NJ, USA, 2022; pp. 424–428. [Google Scholar]
- Lawler, G.F.; Limic, V. Random Walk: A Modern Introduction; Cambridge University Press: Cambridge, UK, 2010; Volume 123. [Google Scholar]
- Fayad, A.; Cinkler, T.; Rak, J. 5g millimeter wave network optimization: Dual connectivity and power allocation strategy. IEEE Access 2023, 11, 82079–82094. [Google Scholar] [CrossRef]
- Balanis, C.A. Antenna Theory: Analysis and Design; Wiley-Interscience: Hoboken, NJ, USA, 2005. [Google Scholar]
- Chukhno, N.; Chukhno, O.; Moltchanov, D.; Pizzi, S.; Gaydamaka, A.; Samuylov, A.; Molinaro, A.; Koucheryavy, Y.; Iera, A.; Araniti, G. Models, Methods, and Solutions for Multicasting in 5G/6G mmWave and sub-THz Systems. IEEE Commun. Surv. Tutor. 2023, 26, 119–159. [Google Scholar] [CrossRef]
- Bellary, A.; Kandasamy, K.; Rao, P.H. Analysis of Wave Propagation Models with Radio Network Planning using Dual Polarized MIMO Antenna for 5G Base Station Applications. IEEE Access 2022, 10, 29183–29193. [Google Scholar] [CrossRef]
- Dabiri, M.T.; Hasna, M. Pointing Error Modeling of mmWave to THz High-Directional Antenna Arrays. IEEE Wirel. Commun. Lett. 2022, 11, 2435–2439. [Google Scholar] [CrossRef]
- Shariff, B.P.; Ali, T.; Mane, P.R.; Kumar, P. Array Antennas for mmWave Applications: A Comprehensive Review. IEEE Access 2022, 10, 126728–126766. [Google Scholar] [CrossRef]
- Güven, E.; Karabulut-Kurt, G. On the Mutuality between Localization and Channel Modeling in Sub-THz. IEEE Wirel. Commun. 2024, 31, 26–32. [Google Scholar] [CrossRef]
- Su, W.; Lee, S.J.; Gerla, M. Mobility prediction in wireless networks. In Proceedings of the MILCOM 2000 Proceedings, 21st Century Military Communications, Architectures and Technologies for Information Superiority (Cat. No. 00CH37155), Los Angeles, CA, USA, 22–25 October 2000; IEEE: Piscataway, NJ, USA, 2000; Volume 1, pp. 491–495. [Google Scholar]
- Khaki, M.; Ghasemi, A. The impact of mobility model on handover rate in heterogeneous multi-tier wireless networks. Comput. Netw. 2020, 182, 107454. [Google Scholar] [CrossRef]
- Nain, P.; Towsley, D.; Liu, B.; Liu, Z. Properties of random direction models. In Proceedings of the IEEE 24th Annual Joint Conference of the IEEE Computer and Communications Societies, San Francisco, CA, USA, 13–17 March 2005; IEEE: Piscataway, NJ, USA, 2005; Volume 3, pp. 1897–1907. [Google Scholar]
- Barbosa, H.; Barthelemy, M.; Ghoshal, G.; James, C.R.; Lenormand, M.; Louail, T.; Menezes, R.; Ramasco, J.J.; Simini, F.; Tomasini, M. Human mobility: Models and applications. Phys. Rep. 2018, 734, 1–74. [Google Scholar] [CrossRef]
- Orsino, A.; Moltchanov, D.; Gapeyenko, M.; Samuylov, A.; Andreev, S.; Militano, L.; Araniti, G.; Koucheryavy, Y. Direct connection on the move: Characterization of user mobility in cellular-assisted D2D systems. IEEE Veh. Technol. Mag. 2016, 11, 38–48. [Google Scholar] [CrossRef]
- Petrov, V.; Moltchanov, D.; Koucheryavy, Y.; Jornet, J.M. The effect of small-scale mobility on terahertz band communications. In Proceedings of the 5th ACM International Conference on Nanoscale Computing and Communication, Reykjavik, Iceland, 5–7 September 2018; pp. 1–2. [Google Scholar]
- Ichkov, A.; Gehring, I.; Mähönen, P.; Simić, L. Millimeter-wave beam misalignment effects of small-and large-scale user mobility based on urban measurements. In Proceedings of the 5th ACM Workshop on Millimeter-Wave and Terahertz Networks and Sensing Systems, New Orleans, LA, USA, 25–29 October 2021; pp. 13–18. [Google Scholar]
- Stepanov, N.; Turlikov, A.; Begishev, V.; Koucheryavy, Y.; Moltchanov, D. Accuracy assessment of user micromobility models for thz cellular systems. In Proceedings of the 5th ACM Workshop on Millimeter-Wave and Terahertz Networks and Sensing Systems, New Orleans, LA, USA, 25–29 October 2021; pp. 37–42. [Google Scholar]
- Risken, H.; Risken, H. Fokker-Planck Equation; Springer: Berlin/Heidelberg, Germany, 1996. [Google Scholar]
- Singh, R.; Sicker, D. Parameter modeling for small-scale mobility in indoor THz communication. In Proceedings of the 2019 IEEE Global Communications Conference (GLOBECOM), Big Island, HI, USA, 9–13 December 2019; IEEE: Piscataway, NJ, USA, 2019; pp. 1–6. [Google Scholar]
- 3GPP TR 38.901 V14.1.1; Study on Channel Model for Frequencies from 0.5 to 100 GHz (Release 14). Available online: https://portal.3gpp.org/desktopmodules/Specifications/SpecificationDetails.aspx?specificationId=3173 (accessed on 28 March 2024).
- 3GPP TR 37.977 V17.0; Universal Terrestrial Radio Access (UTRA) and Evolved Universal Terrestrial Radio Access (E-UTRA), Verification of Radiated Multi-Antenna Reception Performance of User Equipment (UE). Available online: https://portal.3gpp.org/desktopmodules/Specifications/SpecificationDetails.aspx?specificationId=2637 (accessed on 28 March 2024).
- Ezekoye, O.A. Conduction of heat in solids. In SFPE Handbook of Fire Protection Engineering; Springer: Berlin/Heidelberg, Germany, 2016; pp. 25–52. [Google Scholar]
- Bickel, T. A note on confined diffusion. Phys. A Stat. Mech. Appl. 2007, 377, 24–32. [Google Scholar] [CrossRef]
- Mortensen, K.I.; Flyvbjerg, H.; Pedersen, J.N. Confined Brownian motion tracked with motion blur: Estimating diffusion coefficient and size of confining space. Front. Phys. 2021, 8, 583202. [Google Scholar] [CrossRef]
- Freedman, D. Brownian Motion and Diffusion; Springer Science & Business Media: Berlin/Heidelberg, Germany, 2012. [Google Scholar]
- Ross, S.M. Introduction to Probability Models; Academic Press: Cambridge, MA, USA, 2014. [Google Scholar]
Disclaimer/Publisher’s Note: The statements, opinions and data contained in all publications are solely those of the individual author(s) and contributor(s) and not of MDPI and/or the editor(s). MDPI and/or the editor(s) disclaim responsibility for any injury to people or property resulting from any ideas, methods, instructions or products referred to in the content. |
© 2024 by the authors. Licensee MDPI, Basel, Switzerland. This article is an open access article distributed under the terms and conditions of the Creative Commons Attribution (CC BY) license (https://creativecommons.org/licenses/by/4.0/).